Annual report on forest management 2011–2012
Overview
The Annual Report on Forest Management was prepared by the Ontario Ministry of Natural Resources (MNR) to addresses legal requirements outlined in the Declaration Order (MNR‐71) regarding the MNR’s Class Environmental Assessment Approval for Forest Management on Crown Lands in Ontario. The report is prepared consistent with the principles and intent of the Crown Forest Sustainability Act (CFSA).
This is the seventeenth annual report on forest management, prepared in accordance with the Declaration Order. It covers the period April 1, 2011 to March 31, 2012. It contains, in part, a summary and analysis of 42 management unit annual reports submitted to the MNR in November 2012. Unless otherwise stated, information portrayed in tables and figures in this provincial annual report are sourced from the management unit annual reports.
Data is subject to ongoing improvement and the reader is advised that changes in data may occur as improvements are made to the dataset. New or updated data and information sub‐ mitted since the previous Annual Report on Forest Management are included in this report. Errors or omissions noted since the publication of previous annual reports are also corrected or updated in this report. Minor rounding errors may occur due to the precision of the num‐ bers being displayed.
This annual report provides information on how Ontario’s Crown forests are being managed, as well as baseline information to compare with future forest management activities and annual reports. Crown forest resources within the Area of the Undertaking (AOU) and their associated programs are the main focus for this annual report. MNR programs that deal with private land or provincial parks are not reported in this document.
More information about MNR programs is available on the Forestry page of the Ministry of Natural Resources and Forestry.
Executive summary
Ontario’s Crown forests are managed in a sustainable manner to ensure long-term forest health while providing environmental, economic, and social benefits to Ontarians. The Annual Report on Forest Management 2011-12 provides information on how Ontario’s Crown forests are being managed. The report summarizes forest management activities for the period April 1, 2011 to March 31, 2012. The following is a summary of key forest management activities for 2011-12:
- Weather, drought, and blowdown caused tree mortality in approximately 625,912 hectares of forests. Fire impacted 631,838 hectares and insects and disease caused tree mortality on 391,980 hectares. Main insect pest species were spruce budworm, forest tent caterpillar, and jack pine budworm. Harvesting operations generated 12.6 million cubic metres of wood from approximately 114,110 hectares.
- Access roads were developed during harvest operations and in total 1,221 kilometres of primary, branch, and operational roads were constructed (majority being operational). Road maintenance occurred on 25,036 kilometres, with the majority of the road maintenance activities occurring on primary roads. Access controls were established on 687 kilometres of roads and 586 kilometres were decommissioned.
- Renewal activities were undertaken on previously harvested areas, with 43,648 hectares regenerated by artificial means (tree planting and seeding); 65,392 hectares regenerated naturally, 35,803 hectares site prepared, and 73,710 hectares tended. Regeneration assessment was undertaken on 166,416 hectares and of the total area assessed, 85.9% was declared as having met an acceptable silvicultural standard.
- Compliance monitoring activities occurred on all management units, with 2,552 inspections of forest operations conducted by both the forest industry and the MNR. Only 58 remedy and enforcement actions were taken. The compliance rate was 98.6%.
- Fourteen independent forest audits were conducted. Twelve of the fourteen audit reports concluded that, during the term of the audit, the forests were being managed in general compliance with legislation and policy requirements, licence requirements, and in accordance with the principles of sustainable forest management. The Armstrong and Lake Nipigon Forests were not considered by the audit teams to be sustainably managed and the Lake Nipigon Forest licence was not recommended for extension.
- Most management units continued to maintain forest certification certificates across the province. Five forests were certified for the first time. Six forest certification certificates lapsed, mainly due to bankruptcies of the Sustainable Forest Licence (SFL) companies.
- Aboriginal communities continued to be engaged and involved in both forest management activities and economic development activities across the province. The report outlines accomplishments in regards to Aboriginal access to resources, silviculture opportunities, training, employment, and involvement in forest management planning.
Quick facts — 2011-12
- Natural Disturbance Area: 1.6 million ha
- Forest Harvest Area: 114,110 ha
- Forest Harvest Volume: 12.6 million m3
- Forest Renewal Natural: 65,392 ha
- Forest Renewal Artificial: 43,648 ha
- Other Renewal Activities: 109,513 ha
- Renewal Spending: $57.1 million
- Renewal Contributions: $62.6 million
- Renewal Assessment Area: 166,416 ha
- Industry Manufacturing Value $4.2 billion
- Crown Charge Payments by Industry $95.3 million
- Industry Employees: 35,649
- Forest Roads Funding: $58.8 million
- Forest Roads Constructed: 1,221 km
- Forest Roads Maintained: 25,036 km
- Total Compliance Inspections: 2,552
- Compliant Reports: 2,516
- Audits Performed: 14
- Audit Recommendations: 157
- Forests Certified: 28
Ontario’s forests
Summary of Land Classes in Ontario – 2011-12
- Ontario is 107.6 million hectares in size;
- 87% of Ontario is publicly owned (93.2 million ha);
- 66% of the province is forest (71.1 million ha);
- 52% is productive forest (56.1 million ha)
- 6% of the productive forest is within existing and proposed parks and protected areas
- Forest management on Crown land is practised in the Area of the Undertaking (AOU), a 43.8 million hectare area that stretches across Ontario from Kemptville to Red Lake.
Land Classes are summarized below and further detail can be found in the Forest Resources of Ontario 2011 report.
Total area by Land Class in Ontario
- Productive forest: 52%
- Forested wetland: 14%
- Water: 18%
- Wetland: 9%
- Field and agriculture: 5%
- Other: 2%
| Land Class | Total Provincial Area (hectares) Crown | Total Provincial Area (hectares) Parks and Protected Areas | Total Provincial Area (hectares) Other | Total Provincial Area (hectares) |
|---|---|---|---|---|
| Water | 17,028,847 | 1,819,446 | 594,998 | 19,443,291 |
| Wetland | 8,170,336 | 1,082,148 | 245,512 | 9,497,997 |
| Field/Agriculture | 32,564 | 6,901 | 5,362,145 | 5,401,611 |
| Other non-forest | 816,335 | 414,077 | 995,339 | 2,225,750 |
| Treed wetland | 12,744,149 | 1,142,442 | 1,086,587 | 14,973,177 |
| Productive forest | 44,683,015 | 5,276,719 | 6,134,858 | 56,094,592 |
| Total | 83,475,246 | 9,741,734 | 14,419,438 | 107,636,418 |
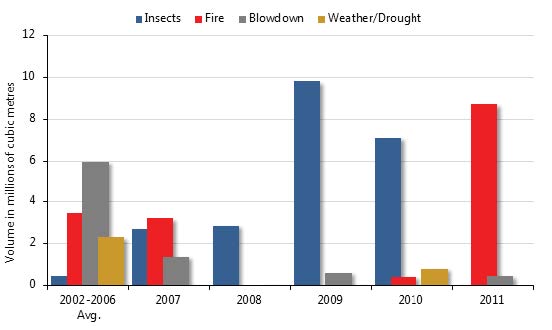
Natural disturbances
Summary of natural disturbance – 2011-12
- Forest losses due to drought and blowdown were significant, with 9,083 hectares of blowdown scaƩered across the province and 616,372 hectares of drought;
- Forest fire activity was much higher than previous years at 631,838 hectares, primarily in the Far North. The Trout Lake Forest had the majority of fires on managed forests;
- Forest insects caused significant mortality and growth loss. Spruce budworm typically affects large forest areas and causes the most mortality of any forest insect. Spruce budworm defoliation (245,402 ha) occurred primarily in North Bay and Sudbury districts; and
- Forest tent caterpillar (66,938 ha), jack pine budworm (29,340 ha), and several other insects (45,274 ha) all had minor outbreaks across the province causing defoliation.
For a more detailed summary of forest health conditions in Ontario please refer to the Forest Health Conditions in Ontario Report 2011.
Details on forest fire conditions in Ontario are available on the Forest fires – safety information page.
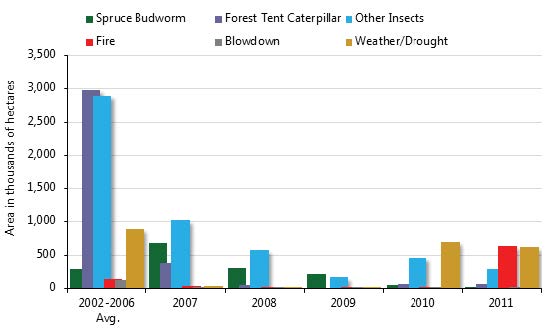
| Disturbance | Ontario Area | Managed Crown Forest (AOU) Area (ha) | Managed Crown Forest (AOU) Mortality volume |
|---|---|---|---|
| Jack Pine Budworm | 29,340 | (N/A) | (N/A) |
| Spruce Budworm | 245,402 | 1,604 | 46,916 |
| Blowdown | 9,083 | 4,419 | 444,488 |
| Drought | 616,372 | (N/A) | (N/A) |
| Fire | 631,838 | 57,838 | 8,747,615 |
| Weather Damage | 457 | (N/A) | (N/A) |
| Aspen Decline | 3,488 | 211 | 8,624 |
| Other Diseases | 1,536 | (N/A) | (N/A) |
| Forest Tent Caterpillar | 66,938 | (N/A) | (N/A) |
| Other Insects | 31,191 | (N/A) | (N/A) |
| Poplar/birth complex | 14,083 | (N/A) | (N/A) |
| Total | 1,649,730 | 64,071 | 9,247,643 |
We are committed to providing accessible customer service. If you need any of the above graphics in an alternate format, please contact the Natural Resources Information and Support Centre or call toll-free:
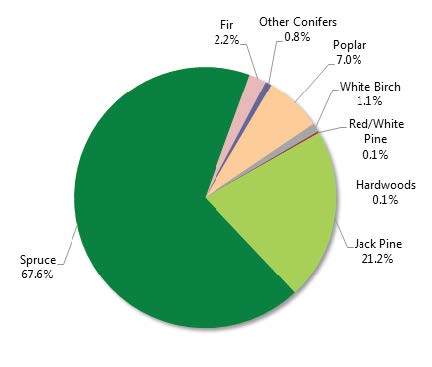
Volumes lost to natural disturbances by species - Crown AOU 2011-12
- Spruce: 67.6%
- Fir: 2.2%
- Other Conifers: 0.8%
- Poplar: 7.0%
- White Birch: 1.1%
- Red/White Pine: 0.1%
- Hardwoods: 0.1%
- Jack Pine: 21.2%
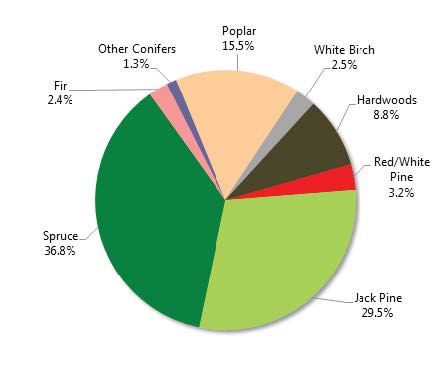
Volumes harvested by species - Crown AOU 2011-12
- Spruce: 36.8%
- Fir: 2.4%
- Other Conifers: 1.3%
- Poplar: 15.5%
- White Birch: 2.5%
- Hardwoods: 8.8%
- Red/White Pine: 3.2%
- Jack Pine: 29.5%
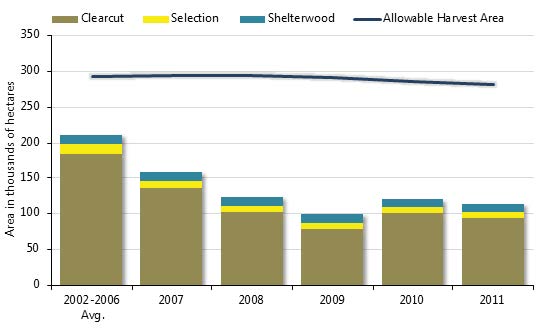
Forest harvest area
Summary of harvest area – 2011-12
- Forest product markets continued to recover, however harvest area still remained below historic levels.
- Total area harvested on Crown land was 114,110 hectares:
- 94,041 hectares (83%) were harvested under the clearcut silvicultural system;
- 10,719 hectares (9%) were harvested under the shelterwood silvicultural system;
- 9,351 hectares (8%) were harvested under the selection silvicultural system;
- Harvest levels in 2011-12 were 40% of the allowable harvest area prescribed in approved forest management plans; and
- Natural disturbances as reported in the previous section account for significantly more area annually than harvested provincially.
For detailed information on harvesting and harvest systems: http://www.mnr.gov.on.ca/en/Business/Forests/2ColumnSubPage/STEL02_166048.html [Inactive link]
Summary of clearcut size – 2011-12
Management unit annual reports were analyzed to determine size and frequency of areas harvested under the clearcut silviculture system in 2011-12:
Boreal Forest Landscape Guide Region
- A total of 1,235 active clearcut harvest areas occurred in the Boreal Forest Landscape Guide Region. Of these clearcuts, 1,184 (96%) were less than 260 hectares in size. The average clearcut size was 65 hectares and the maximum clearcut was 1,516 hectares.
Great Lakes-St. Lawrence Forest Landscape Guide Region
- A total of 356 active clearcut harvest areas occurred in the Great Lakes- Lawrence Forest Landscape Guide Region. Of these clearcuts, 351 (99%) were less than 260 hectares in size. The average clearcut size was 40 hectares and the maximum clearcut was 484 hectares.
Management Unit Annual Reports are available online at the MNR’s electronic Forest Management Planning Website. Additional details regarding clearcut size under the clearcut silvicultural system can be found in these reports. In 2011-12, reporting of clearcut size was moved from Rowe’s forest regions to landscape guide regions, consistent with the landscape approach to forest management planning.
We are committed to providing accessible customer service. If you need the above graphic in an alternate format, please contact the Natural Resources Information and Support Centre or call toll-free:
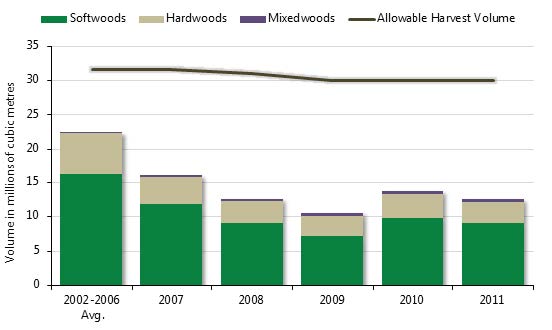
Forest harvest volume
Summary of harvest volume – 2011-12
- Market conditions and a downturn in the forest industry have contributed to significantly less harvest volume over the last five years;
- 12.6 million cubic metres of wood was harvested on Crown land with the majority being softwood (conifer) volume; and
- The total volume harvested is slightly higher than the total mortality volume (9.2 million cubic metres in the AOU) caused by insects, severe weather, and fire combined.
See more information on how harvest volumes are measured and tracked.
Volume harvested by species - 2011-12
Tree species: Volume (cubic metres)
- Softwoods
- White Pine: 248,483
- Red Pine: 152,508
- Jack Pine: 3,714,773
- Spruce: 4,627,794
- Balsam Fir: 305,433
- Other Softwood: 51,802
- Total Softwoods: 9,100,793
- Hardwoods
- Poplar: 1,952,440
- White Birch: 314,494
- Maple: 578,206
- Oak: 33,708
- Yellow Birch: 79,808
- Other Hardwood: 51,606
- Total Hardwoods: 3,010,263
- Mixedwood: 463,618
- Total: 12,574,674
Volume harvested by product - 2011-12
Product type: volume (cubic metres)
- Biomass Cogeneration: 463,648
- Composite: 1,158,082
- Fuelwood: 182,913
- Other: 60,747
- Paper: 937,721
- Pulp: 4,046,008
- Sawmill: 5,594,923
- Veneer: 130,633
- Total: 12,574,674
We are committed to providing accessible customer service. If you need the above graphic in an alternate format, please contact the Natural Resources Information and Support Centre or call toll-free:
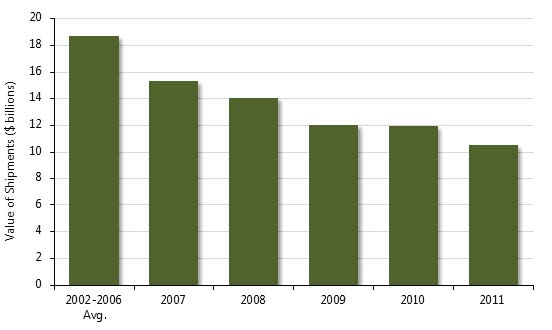
Forest industry
Summary of Ontario’s forest industry – 2011-12
- Ontario’s forests supply the basic resources for a variety of products including lumber, structural board, pulp, paper, and newsprint. They are also increasingly being used for producing new products, such as bio-fuel and dissolving pulp for textiles such as rayon;
- Ontario’s forest industry continues to be impacted by reduced demand and the high value of the Canadian dollar which increases the cost base in U.S. dollar terms for Canadian companies. Revenue from sales from Ontario’s forest product sector maintained similar levels as the previous year, reaching almost $11 billion;
- In 2011-12, value-added manufacturing, excluding logging, continued at similar levels as 2010 at $4.2 billion;
- Wood product and pulp and paper manufacturing industries had capital and repair expenditures of $781.4 million, down slightly from 2010-11 expenditures of $802 million. Forestry and logging enterprises’ capital and repair expenditures added an additional $66.0 million for a total investment of $847.4 million for the forest sector;
- Statistics Canada’s Annual Survey of Manufacturers estimated employment in the broader forest industry was 141,000 jobs in 2011 (estimates include direct, indirect, and induced employment);
- The primary forest industry continued to experience a large number of layoffs and mill closures. There were 2,343 mill employees who lost their jobs on either a permanent or indefinite basis; and
- Crown charge payments by the forest industry totaled $95.3 million. Minimum stumpage charges ranged from $1.07-$4.60 per cubic metre.
Number of active licences in 2011-12 by licence type
Licence type: total
- Sustainable Forest Licence (SFL): 35
- Forest Resource Licence (commercial): 641
- Forest Resource Licence (personal): 3,045
- Total: 3,721
We are committed to providing accessible customer service. If you need the above graphic in an alternate format, please contact the Natural Resources Information and Support Centre or call toll-free:
| Sector | Wood Product Mfg. | Paper Mfg. | Total |
|---|---|---|---|
| Number of Establishments | 1,608 | 417 | 2,025 |
| % of Canadian Total | 28% | 46% | n/a |
| Number of Employees | 15,979 | 19,670 | 35,649 |
| % of Canadian Total | 18% | 34% | n/a |
| Value Added (million $) | $1,245 | $2,982 | $4,227 |
| % of Canadian Total | 16% | 31% | n/a |
Source: Statistics Canada
Employment figures from the Annual Survey of Manufacturers
Crown charge payments by the forest industry - 2011-12
Stumpage categories: Payments (million $)
- Consolidated Revenue Fund: $32.0
- Forestry Futures Trust: $17.6
- Forest Renewal Trust: $45.2
- Forest Renewal SPA: $0.6
- Total Payments: $95.3
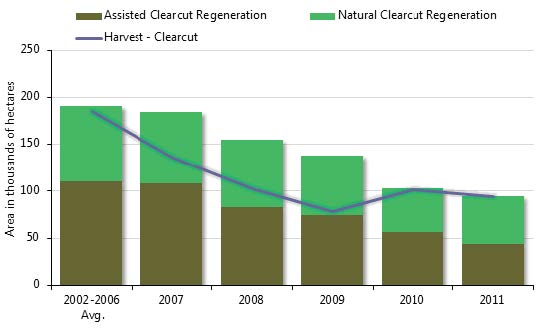
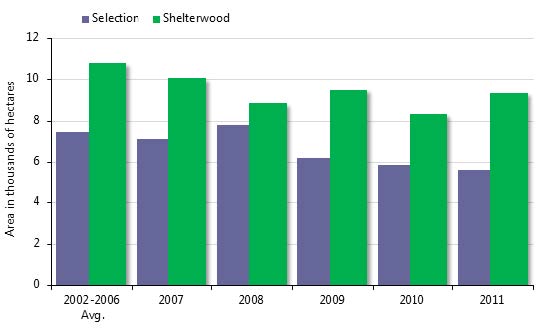
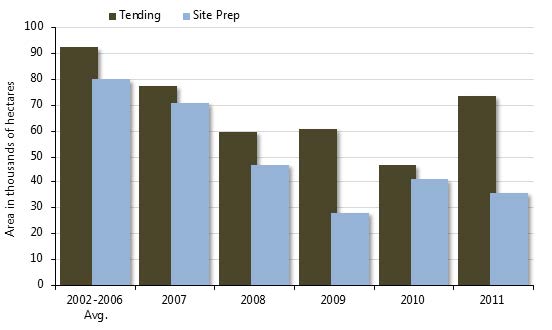
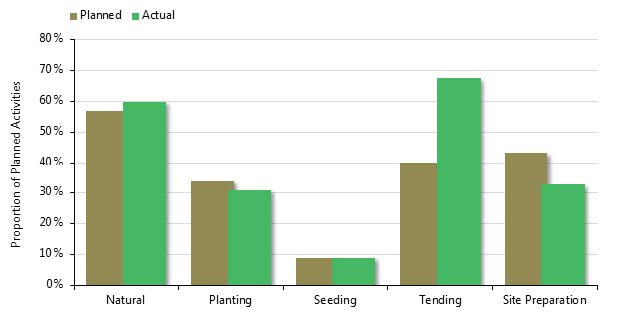
Forest renewal
Summary of forest renewal, tending and protection activities – 2011-12
- Reduced harvest levels in previous years, resulted in a reduction in planting, seeding, site preparation, and chemical tending in 2011-12;
- Tree planting was the main method of assisted regeneration with nearly 50 million trees planted. Natural regeneration was the preferred option to renew areas affected by natural disturbances (e.g. fire, insect, weather events);
- Planned levels were based on projected activities in the approved forest management plan (FMP) for each forest. Actual harvest occurred on 40% of the FMP planned harvest area and actual regeneration activities occurred on 41% of the FMP planned harvest area;
- Natural regeneration occurred on 54% of all clearcut harvest sites;
- Shelterwood harvest increased slightly from past years and selection silviculture system use remained at a consistent level;
- Mechanical site preparation decreased slightly in 2011-12 from the previous year, while tending activities increased significantly; and
- No protection aerial spray programs were conducted during the year.
Summary of forest renewal funding – 2011-12
- Trust fund revenues increased as a result of increased harvesting. Silvicultural expenditures from the Forest Renewal Trust Fund decreased from 2010-11, which reflects the reduced harvest level in preceding years.
See the forest renewal page for more information.
| Source | Expenditure (million $) | Contribution (million $) |
|---|---|---|
| Forest Renewal Trust Fund | 43.7 | 45.2 |
| Forestry Futures Trust Fund | 13.4 | 17.6 |
| Total | 57.1 | 62.8 |
We are committed to providing accessible customer service. If you need the above graphic in an alternate format, please contact the Natural Resources Information and Support Centre or call toll-free:
Provincial renewal operations - 2011-12
Renewal operation - natural regeneration: hectares
- Clearcut Silvicultural System - Block Cut: 39,417
- Clearcut Silvicultural System - Harvesting with Regeneration Protection/Careful Logging Around Advanced Growth: 10,525
- Clearcut Silvicultural System - Strip cut: n/a
- Clearcut Silvicultural System - Seed Tree Cut: 550
- Shelterwood System: 5,550
- Selection System (uneven-aged): 9,351
- Natural Regeneration Subtotal: 65,392
Renewal operation - assisted regeneration: hectares
- Planting: 33,861
- Trees (000's planted): 49,854
- Seeding - Direct: 9,518
- Seeding - with site preparation: n/a
- Seeding - Scarification: 269
- Subtotal: 43,648
- Total regeneration: 109,041
Provincial site preparation/tending 2011-12
Mechanical operations: hectares
- Site preparation
- Mechanical: 29,624
- Chemical: 5,752
- Prescribed Burn: 427
- Total Site Preparation: 35,803
- Tending
- Tending - cleaning
- Manual: 575
- Chemical-ground: 3,033
- Chemical-aerial: 61,049
- Mechanical: n/a
- Subtotal: 64,657
- Tending – improvement
- Even-aged: 5,884
- Uneven-aged: 3,169
- Subtotal: 9,053
- Total tending: 73,710
- Tending - cleaning
- Protection
- Manual/pest control: n/a
We are committed to providing accessible customer service. If you need the above graphics in an alternate format, please contact the Natural Resources Information and Support Centre or call toll-free:
Forest Renewal Assessment
Summary of Silvicultural Effectiveness Monitoring – 2011-12
- Regeneration success assessments are a requirement of the renewal process. The assessment refers to Free-To-Grow (FTG) as an indication that the regeneration effort has been declared a success;
- FTG area assessed in 2011-12 was slightly lower than the long-term average;
- Regeneration success was higher (85.9%) than the preceding five-year average;
- Silviculture success was lower than the five-year average. Some of the assessed areas not achieving FTG status could be re-treated in the future to achieve silvicultural success;
- Across management units, a decrease in regeneration success assessment was observed; and
- Planned area for assessment (as per approved FMP) was 265,747 hectares. The actual area assessed for 2011-12 was 166,416.
See more information on forest renewal assessment.

We are committed to providing accessible customer service. If you need the above graphic in an alternate format, please contact the Natural Resources Information and Support Centre or call toll-free:
Area assessed for regeneration success - 2011-12
FTG measure: hectares
- Total area assessed: 166,416
- FTG Projected FU (Silvicultural Success): 82,707
- FTG Accepted (Regeneration Success): 60,217
- FTG Total: 142,924
- % Silvicultural Success: 49.7%
- % Regeneration (including silvicultural success): 85.9%
Percentages for regeneration and silviculture success are compared to total area assessed for that year. On a province-wide basis, the percentage of assessed area that was declared FTG to a prescribed standard is referred to as a silvicultural success
. The percentage of areas that are approved to an acceptable alternative standard is referred to as a regeneration success
.
Forest access roads
Summary of roads funding programs – 2011-12
- Forest Access Capital Roads Program spending $2.8 million;
- Spending on resource access roads was $441,429 and Ministry of Northern Development and Mines (MNDM) roads expenditures was $2,623,648;
- MNR entered into road construction and maintenance agreements with SFL and FRL holders on 42 management units (including the Algonquin Forest Authority); and
- MNR’s provincial roads program incurred costs of over $58 million on the construction, re-construction, maintenance, and monitoring of primary and branch roads, and the construction/repair/replacement of stream crossings. In addition, the forest industry incurred 100% of the costs of constructing and maintaining all operational roads on Crown lands.
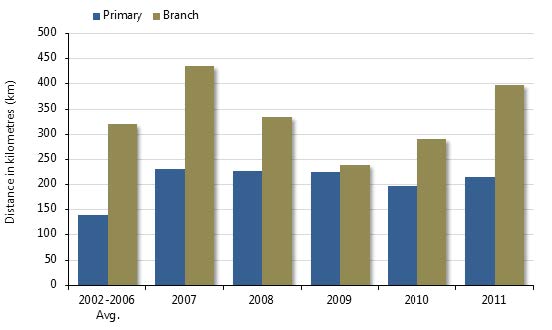
Summary of road construction and maintenance – 2011-12
- 1,221 km of primary, branch, and operational roads were constructed. The majority of the roads constructed during 2011-12 were operational roads;
- 25,035 km of roads were maintained, with the majority of the road maintenance activities occurring on primary roads;
- 687 km of primary, branch, and operational roads had access controls established; and
- 586 km of primary, branch, and operational roads were decommissioned by physical or natural means.
See the forest access roads page for more information.
We are committed to providing accessible customer service. If you need the above graphic in an alternate format, please contact the Natural Resources Information and Support Centre or call toll-free:
| Category | Amount | Construction (km) | Maintenance (km) |
|---|---|---|---|
| Primary Roads | $50,676,243 | 213.3 | 12,885.1 |
| Branch Roads | $7,656,616 | 397.3 | 3,767.8 |
| Operational | n/a | 610.5 | 8,382.6 |
| Total | $58,332,859 | 1,221.0 | 25,035.5 |
| MNR admin costs | $476,141 | n/a | n/a |
| Total funds spent | $58,809,000 | n/a | n/a |
Independent forest audits
Summary of independent forest audits – 2011-12
- Independent Forest Audits (IFAs) are a requirement of the CFSA, a condition of MNR’s Class Environmental Assessment Approval for Forest Management on Crown Lands in Ontario and a licence requirement for all SFLs. All management units are audited at least once every five to seven years, to review operations and examine forest management activities carried out since the previous audit;
- IFAs were completed on 14 management units in 2011;
- The results of the 2011 IFAs were generally positive. Twelve of the fourteen audit reports concluded that, during the term of the audit, the forests were managed in compliance with legislation and policy requirements, licence requirements, and with the principles of sustainable forest management;
- The Armstrong and Lake Nipigon Forests were not deemed to be in compliance with legislation and policy requirements and were not considered to be sustainably managed. The Lake Nipigon Forest licence was not recommended for extension;
- The Magpie Forest was deemed in compliance with legislation and policy requirements (with conditions). The Magpie Forest licence was recommended for extension provided certain conditions were met;
- The Black River and Pic River-Ojibway Forests were deemed in compliance with legislation and policy requirements, however were not recommended for extension due to the SFL holders having entered into receivership;
- The Lac Seul Forest was surrendered by the SFL holder to the Crown, and therefore, no licence extension recommendation was made. Temagami Forest is managed by the Crown therefore no licence extension is required; and
- Licence extension was recommended for the remaining seven forests audited during 2011-12.
See the independent forest audits page for more information.
Summary of independent forest audits – 2011-12
Audit recommendations 2011-12
The audit reports provided a total of 157 recommendations. A summary of recommendations and best practices by audit principle is provided below. The majority of the recommendations were related to forest management planning (31%), followed by monitoring (22%) and plan implementation and assessment (21%). Specific details on audit recommendations can be accessed on MNR’s website.
Public participation
- Consultation efforts with Aboriginal peoples (First Nations and Métis) and their involvement in forest management planning and opportunities for benefits to their communities could be improved.
Forest management planning and implementation
- Effectiveness of certain forest management plan model inputs, projections and indicators in assessing long-term forest sustainability could be improved;
- Planned harvest levels need to more closely forecast actual harvest activities;
- Renewal activities on mixedwood sites following conifer only harvest operations could be enhanced; and
- Use of Section 18 of the Endangered Species Act should be investigated to allow forest management plans to qualify as instruments of the Act.
Monitoring
- Silviculture Effectiveness Monitoring programs could be improved; and
- Tracking and monitoring systems for compliance and sharing of information could be enhanced.
Audit best practices - 2011-12
- A GIS application to aid compliance monitoring activities;
- Electronic ledger system for tracking operations and compliance activities;
- Planning and implementation of a prescribed burn in the Boreal forest; and
- A post-harvest assessment program to identify appropriate micro-site prescriptions for conifer renewal.
| Management Unit | In Compliance | Sustainably Managed | SFL Extension Recommended |
|---|---|---|---|
| Algoma Forest | Yes | Yes | Yes |
| Armstrong Forest | No | No | n/a |
| Bancroft-Minden Forest | Yes | Yes | Yes |
| Black River Forest | Yes | Yes | No-Receivership |
| Black Sturgeon Forest | Yes | Yes | Yes |
| French-Severn Forest | Yes | Yes | Yes |
| Lac Seul Forest | Yes | Yes | Licence Surrendered |
| Lake Nipigon Forest | No | No | No |
| Magpie Forest* | Yes | Yes | Yes |
| Nipissing Forest | Yes | Yes | Yes |
| Pic River Ojibway Forest | Yes | Yes | No-Receivership |
| Spruce River Forest | Yes | Yes | Yes |
| Sudbury Forest | Yes | Yes | Yes |
| Temagami Forest | Yes | Yes | n/a |
*The audit team concluded that, with a critical exception the forest had been managed generally in compliance with legislative and policy requirements and sustainably; they recommend licence extension provided certain conditions were resolved.
| Management Unit | Management Entity | Independent Auditor |
|---|---|---|
| Algoma Forest | Clergue Forest Management Inc. | ArborVitae Environmental Services Ltd. |
| Armstrong Forest | Crown | Arbex Forest Resource Consultants Ltd. |
| Bancroft-Minden Forest | Bancroft-Minden Forest Company | Craig Howard & Associates |
| Black River Forest | Great West Timber Ltd. | Arbex Forest Resource Consultants Ltd. |
| Black Sturgeon Forest | AbiBow Canada Inc. | ArborVitae Environmental Services Ltd. |
| French-Severn Forest | Westwind Forest Management Inc. | KBM Forestry Consultants Inc. |
| Lac Seul Forest | McKenzie Forest Products Ltd. | John Cary & Associates |
| Lake Nipigon Forest | Lake Nipigon Forest Management Inc. | Arbex Forest Resource Consultants Ltd. |
| Magpie Forest | Dubreuil Forest Products Limited | KBM Forestry Consultants Inc. |
| Nipissing Forest | Nipissing Forest Resource Management | Craig Howard & Associates |
| Pic River Ojibway Forest | Great West Timber Ltd. | Arbex Forest Resource Consultants Ltd. |
| Spruce River Forest | AbiBow Canada Inc. | ArborVitae Environmental Services Ltd. |
| Sudbury Forest | Vermilion Forest Management | Arbex Forest Resource Consultants Ltd. |
| Temagami Forest | Crown | KBM Forestry Consultants Inc. |
| Recommendations by Audit Principle | Algoma Management Unit | Armstrong Management Unit | Bancroft-Minden Management Unit | Black River Management Unit | Black Sturgeon Management Unit | French-Severn Management Unit | Lac Seul Management Unit | Lake nipigon Management Unit | Magpie Management Unit | Nipissing Management Unit | Pic River Management Unit | Spruce River Management Unit | Sudbury Management Unit | Temagami Management Unit | Total |
|---|---|---|---|---|---|---|---|---|---|---|---|---|---|---|---|
| Commitment | 0 | 1 | 0 | 1 | 1 | 0 | 0 | 1 | 0 | 0 | 0 | 1 | 1 | 0 | 6 |
| Public Participation | 2 | 0 | 0 | 0 | 2 | 2 | 0 | 0 | 0 | 1 | 0 | 2 | 0 | 1 | 10 |
| Forest Management Planning | 5 | 4 | 5 | 0 | 7 | 2 | 3 | 4 | 4 | 5 | 1 | 8 | 1 | 1 | 50 |
| Plan Implementation | 4 | 3 | 3 | 1 | 3 | 0 | 6 | 1 | 2 | 3 | 1 | 2 | 1 | 3 | 33 |
| System Support | 0 | 0 | 0 | 0 | 0 | 0 | 0 | 1 | 0 | 0 | 0 | 0 | 0 | 0 | 1 |
| Monitoring | 3 | 3 | 2 | 3 | 2 | 0 | 0 | 4 | 3 | 5 | 4 | 1 | 4 | 1 | 35 |
| Management Objectives and Forest Sustainability | 0 | 1 | 0 | 0 | 0 | 1 | 0 | 0 | 1 | 0 | 0 | 0 | 0 | 0 | 3 |
| Contractual Obligations | 2 | 2 | 0 | 1 | 3 | 3 | 0 | 3 | 1 | 0 | 2 | 1 | 1 | 0 | 19 |
| Total | 16 | 14 | 10 | 6 | 18 | 8 | 9 | 14 | 11 | 14 | 8 | 15 | 8 | 6 | 157 |
Forest compliance
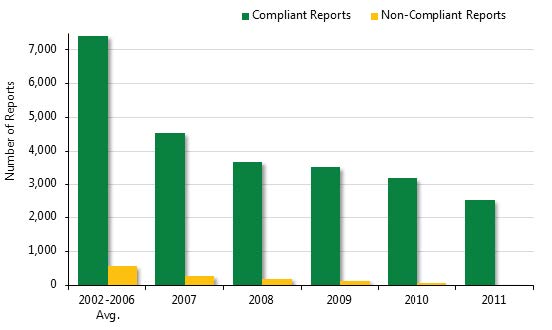
Summary of forest operations compliance – 2011-12
The Forest Operations Information Program (FOIP) stores information collected through forest compliance monitoring for analysis and reporting to the MNR, the forest industry and the public.
- The average compliance rate across all operations (access, harvest, renewal, and maintenance) for both industry and MNR was 99%;
- 227 certified forest operations compliance inspectors submiƩed 2,552 inspections to FOIP during 2011-12, a reduction in reports of 21% from 2010-11;
- Reduced harvest, access, renewal, and maintenance activities due to the downturn in the forest industry are responsible for the reduced number of compliance inspections relative to previous years;
- The ratio of inspections undertaken by the industry and the MNR was relatively consistent with previous years; and
- A total of 58 remedy and enforcement actions were taken, 13 of which resulted in penalties and fines totaling $40,270.
We are committed to providing accessible customer service. If you need the above graphic in an alternate format, please contact the Natural Resources Information and Support Centre or call toll-free:
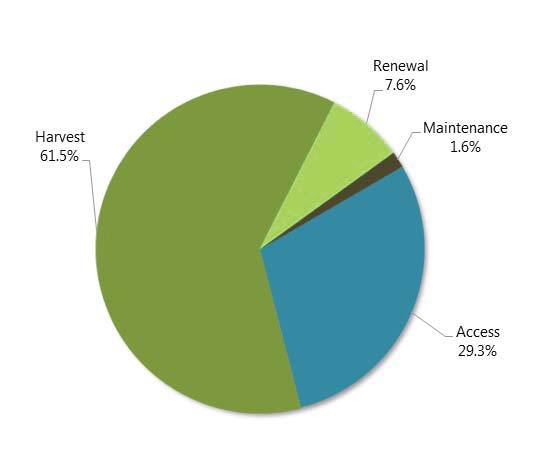
Inspection reports by operation type (percentage of reports)
- Harvest: 61.5%
- Renewal: 7.6%
- Maintenance: 1.6%
- Access: 29.3%
| Operation | Reports | Industry | MNR |
|---|---|---|---|
| Access | Compliant Reports | 579 | 162 |
| Access | Non-Compliant Reports | 5 | 2 |
| Access | Total | 584 | 164 |
| Harvest | Compliant Reports | 1,142 | 401 |
| Harvest | Non-Compliant Reports | 14 | 13 |
| Harvest | Total | 1,156 | 414 |
| Renewal | Compliant Reports | 143 | 48 |
| Renewal | Non-Compliant Reports | 2 | 0 |
| Renewal | Total | 145 | 48 |
| Maintenance | Compliant Reports | 35 | 6 |
| Maintenance | Non-Compliant Reports | 0 | 0 |
| Maintenance | Total | 35 | 6 |
| All | Compliant Reports | 1,899 | 617 |
| All | Non-Compliant Reports | 21 | 15 |
| All | Total | 1,920 | 632 |
Source: FOIP, December 14, 2012.
| Method | Number | Value |
|---|---|---|
| Written warning | 39 | n/a |
| Amend orders | 0 | n/a |
| Repair orders | 3 | n/a |
| Compliance orders | 3 | n/a |
| Administrative Penalty | 12 | $39,450 |
| Offence charge | 1 | $730 |
| License suspenstion and cancellation | 0 | n/a |
| Total actions | 58 | $40,270 |
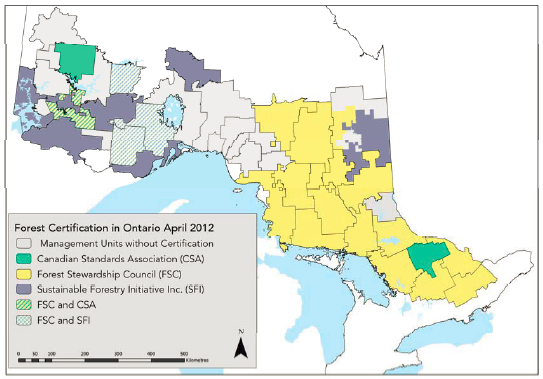
Forest Certification
Forest certification – 2011-12
A number of management units in Ontario have received certification by independent third-party organizations. Forest certification recognizes forest management planning and forestry practices that have met a forest management standard.
- The Bancroft-Minden, Hearst, Mazinaw-Lanark, and Timiskaming Forests were all certified for the first time under Forest Stewardship Council (FSC) certification;
- The Lakehead Forest was also certified for the first time under Sustainable Forestry Initiative (SFI) certification;
- The Black River, Kenogami, Lac Seul, Magpie, Pic River Ojibway, and Sapawe Forests had their certification lapse, mainly due to a number of bankruptcies of the SFL companies; and
- Based on forest certification audit cycles, a number of management units went through re-certification audits during the year and were successful in maintaining forest certification.
For more information on forest certification by forest management unit: http://www.mnr.gov.on.ca/en/Business/Forests/2ColumnSubPage/STEL02_167417.html [Inactive link]
Forest science
Forest science – 2011-12
The MNR, in cooperation with its partners, made significant advances in specific policy development, technical development, and scientific programs related to forest management, including:
- Conducted climate change research;
- Prepared and implemented new policies, procedures, and forest management guides;
- Developed, implemented, and maintained long-term monitoring programs and scientific studies;
- Educated professionals and the public;
- Developed new forest management models and tools; and
- Developed new and improved data and information sources.
The following five pages outline forest science programs related to forest management. Each outline has a link for further information on these programs.
Many MNR research projects are in progress or deal with subjects indirectly related to forest management and are not reported in this document. More information about other research work undertaken by the MNR is available on the Forestry website.
Forest management guide developments
Forest management guides are developed and revised to provide forest managers with direction based on the latest scientific knowledge and best practices. Advances related to forest management guides included:
- Preparing the draft Forest Management Guide for Boreal Landscapes continued;
- Releasing best management practices for eastern white cedar in boreal Ontario; and
- Training on all guides for the 2012 and 2013 forest management planning teams. Stand and Site Guide training was conducted across the AOU, with workshops in Elk Lake, Geraldton, Nipigon, Pembroke, Thunder Bay, and Wawa.
Forest Ecosystem Science Co-operative Inc.
The Forest Ecosystem Science Co-operative is a partnership between government and industry researchers investing in forest science for the purpose of supporting sustainable forest management. Co-op work included:
- Bio-Indicators of Forest Stream Health Report;
- Wetlands and Water-Birds Project;
- Lichens Diversity Project;
- Prescribed Burning Caribou Project;
- Caribou Habitat & Population Project;
- Forest Biodiversity Genomics Project;
- Electronic Data Capture Protocol Project;
- SFI Forest Hydrology Project;
- Permanent Growth Plot Program (Innovation in Forecasting Forest Habitat and Wood Supply); and
- Partnering in the development of a Bio-Cultural Design network.
Spatial Ecology Program
The Spatial Ecology Program assists in the development and evaluation of forest policies and practices for the conservation of wildlife biodiversity in Ontario’s boreal forest. The Spatial Ecology Program activities comprised:
- Supporting forest management planning teams use of spatial forest models ( BFOLDS, Patchworks, etc.);
- Assisting with habitat models used in the Ontario Landscape Tool for forest management planning under the new guides;
- Completing Songbird Guide Effectiveness Monitoring (GEM) work in Great Lakes- Lawrence Landscape Guide Region; and
- Analyzing and write-up of GEM work in the Boreal 3W landscape guide region.
Climate change mitigation and adaptation
Climate change is a key priority for the Ontario government. Advances in climate change mitigation and adaptation included:
- Developing Sustainability in a Changing Climate: A Strategy for the OMNR (2011-2014). The strategy outlines research and management program priorities moving forward under three themes: understanding climate change; mitigating climate change; and helping Ontarians adapt;
- Releasing A Practitioners Guide to Climate Change Adaptation in Ontario’s Ecosystems;
- Modeling in support of the Northeast Climate Change Vulnerability Assessment; and
- Developing policy documents for future release in the areas of carbon sequestration, climate change impacts on aquatic ecosystems and climate change adaptation strategies for Ontario’s forests.
Wildlife population monitoring
Provincial wildlife population monitoring is undertaken to determine if healthy populations of forest wildlife continue to be found across the AOU and to contribute to an understanding of how forest management affects wildlife populations. Wildlife population monitoring activities included:
- Supporting migration monitoring, breeding bird survey, nocturnal owl survey, and woodcock survey through the Boreal Science Co-operative partnership;
- Developing the final annual report of the University of Guelph-Algonquin Park Small Mammal Monitoring program as the partnership with MNR has now concluded; and
- Collecting of Multi-species Inventory and Monitoring data at 17 sites in ecoregion 3W, including bird surveys, terrestrial encounter surveys, and moose and caribou aerial inventory surveys. Fourteen moose surveys were conducted and two caribou population ranges were surveyed (Brightsand and Pagwachuan).
Ecological Land Classification
The Ecological Land Classification (ELC) program, formerly the Forest Ecosystem Classification Program, is mandated with the establishment of a comprehensive and consistent province-wide framework for ecosystem
description, inventory, and interpretation. Ecological Land Classification program accomplishments included:
- Completing a journal article and three regional Science and Information technical notes providing guidance to users for ELC product versions;
- Producing ecosite factsheets: Boreal non-treed, Great-Lakes treed and non-treed;
- Implementing ELC through the provincial Forest Resource Inventory in five SFLs;
- Contributing to 14 inter-jurisdictional reviews as part of Canadian and U.S. National Vegetation Classifications;
- Holding Forest Resources Inventory and
- workshops in Pembroke for forest industry and Southern Region MNR technical staff;
- Updating ELC training materials;
- Holding practitioner training workshops and field courses (10) province-wide; and
- Incorporating ELC eco-site framework into the provincial Silviculture Guides revision.
Full-tree harvest and biomass studies
The full-tree harvesting project, initiated in 1991, was designed to focus on ecosystem processes and the changes occurring in these processes in response to varying levels of biomass removals. Advances related to the studies included:
- Incorporating data from Ontario’s Long-Term Soil Productivity (LTSP) installations with information from 45 North American LTSP installations and publishing a journal manuscript outlining findings.
- Assembling a federal-provincial Bio-economy Technical Working Group (BETWG) consisting of research scientists and forest policy specialists from the Canadian Forest Service, MNR, and MNDM. The scope of BETWG is to identify and consider options to address the most relevant science and policy needs including: establishing science priorities; supporting cooperative bio-economy programs, and enhancing knowledge exchange.
- Publishing a paper (Opportunities and Challenges for Ontario’s Forest Bio-economy) in the Forestry Chronicle that examined the sustainable use of forest biofibre based on current and proposed policies, guides, practices, and research. The paper, developed by BETWG, considers the uncertainties associated with biofibre and biomass harvesting, details the existing safeguards, and outlines an approach for continuing to advance Ontario’s bioeconomy while emphasizing the goal of forest sustainability.
Growth and yield
The Growth and Yield Program is actively involved in a wide range of activities from the collection of field data and information, to the creation of new models, guidelines and monitoring procedures. Growth and yield activities included:
- Completing the re-measurement of nine permanent sample plots through partnerships in southern Ontario with conservation authorities and county forests;
- Establishing or re-measuring 35 permanent sample plots within the AOU and six permanent sample plots in the Far North;
- Establishing or re-measuring 42 permanent growth plots across the province;
- Re-measuring 266 permanent growth plots through a partnership with the Forest Ecosystem Science Co-operative; and
- Completing stem analysis on two red pine plantation plots.
Other forest research
A number of other research projects examined various aspects of forest management activities. These activities included:
- Exploring how best to apply expert knowledge in landscape ecology;
- Summarizing two decades of vegetation management research in a special journal issue;
- Documenting options for mitigating climate change via forestry and biomass fuel;
- Exploring options for assisted tree species migration as a climate change mitigation strategy;
- Investigating effects of climate change on peat and permafrost in Ontario’s Far North;
- Reporting options for increasing aspen quality in Boreal mixedwoods;
- Developing guidelines for the sustainable harvest of Canada yew;
- Documenting causes of red pine decline in Southern Ontario; and
- Refining individual tree growth models to improve estimates of wood quantity.
See the Ontario Forest Research Institute's research activities and publications page for more information.
Invasive Species Centre
The MNR In collaboration with the Canadian Forest Service, Department of Fisheries and Oceans, Canadian Food Inspection Agency, and Environment Canada, have established an Invasive Species Centre (ISC) in Sault Ste. Marie, Ontario. The focus of the ISC is to address threats from invasive species by facilitating cooperation, collaboration, coordination, and communication between the wide range of stakeholder groups involved in prevention, detection, and response activities. Highlights included:
- Incorporating as a not-for-profit corporation in 2011;
- Forming a nine-member Board of Directors with representatives from the stakeholder community including academia, industry, municipalities, First Nations, and non-government organizations; and
- Conducting 62 research and strategic projects worth $2 million in the following categories; aquatic, forest, plant and policy and information management.
Aboriginal Peoples
Summary of involvement by Aboriginal Peoples – 2011-12
Condition 34 of Declaration Order (MNR-71) regarding the MNR’s Class Environmental Assessment Approval for Forest Management on Crown Lands in Ontario, requires district managers to conduct negotiations at the local level with Aboriginal communities. These negotiations are to identify and implement ways of achieving a more equal participation by Aboriginal peoples in the benefits provided through the forest management planning process and implementation. The negotiations include but are not limited to the following:
- Providing job opportunities associated with forest and mill operations;
- Supplying wood fibre to Aboriginal wood processing facilities;
- Facilitating Aboriginal third-party licence negotiations with existing licensees where opportunities exist;
- Providing forest resource licences to Aboriginal peoples;
- Developing programs to provide jobs, training, and income for Aboriginal people in forest management operations; and
- Identifying other forest resources that may be affected by forest management or can be addressed in forest management planning.
Arrangements and agreements put into effect by MNR district managers and Aboriginal communities take different forms and aƩempt to accommodate the unique needs, capacities, and situations of individual Aboriginal communities. In its decision, the Environmental Assessment Board ordered the MNR to build upon initiatives already underway, and to provide new opportunities for Aboriginal communities to benefit from forest management activities in their local areas.
While responsibility for implementation of Condition 34 rests with the MNR, the Environmental Assessment Board recognized that the involvement of other parties is critical to successful implementation. Such involvement would include participation of Aboriginal communities, the forest industry, and other government bodies (e.g. Indian and Northern Affairs Canada and Natural Resources Canada).
The term “Aboriginal” is used and also includes references to “First Nations” and “Native” as per the definition in the Canadian Constitution 35(2), unless quoted directly from a source or in the use of a proper name.
District progress
The MNR is required to report on the progress of ongoing negotiations with Aboriginal peoples on a district-by-district basis. Of the 26 MNR districts, four are outside the AOU-Aylmer, Aurora, Cambridge, and Midhurst. Peterborough and Kemptville districts are only partially included in the AOU. Accordingly, the reporting of Bancroft District includes parts of Peterborough and Kemptville districts located in the Mazinaw-Lanark Forest.
Access to resources
The MNR has helped the forest industry and Aboriginal communities negotiate access to resources through various mechanisms. For example, harvest opportunities have been made available through overlapping licences issued to Aboriginal communities or community members at the district level.
Silvicultural opportunities
Forest renewal and tending includes growing nursery stock, planting, seeding, spacing, cleaning, thinning, and site preparation. District managers have sought specific agreements between the forest industry and Aboriginal communities for silvicultural contract work. Other key forest management activities, such as wood hauling, road construction and maintenance, and information gathering are also provided.
Employment
District managers have helped co-ordinate existing federal and provincial programs to assist Aboriginal communities in preparing for increased participation in forest management activities. In some districts, the forest industry provides the training strategy, recruitment and hiring support, and business opportunities for independent contractors. In some instances the MNR helps to foster Aboriginal training by providing funding, facilities, or equipment. Sometimes, districts provide direct training services, or leadership to training initiatives.
In 2011-12, participation levels of Aboriginal people working in all aspects of forest management varied, largely due to a reduction in the forest industry as a result of market conditions. It is clear from district information that Aboriginal people were engaged in harvesting, as well as silviculture and other activities. Aboriginal people were also employed at forest resource processing facilities (mills). Business entities established may be affiliated directly with Aboriginal communities, may be run by individuals who are members of an Aboriginal community, or may be operated by non-Aboriginal parties.
Districts are in many cases able to report or estimate how many individuals are engaged in particular activities or contracts, but typically do not have access to information on employment numbers in other activities. Some districts have been able to provide estimates of total numbers of Aboriginal people employed by the industry in the district. However, in many instances, data are incomplete on the overall numbers of Aboriginal people working in the forest industry.
| District | Tenure type | Estimated Total | Number of Aboriginal Communities Affected |
|---|---|---|---|
| Algonquin Park | Contract | 57.6 | 1 |
| Chapleau | Conditional Commitment | 157.8 | 1 |
| Cochrane | Contract, Licence | 578.1 | 3 |
| Dryden | Licence | 164.4 | 3 |
| Fort Frances | Contract, Licence | 287.6 | 8 |
| Hearst | Contract, Licence | 78.0 | 2 |
| Kenora | Licence | 307.2 | 3 |
| Kirkland Lake | Contract, Licence | 84.5 | 2 |
| Nipigon | Licence | 453.3 | 8 |
| North Bay | Licence | 26.4 | 2 |
| Pembroke | Licence | 5.7 | 1 |
| Red Lake | Contract, Licence, Other | 8.2 | 3 |
| Sault Ste. Marie | Conditional Commitment | 30.0 | 3 |
| Sioux Lookout | Licence | n/a | 1 |
| Sudbury | Licence | 104.5 | 5 |
| Thunder Bay | Allocation, Licence | 158.7 | 4 |
| Timmins | Contract, Licence | n/a | 2 |
| Wawa | Licence | 275.0 | 2 |
Training and development
A range of forest-related training and development initiatives were provided for the benefit of Aboriginal people. Opportunities were presented in a few larger, comprehensive programs, as well as in a multitude of local and focused offerings. MNR and the forest industry have significantly supported training initiatives, and number of key opportunities are listed below.
The MNR’s Aboriginal Youth Work Exchange Program (AYWEP) and the First Nations Natural Resources Youth Employment Program are examples of larger, comprehensive training programs. Through the AYWEP, at least seven districts arranged eight-week summer employment for Aboriginal youth (Thunder Bay, Chapleau, Kirkland Lake, Sioux Lookout, Dryden, Hearst, Kenora, and Sault Ste. Marie). AYWEP work placements focus on resource management projects, job skills readiness training, and personal development training.
The First Nations Natural Resources Youth Employment Program (First Nations Ranger Program) is largely centered at Camp Firesteel, west of Upsala. The seven-week program employed 17 youth and crew leaders in training from 16 First Nations communities in five districts (Timmins, Dryden, Thunder Bay, Nipigon, and Sioux Lookout). The program is administered by Confederation College and has received support from the MNR, other ministries and government agencies, and industry partners.
The most common training received by Aboriginals has been MNR’s forest management planning workshops and as more Aboriginal members become involved, the benefits of this program are reaching more communities. In addition, forest industry and SFL companies are actively engaged in supporting training programs for educating youth and other groups. Examples of MNR and industry supported training include:
- GIS and chainsaw/skidder training (Parry Sound);
- Forest activity training sessions at the Mushkegowuk Environmental Centre (Chapleau);
- Algonquin Earthwalker Program (Pembroke);
- First Nations Juvenile Spacing Training and Employment Program (Dryden);
- Whitefeather Forest Management Corporation and Confederation College collaborated to facilitate a forest ecosystem technician program in Pikangikum (Red Lake);
- Trapping courses (Cochrane and Timmins); and
- S-102 Fire Training Course (Thunder Bay).
| District | Estimated size of contracts Industry & MNR | Number of communities affected | Types of activities |
|---|---|---|---|
| Algonquin Park | 1,039 ha 76 ha | 9 | Tree Marking Manual Cleaning and Pre-Commercial Thinning |
| Cochrane | Unknown | 3 | Road Maintenance and Beaver Control |
| Dryden | 4.5 M Seedlings 91 ha | 2 | Seedling Production Pre-Commercial Thinning |
| Fort Frances | $320 K, $66 K, $766 K, $72 K, $1,537 K | 9 | Seedling Production, Planting, Cone Collection and Thinning |
| Hearst | Unknown | 1 | Wood Waste Hauling |
| Kenora | $17 K, $26 K, $96 K | 8 | Road Culvert Maintenance and Beaver Control |
| Kirkland Lake | 51 ha | 1 | Pre-commercial thinning |
| Nipigon | Uknown | 8 | Road construction and maintenance |
| North bay | $244 K | 2 | Tree marking and manual tending |
| Pembroke | $5 K | 1 | Support for Earthwalker program |
| Sault Ste. Marie | 603 K seedlings | 1 | Seedling production and cone collection |
| Sioux Lookout | Unknown | 1 | Road maintenance |
| Sudbury | 200 K seedlings | 1 | Seedling production |
| Thunder Bay | 45 K seedlings | 1 | Tree planting |
Role in planning and management
Aboriginal Involvement in Planning and Management 2011-12 In addition to efforts to achieve a more equal participation by Aboriginal peoples in the benefits of forest management activities, MNR districts seek effective forums for Aboriginal communities to have a greater say in the planning and management of forest resources. Forest management plans include detailed Aboriginal Background Information Reports and maps of Aboriginal values. Aboriginal Background Information Reports summarize the locations of natural resource features, land uses and values of interest to the Aboriginal communities, and forest management-related concerns of the communities. Districts have provided financial assistance to some communities to prepare these components or to hire outside contractors.
In many districts, Aboriginal peoples are represented along with forest industry, government, and public on forest management planning teams. In addition, Aboriginal members often serve on Local Citizens Committees (LCC).
| District | Aboriginal Communities Represented on LCCs Active Member | Aboriginal Communities Represented on LCCs Non- active Member | Aboriginal Communities Represented on Planning Teams Active Member | Aboriginal Communities Represented on Planning Teams Non- active Member | Aboriginal Back ground Information Reports on File for a Forest |
|---|---|---|---|---|---|
| Algonquin Park | 1 | 0 | 9 | 0 | 5 |
| Bancroft | 1 | 1 | 5 | 2 | 9 |
| Chapleau | 0 | 0 | 7 | 2 | 16 |
| Cochrane | 0 | 0 | 2 | 0 | 3 |
| Dryden | 1 | 0 | 7 | 1 | 11 |
| Fort Frances | 1 | 0 | 0 | 0 | 15 |
| Hearst | 0 | 0 | 6 | 0 | 11 |
| Kenora | 1 | 0 | 3 | 3 | 19 |
| Kirkland Lake | 3 | 0 | 5 | 0 | 5 |
| Nipigon | 3 | 5 | 8 | 13 | 24 |
| North Bay | 6 | 0 | 6 | 0 | 6 |
| Parry Sound | 0 | 1 | 0 | 2 | 5 |
| Pembroke | 1 | 0 | 8 | 1 | 6 |
| Red Lake | 0 | 0 | 6 | 0 | 7 |
| Sault Ste. Marie | 0 | 0 | 0 | 0 | 6 |
| Sioux Lookout | 1 | 8 | 2 | 7 | 5 |
| Sudbury | 0 | 1 | 4 | 8 | 9 |
| Thunder Bay | 6 | 1 | 4 | 0 | 6 |
| Timmins | 4 | 9 | 11 | 4 | 9 |
| Wawa | 3 | 4 | 9 | 1 | 11 |
Conclusion
Annual Report on Forest Management – final word
Ontario’s forests provide a variety of environmental, economic, and social benefits to the people of Ontario. The 2011-12 Annual Report on Forest Management outlines the effectiveness of MNR’s forest programs in ensuring Ontario forests are well managed for future generations.
This report has provided key information on the results of sustainable forest management in Ontario and addresses the legal requirements outlined in Declaration Order (MNR-71) regarding the MNR’s Class Environmental Assessment Approval for Forest Management on Crown Lands in Ontario. The report has also been prepared consistent with the principles and intent of the CFSA.
Your feedback is appreciated. Provide comments on this report, or find out more about forestry and forest management in Ontario by visiting our Forestry website.
Footnotes
- footnote[1] Back to paragraph To Forestry Futures Trust Fund
- footnote[2] Back to paragraph To Consolidated Revenue Fund
- footnote[3] Back to paragraph For various districts the estimated total allocation and/or harvest volume was not provided for some Aboriginal communities. Additional opportunities may have been undertaken but not included in summary.