Labour market report, April 2020
Employment in Ontario fell by a record 689,200 jobs in April. Get the details in this report.
Quick facts
In April 2020:
- There were 12.3 million people in Ontario aged 15 years or older
- 7.3 million (59%) were in the labour force, including those who had worked, were unemployed or did not work at their job because of ongoing business closures. The labour force declined by 452,300 or 9.1% compared to March
- 6.5 million (53%) were employed, down by a record 689,200 jobs or 15.3% from March
- Ontario's unemployment rate increased to 11.3% from 7.6% and 822,400 people were unemployed, up by 236,800 or 6.6% from March
This report is based on the Labour Force Survey (LFS), a household survey carried out by Statistics Canada. April’s Labour Force Survey more fully reflects the labour market impacts currently being felt from the COVID-19 pandemic than March’s LFS results. April’s results cover the reference week of April 12 to 18. Ontario’s mandatory closure of non-essential businesses and other measures aimed at addressing the impact of COVID-19 only took effect on March 24, while the March survey was conducted between March 22 and March 31 and covered the March 15 to 21 employment reference period.
Employment fell in April
Employment in Ontario fell by a record 689,200 net jobs in April. Ontario’s share of national job losses (36%) since February was slightly below the province’s 39% share of employment in Canada.
Employment in Ontario in April was 6,463,100, a decline of 1,092,000 jobs (−14.5%) compared to February. The total job losses over the two-month period are four times the size of the job losses in the 2008/09 downturn (−272,500 peak to trough), and more than double the percentage decline in the 1991 recession (−6.9%), previously the deepest recession since the current timeseries began in 1976.
All sectors except agriculture and utilities recorded job losses, led by wholesale and retail trade (−143,300), manufacturing (−100,000), accommodation and food services (−96,200) and construction (−93,800). Over the past two months, employment fell in all sectors compared with February.
The total number of hours worked in Ontario in April declined by about 28% compared to February.
Chart 1 shows employment in Ontario from January 2015 to April 2020.
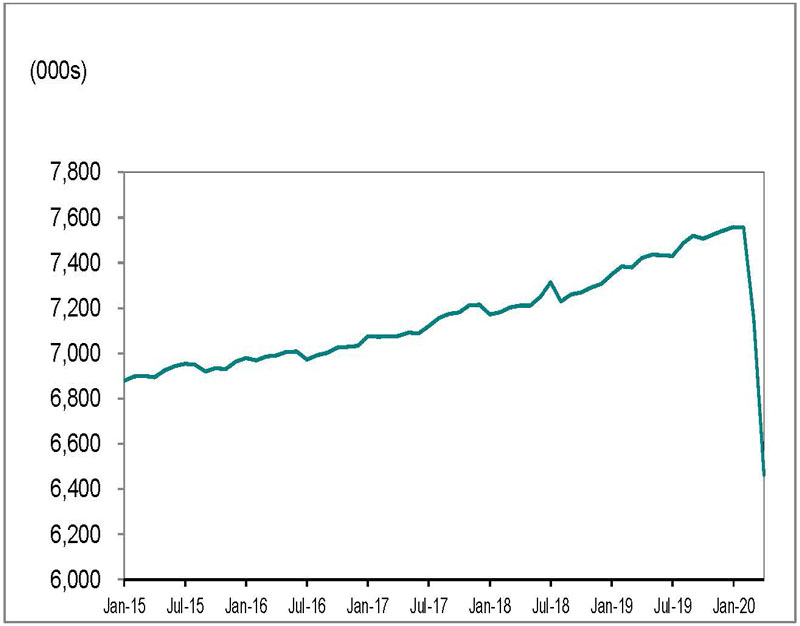
Source: Statistics Canada, Labour Force Survey, Table 14-10-0287-01, (seasonally adjusted data).
Full-time vs. part-time
Full-time employment declined by 464,400, while part-time employment declined by 224,800. Part-time workers have accounted for 35% of all job losses since February, despite accounting for 18% of total employment.
Employment decrease by age
Youth employment (those aged 15 to 24) fell by 166,800 in April, after decreasing by 158,800 jobs in March. Youth have been disproportionally impacted by job losses since February.
Employment for people aged 25 to 54 declined by 378,300 in April, compared to March. Employment for those aged 55 and older fell by 144,000 jobs.
Employment in Canada declined by about two million in April (1,994,000), the largest loss on record. Employment in Canada has declined by about 3 million compared to February.
Unemployment rate increased to 11.3%
Chart 2 shows unemployment rates, Ontario and Canada, January 2015 to April 2020.
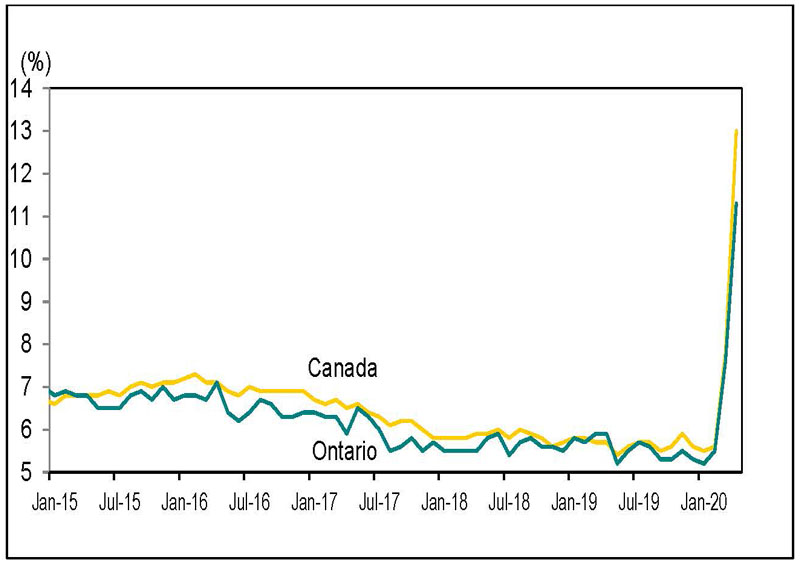
Source: Statistics Canada, Labour Force Survey, Table 14-10-0287-01, (seasonally adjusted data).
Ontario’s unemployment rate (11.3%) in April was the highest since June 1993 (11.3%), surpassing March’s rate of 7.6%. The rate has more than doubled from 5.5% in February.
Canada’s unemployment rate climbed to 13.0% in April from 7.8% in March. In February, Canada’s unemployment rate was 5.6%.
Unemployment rate by age
For individuals aged 15 to 24, the unemployment rate climbed to 24.0% in April from 15.8% in March and was the highest unemployment rate on record.
The unemployment rate for individuals aged 25 to 54 increased to 9.5% in April from 6.7% in March and to 9.5% from 5.4% for those aged 55 and older.
Lowest and highest unemployment rates
Chart 3 shows Census Metropolitan Areas (CMAs) with highest and lowest unemployment rates in Canada, April 2020.
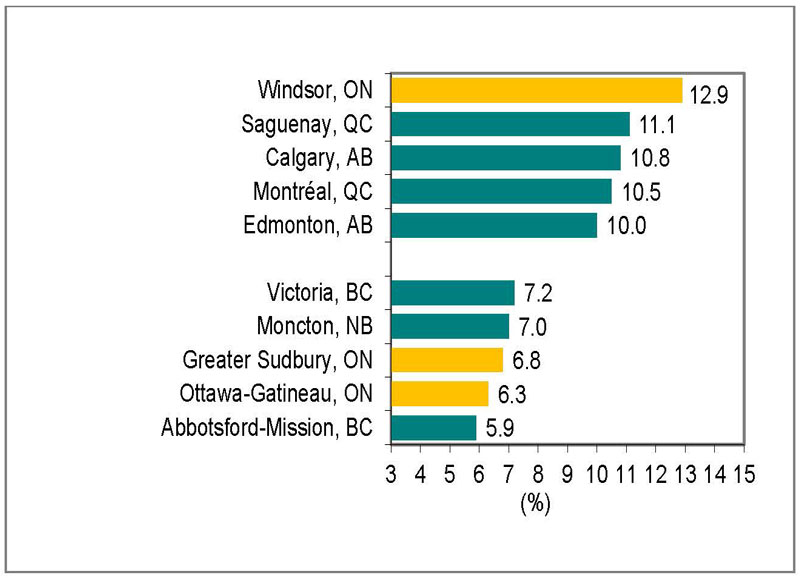
Source: Statistics Canada, Labour Force Survey, Table 14-10-0294-01, (seasonally adjusted data three-month moving average to reduce volatility caused by small sample size).
Windsor recorded the highest unemployment rate in Canada in April (12.9%), followed by Saguenay, Québec, at 11.1%.
Ottawa-Gatineau, Ontario part, recorded the lowest unemployment rate in Ontario in April (6.3%), while Abbotsford-Mission, British Columbia recorded the lowest unemployment rate in Canada (5.9%).
Year-over-year comparisons
Employment increase and decrease by education level
Over the first four months of 2020, employment in Ontario declined by 109,100 net jobs for adults 25 years and older compared to the first four months of 2019.
Employment increase and decrease by education level
Chart 4 shows Ontario employment change by highest level of education attained, aged 25 and older, April 2019 year-to-date to April 2020 year-to-date.
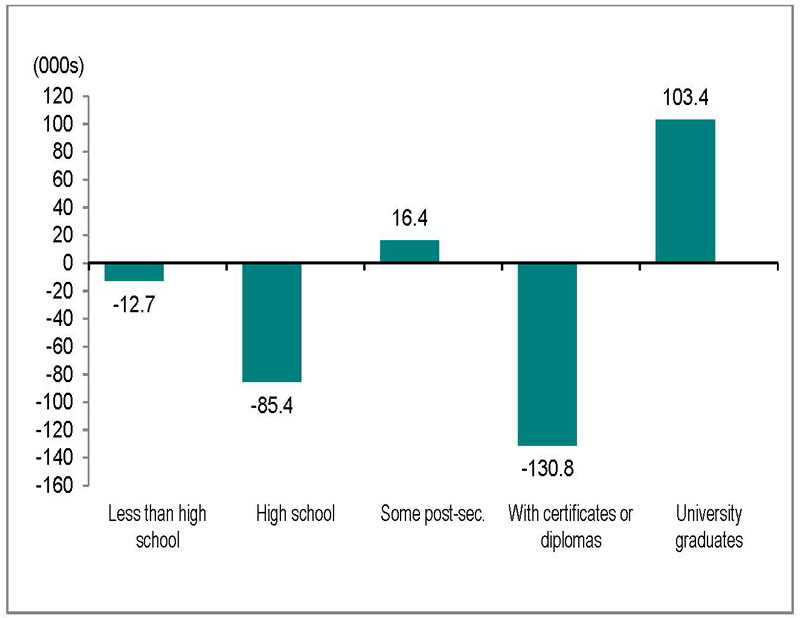
Source: Statistics Canada, Labour Force Survey, Table 14-10-0019-01, unadjusted data
Individuals with a postsecondary certificate or diploma and those with high school education led job losses with 130,800 and 85,400, respectively.
People with less than high school education recorded job losses of 12,700.
Adults with a university degree led gains with 103,400 net new jobs, while those with some postsecondary education recorded job gains of 16,400.
Unemployment rate by education level
The unemployment rate for adults aged 25 and older with postsecondary education credentials was 5.8% in the first four months of 2020, up from 4.3% a year earlier.
The unemployment rate for adults without postsecondary education credentials was 7.9%, up from 6.6% compared to a year ago.
Employment increase and decrease by occupation
Chart 5 shows Ontario employment change by occupation, April 2019 year-to-date to April 2020 year-to-date.
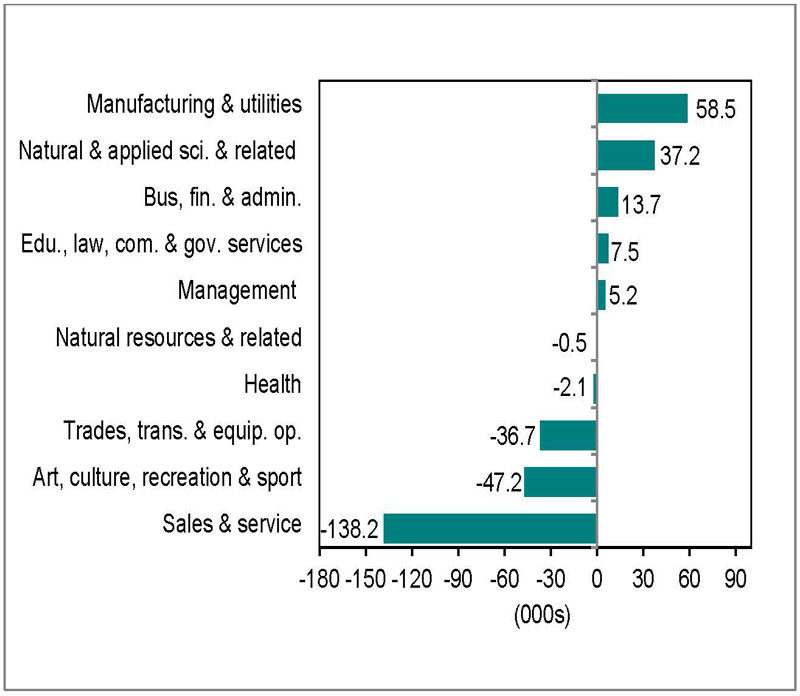
Source: Statistics Canada, Labour Force Survey, Table 14-10-0297-01, unadjusted data.
Five of the ten major occupational groups in Ontario had employment losses in the first four months of 2020 compared to a year ago.
Learn more about the National Occupational Classification (NOC) system.
These occupations lost the most jobs:
- sales and service (138,200)
- art, culture, recreation and sport (47,200)
- Trades, transport and equipment operators (36,700)
These occupations gained the most jobs:
- manufacturing and utilities (58,500)
- natural and applied sciences and related (37,200)
- business, finance and administration (13,700)
Long-term unemployment
Chart 6 shows Ontario's long-term unemployed (27 weeks or more) as a percentage of total unemployment, April 2011 year-to-date April 2020 year-to-date
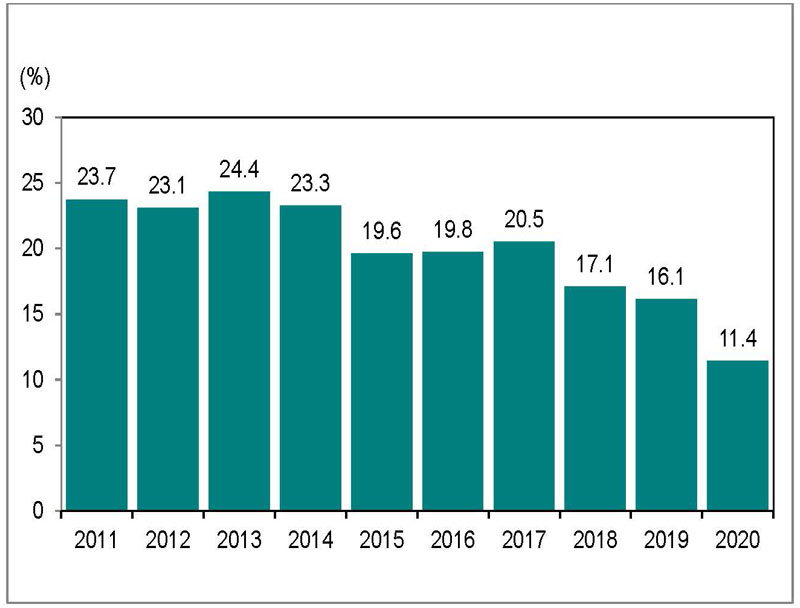
Source: Statistics Canada, Labour Force Survey, 14-10-0342-01, unadjusted data.
Over the first four months of 2020, an average of 65,100 people were unemployed for 27 weeks or longer, or long-term unemployed. This was down from 74,300 a year earlier.
Long-term unemployed individuals accounted for 11.4% of the total number of unemployed people in first four months of 2020, partly reflecting an 88% increase in total unemployment over the last two months. This was down from 16.1% a year.
Average time in long-term unemployment
The average time in unemployment decreased to 14.3 weeks over the first four months of 2020 from 16.7 weeks a year earlier, as a significant increase in unemployment in April 2020 reduced the average.
Download data
Source: Statistics Canada, Labour Force Survey
February 2020 Labour Market Report:
- CSV, Chart 1, employment in Ontario from January 2015 to April 2020, 1 Kb
- CSV, Chart 2, unemployment rates, Ontario and Canada, January 2015 to April, 2 Kb
- CSV, Chart 3, Census Metropolitan Areas (CMAs) highest and lowest unemployment rates, 2 Kb
- CSV, Chart 4, Ontario employment change by highest level of education, aged 25 and older, 99 Kb
- CSV, Chart 5, Ontario employment change by occupation, 12 Kb
- CSV, Chart 6, Ontario's long-term unemployed, 15 Kb