Labour market report, February 2021
Employment in Ontario increased by 100,300 in February. Get the details in this report.
Quick facts
In February 2021:
- There were 12.3 million people in Ontario aged 15 years or older
- 7.9 million (64.4%) were in the labour force, including those who had worked, were unemployed or did not work at their job, which includes people on temporary layoff because of ongoing COVID-related business closures. The labour force increase in February compared to January (24,400 or 0.3%).
- 7.2 million (58.5%) were employed, up by 100,300 jobs (1.4%) from January.
- Ontario's unemployment rate decreased to 9.2% in February from 10.2% in January and 726,500 people were unemployed, down 9.5% (-75,900) from January.
Important note:
This report is based on the Labour Force Survey (LFS), a household survey carried out by Statistics Canada. February’s LFS results covers labour market conditions as of the week of February 14 to 20.
Ontario’s mandatory closure of non-essential businesses and other measures aimed at addressing the impact of COVID-19 took effect on March 24, 2020.
In Ontario, previous requirements were lifted for many regions on February 10 and 15, while the Toronto, Peel, York and North Bay Parry Sound health regions remained under stay-at-home orders through the reference week.
The types of businesses that were deemed essential and remained open during the COVID-19 economic shutdown and the types of businesses that reopened at the different stages of the Ontario government’s plan for reopening the economy should be considered in the context of information provided in this report.
Employment increased in February
Employment increased in February (100,300 or 1.4%) following a decline of 153,500 (2.1%) in January. This was the largest increase since last September.
In February, employment in Ontario was 7,185,800 and 305,300 (4.1%) below its pre-COVID-19 February 2020 level.
The total number of hours worked in Ontario in February 2021 (at all jobs) was down by 9.1% compared to February 2020 (data are not seasonally adjusted).
Chart 1 shows employment in Ontario from January 2005 to February 2021.
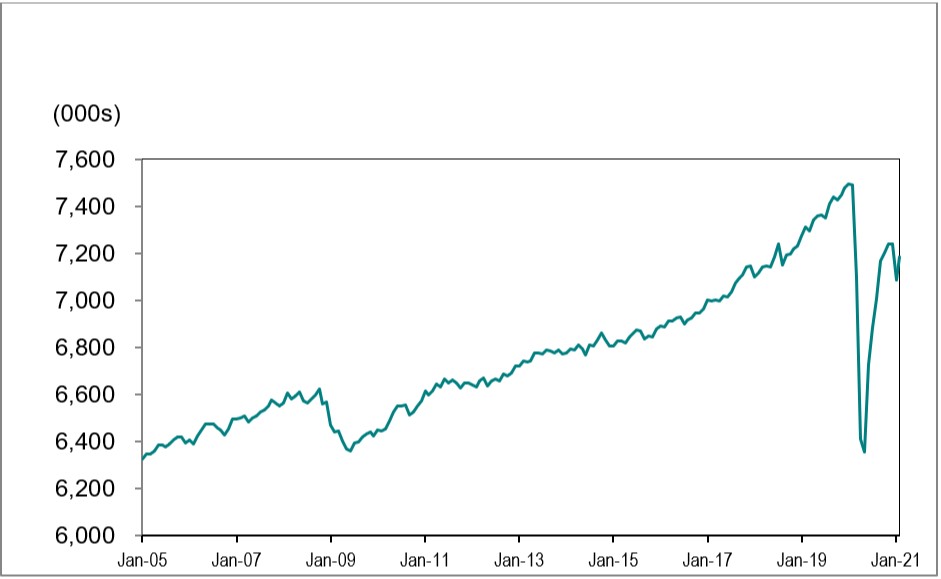
Source: Statistics Canada, Labour Force Survey, Table 14-10-0287-01, (seasonally adjusted data).
Full-time vs. part-time
Part-time jobs increased by 62,300 (5.6%), while full-time jobs grew by 38,000 (0.6%).
Employment change by sex and age
February’s employment gain was larger for men (54,600 or 1.5%) than women (45,700 or 1.4%).
Employment among women remains further behind its pre-COVID-19 February 2020 level (-4.9% or -174,500) than employment among men (-3.3% or -130,800)
Youth (those aged 15 to 24) employment increased by 23,100 (2.7%) in February, after falling by 9.6% (-90,100) in January. Youth employment remains further from pre-COVID February 2020 levels than other major age groups (-145,600 or -14.3%).
Employment for people aged 25 to 54 rose by 66,700 (1.4%) in February following a decrease in January (-51,700 or -1.1%). Employment for those aged 55 and older increased by 10,500 (0.6%) in February, following a decrease of 11,700 (-0.7%) in January.
Employment in Canada increased by 259,200 (1.4%) after falling by 212,800 (-1.2%) in January and is now 599,100 (3.5%) below its pre-COVID February 2020 level. February’s increase was the largest increase since last September.
Employment change by industry
The government’s restrictions on the types of businesses that were deemed essential and other measures aimed at addressing the impact of COVID-19 should be considered in the context of employment change by sector.
In February, employment in accommodation and food services (-121,900 or -27.5%) was furthest below its pre-COVID February 2020 level, followed by employment in wholesale and retail trade (-85,300 or -7.8%), business, building and other support services (-51,500 or -5.5%), transportation and warehousing (-36,000 or -9.1) and construction (-31,000 or -5.1%).
Employment was notably above pre-COVID February 2020 levels in professional, scientific and technical services (40,300 or 6.0% ), finance, insurance, real estate, rental and leasing (28,500 or 4.7% ) and manufacturing (27,200 or 3.6%).
Chart 2 shows industries by employment change in Ontario, February 2020 to February 2021.
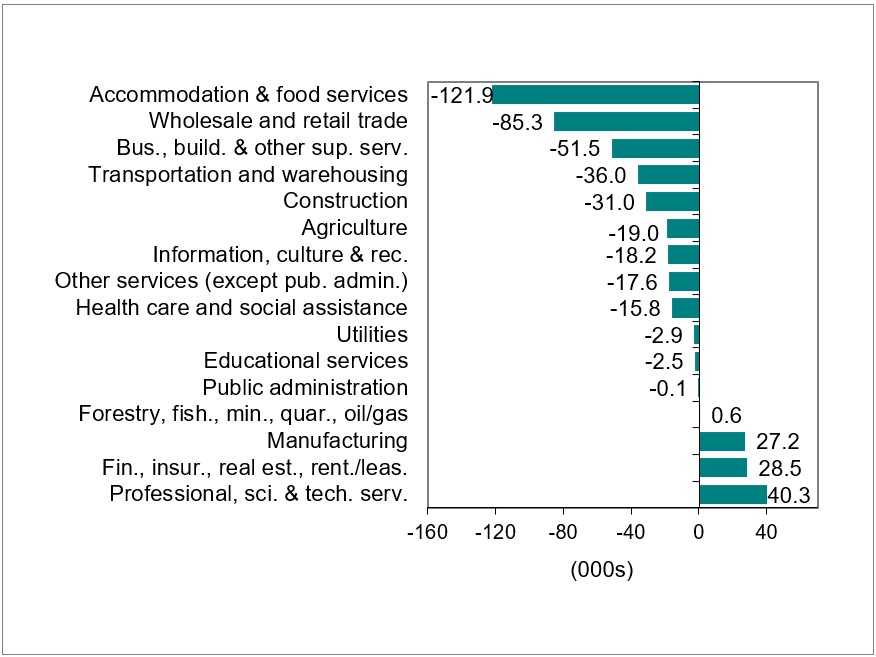
Source: Statistics Canada, Labour Force Survey, Table 14-10-0355-02, (seasonally adjusted data).
Unemployment rate decreased to 9.2%
Chart 3 shows unemployment rates, Ontario and Canada, January 2005 to February 2021.
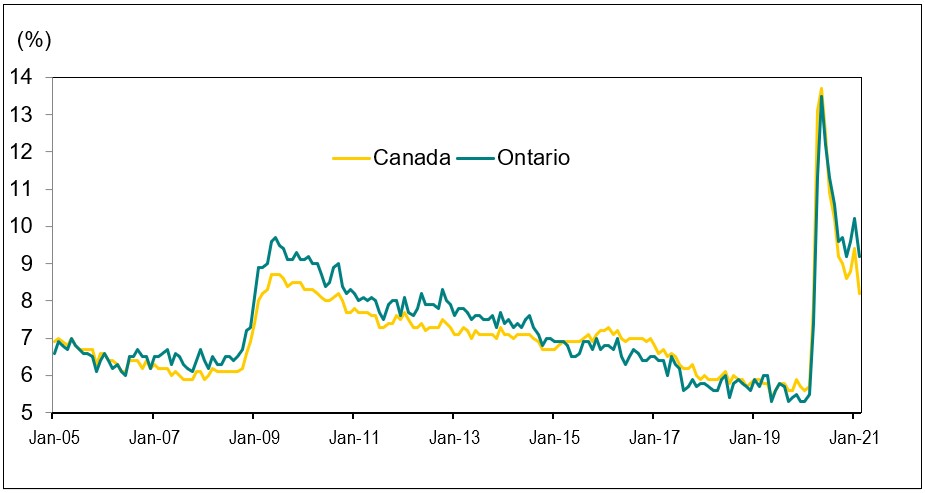
Source: Statistics Canada, Labour Force Survey, Table 14-10-0287-01, (seasonally adjusted data).
Ontario’s unemployment rate in February was 9.2%, down from 10.2% in January. The unemployment rate a year earlier in February 2020 was 5.5%.
Canada’s unemployment rate decreased to 8.2% in February from 9.4% in January. Canada’s unemployment rate a year earlier in February 2020 was 5.7%.
Unemployment rate by sex and age
The unemployment rate for women was 9.9% in February, down from 10.5% in January, while the rate for men decreased to 8.5% from 9.9% during the same period.
In Ontario, the unemployment rate among population groups designated as visible minorities was estimated at 10.0% in February in comparison to a 8.5% rate for non-visible minorities and those that did not identify as Indigenous (data are for the population aged 15 to 69 and are not adjusted for seasonality).
For individuals aged 15 to 24, the unemployment rate decreased to 20.9% in February from 21.9% in January and remains the highest among all age groups. The youth unemployment rate reached a record high of 30.0% in May.
The unemployment rate for individuals aged 25 to 54 was 7.3% in February, down from 8.3% in January, while the rate for those aged 55 and older was 7.1%, down from 8.3%.
Long-term unemployment
In February, an average of 195,100 Ontarians or 26.9% of all unemployed people were unemployed for 27 weeks or longer (long-term unemployed). This was down from 225,800 in January and 2.8 times the pre-COVID February 2020 level of 68,800.
The average time in unemployment increased to 20.3 weeks in February 2021 from 15.9 weeks in February 2020.
Chart 4 shows the number of people unemployed for 27 week or more in Ontario, January 2005 to February 2021.
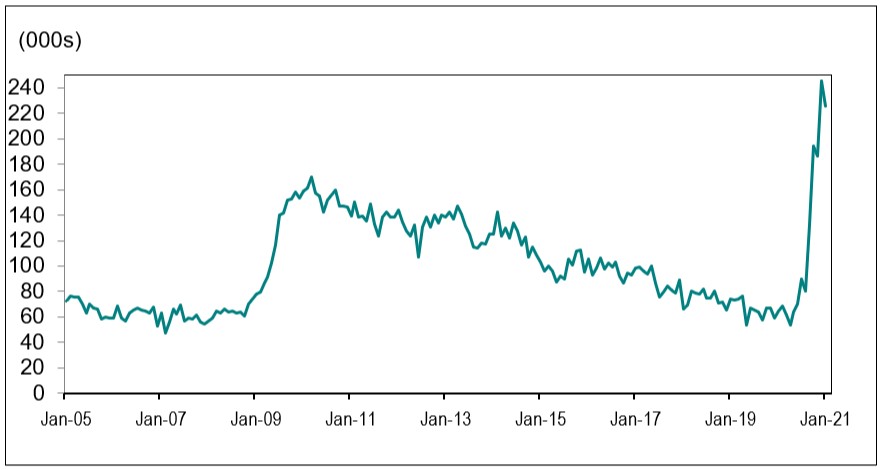
Source: Statistics Canada, Labour Force Survey, Table 14-10-0342-01, (seasonally adjusted data).
Employment and unemployment in urban centres
Employment change in urban centres
Chart 5 shows the rate of employment change for Ontario Census Metropolitan Areas (CMAs) from January 2021 to February 2021.
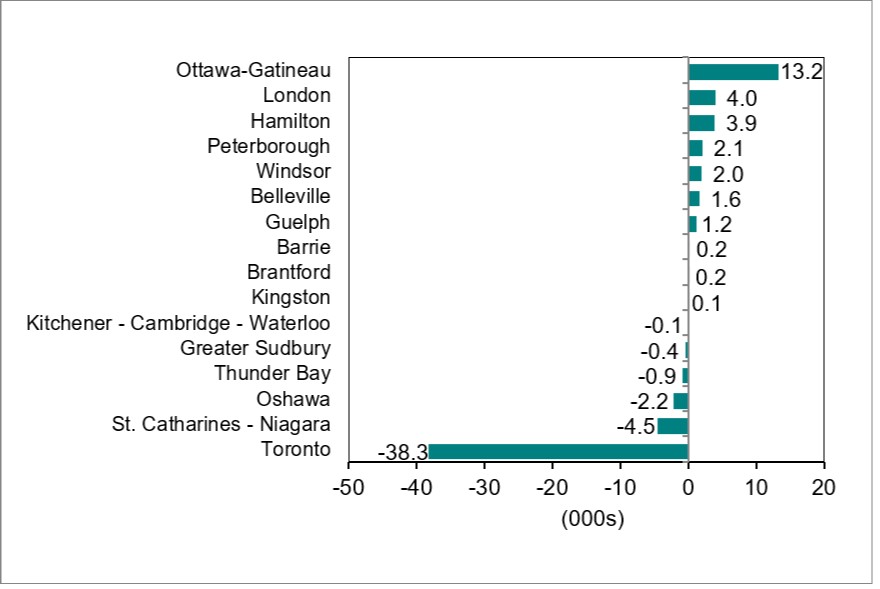
Source: Statistics Canada, Labour Force Survey, Table 14-10-0380-01, (seasonally adjusted data three-month moving average to reduce volatility caused by small sample size).
Employment levels increased in ten of the sixteen Ontario Census Metropolitan Areas (CMAs) between January and February, led by Ottawa-Gatineau (13,200 or 2.3%), London (4,000 or 1.5%), Hamilton (3,900 or 1.0%), Peterborough (2,100 or 3.8%) and Windsor (2,000 or 1.3%).
Toronto (-38,300 or -1.2%), St. Catharines-Niagara (-4,500 or -2.4%) and Oshawa (-2,200 or 1.1%) recorded the largest declines in employment.
In February, employment in 14 of the 16 Ontario urban centres remained below pre-COVID February 2020 levels, led by Toronto (-184,400 or -5.3%), St. Catharines-Niagara (-25,600 or -12.3%), Barrie (-20,500 or -16.2%), Kitchener- Cambridge-Waterloo (-18,400 or 5,5%) and Hamilton (-14,100 or -3.4%).
London (2,000 or 0.7%) and Kingston (1,300 or 1.6%) reported employment above pre-COVID February 2020 levels.
Lowest and highest unemployment rates in urban centres
Chart 6 shows Census Metropolitan Areas (CMAs) with highest and lowest unemployment rates in Canada, February 2021.
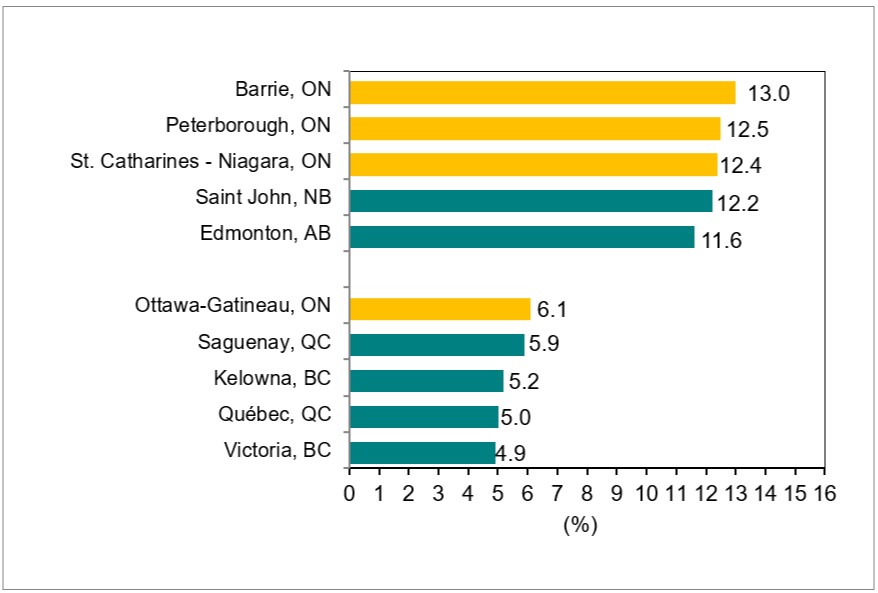
Source: Statistics Canada, Labour Force Survey, Table 14-10-0380-02, (seasonally adjusted data three-month moving average to reduce volatility caused by small sample size).
Ontario Census Metropolitan Areas (CMAs) recorded the three highest unemployment rates in Canada in February: Barrie (13.0%); Peterborough (12.5%) and St. Catharines-Niagara (12.4%).
Ottawa-Gatineau recorded the lowest unemployment rate in Ontario in February (6.1%), while Victoria had the lowest unemployment rate in Canada (4.9%).
Download data
Source: Statistics Canada, Labour Force Survey
February 2021 Labour Market Report:
- CSV, Chart 1, employment in Ontario from January 2005 to February 2021, 6Kb
- CSV, Chart 2, industries with highest and lowest employment change in Ontario, February 2020 to February 2021, 13Kb
- CSV, Chart 3, unemployment rates, Ontario and Canada, January 2005 to February 2021, 6Kb
- CSV, Chart 4, number of people unemployed for 27 week or more in Ontario, January 2005 to February 2021, 4Kb
- CSV, Chart 5, the rate of employment change for Ontario Census Metropolitan Areas (CMAs) from January 2021 to February 2021, 13Kb
- CSV, Chart 6, Census Metropolitan Areas (CMAs) highest and lowest unemployment rates, February 2021, 2Kb