Labour market report, February 2022
Employment in Ontario increased by 194,300 in February. Get the details in this report.
Quick facts
In February 2022:
- There were 12.4 million people in Ontario aged 15 years or older
- 8.1 million (65.4%) were in the labour force. The labour force increased in February (54,300 or 0.7%) compared to January.
- 7.7 million (61.7%) were employed, up by 194,300 (2.6%) from January.
- Ontario's unemployment rate fell to a two year low of 5.5% in February from 7.3% in January and 451,400 people were unemployed, down 23.7% (140,000) from January.
Important note:
This report is based on the Labour Force Survey (LFS), a household survey carried out by Statistics Canada. February’s LFS results cover labour market conditions during the week of February 13 to 19.
The February LFS reflects the easing of public health measures in Ontario that began on January 31, 2022, including capacity limits and closures that had been re-introduced in retail stores and high-contact settings such as restaurants, bars, concert halls and gyms with Ontario’s temporary move back into Step two of its Roadmap to Reopen on January 5, 2022.
Employment increased in February
Employment in Ontario increased in February by 194,300 (2.6%), following a decline of 145,700 (-1.9%) in January.
Ontario employment (7,687,800) was above its pre-pandemic level by 193,200 (2.6%) with February’s increase. Employment had remained higher than the pre-pandemic level since September 2021 but fell to par in January 2022.
Chart 1 shows employment in Ontario from January 2005 to February 2022.
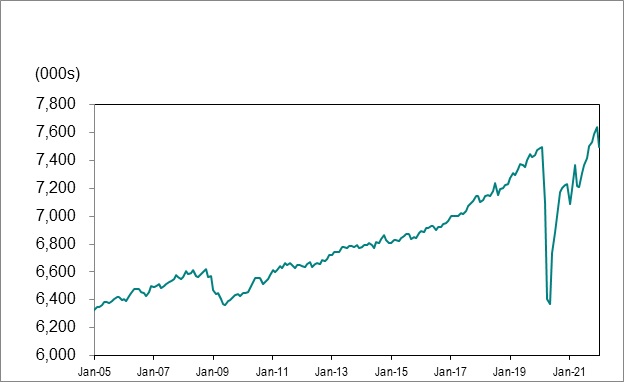
Source: Statistics Canada, Labour Force Survey, Table 14-10-0287-01, (seasonally adjusted data).
Full-time vs. part-time
Part-time jobs accounted for most of February’s job gains, increasing by 138,000 (10.3%) positions in February. Full-time jobs increased by 56,300 (0.9%).
Employment change by sex and age
February’s employment increase was 83,300 (2.1%) for men and 111,000 (3.2%) for women. Employment among men was 3.2% (126,200) above its pre-COVID February 2020 level. Employment among women was 1.9% (66,900) above, rebounding from its fall below its pre-COVID February 2020 level in January after being at or above that level since September 2021.
Youth (ages 15-24) employment increased by 85,300 (9.2%) in February, after declining by 106,500 (-10.3%) in January. Employment for people aged 25 to 54 increased by 93,700 (1.9%) in February, following a decrease of 44,800 (-0.9%) in January. Employment for those aged 55 and older increased by 15,400 (0.9%), after increasing by 5,500 (0.3%) in January.
In February, youth employment was 0.6% (-6,400) below its pre-COVID February 2020 level while employment among those aged 25-54 was 4.2% (203,100) above. Employment among those aged 55 and over was 0.2% (-3,500) below.
Employment in Canada increased by 336,600 (1.8%) in February after decreasing by 200,100 (-1.0%) in January.
Employment change by industry
The government’s restrictions and health measures aimed at addressing the impact of COVID‑, as well as the easing of these restrictions and measures, should be considered in the context of employment change by sector.
Accommodation and food services (75,600 or 23.9%), information, culture and recreation (39,000 or 13.4%), construction (20,700 or 3.7%) and financial, insurance, real estate, rental and leasing (17,200 or 2.7%) led job gains in February. There were notable employment losses in other services (-7,600 or -2.9%) and public administration (-6,200 or -1.5%).
In February, eleven of the 16 major industry groups had employment levels that were above pre-COVID February 2020 levels, led by professional, scientific and technical services (120,700 or 18.0%), finance, insurance, real estate, rental and leasing (55,300 or 9.2%), wholesale and retail trade (48,700 or 4.4%), information, culture, recreation and sport (28,800 or 9.6%) and public administration (25,300 or 6.5%).
Employment in other services, except public administration (-55,700 or -18.2%) was furthest below its pre-COVID February 2020 level, followed by accommodation and food services (-52,100 or -11.7%), business, building and other services (-26,600 or -8.1%) and agriculture (-15,900 or -20.3%).
Chart 2 shows industries by employment change in Ontario, February 2020 to February 2022.
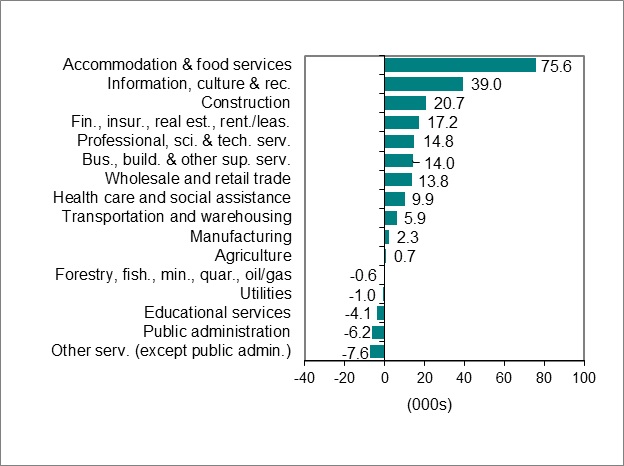
Source: Statistics Canada, Labour Force Survey, Table 14-10-0355-02, (seasonally adjusted data).
Unemployment rate decreased to 5.5%
Chart 3 shows unemployment rates, Ontario and Canada, January 2005 to February 2022.
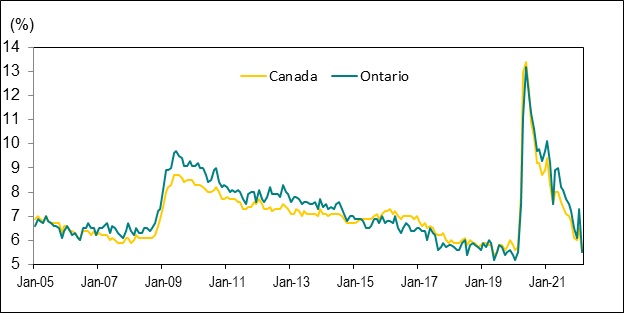
Source: Statistics Canada, Labour Force Survey, Table 14-10-0287-01, (seasonally adjusted data).
Ontario’s unemployment rate was 5.5% in February, matching the February 2020 pre-pandemic rate and the lowest recorded rate since the pandemic began. The unemployment rate was 7.3% in January.
Canada’s unemployment rate was 5.5% in February, below its February 2020 pre-pandemic rate of 5.7% for the first time. Canada’s unemployment rate was 6.5% in January. February’s unemployment rate was at its lowest level since June 2019.
Unemployment rate by sex, age and visible minority status
The unemployment rate for women was 5.7% in February, the lowest rate since the February 2020 pre-pandemic rate of 5.6%. It was 7.9% in January. The rate for men decreased to the February 2020 pre-pandemic rate of 5.4% for the first time since the pandemic. It was 6.8% in January
For individuals aged 15 to 24, the unemployment rate fell to 12.2% in February from 16.6% in January. The youth unemployment rate was 11.3% in February 2020 and reached a record high of 29.5% in May 2020.
The unemployment rate for individuals aged 25 to 54 was 4.4% in February, below its February 2020 pre-pandemic rate of 4.6% for the first time. The rate for this cohort was 5.7% in January
The unemployment rate for those aged 55 and older decreased to 4.5% from 6.3%, remaining above its February 2020 pre-pandemic rate of 4.1%.
In Ontario, the unemployment rate among population groups designated as visible minorities was estimated at 6.9% in February in comparison to a 4.8% rate for non-visible minorities and those that did not identify as Indigenous (data are for the population aged 15 to 69 and are not adjusted for seasonality).
Long-term unemployment
In February, an average of 80,700 Ontarians or 17.9% of all unemployed people were unemployed for 27 weeks or longer (long-term unemployed). This compared to 114,600 or 19.4% of all unemployed people in January but was still higher than the pre-COVID February 2020 level of 71,100. Long-term unemployment has been falling sharply since its peak in December 2020, and that decline has accelerated since September 2021.
The average time in unemployment was 21.4 weeks in February 2022 compared to 16.0 weeks in February 2020.
Chart 4 shows the number of people unemployed for 27 week or more in Ontario, February 2005 to February 2022.
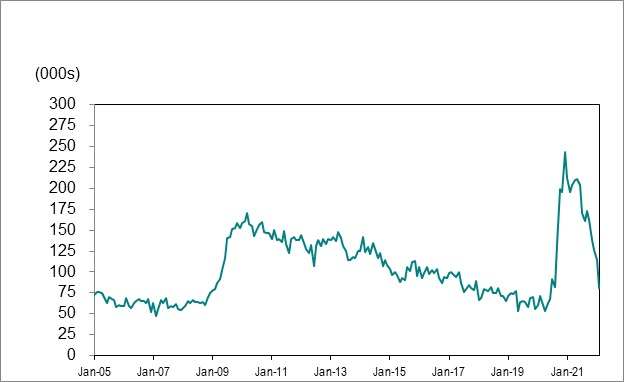
Source: Statistics Canada, Labour Force Survey, Table 14-10-0342-01, (seasonally adjusted data).
Employment and unemployment in urban centres
Employment change in urban centres
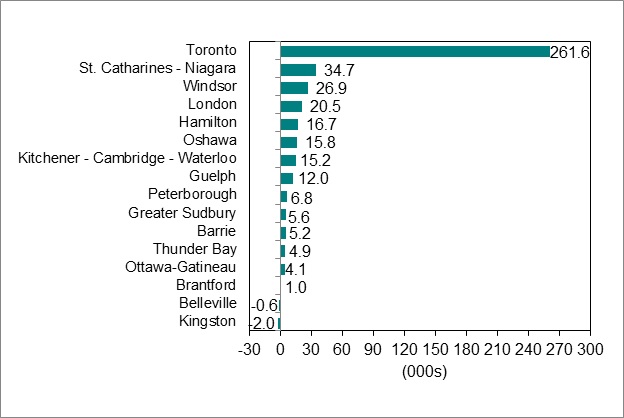
Chart 5 shows employment change for Ontario Census Metropolitan Areas (CMAs) from February 2021 to February 2022.
Source: Statistics Canada, Labour Force Survey, Table 14-10-0380-01, (seasonally adjusted data three-month moving average to reduce volatility caused by small sample size).
In February 2022, employment in fourteen of the sixteen Ontario Census Metropolitan Areas (CMAs) was at or above its February 2021 level, led by Toronto (261,600 or 8.0%) and followed by St. Catharines-Niagara (34,700 or 18.8%) and Windsor (26,900 or 17.4%). The employment level fell in Kingston (-2,000 or -2.4%).
Employment in most of the 16 Ontario CMAs had reached or surpassed pre-COVID February 2020 levels in February 2022, led by Toronto (78,400 or 2.3%), London (22,500 or 8.4%) and Windsor (13,300 or 7.9%).
Barrie (-15,500 or -12.0%), Ottawa-Gatineau (-6,700 or -1.1%) and Belleville (-3,800 or -6.5%) had employment levels that were notably below pre-COVID February 2020 levels.
Lowest and highest unemployment rates in urban centres
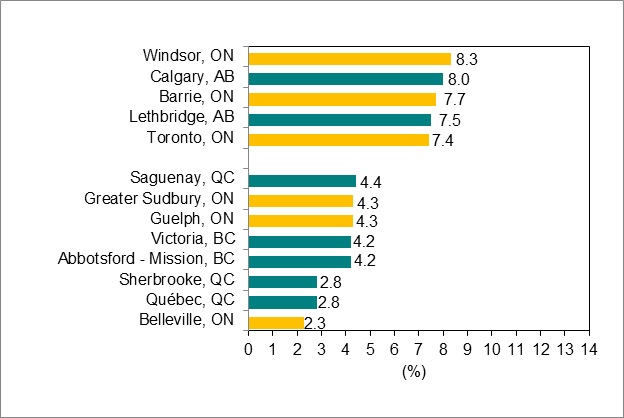
Chart 6 shows Census Metropolitan Areas (CMAs) with highest and lowest unemployment rates in Canada, January 2022.
Source: Statistics Canada, Labour Force Survey, Table 14-10-0380-02, (seasonally adjusted data three-month moving average to reduce volatility caused by small sample size).
Windsor recorded the highest unemployment rate in Canada in February (8.3%), followed by Calgary, Alberta (8.0%) and Barrie (7.7%).
Belleville recorded the lowest unemployment rate in Canada in February (2.3%), followed by Québec City and Sherbrooke, Quebec, which were tied (2.8%).
Download data
Source: Statistics Canada, Labour Force Survey
January 2022 Labour Market Report:
- CSV, Chart 1, employment in Ontario from January 2005 to February 2022, 1KB
- CSV, Chart 2, industries with highest and lowest employment change in Ontario, February 2020 to February 2022, 2KB
- CSV, Chart 3, unemployment rates, Ontario and Canada, January 2005 to February 2022, 2KB
- CSV, Chart 4, number of people unemployed for 27 week or more in Ontario, January 2005 to February 2022, 2KB
- CSV, Chart 5, employment change for Ontario Census Metropolitan Areas (CMAs) from January 2021 to February 2022, 2KB
- CSV, Chart 6, Census Metropolitan Areas (CMAs) highest and lowest unemployment rates, February 2022, 2KB