Labour market report, February 2023
Employment in Ontario increased by 15,600 in February. Get the details in this report.
Quick facts
In February 2023:
- There were 12.7 million people in Ontario aged 15 years or older
- 8.3 million (65.5%) were in the labour force. The labour force increased by 12,600 (0.2%) in February compared to January.
- 7.9 million (62.2%) were employed, up by 15,600 (0.2%) from January.
- Ontario's unemployment rate decreased to 5.1% in February from 5.2% in January and 423,600 people were unemployed, down 3,000 (-0.7%) from January.
Important note
This report is based on the Labour Force Survey (LFS), a household survey carried out by Statistics Canada. February’s LFS results cover labour market conditions during the week of February 12 to 18.
Employment increased in February
Employment in Ontario increased in February by 15,600 (0.2%) to 7,865,300, after increasing by 62,800 (0.8%) in January. Provincial employment has been steadily increasing in recent months, with job gains totalling 150,400 since September 2022.
Employment in Canada increased in February by 21,800 (0.1%), after increasing by 150,000 (0.8%) in January. A total of 20,054,100 people were employed in Canada in February.
Chart 1 shows employment in Ontario from January 2005 to February 2023.
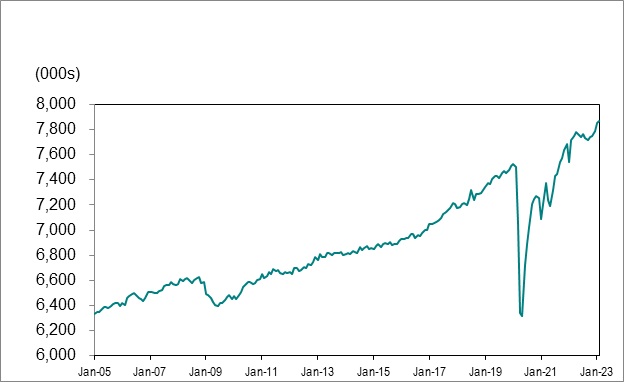
Source: Statistics Canada, Labour Force Survey, Table 14-10-0287-01, (seasonally adjusted data).
Full-time vs. part-time
Full-time employment accounted for all of February’s job gains, increasing by 28,900 (0.4%) positions. Part-time employment decreased by 13,300 (-1.0%) in February.
Employment change by sex and age
Employment increased by 5,500 (0.1%) to 3,741,900 for women in February after increasing by 33,100 (0.9%) in January. Employment increased by 10,100 (0.2%) for men, after increasing by 29,800 (0.7%) in January. Total male employment was 4,123,400 in February.
Youth (aged 15 to 24) employment increased by 10,000 (0.9%) to 1,074,200 in February, after increasing by 5,200 (0.5%) in January. Employment for people aged 25 to 54 rose by 5,400 (0.1%) to 5,088,700, after rising by 52,000 (1.0%) in January. Employment for those aged 55 and older was little changed in February (+100 or 0.0%), following an increase of 5,600 (0.3%) in January.
Employment change by industry
Ontario’s largest industry groups by employment in February included wholesale and retail trade (1,136,100 or 14.4% of total employment), health care and social assistance (961,100 or 12.2%), professional, scientific and technical services (824,400 or 10.5%), manufacturing (797,400 or 10.1%) and finance, insurance, real estate, rental and leasing (684,400 or 8.7%).
Eight of the sixteen major industry groups recorded job gains in February. Wholesale and retail trade (25,700 or 2.3%), public administration (7,600 or 1.7%), professional, scientific and technical services (5,300 or 0.6%), utilities (3,600 or 6.1%) and accommodation and food services (3,400 or 0.8%) led job gains.
Employment declined in eight of the sixteen major industry groups in February. There were notable employment losses in business, building and other support services (-15,900 or -5.3%), information, culture and recreation (-6,800 or -2.1%) and transportation and warehousing (-4,600 or -1.2%).
Chart 2 shows industries by employment change in Ontario, January 2023 to February 2023.
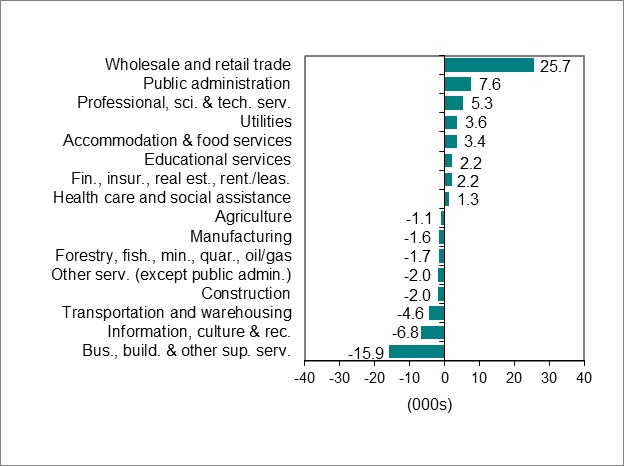
Source: Statistics Canada, Labour Force Survey, Table 14-10-0355-02, (seasonally adjusted data).
Employment change by occupation
Ontario’s largest occupational groups by employment in February included sales and service (1,662,000 or 21.4% of total employment), business, finance and administration (1,319,800 or 17.0%), trades, transport and equipment operators (1,091,900 or 14.1%), occupations in education, law and social, community and government services (924,100 or 11.9%) and management (781,700 or 10.1%).
Nine of the ten major occupational groups in Ontario had net employment gains in the first two months of 2023 when compared to the same period in 2022. Occupations in education, law and social, community and government services (70,200 or 8.8%), trades, transport and equipment operators and related occupations (65,600 or 6.3%) and management occupations (50,600 or 6.3%) led job gains.
Employment losses were recorded for occupations in manufacturing and utilities (-14,900 or -1.7%).
Chart 3 shows occupations by employment change in Ontario, February 2022 (year-to-date) to February 2023 (year-to-date).
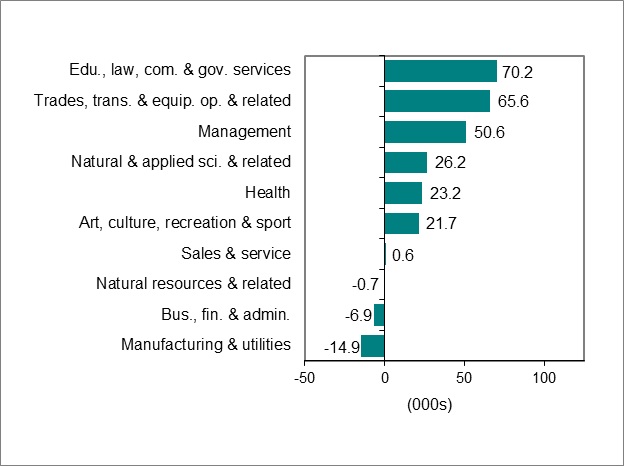
Source: Statistics Canada, Labour Force Survey, Table 14-10-0421-01, (data unadjusted for seasonality).
Employment change in urban centres
In February 2023, employment in twelve of the sixteen Ontario Census Metropolitan Areas (CMAs) was at or above its February 2022 level, led by Toronto (40,200 or 1.1%) and followed by Ottawa-Gatineau (38,200 or 4.9%) and Barrie (22,200 or 19.5%).
Employment losses were recorded in Peterborough (-1,500 or -2.4%) and Hamilton (-1,200 or -0.3%).
Employment was little changed in Guelph (-500 or -0.5%) and Thunder Bay (-400 or -0.6%) in February.
Chart 4 shows employment change for Ontario Census Metropolitan Areas (CMAs) from February 2022 to February 2023.
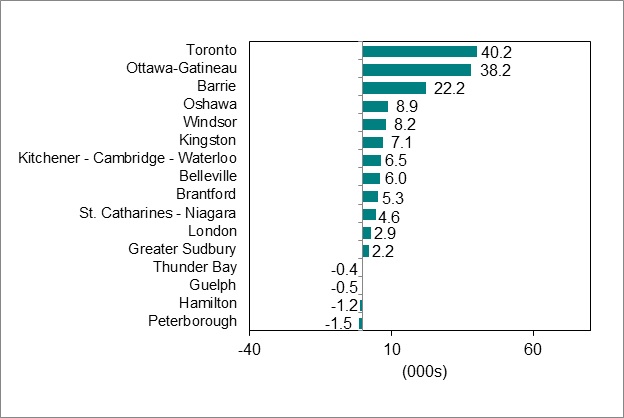
Source: Statistics Canada, Labour Force Survey, Table 14-10-0380-01, (seasonally adjusted data three-month moving average to reduce volatility caused by small sample size).
Unemployment rate decreased to 5.1%
Ontario’s unemployment rate was 5.1% in February, down from 5.2% in January. February’s rate matched July 2022 and November 1989 as the lowest recorded rate since October 1989 (4.7%). February’s unemployment rate was below the rate from February 2022 (5.7%), when public health measures including capacity limits and closures were eased in Ontario.
Canada’s unemployment rate was 5.0% in February, matching the rate from January and below the rate from February 2022 (5.4%). The national unemployment rate remained slightly above the record low of 4.9% reached in June and July 2022.
Chart 5 shows unemployment rates, Ontario and Canada, January 2005 to February 2023.
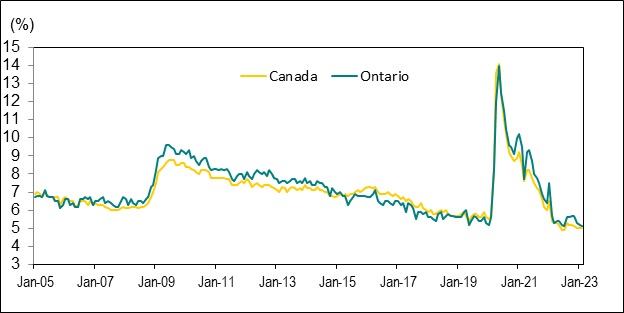
Source: Statistics Canada, Labour Force Survey, Table 14-10-0287-01, (seasonally adjusted data).
Unemployment rate by sex, age, visible minority status and Indigenous group
The unemployment rate for women was 5.3% in February, matching the rate from January. The rate for men was 5.0% in February and was also unchanged from January.
For individuals aged 15 to 24, the unemployment rate rose to 11.0% in February from 10.6% in January. The unemployment rate for individuals aged 25 to 54 decreased to 4.2% in February from 4.3% in January. The unemployment rate for those aged 55 and older decreased to 3.8%, down from 4.2% in January.
In Ontario, the unemployment rate among population groups designated as visible minorities was estimated at 6.2% in February compared to a 4.4% rate for those who are not visible minorities and did not identify as Indigenous (data are three-month moving averages for the population aged 15 years and over and are not adjusted for seasonality).
The unemployment rate for Ontario’s Indigenous population was estimated at 7.2% in February compared to a 5.0% rate for the non-Indigenous population. The Indigenous population includes First Nations people living off reserve (6.3%) and individuals who identify as Métis (8.0%) (data are three-month moving averages for the population aged 15 years and over and are not adjusted for seasonality).
Unemployment rate by urban centre
In February, the average unemployment rate increased from January in six of the sixteen Ontario Census Metropolitan Areas (CMAs). The largest increases were seen in Peterborough (3.4% in January to 4.2% in February), Hamilton (5.2% to 5.6%) and Ottawa-Gatineau (3.8% to 4.1%).
Eight CMAs had average unemployment rates that decreased from January to February, led by Brantford (6.8% in January to 5.8% in February) and followed by Windsor (6.2% to 5.6%) and Belleville (6.1% to 5.5%).
The average unemployment rate was unchanged in St. Catharines-Niagara (4.3%) and Thunder Bay (4.1%) in February.
Chart 6 shows the average unemployment rate for Ontario Census Metropolitan Areas (CMAs) in February 2023.
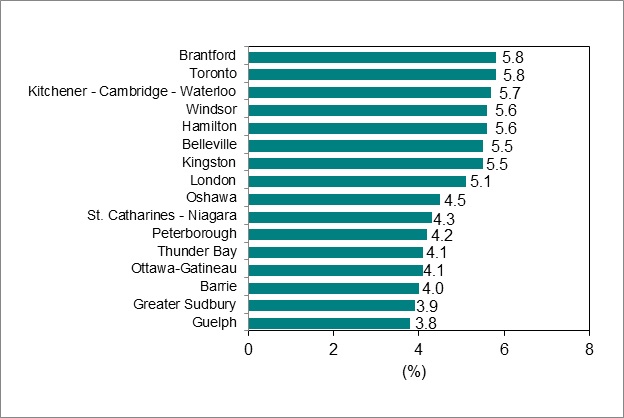
Source: Statistics Canada, Labour Force Survey, Table 14-10-0380-01, (seasonally adjusted data three-month moving average to reduce volatility caused by small sample size).
Long-term unemployment
In February, an estimated 68,500 Ontarians or 16.2% of all unemployed people were unemployed for 27 weeks or longer (long-term unemployed). This compared to 73,800 Ontarians or 17.3% of all unemployed people in January and 85,800 or 18.6% of all unemployed people a year earlier in February 2022. The long-term unemployed share in February was the lowest seen in Ontario since September 2022 (15.0%).
The average time in unemployment was 17.7 weeks in February, slightly above the average in January (17.5 weeks) but well below the average in February 2022 (20.6 weeks).
Chart 7 shows Ontario’s long-term unemployment (27 weeks or more) as a percentage of total unemployment, January 2005 to February 2023.
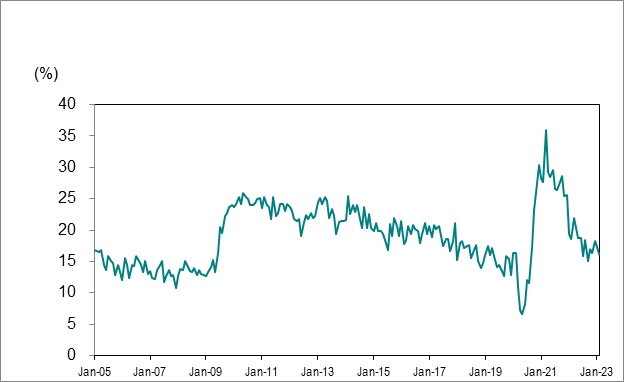
Source: Statistics Canada, Labour Force Survey, Table 14-10-0342-01, (seasonally adjusted data).
Average hourly wages by sex, age and industry
Important note:
Average hourly wage rates are reported without adjusting for the rate of inflation.
The average hourly wage rate in Ontario for employees was $34.00 in February, above the average rate across Canada ($33.16). Ontario’s average hourly wage rate in February rose by 4.8% on a year-over-year basis (by $1.57 from $32.43 in February 2022), above the 3.6% increase from January. This was the second consecutive month where average hourly wage growth was below 5.0% on a year-over-year basis.
February’s wage growth (4.8%) was below the growth seen in the Ontario Consumer Price Index (CPI) as of January (5.6%). The CPI is a measure of inflation that represents changes in prices for goods and services as experienced by consumers.
Chart 8 shows the year-over-year percentage change in Ontario’s average hourly wage rate and the Ontario Consumer Price Index (CPI), January 2015 to February 2023.
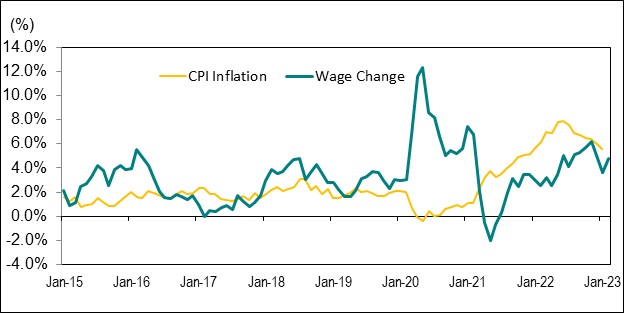
Source: Statistics Canada, Labour Force Survey, Table 14-10-0063-01 (data unadjusted for seasonality).
The average hourly wage rate was $31.45 for women in February, rising by 5.1% ($1.53) from $29.92 a year earlier. For men, the average hourly wage rate was $36.52, an increase of 4.7% ($1.64) from $34.88 in February 2022.
For youth aged 15 to 24, the average hourly wage rate was $20.15 in February, an increase of 4.8% ($0.92) from $19.23 in February 2022. The average hourly wage rate for individuals aged 25 to 54 rose to $36.67 in February, up 6.0% ($2.07) from $34.60 a year earlier. The average hourly wage rate for those aged 55 and older increased by 2.0% ($0.70) to $35.38 in February from $34.68 a year earlier.
In February, the industries with the largest increases in average hourly wage rates compared to a year earlier were:
- Forestry, fishing, mining, quarrying, oil and gas: +20.6% ($8.22) to $48.07
- Professional, scientific and technical services: +11.3% ($4.65) to $45.67
- Agriculture: +8.5% ($1.86) to $23.84
Industries with decreases in average hourly wage rates in February compared to a year earlier were:
- Utilities: -1.0% (-$0.49) to $50.40
- Other services (except public administration): -0.7% (-$0.21) to $28.85
- Educational services: -0.2% (-$0.09) to $38.78
Changes in average hourly wages by industry are the result of multiple factors, including wage growth and shifts in the composition of employment by job tenure and occupation.
Download data
Source: Statistics Canada, Labour Force Survey
February 2023 Labour Market Report:
- CSV, Chart 1, employment in Ontario from January 2005 to February 2023, 1KB
- CSV, industries with highest and lowest employment change in Ontario, January 2023 to February 2023, 2KB
- CSV, Chart 3,employment change for occupations in Ontario from February 2022 (year-to-date) to February 2023 (year-to-date), 2KB
- CSV, Chart 4, employment change for Ontario Census Metropolitan Areas (CMAs) from February 2022 to February 2023, 2KB
- CSV, Chart 5, unemployment rates, Ontario and Canada, January 2005 to February 2023, 2KB
- CSV, Chart 6, average unemployment rates for Ontario Census Metropolitan Areas (CMAs), February 2023, 1KB
- CSV, Chart 7, Ontario’s long-term unemployed (27 weeks or more) as a percentage of total unemployment, January 2005 to February 2023, 2KB
- CSV, Chart 8, year-over-year percentage change in Ontario’s average hourly wage rate and the Ontario Consumer Price Index (CPI), January 2015 to February 2023, 2KB