Labour market report, January 2021
Employment in Ontario declined by 153,500 in January. Get the details in this report.
Quick facts
In January 2021:
- There were 12.3 million people in Ontario aged 15 years or older
- 7.9 million (64.2%) were in the labour force, including those who had worked, were unemployed or did not work at their job, which includes people on temporary layoff because of ongoing COVID‑19-related business closures. The labour force declined in January compared to December (−123,400 or −1.5%).
- 7.1 million (57.7%) were employed, down 153,500 jobs (−2.1%) from December.
- Ontario's unemployment rate increased to 10.2% in January from 9.6% in December and 802,400 people were unemployed, up 3.9% (30,100) from December.
Important note:
This report is based on the Labour Force Survey (LFS), a household survey carried out by Statistics Canada. January’s LFS results covers labour market conditions as of the week of January 10 to 16.
Ontario’s mandatory closure of non-essential businesses and other measures aimed at addressing the impact of COVID‑19 took effect on March 24.
A provincewide shutdown has been in in effect since December 26, 2020, superseding five levels of public health restrictions that were in effect across the province on a regional basis.
The types of businesses that were deemed essential and remained open during the COVID‑19 economic shutdown and the types of businesses that reopened at the different stages of the Ontario government’s plan for reopening the economy should be considered in the context of information provided in this report.
Employment declined in January
Employment declined in January (−153,500 or −2.1%) after being unchanged in December. This was the first time since May that Ontario recorded job losses.
In January, employment in Ontario was 7,085,500 and was 405,600 or 5.4% lower than its February 2020 pre-COVID‑19 level.
The total number of hours worked in Ontario in January 2021 (at all jobs) was down by 7.0% compared to January 2020 (data are not seasonally adjusted).
Chart 1 shows employment in Ontario from January 2005 to January 2021.
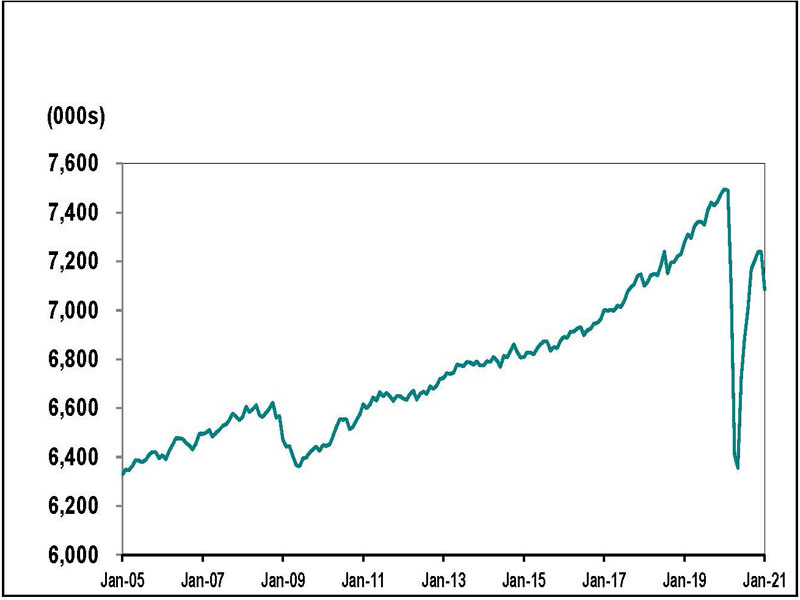
Source: Statistics Canada, Labour Force Survey, Table 14-10-0287-01, (seasonally adjusted data).
Full-time vs. part-time
Part-time jobs accounted for the decline (−152,700 or −12.0%) in January. Full-time jobs remained unchanged (−900 or 0%).
Employment change by sex and age
Employment among women in Ontario fell by 2.1% (−71,700) between December and January, the same percentage decline as employment losses among men (−2.1% or −81,800).
Women’s employment level remains 6.2% (220,200) lower than in February 2020, while January’s employment level for men was 4.7% (185,400) lower compared to February 2020.
Youth (those aged 15 to 24) bore the brunt of job losses in January, with their employment falling between December and January (−90,100 or −9.6%) after increasing between November and December (11,600 or 1.6%). Youth employment remains further from pre-COVID‑19 February 2020 levels than other major age groups (−168,700 or −16.5%).
Employment for people aged 25 to 54 declined by 51,700 (−1.1%) in January following a decrease in December (−35,700 or −0.8%). Employment for those aged 55 and older declined by 11,700 (−0.7%) jobs in January, following an increase of 24,800 (1.5%) in December.
Employment in Canada declined by 212,800 (−1.2%) to 18,272,000 in January and is now 858,300 (4.5%) below its February 2020 level.
Employment change by industry
The government’s restrictions on the types of businesses that were deemed essential and other measures aimed at addressing the impact of COVID‑19-19 should be considered in the context of employment change by sector.
In January, employment in Ontario was furthest from pre-COVID‑19 February 2020 levels in accommodation and food services (−35.4% or −156,800), business, building and other support services (−17.0% or −55,100), agriculture (−11.9% or −9,400), information, culture and recreation (−11.3% or −34,000) and wholesale and retail trade (−10.5% or −115,600).
Employment was notably above pre-COVID‑19 February 2020 levels in finance, insurance, real estate, rental and leasing (5.8% or 34,900), professional, scientific and technical services (4.8% or 31,900) and manufacturing (1.6% or 12,200).
Chart 2 shows industries by employment change in Ontario, February 2020 to January 2021.
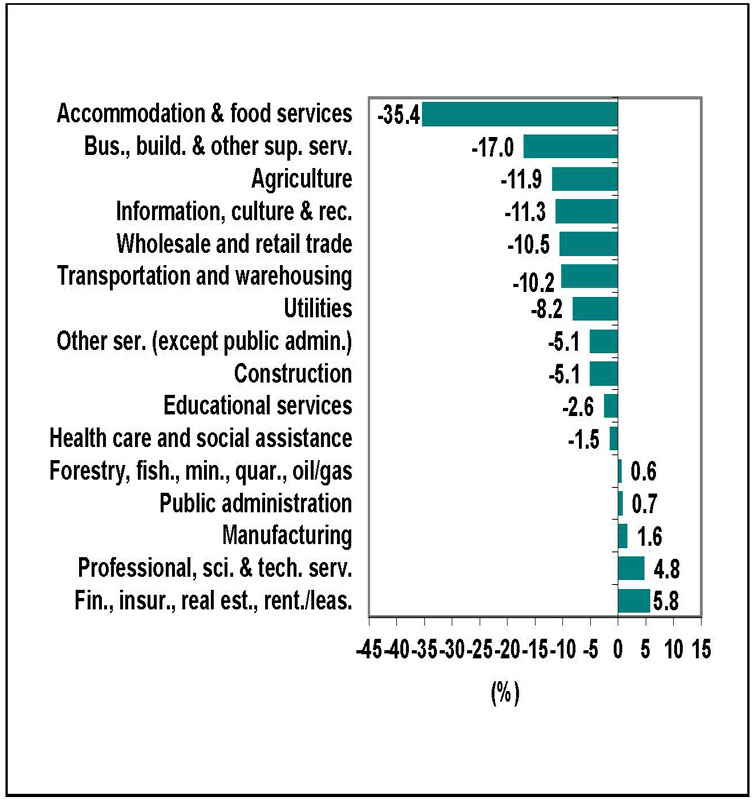
Source: Statistics Canada, Labour Force Survey, Table 14-10-0355-02, (seasonally adjusted data).
Employment in 2020
On an annual basis, employment in Ontario fell by 355,300 (−4.8%) in 2020 compared to an increase of 203,600 (2.8%) net new jobs in 2019. The employment decline in 2020 was the largest decline on record.
Full-time jobs fell by 202,900 (−3.4%) and part-time jobs fell by 152,300 (−11.1%) in 2020.
Nationally, employment in Canada declined by 986,400 (−5.2%) in 2020, the largest annual decline on record. This compared with employment growth of 417,600 (2.2%) in 2019.
Unemployment rate increased to 10.2%
Chart 3 shows unemployment rates, Ontario and Canada, January 2005 to January 2021.
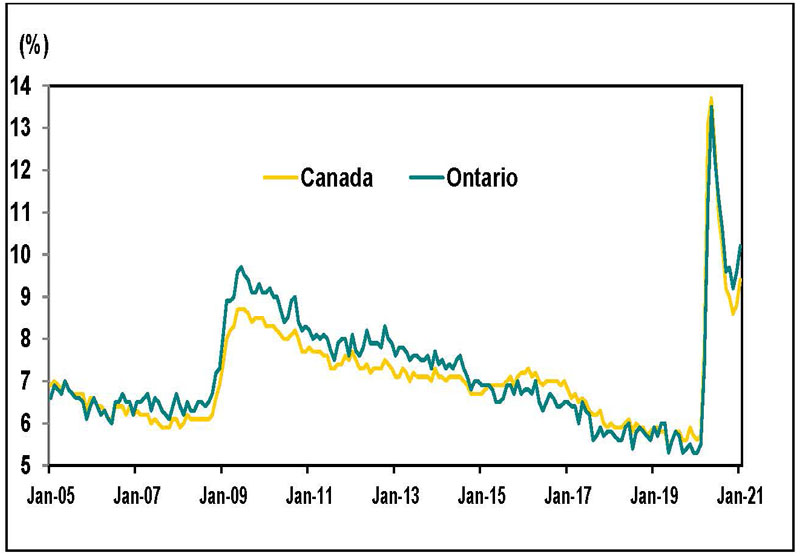
Source: Statistics Canada, Labour Force Survey, Table 14-10-0287-01, (seasonally adjusted data).
Ontario’s unemployment rate in January was 10.2%, up from 9.6% in December, the largest percentage point increase since May. The unemployment rate in February 2020 was 5.5%.
Canada’s unemployment rate increased to 9.4% in January from 8.8% in December. Canada’s unemployment rate in February 2020 was 5.7%.
Unemployment rate by sex and age
The unemployment rate for women was 10.5% in January, up from 10.3% in December, while the rate for men increased to 9.9% from 9.0% during the period. Women remain further behind their pre-COVID‑19 employment level than men.
In Ontario, the unemployment rate among population groups designated as visible minorities was estimated at 12.1% in January in comparison to a 9.1% rate for non-visible minorities and those that did not identify as Indigenous (data are for the population aged 15 to 69 and are not adjusted for seasonality).
For individuals aged 15 to 24, the unemployment rate increased to 21.8% in January from 21.2% in December and remains the highest among all age groups. The youth unemployment rate reached a record high of 30.0% in May.
The unemployment rate for individuals aged 25 to 54 was 8.3% in January, up from 7.6% in December, mirroring the rate for those aged 55 and older during this period.
Unemployment rate in 2020
On an annual basis, Ontario’s unemployment rate was 9.6% in 2020, up from 5.6% in 2019 and matching the highest unemployment rate recorded since 1994.
Canada’s unemployment rate was 9.5% in 2020, up from 5.7% in 2019 and matching the highest unemployment rate since 1996.
Long-term unemployment
In January, an average of 225,800 Ontarians or 28.1% of all unemployed people were unemployed for 27 weeks or longer (long-term unemployed). This was down from 245,000 in December and 3.3 times the pre-COVID‑19 February 2020 level of 68,800.
The average time in unemployment increased to 21.9 weeks in January 2021 from 15.9 weeks in February.
Chart 4 shows the number of people unemployed for 27 week or more in Ontario, January 2005 to January 2021.
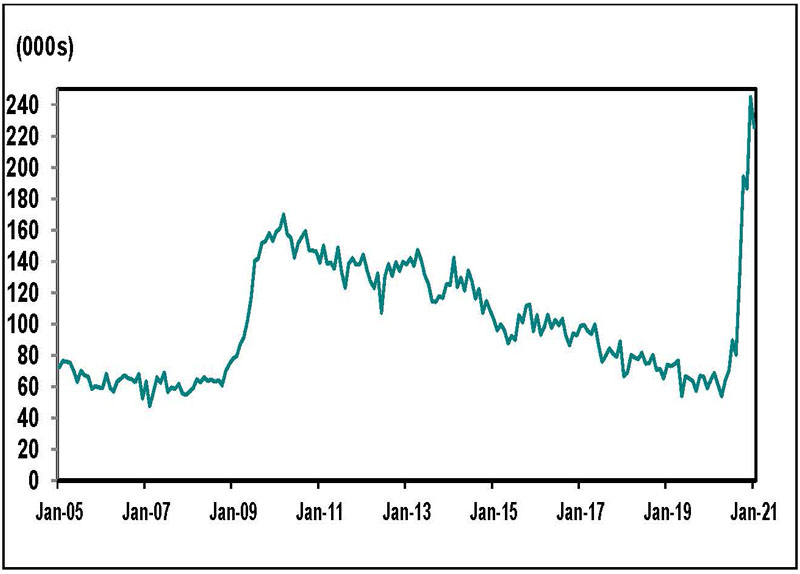
Source: Statistics Canada, Labour Force Survey, Table 14-10-0342-01, (seasonally adjusted data).
Employment and unemployment in urban centres
Employment change in urban centres
Chart 5 shows the rate of employment change for Ontario Census Metropolitan Areas (CMAs) from December 2020 to January 2021.
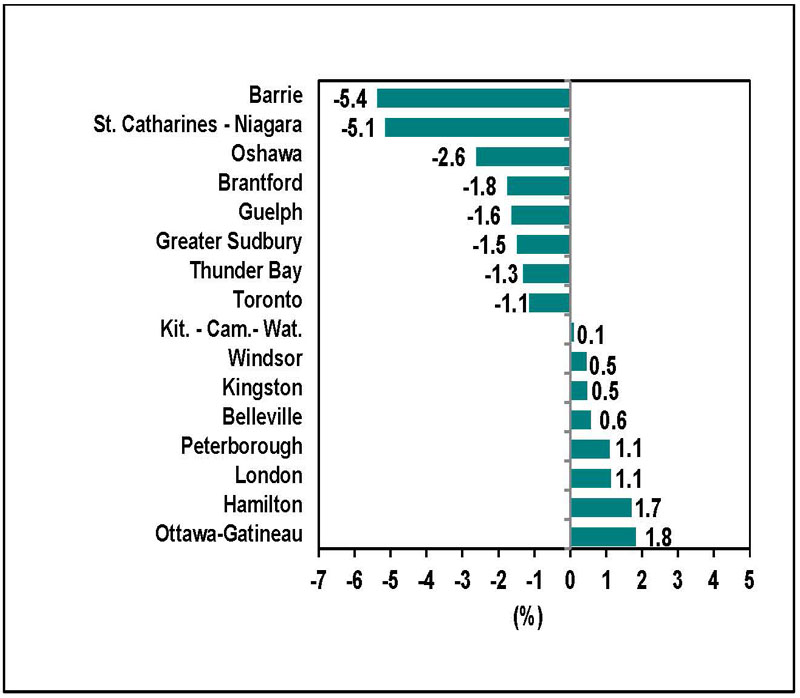
Source: Statistics Canada, Labour Force Survey, Table 14-10-0294-01, (seasonally adjusted data three-month moving average to reduce volatility caused by small sample size).
Employment levels fell in eight of the sixteen Ontario CMAs between December and January. Barrie (−5.4% or −6,000) recorded the highest percentage employment decline, followed by St. Catharine-Niagara (−5.1% or −10,100) and Oshawa (−2.6% or −5,600).
Ottawa-Gatineau (1.8% or 10,200), Hamilton (1.7% or 6,700), London (1.1% or 3,000) and Peterborough (1.1% or 600) recorded the largest percentage increase in employment.
Employment in all Ontario’s urban centres remained below February 2020 levels in January, led by Barrie (−16.3 or −20,700), St. Catharine-Niagara (−10.2% or −21,100) Greater Sudbury (−8.2% or −7,200), Belleville (−8.2% or −4,800) and Kitchener-Cambridge-Waterloo (−5.5% or −18,300).
Lowest and highest unemployment rates in urban centres
Chart 6 shows Census Metropolitan Areas (CMAs) with highest and lowest unemployment rates in Canada, January 2021.
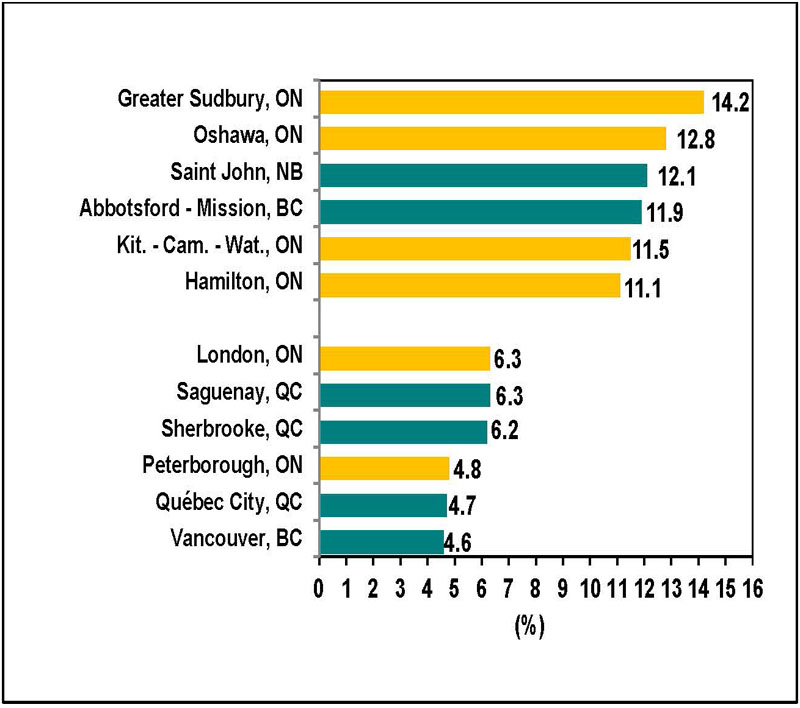
Source: Statistics Canada, Labour Force Survey, Table 14-10-0294-01, (seasonally adjusted data three-month moving average to reduce volatility caused by small sample size).
Ontario Census Metropolitan Areas (CMAs) recorded some of the highest unemployment rates in Canada in January. Greater Sudbury recorded the highest unemployment rate in Canada in January (14.2%), followed by Oshawa (12.8%).
Peterborough recorded the lowest unemployment rate in Ontario in January (4.8%), while Vancouver had the lowest unemployment rate in Canada (4.6%).
Download data
Source: Statistics Canada, Labour Force Survey
January 2021 Labour Market Report:
- CSV, Chart 1, employment in Ontario from January 2005 to January 2021, 1 Kb
- CSV, Chart 2, industries with highest and lowest employment change in Ontario, February 2020 to January 2021, 2 Kb
- CSV, Chart 3, unemployment rates, Ontario and Canada, January 2005 to January 2021, 2 Kb
- CSV, Chart 4, number of people unemployed for 27 week or more in Ontario, January 2005 to January 2021, 2 Kb
- CSV, Chart 5, the rate of employment change for Ontario Census Metropolitan Areas (CMAs) from December 2020 to January 2021, 12 Kb
- CSV, Chart 6, Census Metropolitan Areas (CMAs) highest and lowest unemployment rates, January 2021, 2 Kb