Labour market report, March 2020
Employment in Ontario fell by a record 402,800 jobs in March. Get the details in this report.
Quick facts
In March 2020:
- There were 12.3 million people in Ontario aged 15 years or older
- 7.7 million (63%) were either working or actively looking for work, down by 253,600 or 3.2% compared to February
- 7.2 million (58%) were employed, down by a record 402,800 jobs or 5.3% from February
- Ontario's unemployment rate increased to 7.6% from 5.5% (585,600 people were unemployed, up by 149,200 or 34% from February)
Important note: This report is based on the Labour Force Survey (LFS), – a household survey carried out by Statistics Canada. The March 2020 LFS was conducted between March 22 and March 31 and captured employment status of individuals for the seven-day reference period between March 15 and March 21. The March survey only partially captures the labour market impacts currently being felt from the COVID-19 pandemic, as the mandatory closure of non-essential businesses and other measures aimed at addressing impact of COVID-19 came into effect after last month’s survey reference period.
Employment fell in March
Employment in Ontario fell by a record 402,800 net jobs in March after little change in February (−3,200). Ontario’s share of national job losses (40%) was largely in line with the province’s share of employment in Canada.
All sectors recorded job losses, led by accommodation and food services (−119,600), wholesale and retail trade (−87,600) and health care and social assistance (−56,100).
Chart 1 shows employment in Ontario from January 2015 to March 2020.
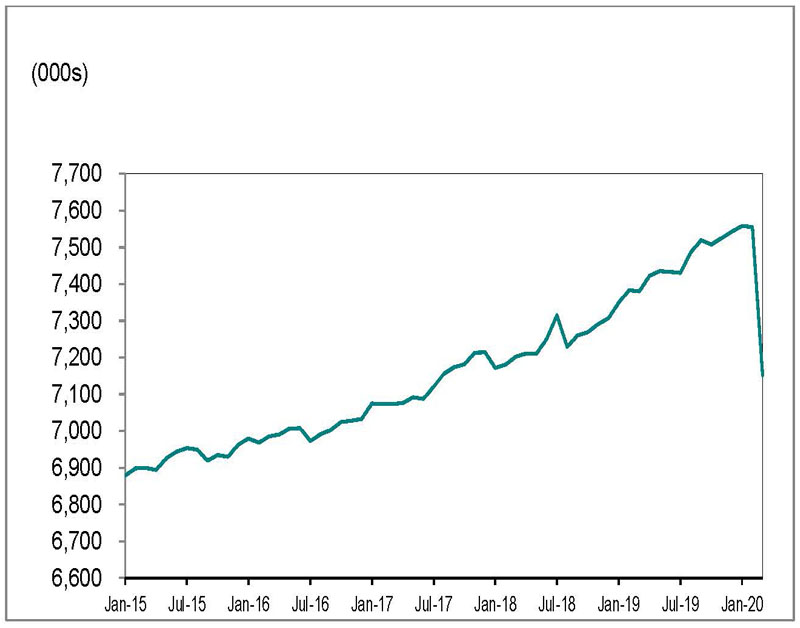
Source: Statistics Canada, Labour Force Survey, Table 14-10-0287-01, (seasonally adjusted data).
Full-time vs. part-time
Full-time employment declined by 248,500, while part-time employment declined by 154,300.
Employment decrease by age
Youth employment (those aged 15 to 24) fell by 158,800 in March, after decreasing by 7,600 jobs in February. Youth were disproportionally impacted by March job losses.
Employment for people aged 25 to 54 declined by 179,200 in March, compared to February. Employment for those aged 55 and older fell by 64,800 jobs.
Employment in Canada declined by more than one million in March (1,010,700), the largest loss on record. Employment increased by 30,300 in February.
Unemployment rate increased to 7.6%
Chart 2 shows unemployment rates, Ontario and Canada, January 2015 to March 2020.
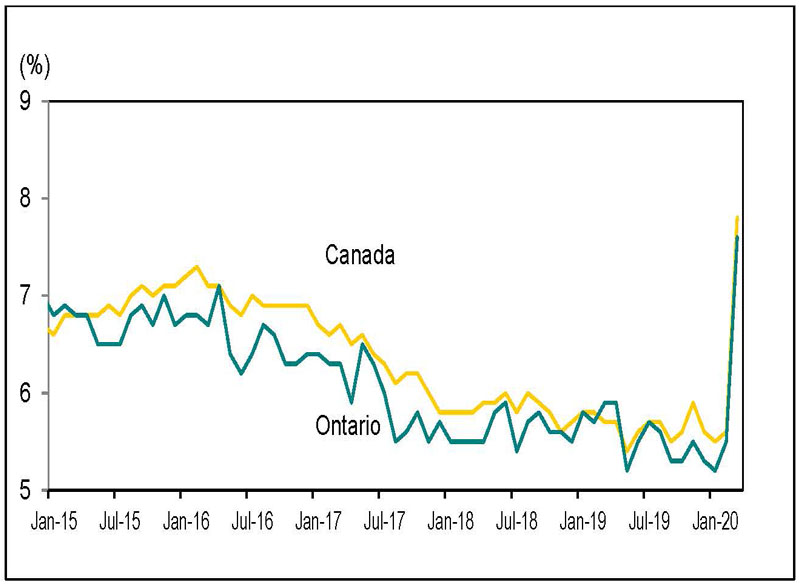
Source: Statistics Canada, Labour Force Survey, Table 14-10-0287-01, (seasonally adjusted data).
Ontario’s unemployment rate increased to 7.6% in March from 5.5% in February, the largest monthly percentage point increase since comparable data became available in 1976. The unemployment rate in Ontario had been below 6% since August 2017.
Canada’s unemployment rate increased to 7.8% in March from 5.6% in February.
Unemployment rate by age
For individuals aged 15 to 24, the unemployment rate was 15.8% in March, up from 11.0% in February and the highest rate since December 2014 (15.9%).
The unemployment rate for individuals aged 25 to 54 increased to 6.7% in March from 4.8% in February and to 5.4% from 3.9% for those aged 55 and older.
Lowest and highest unemployment rates
Chart 3 shows Census Metropolitan Areas (CMAs) with highest and lowest unemployment rates in Canada, March 2020.
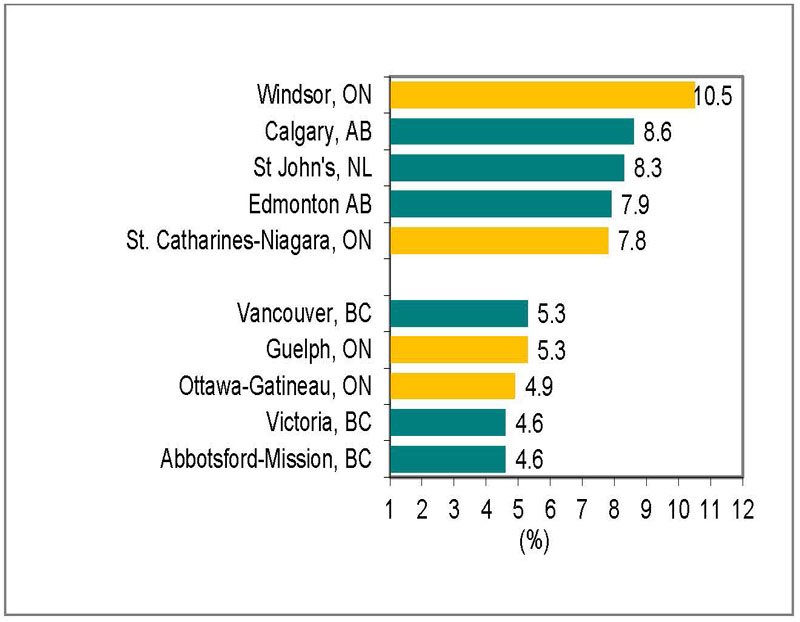
Source: Statistics Canada, Labour Force Survey, Table 14-10-0294-01, (seasonally adjusted data three-month moving average to reduce volatility caused by small sample size).
Windsor recorded the highest unemployment rate in Canada in March (10.5%), while St. Catharines-Niagara had the fifth highest rate (7.8%).
Ottawa-Gatineau recorded the lowest unemployment rate in Ontario in March (4.9%), while Abbotsford-Mission and Victoria, British Columbia were tied for the lowest unemployment rate in Canada (4.6%)
Year-over-year comparisons
Over the first three months of 2020, employment in Ontario increased by 68,100 net jobs for adults 25 years and older compared to the first three months of 2019. This average is largely bolstered by increases in January and February.
Employment increase and decrease by education level
Chart 4 shows Ontario employment change by highest level of education attained, aged 25 and older, March 2019 year-to-date to March 2020 year-to-date.
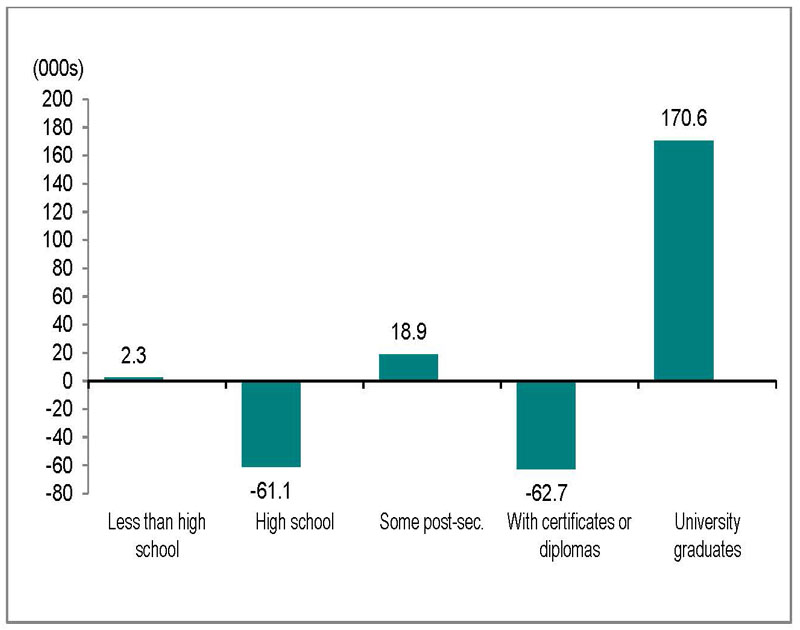
Source: Statistics Canada, Labour Force Survey, Table 14-10-0019-01, unadjusted data
Adults with a university degree led gains with 170,600 net new jobs.
Individuals with less than high school and some postsecondary education recorded job gains of 2,300 and 18,900, respectively.
People with a postsecondary certificate or diploma recorded job losses of 62,700, as did those with high school education (61,100).
Unemployment rate by education level
The unemployment rate for adults aged 25 and older with postsecondary education credentials was 5.0% in the first three months of 2020, up from 4.4% a year earlier. The unemployment rate for adults without postsecondary education credentials was 6.4%, down from 6.5% compared to a year ago.
Employment increase and decrease by occupation
Chart 5 shows Ontario employment change by occupation, March 2019 year-to-date to March 2020 year-to-date.
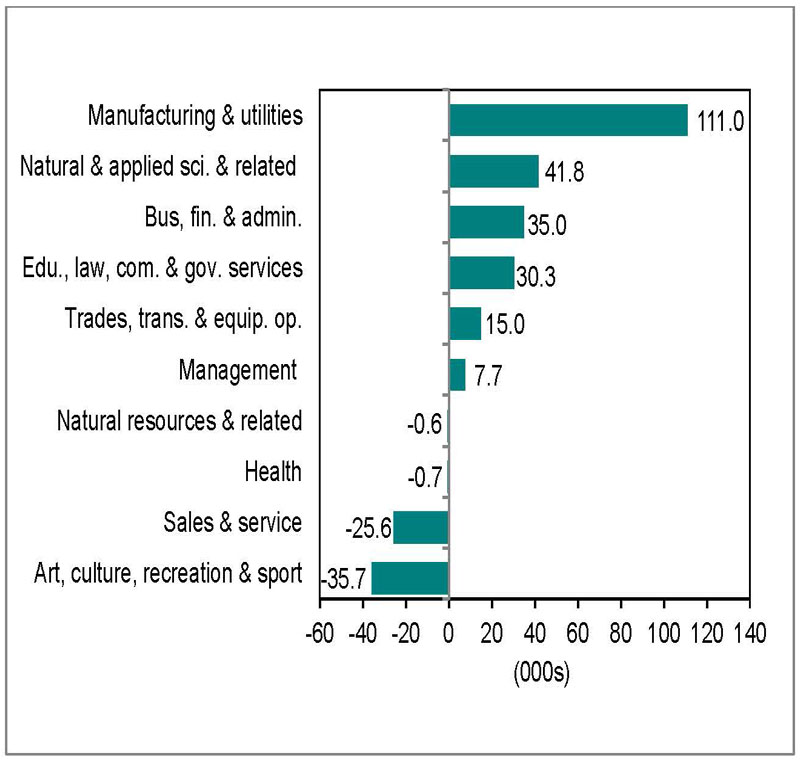
Source: Statistics Canada, Labour Force Survey, Table 14-10-0297-01, unadjusted data.
Six of the ten major occupational groups in Ontario had net employment gains in first three months of 2020 compared to a year ago, propped up by gains in the first two months.
Learn more about the National Occupational Classification (NOC) system.
These occupations gained the most jobs:
- manufacturing and utilities (111,000)
- natural and applied sciences and related (41,800)
- business, finance and administration (35,000)
These occupations lost jobs:
- art, culture, recreation and sport (35,700)
- sales and service (25,600)
Long-term unemployment
Chart 6 shows Ontario's long-term unemployed (27 weeks or more) as a percentage of total unemployment, March 2011 year-to-date March 2020 year-to-date
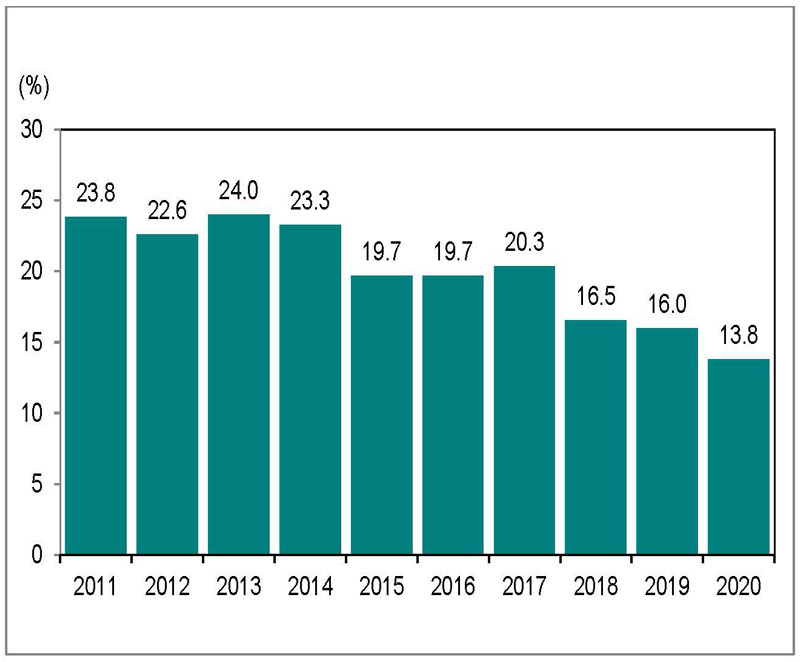
Source: Statistics Canada, Labour Force Survey, 14-10-0342-01, unadjusted data.
Over the first three months of 2020, an average of 67,300 people were unemployed for 27 weeks or longer, or long-term unemployed. This was down from 73,400 a year earlier.
Long-term unemployed individuals accounted for 13.8% of the total number of unemployed people in first three months of 2020. This was down from 16.0% a year earlier due to a large increase in total unemployment in March.
Average time in long-term unemployment
The average time in unemployment decreased to 15.4 weeks over the first three months of 2020 from 16.6 weeks a year earlier, as a significant increase in unemployment in March 2020 reduced the average.
Download data
Source: Statistics Canada, Labour Force Survey
March 2020 Labour Market Report:
- CSV, Chart 1, employment in Ontario from January 2015 to March 2020, 1 Kb
- CSV, Chart 2, unemployment rates, Ontario and Canada, January 2015 to March, 2 Kb
- CSV, Chart 3, Census Metropolitan Areas (CMAs) highest and lowest unemployment rates, 2 Kb
- CSV, Chart 4, Ontario employment change by highest level of education, aged 25 and older, 99 Kb
- CSV, Chart 5, Ontario employment change by occupation, 12 Kb
- CSV, Chart 6, Ontario's long-term unemployed, 15 Kb