Ontario’s Early Years and Child Care Annual Report 2020
Ontario’s Early Years and Child Care Annual Report 2020 describes the early years and child care system, key data and measures for child care and indicators under the Canada-Ontario Early Learning and Child Care Agreement.
Introduction
We know the integral role that the early years and child care system plays in supporting families and giving every child the best possible start in life. That is why the provincial government is committed to building a high quality, inclusive, and affordable early years and child care system.
To enable a better understanding of the early years and child care system, this report provides an annual snapshot and year-over-year trends of Ontario’s early years and child care sector. In addition, the report supports the provincial government’s commitment under the Canada-Ontario Early Learning and Child Care Agreement to publish its progress.
Most of the data presented in this report was collected between March 2019 and March 2020. In early 2020, COVID‑19 arrived in Canada, affecting the lives of all Ontarians. It has created significant health and economic hardship for families. It has also had a major economic impact on the child care sector.
While the majority of the data in this report is current up to March 31, 2020, the numbers presented reflect the period immediately prior to the emergency closure of child care centres in the province that resulted from the initial outbreak of COVID‑19. Due to concerns from the licensed child care sector about the impact of the outbreak on child care services and the temporary emergency closure, the Ministry of Education did not conduct the annual survey of licensed child care centres and home child care agencies in 2020. Consequently, some sections of the report present data from 2019, as that is the most recent data available.
Prior to the COVID‑19 outbreak, Ontario’s early years and child care system continued to grow. In the year ending March 31, 2020:
- The number of licensed child care centres increased by almost 1% to 5,565 centres, of which more than 3,000 centres were located in publicly funded schools.
- The number of licensed child care spaces grew by 16,206 spaces to 462,802 spaces, representing an increase of 4%. All age groups have seen an increase in spaces: a 4% increase for infants, toddlers, Kindergarten, and school age children; a 3% increase for preschool children; and an increase from 418 to 692 spaces for the “family age group”.
footnote 1 - A total of 131 home child care agencies were in operation, with 8,296 approved homes affiliated with these agencies.
- More than 2,000 individuals were approved to receive grants to support them in obtaining an early childhood education diploma.
In response to the initial wave of the COVID‑19 pandemic, the provincial government took swift action to support families and the child care system during this unprecedented and challenging time by:
- ordering the temporary closure of all child care centres and indoor recreational facilities, including EarlyON Child and Family Centres, to help stop the spread of COVID‑19
- continuing to fund child care providers and EarlyON Child and Family Centres to help them remain financially sustainable
- establishing emergency child care to support health care and other frontline workers free of charge during the closure period by opening 160 emergency child care centres and 44 homes, serving an average of approximately 3,000 children
- providing virtual support services and other supports to families during the closure period through the EarlyON centres
- prohibiting child care providers from charging child care fees to parents when care was not being provided during the closure, up to August 31, 2020
- helping parents pay for the extra costs associated with school and child care closures during the COVID‑19 outbreak with the Support for Families program, in which parents received a one-time payment of $200 per child up to 12 years of age, and $250 for those with special needs up to 21 years of age
- supporting child care centres in reopening once strict health and safety measures had been met, based on guidance documents developed in partnership with provincial health and labour ministries as well as federal, municipal, and child care sector partners
- providing medical masks and face shields to early years and child care programs to support a healthy and safe reopening
- supporting the child care sector financially as it transitions to reopening and serving families.
As of September 30, 2020, 5,158 licensed child care centres and 131 licensed home child care agencies have reopened following the emergency closures resulting from the COVID‑19 outbreak. This represents 93% of the 5,565 child care centres and 131 home child care agencies that were licensed as of March 31, 2020.
In 2019-20, the Ministry of Education also continued meeting with stakeholders to understand the strengths and opportunities in the legislative framework laid out in the Child Care and Early Years Act, 2014 (CCEYA). The CCEYA came into effect on August 31, 2015. It was designed to strengthen compliance, health, and safety in child care settings across the province. As laid out in the CCEYA, the Ministry of Education was required to conduct a review of the legislation within five years of its coming into effect.
The review included a consultation with parents and with early years and child care stakeholders. The ministry held 20 stakeholder sessions and received 45 submissions. We also launched two public surveys (one for parents and one for sector partners) that received more than 15,000 responses. The information received through this consultation will support the review of the CCEYA and help us improve the system to better meet the needs of families and child care providers.
Early years and child care programming provides critical support for children’s learning and development, and for enabling parents to return to work. A stable and accessible child care system will be crucial for Ontario’s recovery following the COVID‑19 outbreak.
In 2020-21, the provincial government will continue to support families and the early years and child care system by:
- investing more than $2 billion in early years and child care funding, including approximately $375 million for the Ontario Child Care Tax Credit
- engaging with our sector partners on how to ensure the health and safety of families and the viability of our critical early years and child care programs, as we continue to plan for the period following the COVID‑19 outbreak
- providing child care and EarlyON programs with funding through the Safe Restart Agreement with the federal government
- supporting families in need of fee subsidies and providing funding to municipalities for this purpose
- creating up to 30,000 child care spaces in schools over five years – including up to 10,000 spaces in new schools
- allocating $208 million to municipalities to support wage enhancements for eligible child care professionals
- reducing red tape and administrative burden for the early years and child care sector.
While the child care landscape has shifted since March 2020 and the data may not accurately reflect the real impact that the COVID‑19 pandemic continues to have on the provision of services, this report provides important information about overall trends in the licensed child care system.
The ministry is supporting the reopening of child care by putting the health and safety of children and families first and ensuring the sustainability of this vital sector. We remain steadfast in building a flexible, high quality system that is accessible, affordable, and inclusive.
Part 1: Overview of the early years and child care system
The Ministry of Education sets overall policy, legislation, and regulations for the early years and child care sector, under the authority of the Child Care and Early Years Act, 2014, and licenses child care providers across the province. The ministry also conducts inspections and investigates complaints about licensed and unlicensed child care.
The ministry oversees and licenses two types of child care:
- licensed child care centres, and
- home child care agencies, which contract with home child care providers.
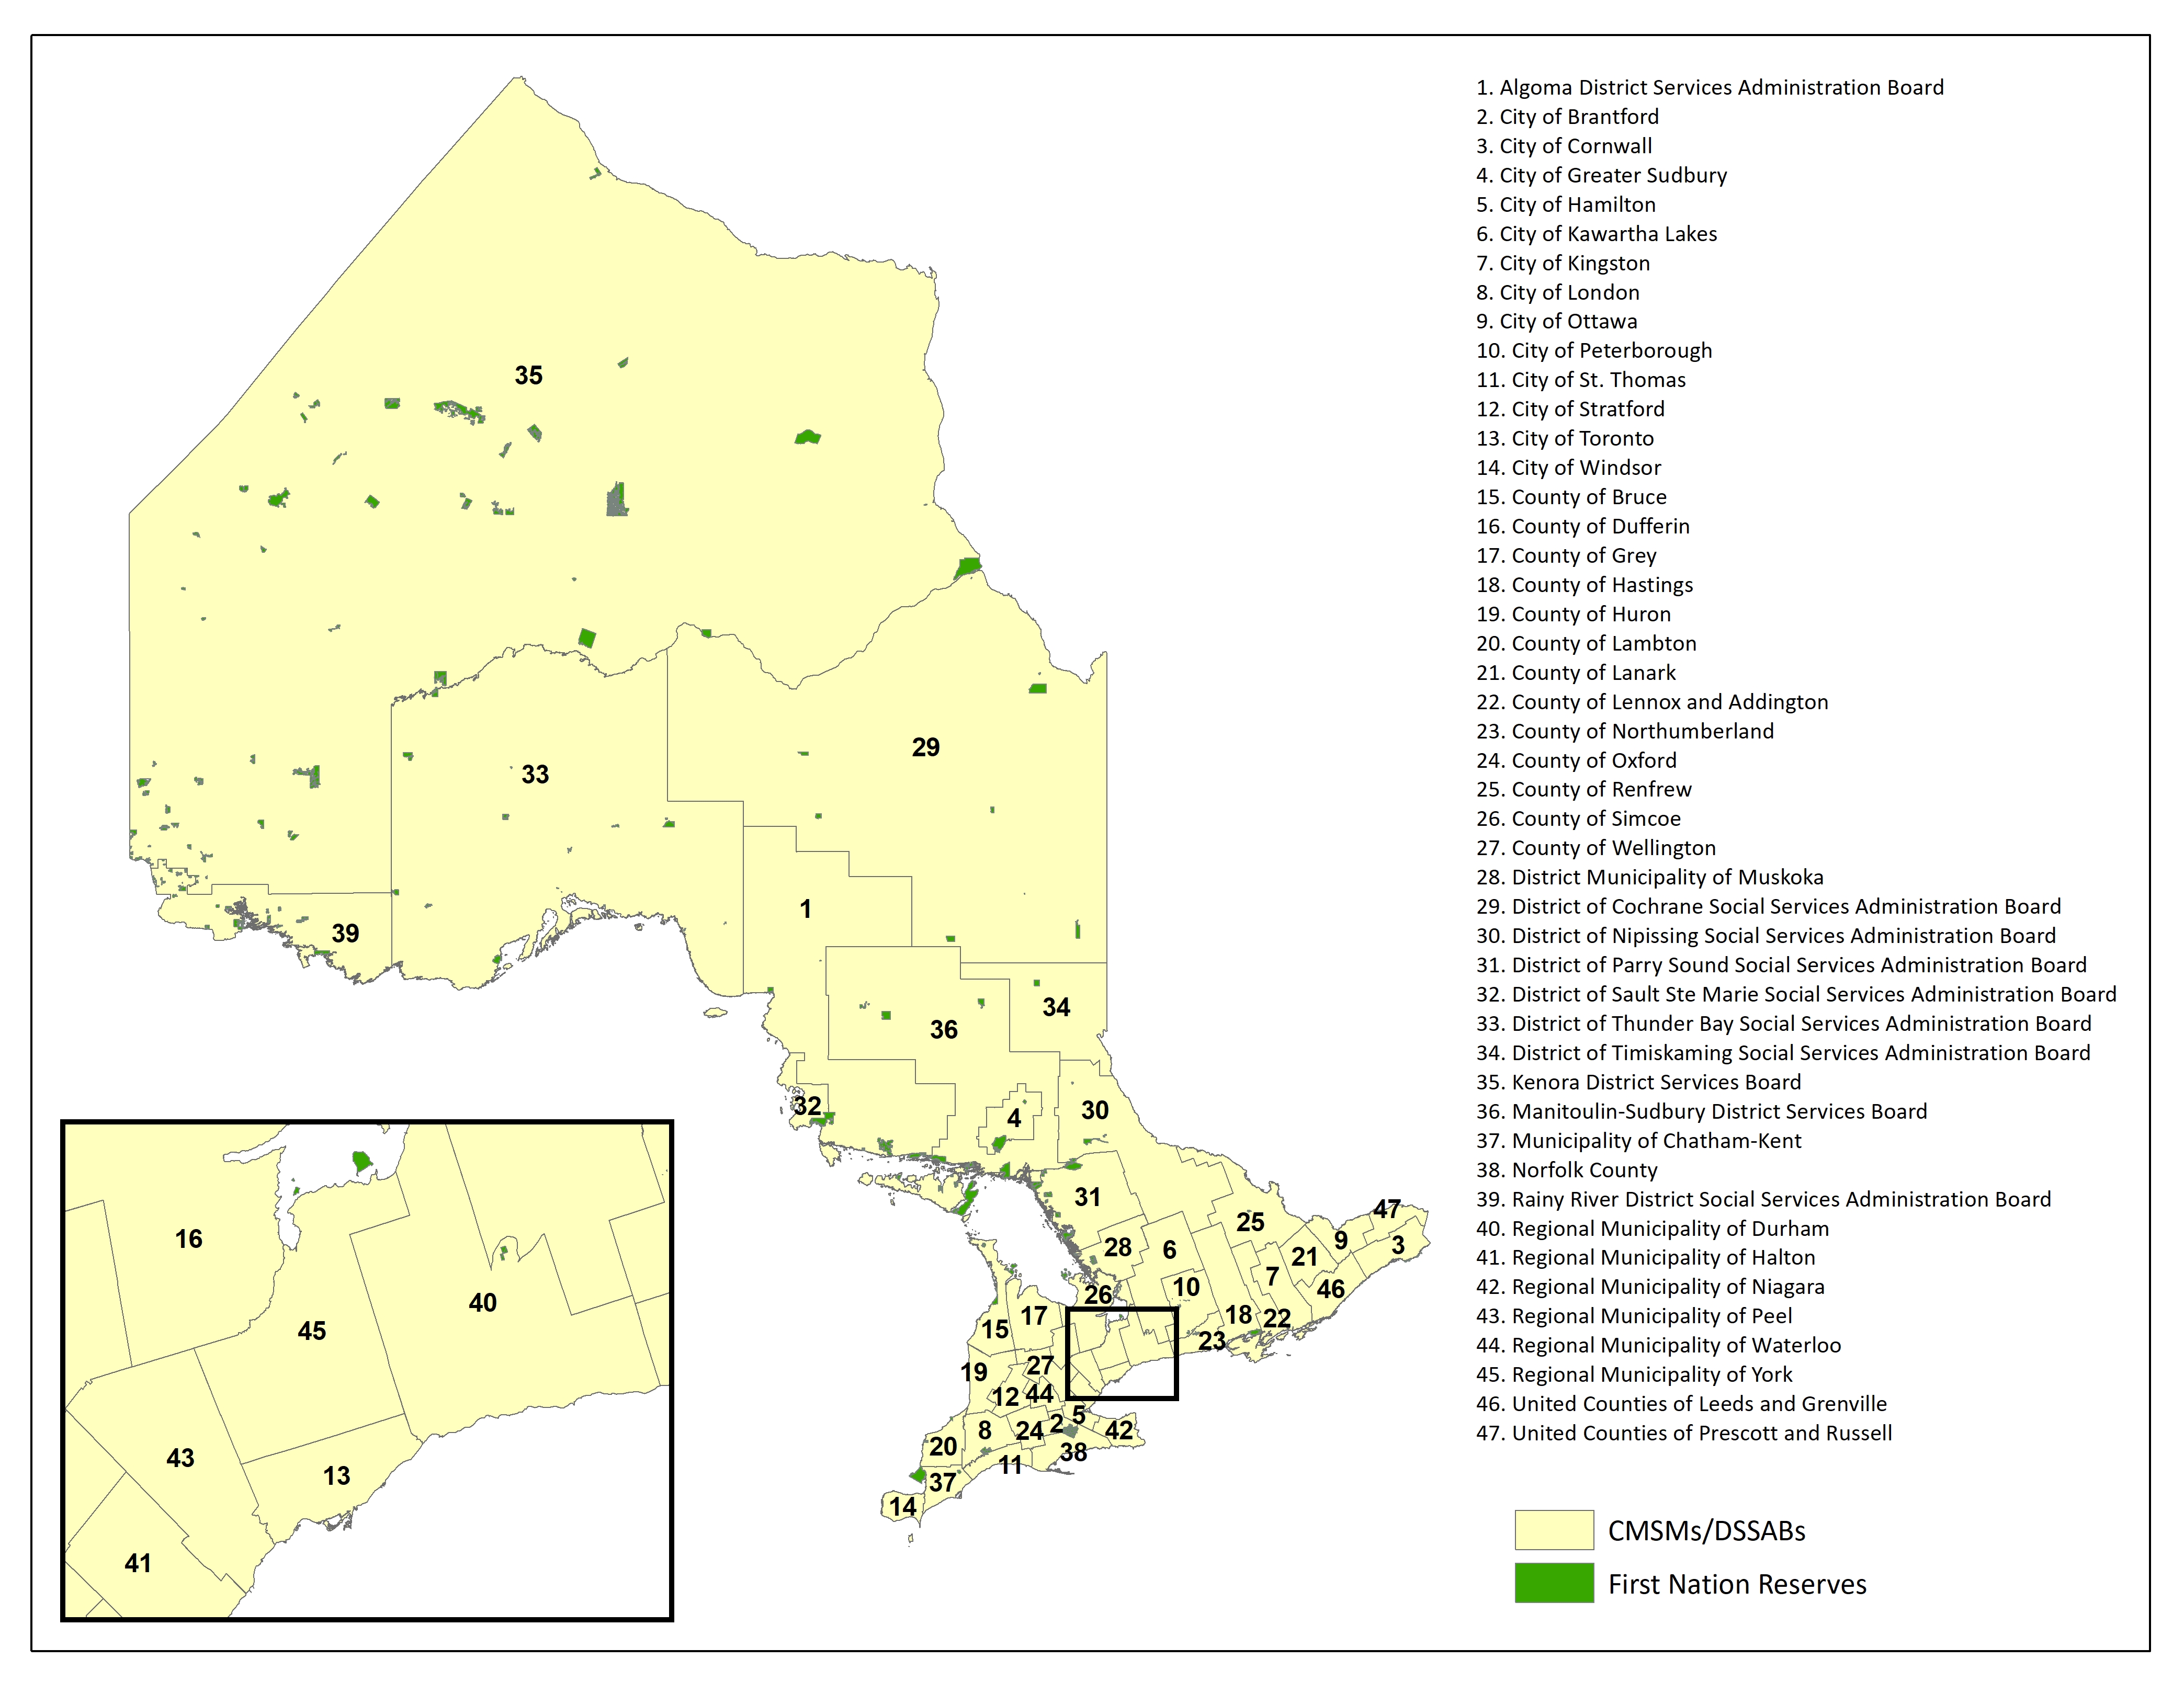
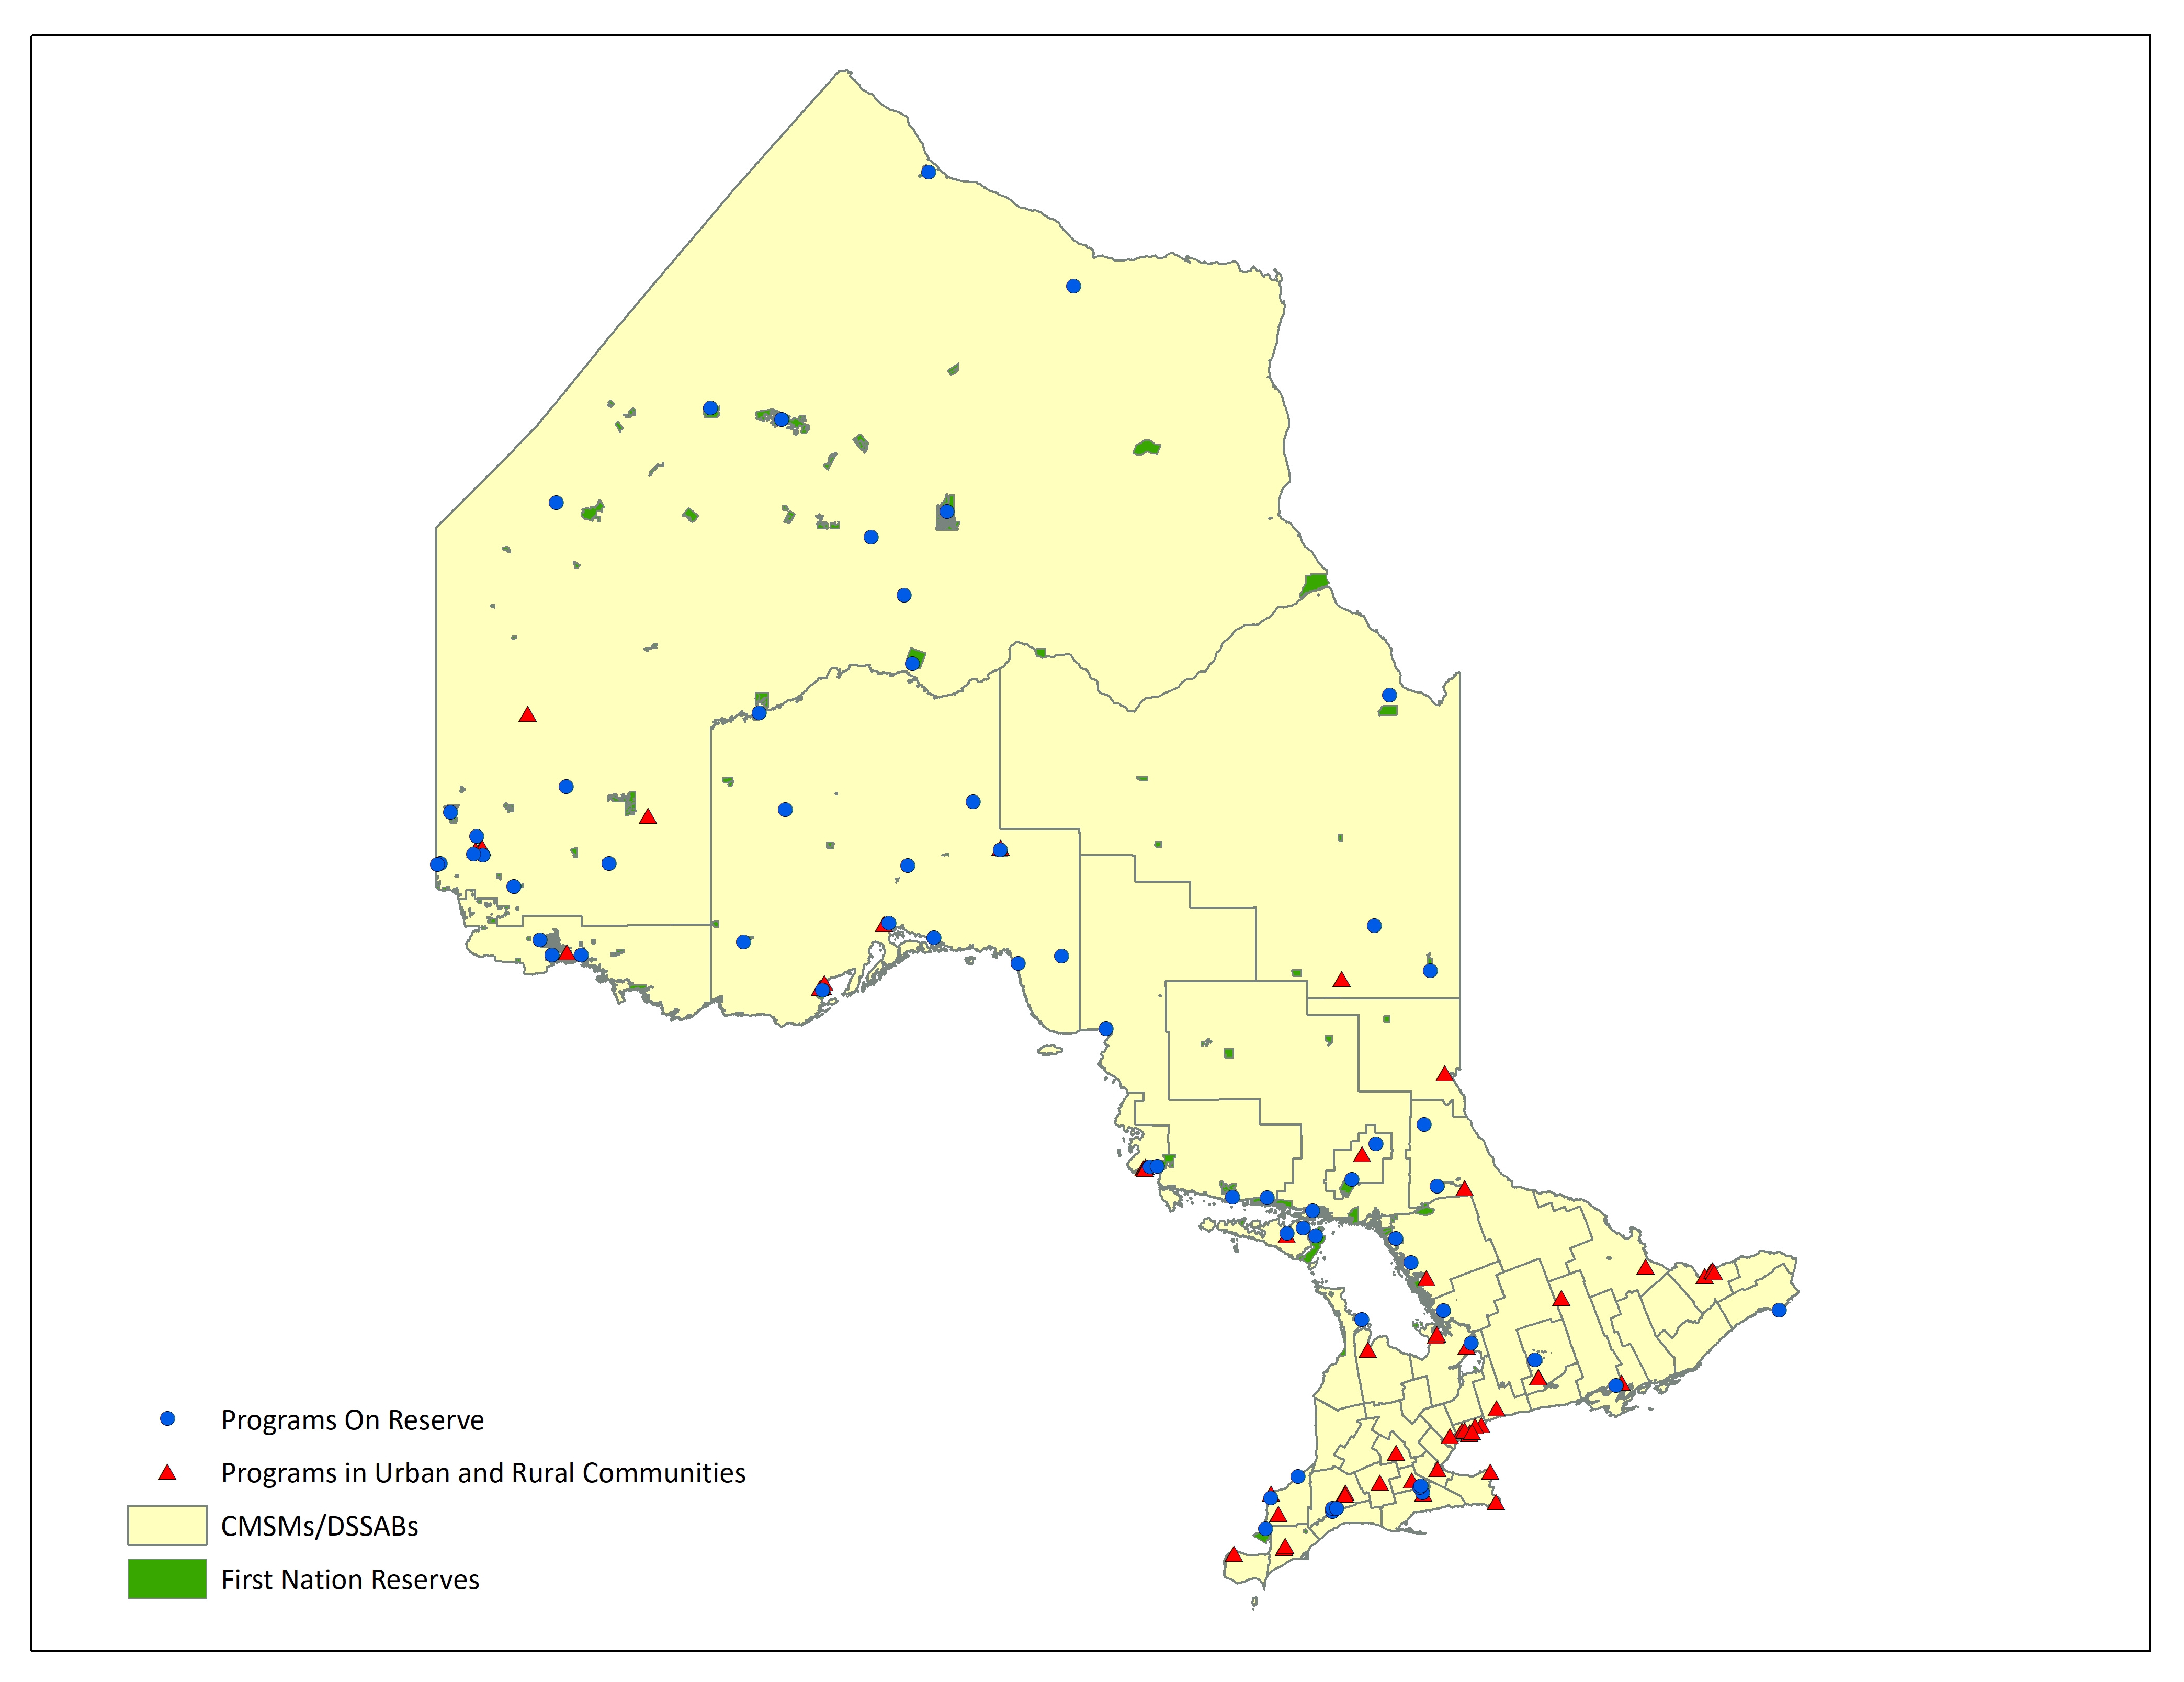
The provincial government provides funding to 47 local service system managers, known as Consolidated Municipal Service Managers (CMSMs) and District Social Services Administration Boards (DSSABs), to support licensed child care and child and family programs in the province (see Figure 1). These service system managers have the authority to determine funding priorities within their local systems, provided they comply with provincial legislation, policies, and guidelines.
Figure 1: Consolidated Municipal Service Managers and District Social Services Administration Boards in Ontario
| Location name | Type |
|---|---|
| Algoma District Services Administration Board | Consolidated Municipal Service Managers/District Social Services Administration Boards |
| City of Brantford | Consolidated Municipal Service Managers/District Social Services Administration Boards |
| City of Cornwall | Consolidated Municipal Service Managers/District Social Services Administration Boards |
| City of Greater Sudbury | Consolidated Municipal Service Managers/District Social Services Administration Boards |
| City of Hamilton | Consolidated Municipal Service Managers/District Social Services Administration Boards |
| City of Kawartha Lakes | Consolidated Municipal Service Managers/District Social Services Administration Boards |
| City of Kingston | Consolidated Municipal Service Managers/District Social Services Administration Boards |
| City of London | Consolidated Municipal Service Managers/District Social Services Administration Boards |
| City of Ottawa | Consolidated Municipal Service Managers/District Social Services Administration Boards |
| City of Peterborough | Consolidated Municipal Service Managers/District Social Services Administration Boards |
| City of St. Thomas | Consolidated Municipal Service Managers/District Social Services Administration Boards |
| City of Stratford | Consolidated Municipal Service Managers/District Social Services Administration Boards |
| City of Toronto | Consolidated Municipal Service Managers/District Social Services Administration Boards |
| City of Windsor | Consolidated Municipal Service Managers/District Social Services Administration Boards |
| County of Bruce | Consolidated Municipal Service Managers/District Social Services Administration Boards |
| County of Dufferin | Consolidated Municipal Service Managers/District Social Services Administration Boards |
| County of Grey | Consolidated Municipal Service Managers/District Social Services Administration Boards |
| County of Hastings | Consolidated Municipal Service Managers/District Social Services Administration Boards |
| County of Huron | Consolidated Municipal Service Managers/District Social Services Administration Boards |
| County of Lambton | Consolidated Municipal Service Managers/District Social Services Administration Boards |
| County of Lanark | Consolidated Municipal Service Managers/District Social Services Administration Boards |
| County of Lennox and Addington | Consolidated Municipal Service Managers/District Social Services Administration Boards |
| County of Northumberland | Consolidated Municipal Service Managers/District Social Services Administration Boards |
| County of Oxford | Consolidated Municipal Service Managers/District Social Services Administration Boards |
| County of Renfrew | Consolidated Municipal Service Managers/District Social Services Administration Boards |
| County of Simcoe | Consolidated Municipal Service Managers/District Social Services Administration Boards |
| County of Wellington | Consolidated Municipal Service Managers/District Social Services Administration Boards |
| District Municipality of Muskoka | Consolidated Municipal Service Managers/District Social Services Administration Boards |
| District of Cochrane Social Services Administration Board | Consolidated Municipal Service Managers/District Social Services Administration Boards |
| District of Nipissing Social Services Administration Board | Consolidated Municipal Service Managers/District Social Services Administration Boards |
| District of Parry Sound Social Services Administration Board | Consolidated Municipal Service Managers/District Social Services Administration Boards |
| District of Sault Ste Marie Social Services Administration Board | Consolidated Municipal Service Managers/District Social Services Administration Boards |
| District of Thunder Bay Social Services Administration Board | Consolidated Municipal Service Managers/District Social Services Administration Boards |
| District of Timiskaming Social Services Administration Board | Consolidated Municipal Service Managers/District Social Services Administration Boards |
| Kenora District Services Board | Consolidated Municipal Service Managers/District Social Services Administration Boards |
| Manitoulin-Sudbury District Services Board | Consolidated Municipal Service Managers/District Social Services Administration Boards |
| Municipality of Chatham-Kent | Consolidated Municipal Service Managers/District Social Services Administration Boards |
| Norfolk County | Consolidated Municipal Service Managers/District Social Services Administration Boards |
| Rainy River District Social Services Administration Board | Consolidated Municipal Service Managers/District Social Services Administration Boards |
| Regional Municipality of Durham | Consolidated Municipal Service Managers/District Social Services Administration Boards |
| Regional Municipality of Halton | Consolidated Municipal Service Managers/District Social Services Administration Boards |
| Regional Municipality of Niagara | Consolidated Municipal Service Managers/District Social Services Administration Boards |
| Regional Municipality of Peel | Consolidated Municipal Service Managers/District Social Services Administration Boards |
| Regional Municipality of Waterloo | Consolidated Municipal Service Managers/District Social Services Administration Boards |
| Regional Municipality of York | Consolidated Municipal Service Managers/District Social Services Administration Boards |
| United Counties of Leeds and Grenville | Consolidated Municipal Service Managers/District Social Services Administration Boards |
| United Counties of Prescott and Russell | Consolidated Municipal Service Managers/District Social Services Administration Boards |
Data sources: Ontario Ministry of Education; Statistics Canada.
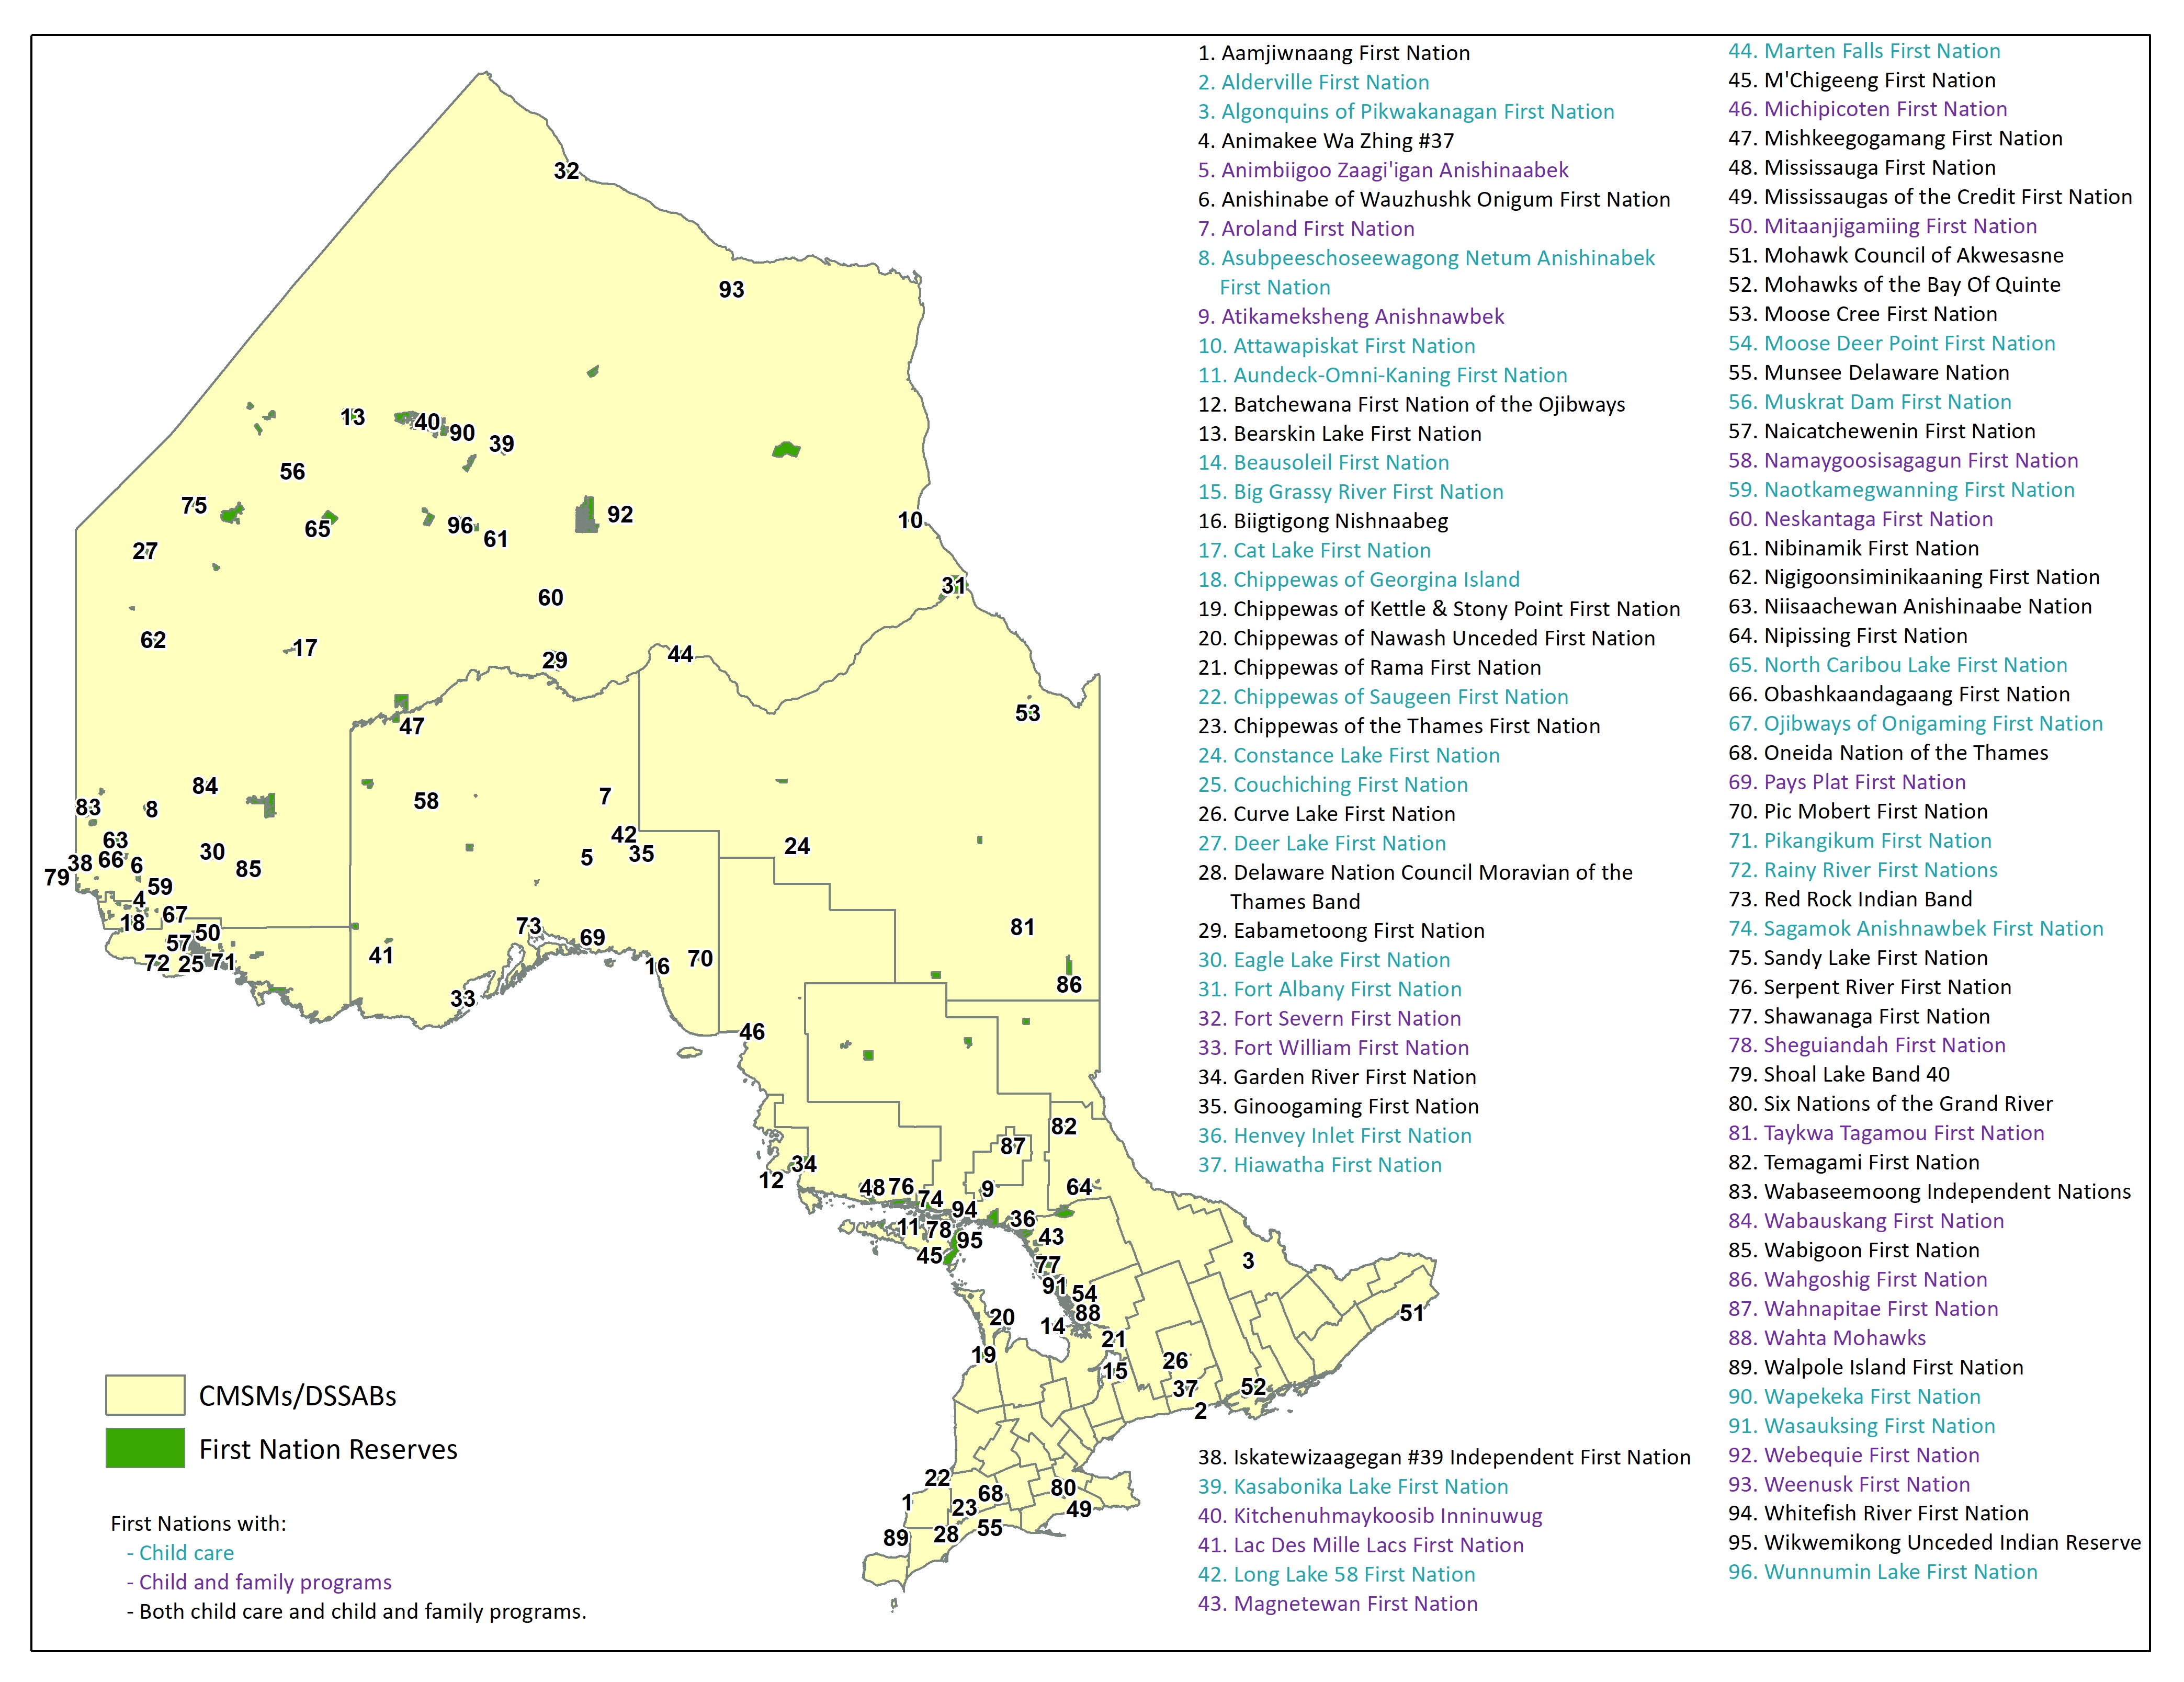
As of March 31, 2020, the province was funding 96 First Nations to support child care and/or child and family programs on reserve (see Figure 2), of which:
- 31 received funding for child care only
- 21 received funding for child and family programs only
- 44 received funding for a combination of child care and child and family programs.
Figure 2: Ontario First Nations receiving provincial funding for child care and/or child and family programs
| Location name | Type | Key |
|---|---|---|
| Aamjiwnaang First Nation | First Nation Reserves | Received provincial funding for child care and child and family programs |
| Alderville First Nation | First Nation Reserves | Received provincial funding for child care |
| Algonquins of Pikwakanagan First Nation | First Nation Reserves | Received provincial funding for child care |
| Animakee Wa Zhing #37 | First Nation Reserves | Received provincial funding for child care and child and family programs |
| Animbiigoo Zaagi'igan Anishinaabek | First Nation Reserves | Received provincial funding for child and family programs |
| Anishinabe of Wauzhushk Onigum First Nation | First Nation Reserves | Received provincial funding for child care and child and family programs |
| Aroland First Nation | First Nation Reserves | Received provincial funding for child and family programs |
| Asubpeeschoseewagong Netum Anishinabek First Nation | First Nation Reserves | Received provincial funding for child care |
| Atikameksheng Anishnawbek | First Nation Reserves | Received provincial funding for child and family programs |
| Attawapiskat First Nation | First Nation Reserves | Received provincial funding for child care |
| Aundeck-Omni-Kaning First Nation | First Nation Reserves | Received provincial funding for child care |
| Batchewana First Nation of the Ojibways | First Nation Reserves | Received provincial funding for child care and child and family programs |
| Bearskin Lake First Nation | First Nation Reserves | Received provincial funding for child care and child and family programs |
| Beausoleil First Nation | First Nation Reserves | Received provincial funding for child care |
| Big Grassy River First Nation | First Nation Reserves | Received provincial funding for child care |
| Biigtigong Nishnaabeg | First Nation Reserves | Received provincial funding for child care and child and family programs |
| Cat Lake First Nation | First Nation Reserves | Received provincial funding for child care |
| Chippewas of Georgina Island | First Nation Reserves | Received provincial funding for child care |
| Chippewas of Kettle & Stony Point First Nation | First Nation Reserves | Received provincial funding for child care and child and family programs |
| Chippewas of Nawash Unceded First Nation | First Nation Reserves | Received provincial funding for child care and child and family programs |
| Chippewas of Rama First Nation | First Nation Reserves | Received provincial funding for child care and child and family programs |
| Chippewas of Saugeen First Nation | First Nation Reserves | Received provincial funding for child care |
| Chippewas of the Thames First Nation | First Nation Reserves | Received provincial funding for child care and child and family programs |
| Constance Lake First Nation | First Nation Reserves | Received provincial funding for child care |
| Couchiching First Nation | First Nation Reserves | Received provincial funding for child care |
| Curve Lake First Nation | First Nation Reserves | Received provincial funding for child care and child and family programs |
| Deer Lake First Nation | First Nation Reserves | Received provincial funding for child care |
| Delaware Nation Council Moravian of the Thames Band | First Nation Reserves | Received provincial funding for child care and child and family programs |
| Eabametoong First Nation | First Nation Reserves | Received provincial funding for child care and child and family programs |
| Eagle Lake First Nation | First Nation Reserves | Received provincial funding for child care |
| Fort Albany First Nation | First Nation Reserves | Received provincial funding for child care |
| Fort Severn First Nation | First Nation Reserves | Received provincial funding for child and family programs |
| Fort William First Nation | First Nation Reserves | Received provincial funding for child and family programs |
| Garden River First Nation | First Nation Reserves | Received provincial funding for child care and child and family programs |
| Ginoogaming First Nation | First Nation Reserves | Received provincial funding for child care and child and family programs |
| Henvey Inlet First Nation | First Nation Reserves | Received provincial funding for child care |
| Hiawatha First Nation | First Nation Reserves | Received provincial funding for child care |
| Iskatewizaagegan #39 Independent First Nation | First Nation Reserves | Received provincial funding for child care and child and family programs |
| Kasabonika Lake First Nation | First Nation Reserves | Received provincial funding for child care |
| Kitchenuhmaykoosib Inninuwug | First Nation Reserves | Received provincial funding for child and family programs |
| Lac Des Mille Lacs First Nation | First Nation Reserves | Received provincial funding for child and family programs |
| Long Lake 58 First Nation | First Nation Reserves | Received provincial funding for child care |
| Magnetewan First Nation | First Nation Reserves | Received provincial funding for child and family programs |
| Marten Falls First Nation | First Nation Reserves | Received provincial funding for child care |
| M’Chigeeng First Nation | First Nation Reserves | Received provincial funding for child care and child and family programs |
| Michipicoten First Nation | First Nation Reserves | Received provincial funding for child and family programs |
| Mishkeegogamang First Nation | First Nation Reserves | Received provincial funding for child care and child and family programs |
| Mississauga First Nation | First Nation Reserves | Received provincial funding for child care and child and family programs |
| Mississaugas of the Credit First Nation | First Nation Reserves | Received provincial funding for child care and child and family programs |
| Mitaanjigamiing First Nation | First Nation Reserves | Received provincial funding for child and family programs |
| Mohawk Council of Akwesasne | First Nation Reserves | Received provincial funding for child care and child and family programs |
| Mohawks of the Bay of Quinte | First Nation Reserves | Received provincial funding for child care and child and family programs |
| Moose Cree First Nation | First Nation Reserves | Received provincial funding for child care and child and family programs |
| Moose Deer Point First Nation | First Nation Reserves | Received provincial funding for child care |
| Munsee Delaware Nation | First Nation Reserves | Received provincial funding for child care and child and family programs |
| Muskrat Dam First Nation | First Nation Reserves | Received provincial funding for child care |
| Naicatchewenin First Nation | First Nation Reserves | Received provincial funding for child care and child and family programs |
| Namaygoosisagagun First Nation | First Nation Reserves | Received provincial funding for child and family programs |
| Naotkamegwanning First Nation | First Nation Reserves | Received provincial funding for child care |
| Neskantaga First Nation | First Nation Reserves | Received provincial funding for child and family programs |
| Nibinamik First Nation | First Nation Reserves | Received provincial funding for child care and child and family programs |
| Nigigoonsiminikaaning First Nation | First Nation Reserves | Received provincial funding for child care and child and family programs |
| Niisaachewan Anishinaabe Nation | First Nation Reserves | Received provincial funding for child care and child and family programs |
| Nipissing First Nation | First Nation Reserves | Received provincial funding for child care and child and family programs |
| North Caribou Lake First Nation | First Nation Reserves | Received provincial funding for child care |
| Obashkaandagaang First Nation | First Nation Reserves | Received provincial funding for child care and child and family programs |
| Ojibways of Onigaming First Nation | First Nation Reserves | Received provincial funding for child care |
| Oneida Nation of the Thames | First Nation Reserves | Received provincial funding for child care and child and family programs |
| Pays Plat First Nation | First Nation Reserves | Received provincial funding for child and family programs |
| Pic Mobert First Nation | First Nation Reserves | Received provincial funding for child care and child and family programs |
| Pikangikum First Nation | First Nation Reserves | Received provincial funding for child care |
| Rainy River First Nations | First Nation Reserves | Received provincial funding for child care |
| Red Rock Indian Band | First Nation Reserves | Received provincial funding for child care and child and family programs |
| Sagamok Anishnawbek First Nation | First Nation Reserves | Received provincial funding for child care |
| Sandy Lake First Nation | First Nation Reserves | Received provincial funding for child care and child and family programs |
| Serpent River First Nation | First Nation Reserves | Received provincial funding for child care and child and family programs |
| Shawanaga First Nation | First Nation Reserves | Received provincial funding for child care and child and family programs |
| Sheguiandah First Nation | First Nation Reserves | Received provincial funding for child and family programs |
| Shoal Lake Band 40 | First Nation Reserves | Received provincial funding for child care and child and family programs |
| Six Nations of the Grand River | First Nation Reserves | Received provincial funding for child care and child and family programs |
| Taykwa Tagamou First Nation | First Nation Reserves | Received provincial funding for child and family programs |
| Temagami First Nation | First Nation Reserves | Received provincial funding for child care and child and family programs |
| Wabaseemoong Independent Nations | First Nation Reserves | Received provincial funding for child care and child and family programs |
| Wabauskang First Nation | First Nation Reserves | Received provincial funding for child and family programs |
| Wabigoon First Nation | First Nation Reserves | Received provincial funding for child care and child and family programs |
| Wahgoshig First Nation | First Nation Reserves | Received provincial funding for child and family programs |
| Wahnapitae First Nation | First Nation Reserves | Received provincial funding for child and family programs |
| Wahta Mohawks | First Nation Reserves | Received provincial funding for child and family programs |
| Walpole Island First Nation | First Nation Reserves | Received provincial funding for child care and child and family programs |
| Wapekeka First Nation | First Nation Reserves | Received provincial funding for child care |
| Wasauksing First Nation | First Nation Reserves | Received provincial funding for child care |
| Webequie First Nation | First Nation Reserves | Received provincial funding for child and family programs |
| Weenusk First Nation | First Nation Reserves | Received provincial funding for child and family programs |
| Whitefish River First Nation | First Nation Reserves | Received provincial funding for child care and child and family programs |
| Wikwemikong Unceded Indian Reserve | First Nation Reserves | Received provincial funding for child care and child and family programs |
| Wunnumin Lake First Nation | First Nation Reserves | Received provincial funding for child care |
Data sources: Ontario Ministry of Education; Statistics Canada.
Part 2: Early years and child care key data and measures
Licensed child care
In Ontario, licensed child care is provided in centres and homes, and is delivered by a mix of not-for-profit and for-profit organizations as well as municipalities, school boards, and First Nations. As of March 31, 2020, there were 5,565 licensed child care centres in Ontario. The total number of spaces in licensed centres was 462,802, which included:
- 34,841 spaces in centres that provide services in French
- 7,285 spaces in centres that provide bilingual services
- 3,342 spaces in centres in First Nations communities (on reserve).
As of March 31, 2020, a total of 131 licensed home child care agencies were in operation in the province. These agencies were permitted to contract with a maximum of 8,296 approved homes.
Overall trends in licensed child care
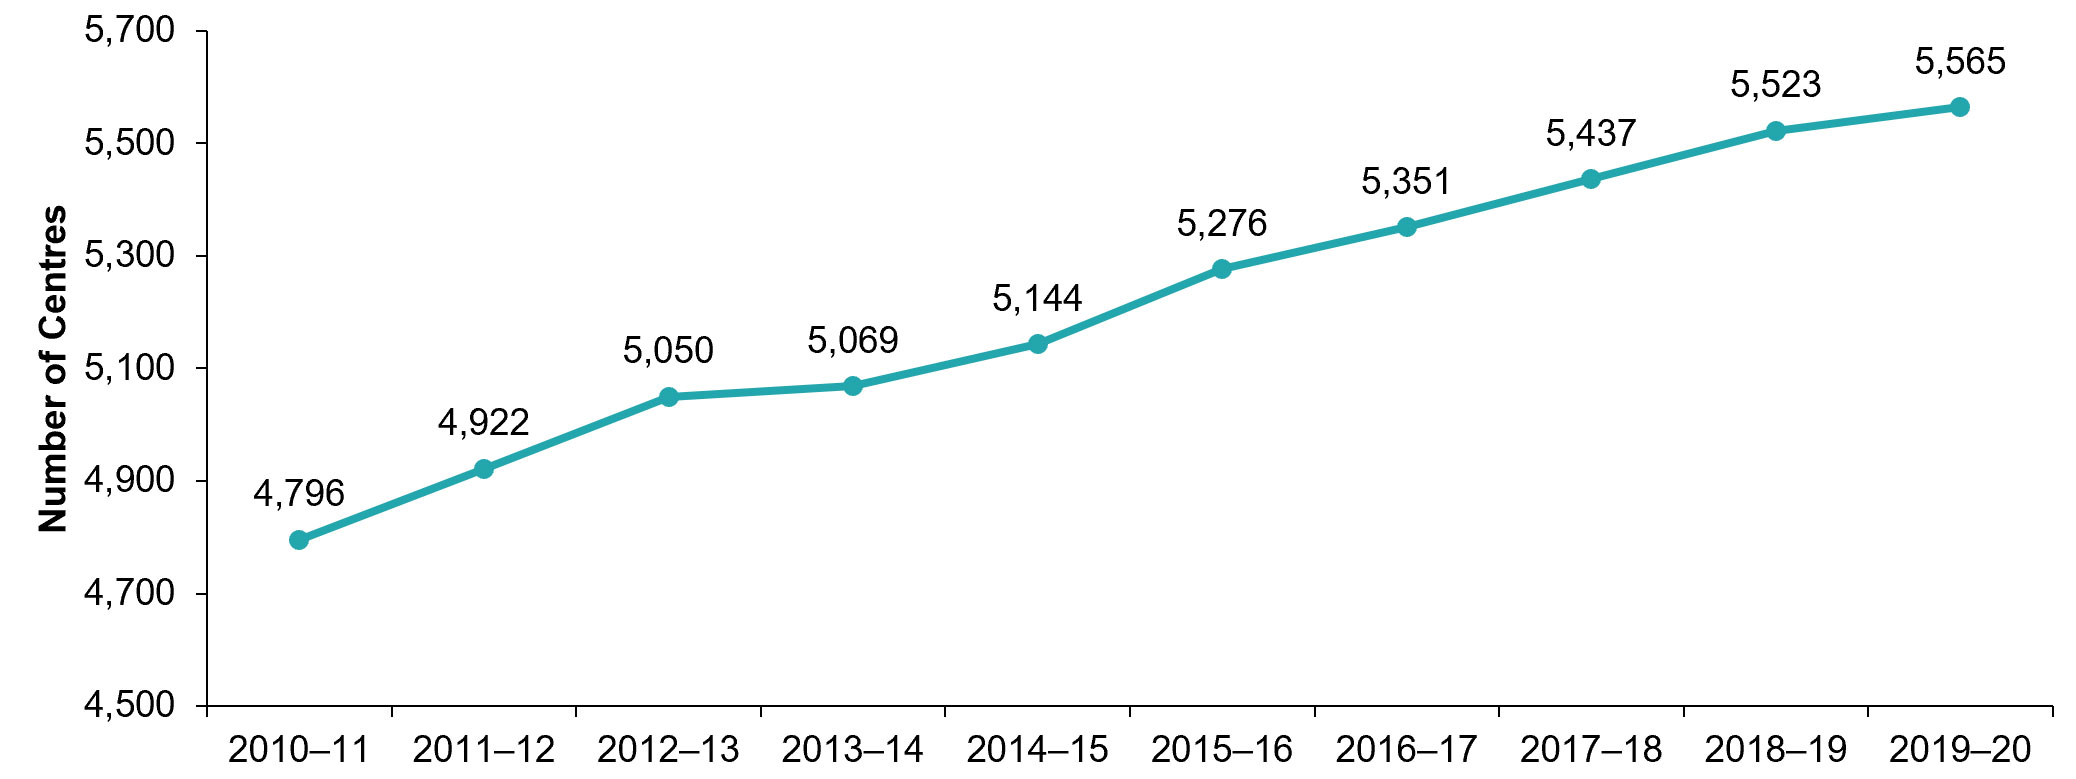
Ontario’s licensed child care sector continues to grow, driven by growth in licensed child care centres (see Figure 3 and Table 1). Specific areas of growth since 2010-11 include the following:
- The number of licensed child care centres increased by 16%, from 4,796 to 5,565. Licensed spaces have increased by 75%, from 264,201 to 462,802.
- The number of spaces has grown across all age groups, including kindergarten (271%), school age (88%), toddler (65%), infant (59%), and preschool (12%).
Figure 3: Number of licensed child care centres, 2010-11 to 2019-20
| Year | 2010-11 | 2011-12 | 2012-13 | 2013-14 | 2014-15 | 2015-16 | 2016-17 | 2017-18 | 2018-19 | 2019-20 |
|---|---|---|---|---|---|---|---|---|---|---|
| Number of Centres | 4,796 | 4,922 | 5,050 | 5,069 | 5,144 | 5,276 | 5,351 | 5,437 | 5,523 | 5,565 |
Data source: Child Care Licensing System, Ontario Ministry of Education (as of March 31 for each year).
Table 1: Spaces in licensed child care centres by age group, 2010-11 to 2019-20
| Year | 2010-11 | 2011-12 | 2012-13 | 2013-14 | 2014-15 | 2015-16 | 2016-17 | 2017-18 | 2018-19 | 2019-20 |
|---|---|---|---|---|---|---|---|---|---|---|
| Number of Spaces | 264,201 | 275,873 | 294,490 | 317,868 | 350,801 | 389,286 | 406,395 | 427,032 | 446,596 | 462,802 |
| Infant | 8,874 | 9,269 | 9,634 | 10,250 | 11,025 | 11,759 | 12,231 | 12,755 | 13,626 | 14,151 |
| Toddler | 29,534 | 30,867 | 32,578 | 34,772 | 37,833 | 41,211 | 42,900 | 44,529 | 46,865 | 48,858 |
| Preschool | 103,048 | 103,474 | 102,731 | 102,133 | 102,380 | 104,802 | 105,955 | 108,375 | 112,042 | 115,001 |
| Kindergarten | 28,944 | 32,547 | 40,796 | 52,168 | 64,340 | 85,014 | 92,035 | 98,310 | 103,308 | 107,260 |
| School age | 93,839 | 99,743 | 108,795 | 118,545 | 135,223 | 146,500 | 153,274 | 162,901 | 170,337 | 176,840 |
| Family age group | – | – | – | – | – | – | – | 162 | 418 | 692 |
Data source: Child Care Licensing System, Ontario Ministry of Education (as of March 31 for each year).
Overall, the number of approved homes has increased by 21% since 2010-11, from 6,832 to 8,296 (see the line in Figure 4a), and the number of licensed home child care agencies has decreased by 3%, from 135 to 131 (see the bars in Figure 4b).
Figure 4a: Approved homes, 2010-11 to 2019-20
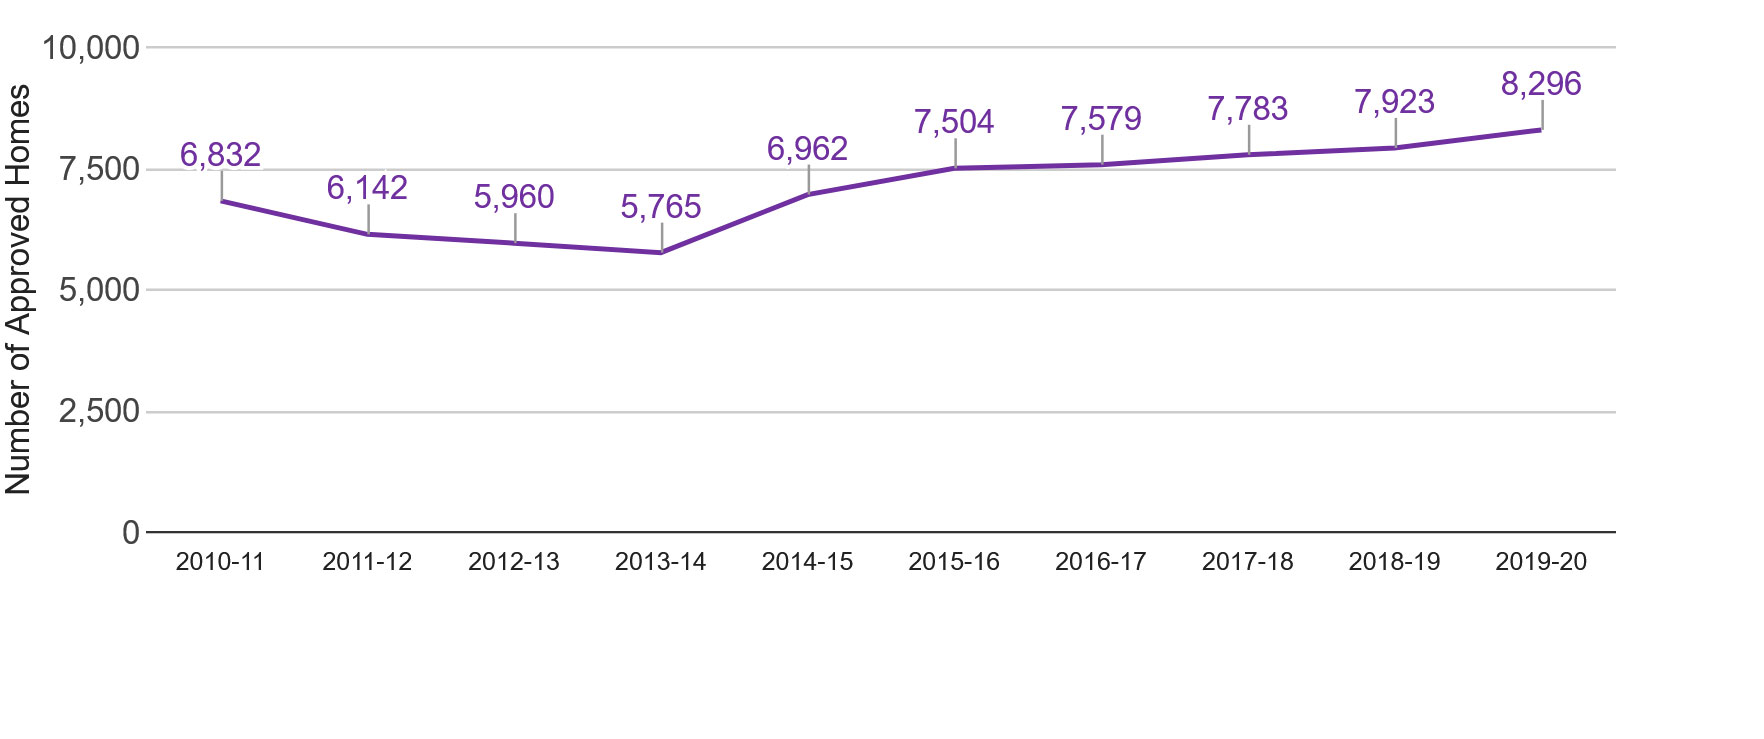
Figure 4b: Licensed home child care agencies, 2010-11 to 2019-20
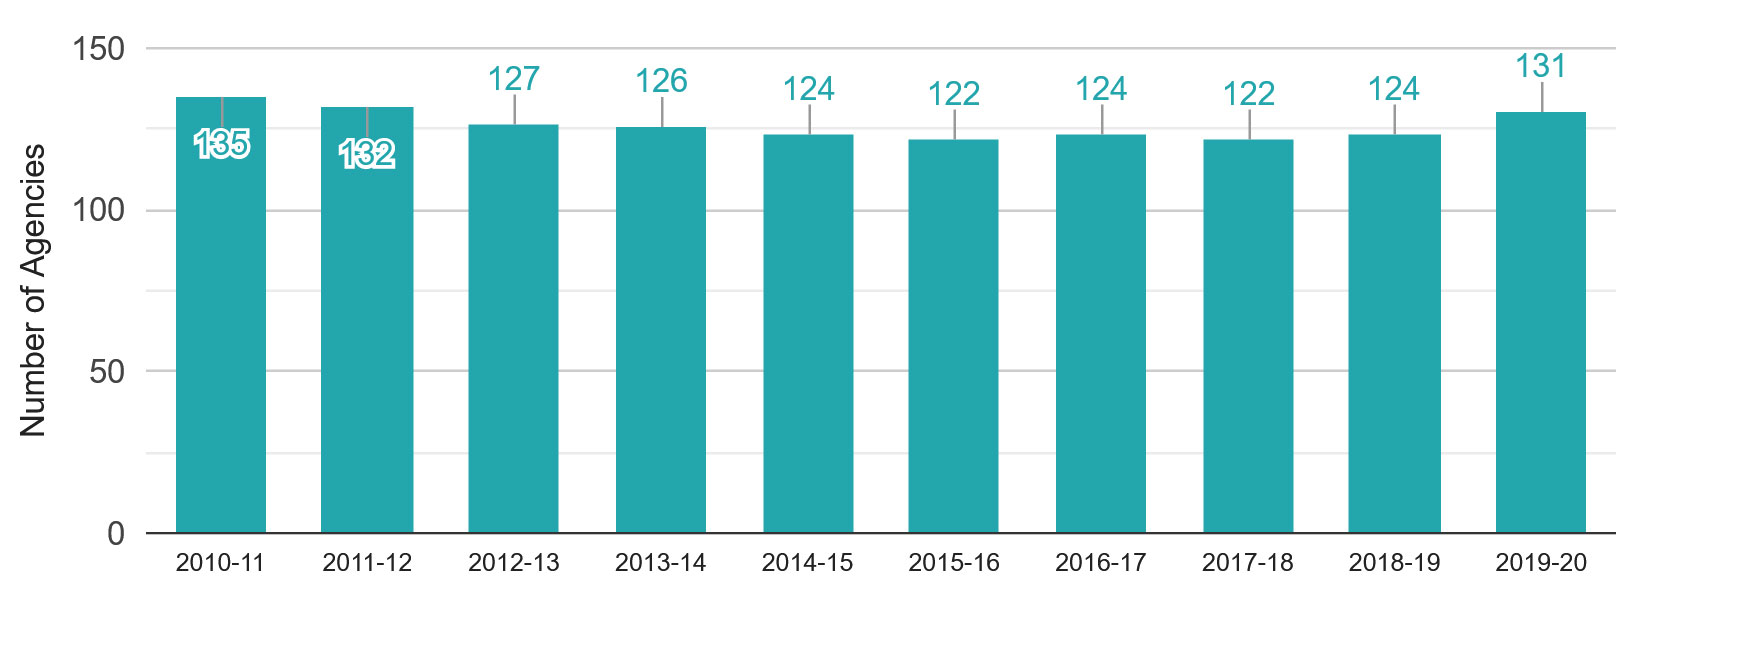
| Year | 2010-11 | 2011-12 | 2012-13 | 2013-14 | 2014-15 | 2015-16 | 2016-17 | 2017-18 | 2018-19 | 2019-20 |
|---|---|---|---|---|---|---|---|---|---|---|
| Number of approved homes | 6,832 | 6,142 | 5,960 | 5,765 | 6,962 | 7,504 | 7,579 | 7,783 | 7,923 | 8,296 |
| Number of agencies | 135 | 132 | 127 | 126 | 124 | 122 | 124 | 122 | 124 | 131 |
Data source: Child Care Licensing System, Ontario Ministry of Education (as of March 31 for each year).
Child care by type of auspice
As of March 31, 2020:
- 75% of licensed child care centres were not-for-profit (operated by not-for-profit organizations and First Nations) and 25% were for-profit.
- 79% of child care spaces were in not-for-profit centres and 21% were in for-profit centres.
- 80% of licensed home child care agencies were not-for-profit and 20% were for-profit.
- 88% of approved child care homes were affiliated with not-for-profit agencies and 12% were affiliated with for-profit agencies.
For more detailed data and a look at changes over time, see Table 2 and Table 3.
Table 2: Licensed child care centres and spaces in licensed child care centres by auspice, 2010-11 to 2019-20
| Year | 2010-11 | 2011-12 | 2012-13 | 2013-14 | 2014-15 | 2015-16 | 2016-17 | 2017-18 | 2018-19 | 2019-20 |
|---|---|---|---|---|---|---|---|---|---|---|
| Number of centres | 4,796 | 4,922 | 5,050 | 5,069 | 5,144 | 5,276 | 5,351 | 5,437 | 5,523 | 5,565 |
| Not-for-profit | 3,643 | 3,733 | 3,859 | 3,847 | 3,942 | 4,007 | 4,053 | 4,128 | 4,186 | 4,187 |
| For-profit | 1,153 | 1,189 | 1,191 | 1,222 | 1,202 | 1,269 | 1,298 | 1,309 | 1,337 | 1,378 |
| Number of spaces | 264,201 | 275,873 | 294,490 | 317,868 | 350,801 | 389,286 | 406,395 | 427,032 | 446,596 | 462,802 |
| Not-for-profit | 196,708 | 205,777 | 222,851 | 240,881 | 272,899 | 305,317 | 319,608 | 337,318 | 352,949 | 365,653 |
| For-profit | 67,493 | 70,096 | 71,639 | 76,987 | 77,902 | 83,969 | 86,787 | 89,714 | 93,647 | 97,149 |
Data source: Child Care Licensing System, Ontario Ministry of Education (as of March 31 for each year).
Table 3: Licensed home child care agencies and approved homes by auspice, 2010-11 to 2019-20
| Year | 2010-11 | 2011-12 | 2012-13 | 2013-14 | 2014-15 | 2015-16 | 2016-17 | 2017-18 | 2018-19 | 2019-20 |
|---|---|---|---|---|---|---|---|---|---|---|
| Number of agencies | 135 | 132 | 127 | 126 | 124 | 122 | 124 | 122 | 124 | 131 |
| Not-for-profit | 121 | 118 | 116 | 113 | 111 | 108 | 109 | 105 | 104 | 105 |
| For-profit | 14 | 14 | 11 | 13 | 13 | 14 | 15 | 17 | 20 | 26 |
| Number of approved homes | 6,832 | 6,142 | 5,960 | 5,765 | 6,962 | 7,504 | 7,579 | 7,783 | 7,923 | 8,296 |
| Not-for-profit | 6,398 | 5,812 | 5,640 | 5,403 | 6,500 | 6,992 | 7,017 | 7,114 | 7,148 | 7,320 |
| For-profit | 434 | 330 | 320 | 362 | 462 | 512 | 562 | 669 | 775 | 976 |
Data source: Child Care Licensing System, Ontario Ministry of Education (as of March 31 for each year).
Licensed child care centres – openings and closures
Licensed child care centres open and close on a regular basis (i.e., for reasons unrelated to the COVID‑19 pandemic), with more centres opening than closing in most years. Child care centres open for reasons such as the expansion of an existing program, a desire to provide a child care service in a community, or local planning efforts by municipalities to address an increase in the need for child care. Centres that close typically do so due to low enrolment.
In 2019-20, 213 child care centres opened and 171 closed. On average, there has been an annual net increase of 76 centres per year for the past 10 years (see Figure 5). 769 more child care centres were in operation in 2019-20 than in 2010-11.
Figure 5: Licensed child care centre openings and closures, 2010-11 to 2019-20
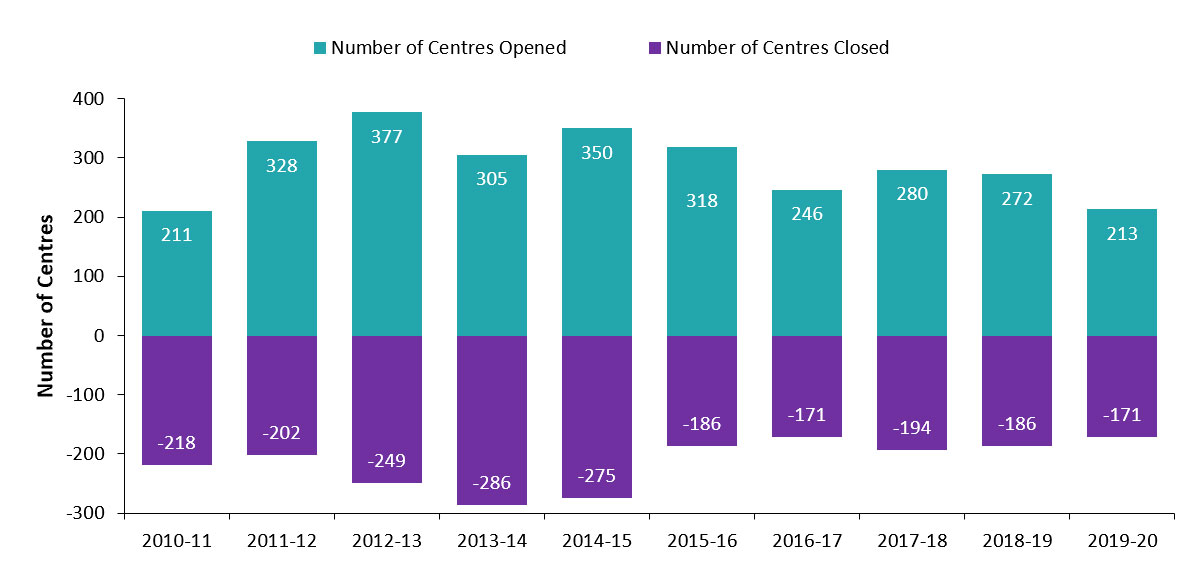
| Year | 2010-11 | 2011-12 | 2012-13 | 2013-14 | 2014-15 | 2015-16 | 2016-17 | 2017-18 | 2018-19 | 2019-20 |
|---|---|---|---|---|---|---|---|---|---|---|
| Number of centres opened | 211 | 328 | 377 | 305 | 350 | 318 | 246 | 280 | 272 | 213 |
| Number of centres closed | -218 | -202 | -249 | -286 | -275 | -186 | -171 | -194 | -186 | -171 |
Data source: Child Care Licensing System, Ontario Ministry of Education (as of March 31 for each year).
Licensed child care in publicly funded schools and in communities
As of March 31, 2020, 54% of child care centres, and 64% of child care spaces, were in publicly funded schools. The remaining 46% of child care centres, and 36% of child care spaces, were located elsewhere in the community. The number of licensed child care centres located in publicly funded schools increased by 0.4% in 2019-20 compared to the previous year, and spaces increased by 5% in the same period. Since 2010-11, the number of child care centres located in publicly funded schools has increased by 38% (see Figure 6), and spaces have increased by 153% (see Figure 7).
Figure 6: Licensed child care centres in publicly funded schools and in communities, 2010‑11 to 2019‑20footnote 7
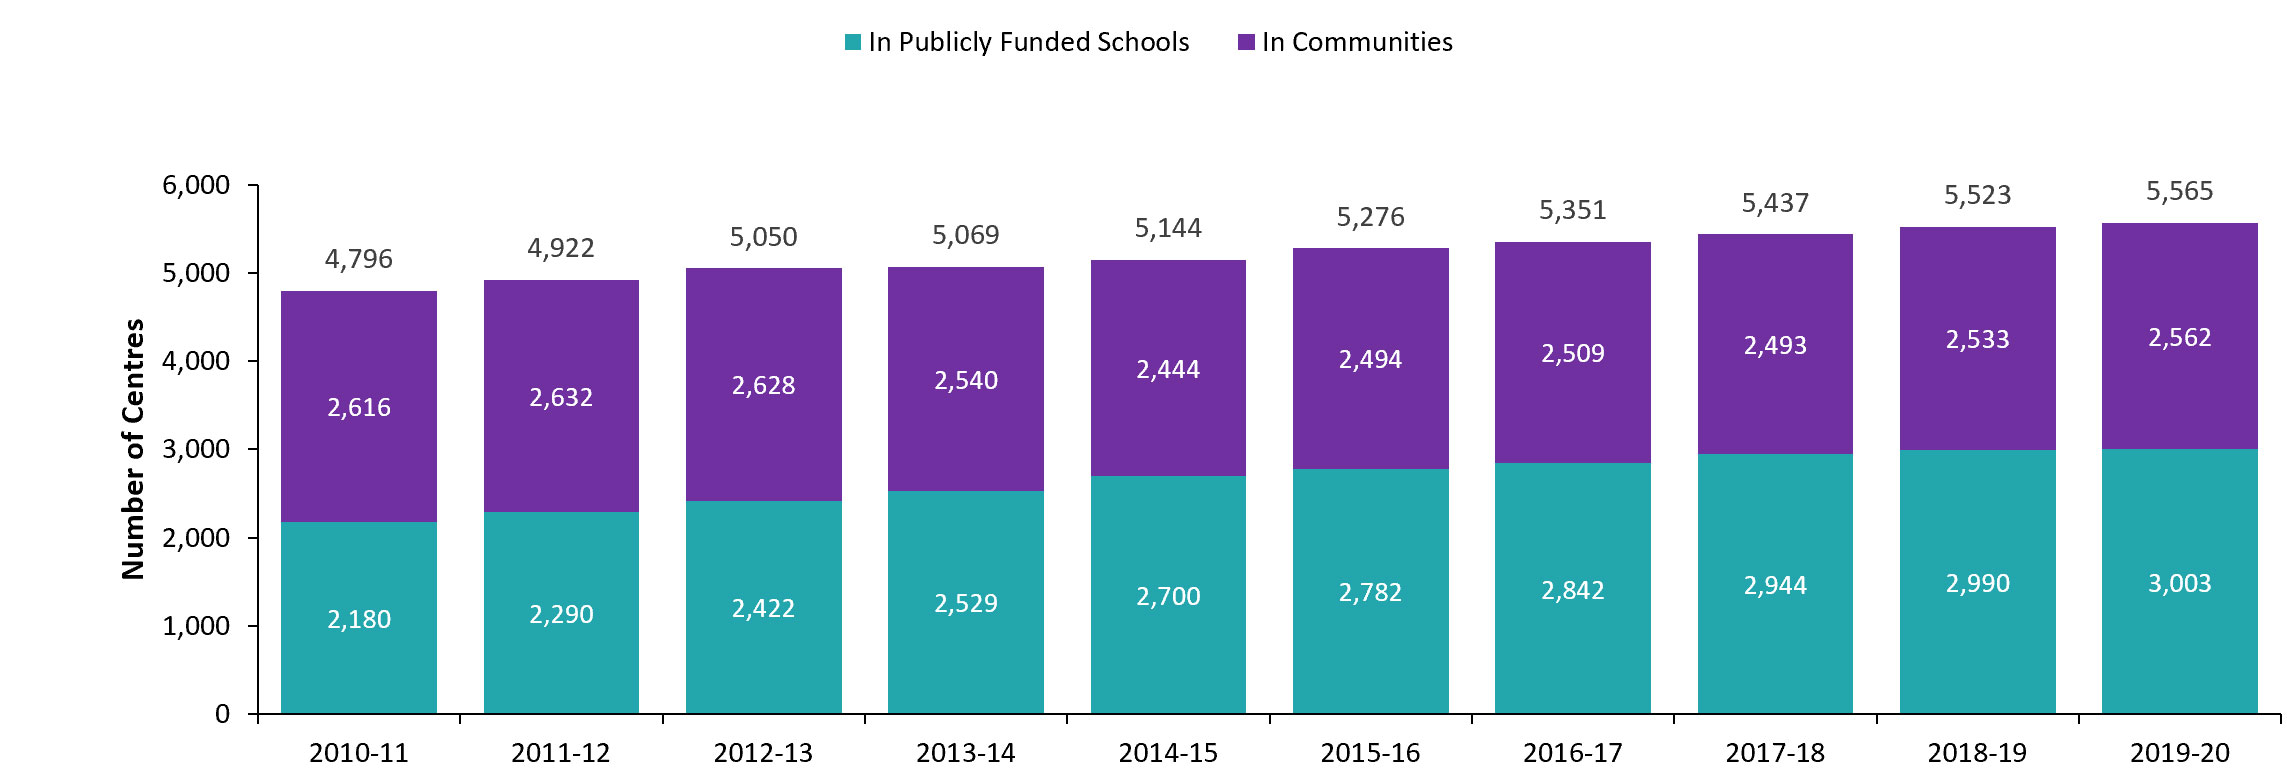
| Year | 2010-11 | 2011-12 | 2012-13 | 2013-14 | 2014-15 | 2015-16 | 2016-17 | 2017-18 | 2018-19 | 2019-20 |
|---|---|---|---|---|---|---|---|---|---|---|
| In publicly funded schools | 2,180 | 2,290 | 2,422 | 2,529 | 2,700 | 2,782 | 2,842 | 2,944 | 2,990 | 3,003 |
| In communities | 2,616 | 2,632 | 2,628 | 2,540 | 2,444 | 2,494 | 2,509 | 2,493 | 2,533 | 2,562 |
| Total | 4,796 | 4,922 | 5,050 | 5,069 | 5,144 | 5,276 | 5,351 | 5,437 | 5,523 | 5,565 |
Data source: Child Care Licensing System, Ontario Ministry of Education (as of March 31 for each year).
Figure 7: Licensed child care spaces in publicly funded schools and in communities, 2010‑11 to 2019‑20footnote 8
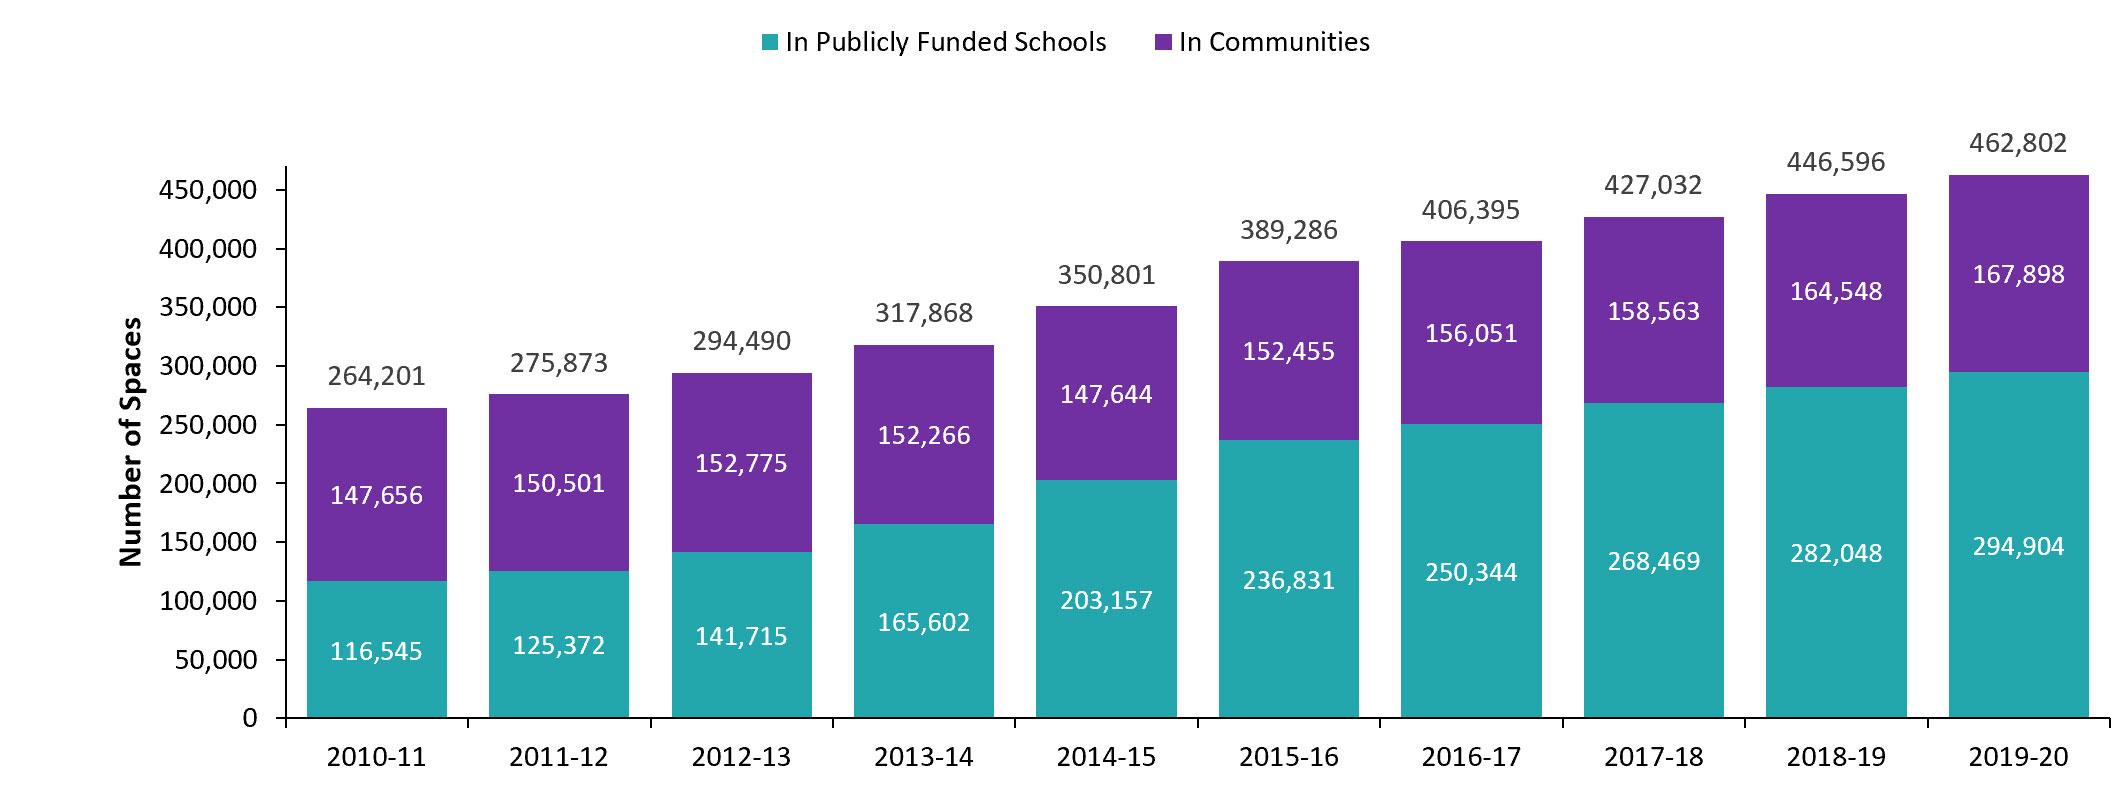
| Year | 2010-11 | 2011-12 | 2012-13 | 2013-14 | 2014-15 | 2015-16 | 2016-17 | 2017-18 | 2018-19 | 2019-20 |
|---|---|---|---|---|---|---|---|---|---|---|
| In publicly funded schools | 116,545 | 125,372 | 141,715 | 165,602 | 203,157 | 236,831 | 250,344 | 268,469 | 282,048 | 294,904 |
| In communities | 147,656 | 150,501 | 152,775 | 152,266 | 147,644 | 152,455 | 156,051 | 158,563 | 164,548 | 167,898 |
| Total | 264,201 | 275,873 | 294,490 | 317,868 | 350,801 | 389,286 | 406,395 | 427,032 | 446,596 | 462,802 |
Data source: Child Care Licensing System, Ontario Ministry of Education (as of March 31 for each year).
First Nations licensed child care on reserve
As of March 31, 2020, 75 licensed child care centres were operated on 59 First Nations reserves in Ontario. The number of licensed child care spaces on reserve has increased by 5% since 2010-11 (see Table 4).
Table 4: First Nations licensed child care centres and spaces by age group, 2010-11 to 2019-20
| Year | 2010-11 | 2011-12 | 2012-13 | 2013-14 | 2014-15 | 2015-16 | 2016-17 | 2017-18 | 2018-19 | 2019-20 |
|---|---|---|---|---|---|---|---|---|---|---|
| Number of centres | 78 | 76 | 76 | 74 | 75 | 76 | 76 | 76 | 75 | 75 |
| Infant | 227 | 223 | 232 | 254 | 270 | 296 | 290 | 290 | 290 | 309 |
| Toddler | 662 | 682 | 692 | 702 | 727 | 727 | 727 | 731 | 717 | 747 |
| Preschool | 1,613 | 1,602 | 1,624 | 1,620 | 1,568 | 1,541 | 1,553 | 1,551 | 1,529 | 1,584 |
| Kindergarten | 279 | 197 | 205 | 172 | 177 | 192 | 192 | 227 | 225 | 228 |
| School age | 391 | 439 | 458 | 443 | 398 | 413 | 413 | 416 | 413 | 459 |
| Family age | - | - | - | - | - | - | - | - | 15 | 15 |
| Total number of spaces | 3,172 | 3,143 | 3,211 | 3,191 | 3,140 | 3,169 | 3,175 | 3,215 | 3,189 | 3,342 |
Data source: Child Care Licensing System, Ontario Ministry of Education (as of March 31 for each year).
French-language and bilingual licensed child care
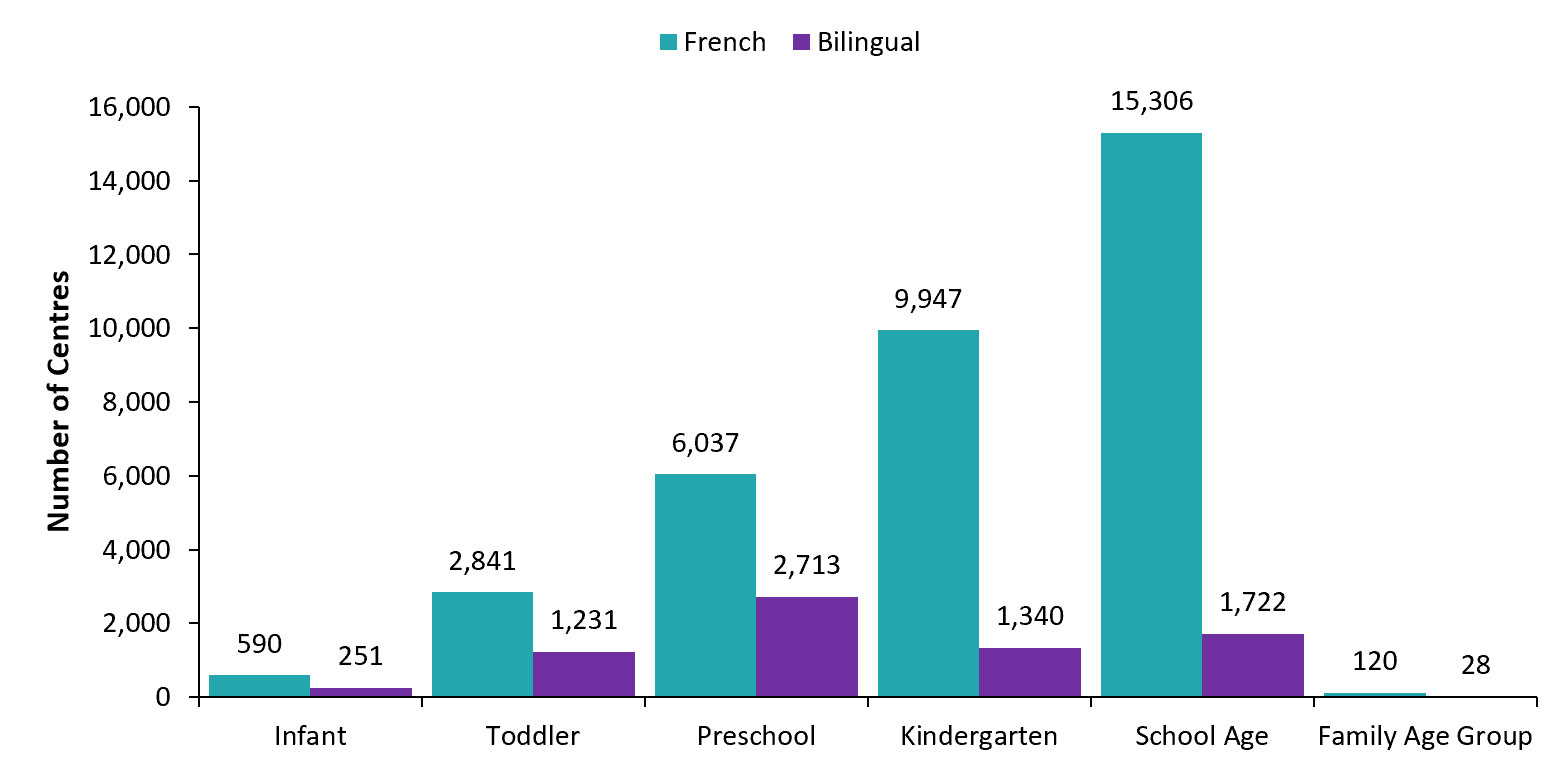
Some licensed child care centres offer services in French or in both English and French (i.e., bilingual). In 2019-20, of the 5,565 licensed child care centres, 308 (6%) offered programs in French, and 101 (2%) offered bilingual programs. Of the 462,802 licensed child care spaces, 34,841 (8%) were for programs in French and 7,285 (2%) were for bilingual programs. (For more about how these spaces are distributed by age, see Figure 8.)
Figure 8: Licensed child care spaces in French-language and bilingual child care by age group, 2019-20
| Age | French | Bilingual |
|---|---|---|
| Infant | 590 | 251 |
| Toddler | 2,841 | 1,231 |
| Preschool | 6,037 | 2,713 |
| Kindergarten | 9,947 | 1,340 |
| School age | 15,306 | 1,722 |
| Family age group | 120 | 28 |
Data source: Child Care Licensing System, Ontario Ministry of Education (as of March 31, 2020).
Parent fees by age group
In 2019, the most recent year of data available, median parent fees among licensed child care centres ranged from $66 per day for infants to $22 per day for school-aged children. Median parent fees among licensed home child care agencies ranged from $46 per day for children under 2 years of age to $25 per day for children aged 6 to 12 years.
Licensed child care continues to be more expensive for younger children than it is for older children. In general, daily parent fees for younger children were higher among licensed child care centres than home child care agencies. Conversely, fees for older children were lower at licensed child care centres than at home child care agencies. (See Figures 9 and 10.
Figure 9: Median daily fees by age group among licensed child care centres, 2019
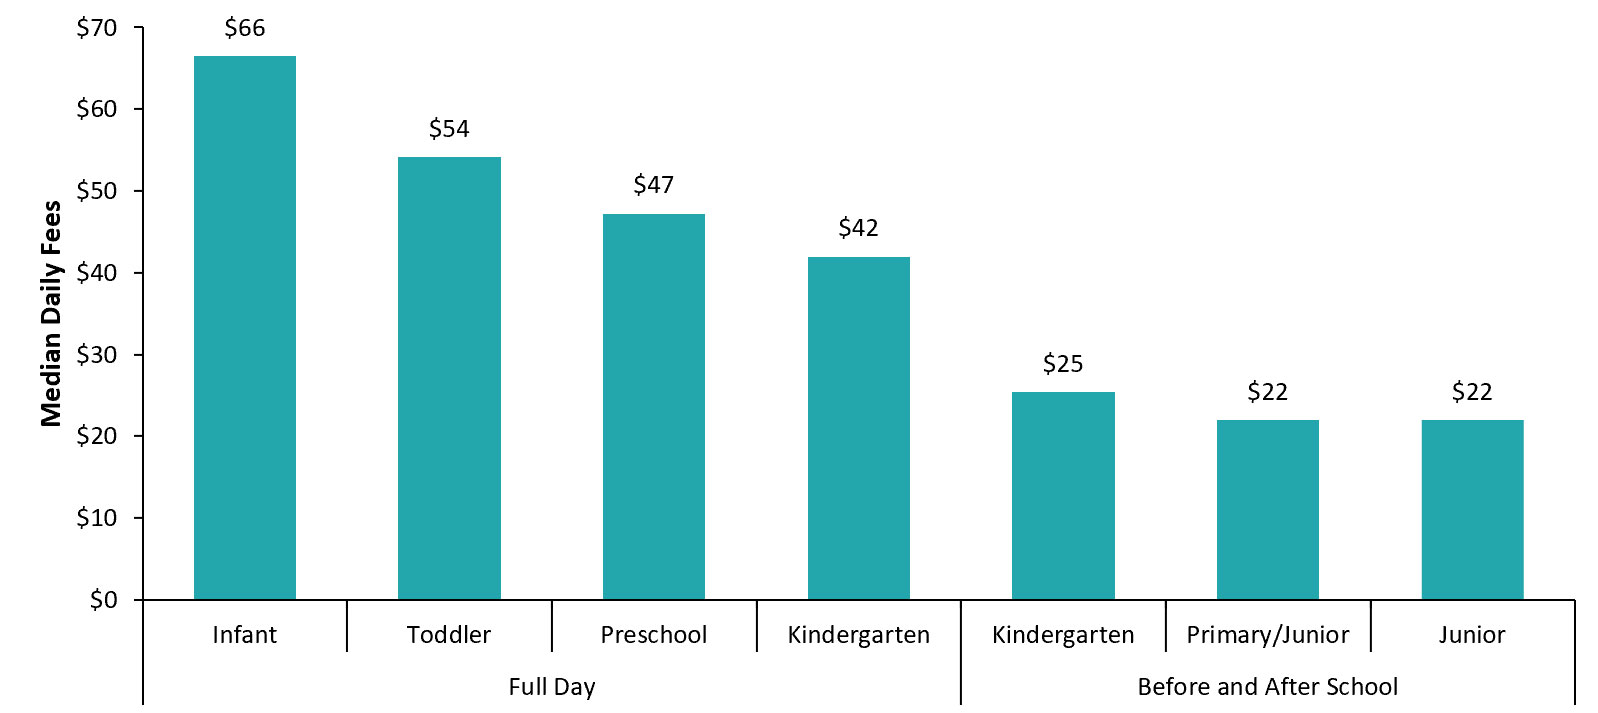
| Infant | Toddler | Preschool | Kindergarten |
|---|---|---|---|
| $66 | $54 | $47 | $42 |
| Kindergarten | Primary/junior | Junior |
|---|---|---|
| $25 | $22 | $22 |
Data source: 2019 Licensed Child Care Operations Survey, Ontario Ministry of Education (as of March 31, 2019).
Figure 10: Median daily fees by age group among licensed home child care agencies, 2019
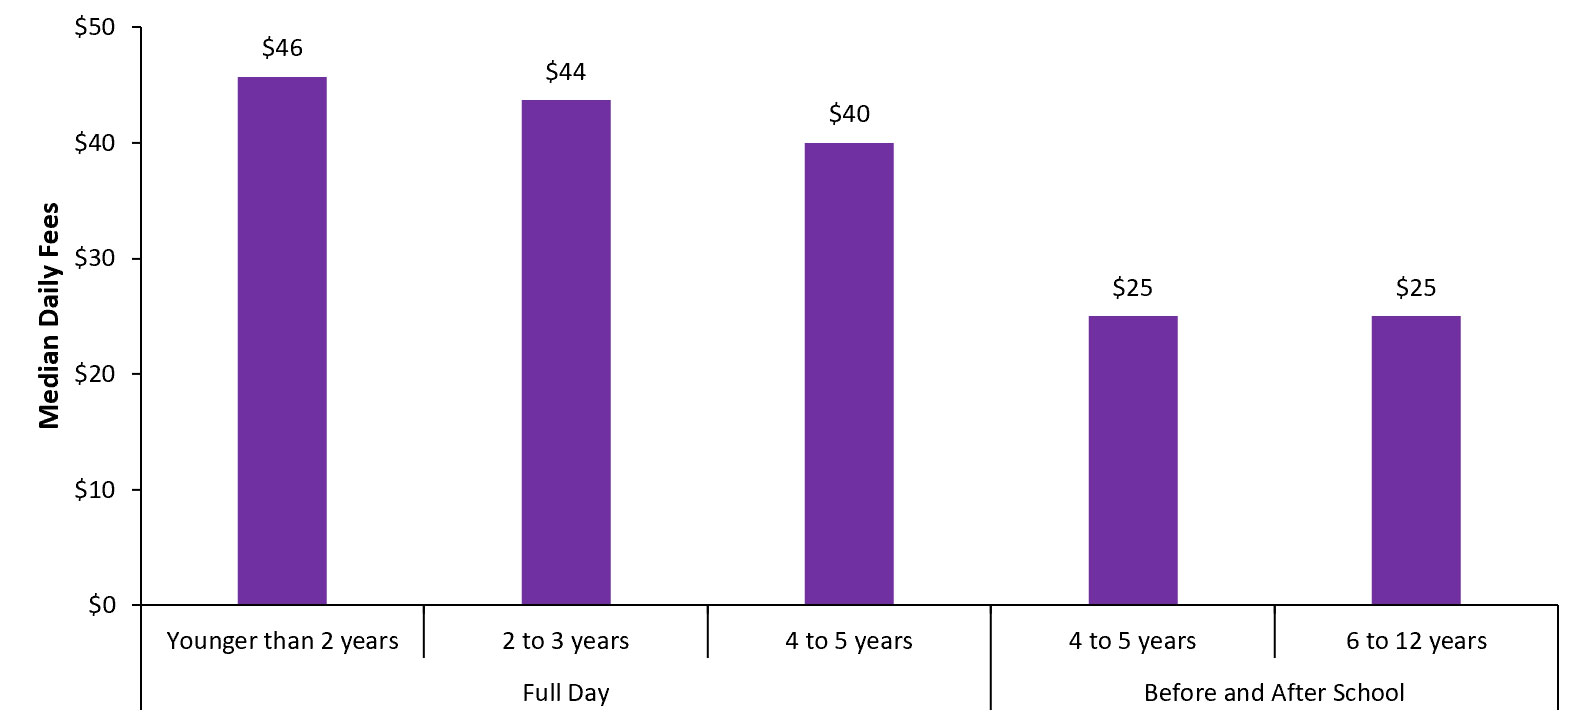
| Younger than 2 years | 2 to 3 years | 4 to 5 years |
|---|---|---|
| $46 | $44 | $40 |
| 4 to 5 years | 6 to 12 years |
|---|---|
| $25 | $25 |
Data source: 2019 Licensed Child Care Operations Survey, Ontario Ministry of Education (as of March 31, 2019).
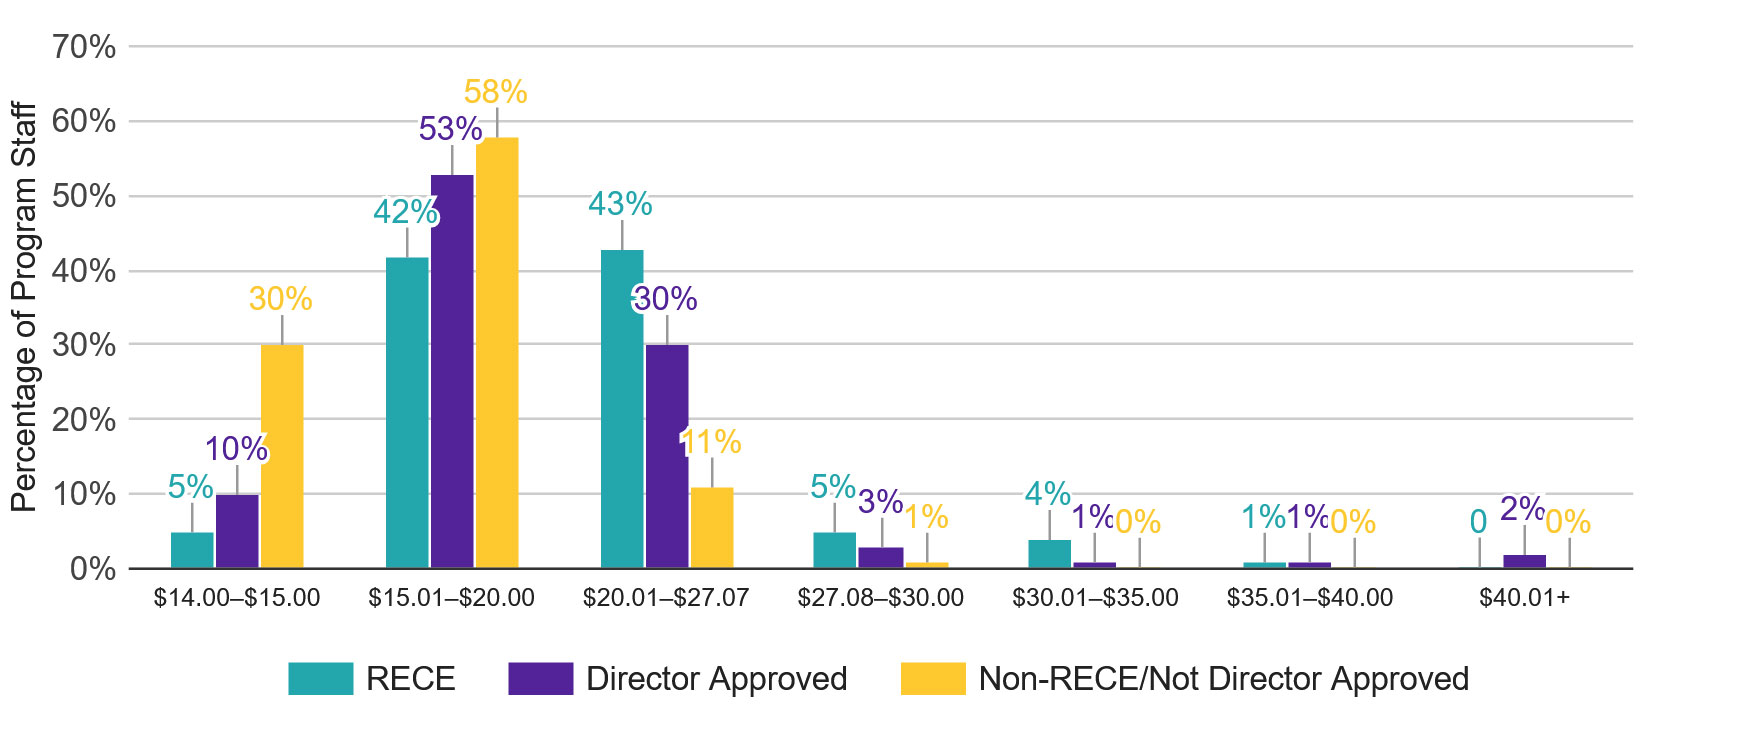
Staff wages by category
Program staff fall into one of three categories: Registered Early Childhood Educators (RECEs), staff approved by a ministry director,
Figure 11: Hourly wages of full-time program staff in licensed child care centres, 2019
| Wage range | RECE | Director approved | Non-RECE/not director approved |
|---|---|---|---|
| $14.00–$15.00 | 5% | 10% | 30% |
| $15.01–$20.00 | 42% | 53% | 58% |
| $20.01–$27.07 | 43% | 30% | 11% |
| $27.08–$30.00 | 5% | 3% | 1% |
| $30.01–$35.00 | 4% | 1% | 0% |
| $35.01–$40.00 | 1% | 1% | 0% |
| $40.01+ | 0% | 2% | 0% |
Data source: 2019 Licensed Child Care Operations Survey, Ontario Ministry of Education (as of March 31, 2019).
EarlyON Child and Family Centres
EarlyON Child and Family Centres offer free drop-in programs for caregivers and children from birth to six years old. The centres are open to all families in Ontario and offer a range of services:
- activities such as reading, storytelling, games, and sing-alongs
- advice from professionals trained in early childhood development
- information about other family services in the community
- opportunities to connect with other families with young children.
The ministry’s EarlyON Child and Family Centre web page allows parents and caregivers to find child and family programs in their communities.
Consolidated Municipal Service Managers and District Social Services Administration Boards assumed responsibility for EarlyON Child and Family Centres in January 2018. These service system managers are responsible for the local management of EarlyON centres as part of their responsibility for the management of child care and other human services.
As of March 31, 2020, there were approximately 1,296 EarlyON Child and Family Centre locations across Ontario, of which 475 were main EarlyON Child and Family Centre locations and 821 were mobile/satellite EarlyON Child and Family Centre locations.
Of the total number of EarlyON Child and Family Centre locations, approximately 396 offer non-standard hours, 116 offer French-language programming, and 65 offer Indigenous programming.
Indigenous-led programs and programs on reserve
As part of Ontario’s commitment to reconciliation with Indigenous peoples, the ministry established or enhanced 65 on reserve programs (5 enhanced, 60 new) and 61 programs in urban and rural communities (10 child care programs, 14 joint child care and child and family programs, and 37 child and family programs). (See Figure 12.)
Figure 12: Indigenous-led child care and child and family programs
| Key | Longitude | Latitude |
|---|---|---|
| Program on reserve | -88.516125474 | 52.745514926 |
| Program on reserve | -88.011441879 | 52.204584083 |
| Program on reserve | -94.543440075 | 49.892447610 |
| Program on reserve | -82.493359124 | 42.591934250 |
| Program on reserve | -92.940531666 | 48.710957497 |
| Program on reserve | -80.072115764 | 46.973195435 |
| Program on reserve | -85.421013841 | 55.008780876 |
| Program on reserve | -80.832978661 | 49.002912994 |
| Program on reserve | -81.776026233 | 46.066163876 |
| Program on reserve | -79.777382627 | 44.994685032 |
| Program on reserve | -94.446428132 | 49.707720638 |
| Program on reserve | -84.927164477 | 47.961157995 |
| Program on reserve | -90.229747449 | 51.091833907 |
| Program on reserve | -90.469314844 | 48.838896615 |
| Program on reserve | -94.943154281 | 50.129916644 |
| Program on reserve | -87.888062562 | 51.558898182 |
| Program on reserve | -79.873861161 | 46.323415895 |
| Program on reserve | -88.245322694 | 49.028907936 |
| Program on reserve | -77.141405257 | 44.185730174 |
| Program on reserve | -79.974363195 | 48.550095971 |
| Program on reserve | -80.811236516 | 46.772960542 |
| Program on reserve | -80.095148097 | 43.000018130 |
| Program on reserve | -87.557237452 | 48.883166962 |
| Program on reserve | -82.468128199 | 46.202065989 |
| Program on reserve | -92.521515568 | 49.625475618 |
| Program on reserve | -87.634738858 | 55.990661817 |
| Program on reserve | -86.957508471 | 50.232191185 |
| Program on reserve | -84.261524306 | 46.528504742 |
| Program on reserve | -81.468300821 | 42.787992333 |
| Program on reserve | -81.473387825 | 42.818983338 |
| Program on reserve | -93.176461790 | 50.379514336 |
| Program on reserve | -80.135698744 | 43.055182178 |
| Program on reserve | -87.959058492 | 49.602615035 |
| Program on reserve | -81.915573680 | 45.883319800 |
| Program on reserve | -84.150200023 | 46.536849334 |
| Program on reserve | -90.972147072 | 53.924038578 |
| Program on reserve | -82.416055698 | 42.935995040 |
| Program on reserve | -95.099310254 | 49.625647132 |
| Program on reserve | -80.273452219 | 45.513984273 |
| Program on reserve | -80.500756789 | 45.769407892 |
| Program on reserve | -93.386182643 | 48.711037000 |
| Program on reserve | -85.608740461 | 48.697990708 |
| Program on reserve | -80.600516480 | 51.262632716 |
| Program on reserve | -93.573223547 | 48.861382877 |
| Program on reserve | -74.645413661 | 44.999749214 |
| Program on reserve | -94.587144421 | 49.714509199 |
| Program on reserve | -81.409759805 | 42.819425341 |
| Program on reserve | -81.728089623 | 45.797541725 |
| Program on reserve | -93.972961194 | 49.394713852 |
| Program on reserve | -86.544242260 | 49.757920149 |
| Program on reserve | -89.884895000 | 53.823251000 |
| Program on reserve | -82.161817332 | 45.825471818 |
| Program on reserve | -78.375306861 | 44.462531619 |
| Program on reserve | -80.117515065 | 43.070407109 |
| Program on reserve | -89.262676043 | 48.354335705 |
| Program on reserve | -81.026822874 | 44.903031722 |
| Program on reserve | -81.998814987 | 43.178391809 |
| Program on reserve | -82.998628358 | 46.208346618 |
| Program on reserve | -81.178760230 | 46.397979021 |
| Program on reserve | -79.351270002 | 44.646658030 |
| Program on reserve | -86.269007852 | 48.626054497 |
| Program on reserve | -87.360303421 | 52.984051558 |
| Program on reserve | -93.327657085 | 53.063088047 |
| Program on reserve | -95.135744747 | 49.613993379 |
| Program on reserve | -89.449991419 | 50.283352175 |
| Program in urban and rural community | -93.398322269 | 48.611328041 |
| Program in urban and rural community | -78.963504177 | 43.935337161 |
| Program in urban and rural community | -80.927652214 | 44.576411043 |
| Program in urban and rural community | -79.875889257 | 44.743892027 |
| Program in urban and rural community | -79.418038194 | 44.612916174 |
| Program in urban and rural community | -79.885815245 | 44.727695179 |
| Program in urban and rural community | -80.743194252 | 43.113095139 |
| Program in urban and rural community | -82.408576149 | 42.989442247 |
| Program in urban and rural community | -80.492617052 | 43.447523019 |
| Program in urban and rural community | -82.208927031 | 42.380301085 |
| Program in urban and rural community | -82.185869235 | 42.404223014 |
| Program in urban and rural community | -81.267947017 | 43.005797246 |
| Program in urban and rural community | -75.686182047 | 45.426478239 |
| Program in urban and rural community | -75.779233030 | 45.373250210 |
| Program in urban and rural community | -75.660257032 | 45.431284247 |
| Program in urban and rural community | -75.659067002 | 45.437169061 |
| Program in urban and rural community | -76.689224051 | 45.472755094 |
| Program in urban and rural community | -77.056515156 | 44.217827118 |
| Program in urban and rural community | -77.973666058 | 45.140287004 |
| Program in urban and rural community | -81.330194122 | 48.470832236 |
| Program in urban and rural community | -82.163627089 | 45.811688234 |
| Program in urban and rural community | -84.356980016 | 46.520432023 |
| Program in urban and rural community | -81.016307087 | 46.667111082 |
| Program in urban and rural community | -79.448939037 | 46.307165234 |
| Program in urban and rural community | -94.486045985 | 49.765700874 |
| Program in urban and rural community | -88.313900839 | 49.025366854 |
| Program in urban and rural community | -86.534937745 | 49.781503897 |
| Program in urban and rural community | -89.248324800 | 48.394431039 |
| Program in urban and rural community | -89.290210991 | 48.380946110 |
| Program in urban and rural community | -94.558877871 | 49.755916964 |
| Program in urban and rural community | -79.379494198 | 43.653273177 |
| Program in urban and rural community | -79.190961098 | 43.751148058 |
| Program in urban and rural community | -79.369821253 | 43.669155017 |
| Program in urban and rural community | -79.288061033 | 43.738608153 |
| Program in urban and rural community | -79.490892119 | 43.686574043 |
| Program in urban and rural community | -79.448433210 | 43.691585131 |
| Program in urban and rural community | -79.335895039 | 43.679227231 |
| Program in urban and rural community | -78.326336132 | 44.278350106 |
| Program in urban and rural community | -78.322170251 | 44.277665126 |
| Program in urban and rural community | -79.867253116 | 43.262752124 |
| Program in urban and rural community | -78.970308087 | 42.898505057 |
| Program in urban and rural community | -80.083280049 | 42.994046028 |
| Program in urban and rural community | -82.975100250 | 42.315011238 |
| Program in urban and rural community | -80.257704168 | 43.138977117 |
| Program in urban and rural community | -79.060983159 | 43.238153252 |
| Program in urban and rural community | -81.275710210 | 42.981305192 |
| Program in urban and rural community | -79.749094064 | 47.508234129 |
| Program in urban and rural community | -94.558877871 | 49.755916964 |
| Program in urban and rural community | -93.759162929 | 51.086482860 |
| Program in urban and rural community | -79.674663026 | 43.630506018 |
| Program in urban and rural community | -79.875180165 | 44.749609095 |
| Program in urban and rural community | -82.296173055 | 42.763104057 |
| Program in urban and rural community | -75.640432020 | 45.410550250 |
| Program in urban and rural community | -80.034786212 | 45.349006014 |
| Program in urban and rural community | -84.319529083 | 46.532697107 |
| Program in urban and rural community | -84.329274104 | 46.511595211 |
| Program in urban and rural community | -79.448939037 | 46.307165234 |
| Program in urban and rural community | -94.452517743 | 49.783253940 |
| Program in urban and rural community | -91.920081820 | 50.098064998 |
| Program in urban and rural community | -89.228109853 | 48.430040147 |
| Program in urban and rural community | -80.942178000 | 44.568058000 |
Data sources: Ontario Ministry of Education; Statistics Canada.
Early years developmental health and well-being
Information on children’s developmental health and well-being prior to Grade 1 is collected throughout the province using the Early Development Instrument (EDI). The EDI is a questionnaire that teachers complete about the skills and abilities of each of their Year 2 (senior) kindergarten students. It measures developmental health and well-being across five domains:
- physical health and well-being
- social competence
- emotional maturity
- language and cognitive development
- communication skills and general knowledge.
The EDI is used as a population measure (i.e., a measure of whole populations based on geographical or administrative boundaries) by the ministry, municipalities, school boards, and community organizations to inform decision-making and plan early years programs and services. The ministry uses the EDI as a key indicator to monitor the state of young children in Ontario.
Since 2004, the EDI has been collected across the province in three-year cycles:
- over a three-year period for Cycle 1 (2004-06), Cycle 2 (2007-09), and Cycle 3 (2010-12)
- in a single year, every three years, for Cycle 4 (2015) and Cycle 5 (2018).
footnote 12
EDI results can be compared over time to get a sense of how young children’s developmental health and well-being is changing in Ontario. Examining the percentage of vulnerable children
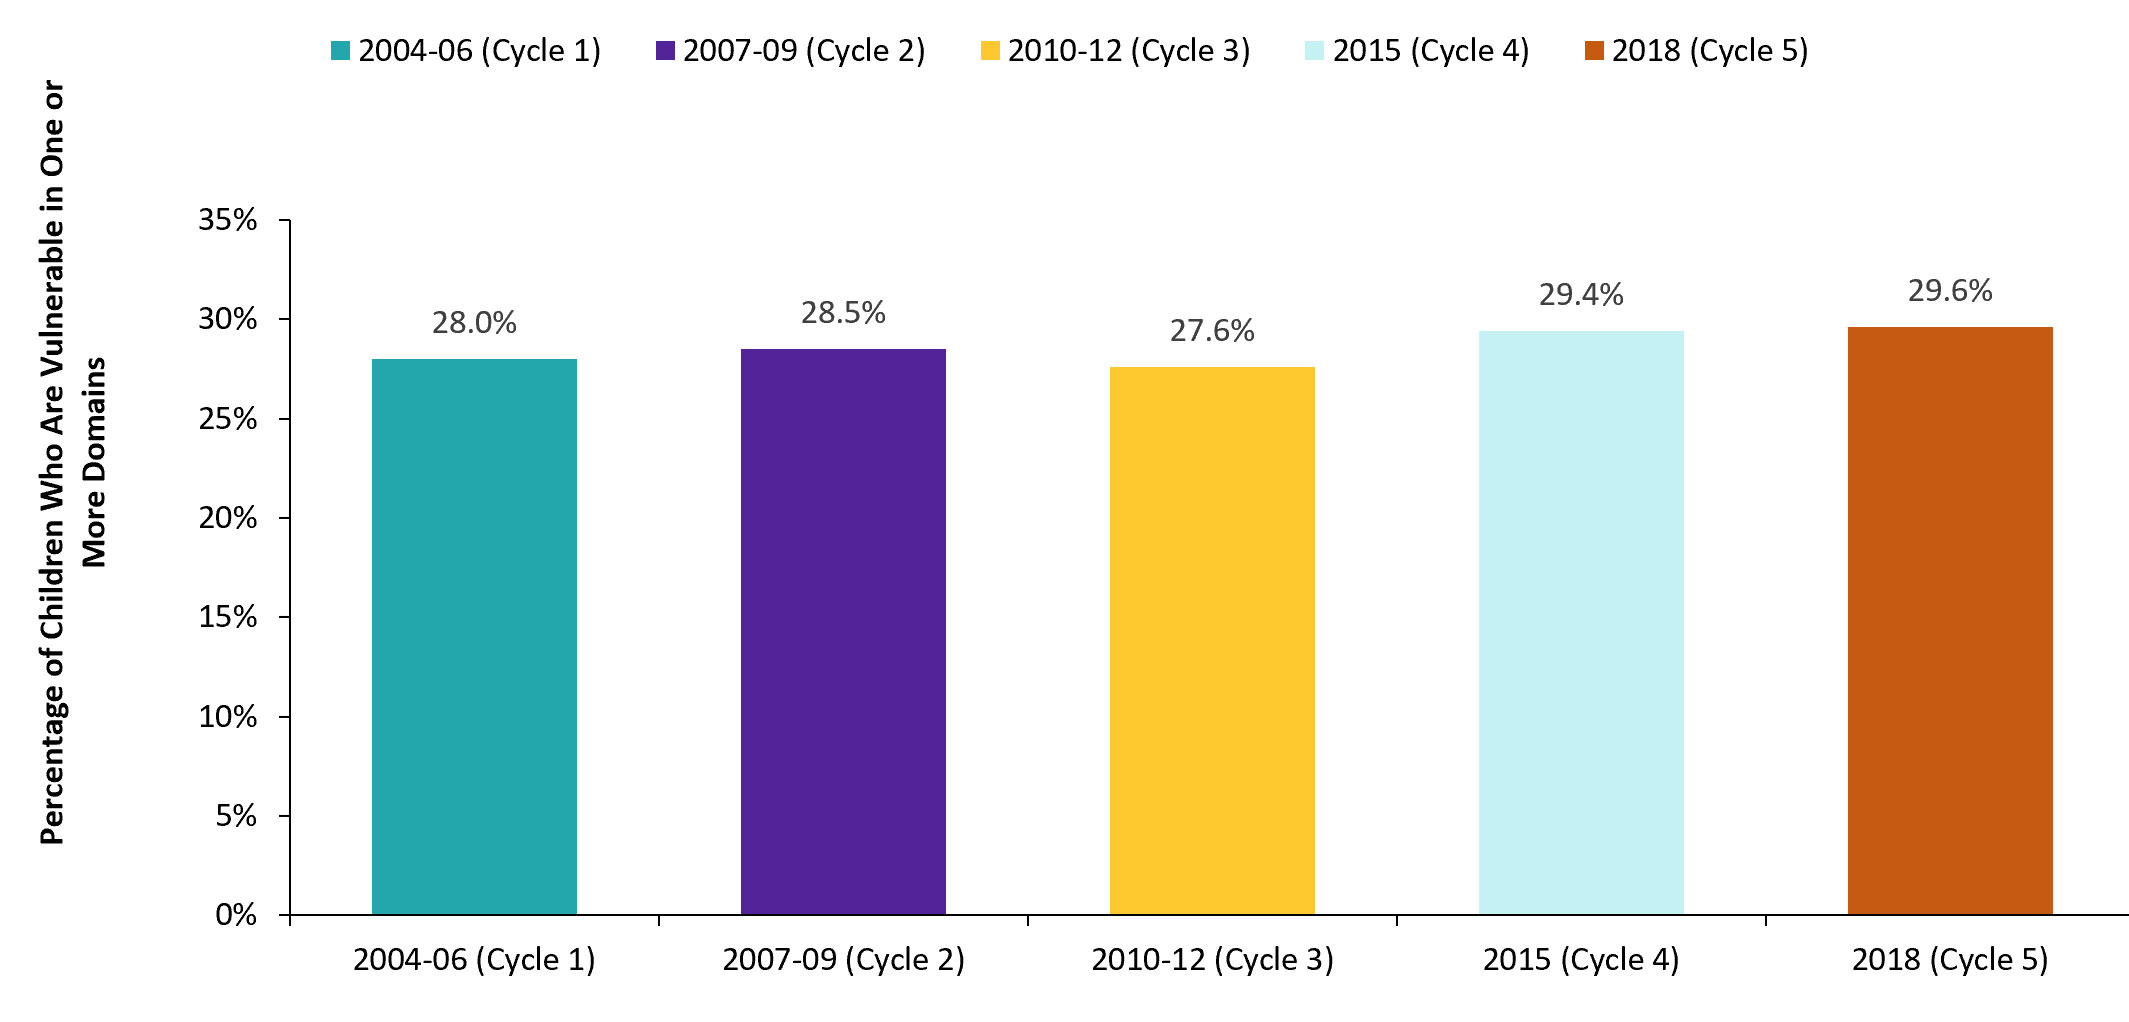
Overall, results remained relatively stable between Cycle 4 and Cycle 5. In 2018, 70.4% of children were considered developmentally ready when they entered Grade 1, compared to 70.6% in 2015.
Additional information about the EDI is available from the Offord Centre for Child Studies at McMaster University.
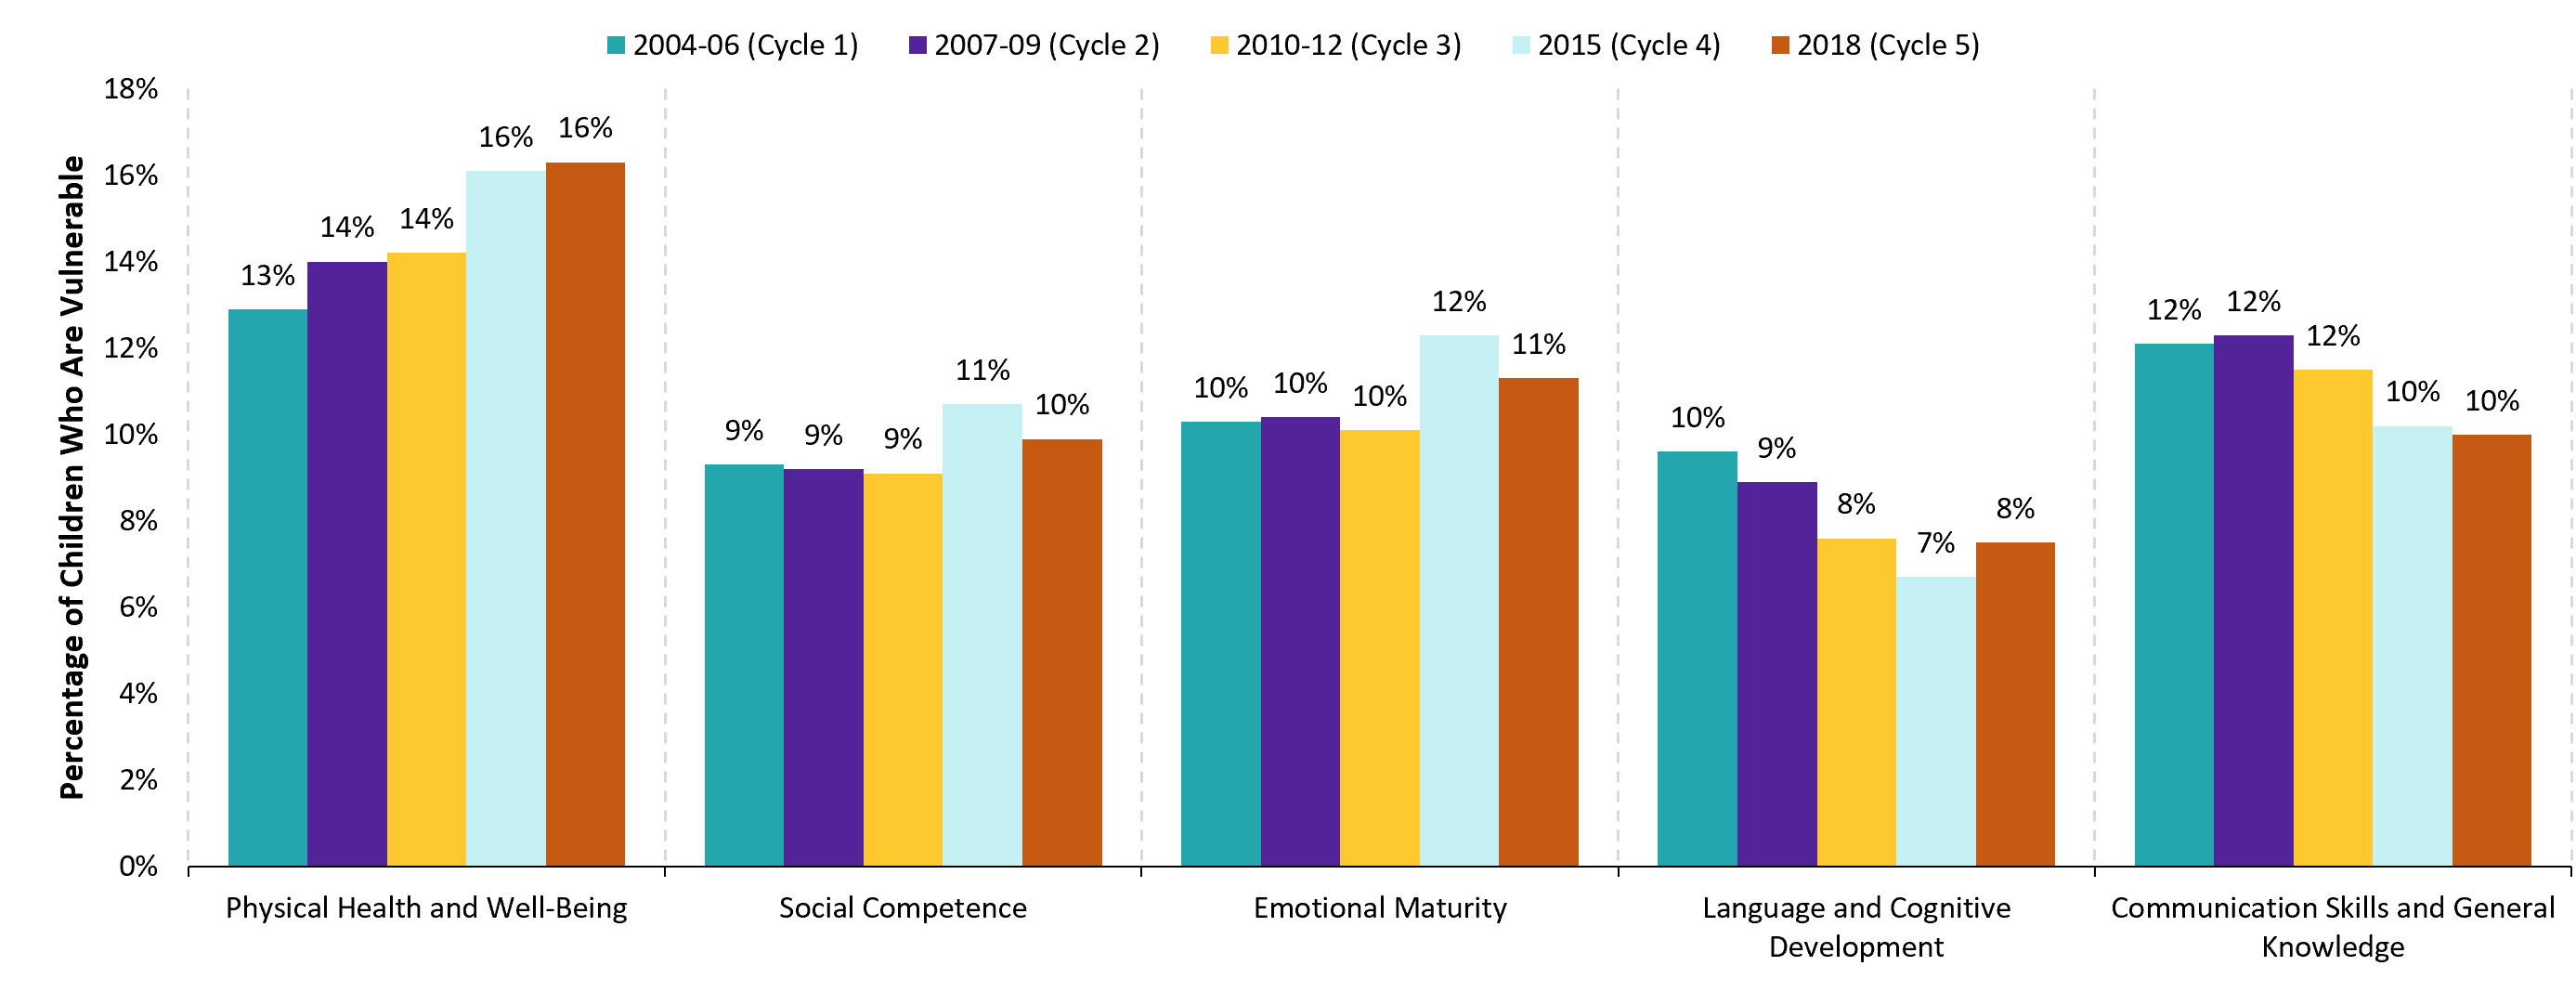
Figure 13: Percentage of vulnerable children by EDI domain, 2004-18
| Cycle | 2004-06 (Cycle 1) | 2007-09 (Cycle 2) | 2010-12 (Cycle 3) | 2015 (Cycle 4) | 2018 (Cycle 5) |
|---|---|---|---|---|---|
| Physical health and well-being | 13% | 14% | 14% | 16% | 16% |
| Social competence | 9% | 9% | 9% | 11% | 10% |
| Emotional maturity | 10% | 10% | 10% | 12% | 11% |
| Language and cognitive development | 10% | 9% | 8% | 7% | 8% |
| Communication skills and general knowledge | 12% | 12% | 12% | 10% | 10% |
Data source: Offord Centre for Child Studies, McMaster University.
Figure 14: Percentage of children who are vulnerable in one or more EDI domains, 2004-18
| Cycle | Percentage of children vulnerable in one or more domains |
|---|---|
| 2004-06 (Cycle 1) | 28.0% |
| 2007-09 (Cycle 2) | 28.5% |
| 2010-12 (Cycle 3) | 27.6% |
| 2015 (Cycle 4) | 29.4% |
| 2018 (Cycle 5) | 29.6% |
Data source: Offord Centre for Child Studies, McMaster University.
Part 3: Indicators under the Canada-Ontario Early Learning and Child Care Agreement
The federal government committed $400 million in their 2016 budget, and an additional $7 billion over 10 years in their 2017 budget, to establish a Multilateral Early Learning and Child Care Framework with provinces and territories.
On June 12, 2017, Ontario was the first province to sign an agreement under the framework, known as the three-year Canada-Ontario Early Learning and Child Care Agreement. Under the agreement, the federal government agreed to allocate $439 million to Ontario over three years (i.e., 2017-18, 2018-19, and 2019-20).
- $100 million to support access for children and families to child care
- $40 million to support access to EarlyON Child and Family Centres
- $6 million to support innovative approaches that provide access to high quality training and professional learning opportunities for the early years and child care workforce.
In July 2020, the federal and provincial governments agreed on a one-year extension of the Canada-Ontario Early Learning and Child Care Agreement, which will allocate nearly $147 million in 2020-21 for early learning and child care investments. In 2020-21, the federal funding will support short-term measures to minimize the impacts of COVID‑19 on Ontario’s early learning and child care system and will continue supporting the three initiatives outlined in the first three-year agreement as business resumes.
This section highlights Ontario’s progress in working towards increasing quality, accessibility, affordability, flexibility, and inclusion in early learning and child care under the Canada-Ontario Early Learning and Child Care Agreement. For more about the indicators that are being used to measure Ontario’s progress, see Appendix: List of Indicators under the Agreement.
Expenditures and actions
Under the agreement, Ontario received $146.7 million in federal funding in the 2019-20 fiscal year, of which $8.6 million was carried forward to the 2020-21 fiscal year. Ontario’s actual expenditures in the 2019-20 fiscal year were $144.3 million.
The 2019-20 funding supported the following three action areas:
- increasing access to affordable, high quality licensed child care
- increasing access to EarlyON Child and Family Centres
- innovative approaches to providing access to high quality training and professional learning opportunities for the early years and child care workforce.
Table 5: Canada-Ontario Early Learning and Child Care Agreement expenditures and actions for 2019-20
| Areas | Federal allocations | Actions | Actual expenditures |
|---|---|---|---|
Licensed child care | Ontario allocated $100 million of the federal funding for increased subsidies and access to licensed child care in Ontario. There are two components to this investment, including $80 million for children aged 0-6, and $20 million to support access to affordable child care across the system based on local priorities. | The federal funding was provided to service system managers through provincial-municipal service agreements. In December 2019, service system managers received consolidated 2020 service agreement and funding guidelines for licensed child care and EarlyON Child and Family Centres, including funding under the Canada-Ontario Early Learning and Child Care Agreement. | $100 million |
EarlyON | Ontario allocated $40 million of the federal funding to support the integration of child and family programs across the province into what became the EarlyON Child and Family Programs. | The federal funding was provided to service system managers through two-year service agreements. In January 2020, service system managers received revised guidelines and confirmation of their funding allocations. Funding in this category also included a one-time capital funding investment, which enabled the ministry, in 2017-18, to approve 81 new EarlyON Child and Family Centre rooms in 45 locations. | $40 million |
Professional development | Ontario allocated $2 million of the federal funding to increase the number of students supported through the Early Childhood Educators Qualifications Upgrade Program. | The federal funding was provided through grants that were made available for 2019-20 to support individuals working in eligible early years and child care settings to obtain an early childhood education diploma and/or leadership certification. | $4 million |
Professional development | Ontario allocated $3 million of the federal funding to Centres of Excellence for Early Years and Child Care to support professional learning for the early years and child care workforce. | The Provincial, Indigenous, and Francophone Centres of Excellence for Early Years and Child Care were launched in April 2018. A secretariat was also established to coordinate engagement and communication strategies among the three centres. The Centres of Excellence project ended in March 2020. | $4 million |
Licensed child care indicators
The indicators reported in this section are reflective of the areas of investment under the agreement for increasing quality, accessibility, affordability, flexibility, and inclusion in licensed child care (see Appendix: List of Indicators under the Agreement).
Quality
Staff qualifications
Ontario Regulation 137/15 under the Child Care and Early Years Act, 2014 sets out the minimum requirements for staff qualifications in licensed child care centres and home child care agencies, including requirements for the ratio of employees to children, the maximum number of children in a group, and the proportions of employees that must be qualified employees in licensed child care centres, which varies for different age groups (see Table 6). The minimum requirements are as follows:
A supervisor shall be a person who:
- is a member in good standing of the College of Early Childhood Educators, has at least two years of experience providing licensed child care, and is approved by a ministry director; or
- in the opinion of a director, is capable of planning and directing the program of a child care centre, being in charge of children, and overseeing staff.
A qualified employee for any licensed age group shall be a person who is:
- an employee who is a member in good standing of the College of Early Childhood Educators; or
- an employee who is otherwise approved by a director.
With respect to a licensed junior school age group or a licensed primary/junior school age group that includes only children who are junior school age, the following are also qualified employees:
- an employee who has a diploma or degree in child and youth care;
- an employee who has a diploma or degree in recreation and leisure services; or
- an employee who is a member in good standing with the Ontario College of Teachers.
A home child care visitor is an employee of a home child care agency who monitors and provides support at licensed home child care locations. A home child care visitor shall be a person who:
- is a member in good standing of the College of Early Childhood Educators, has at least two years of experience working with children under 13 years old, and is approved by a director; or
- is, in the opinion of a director, capable of providing support and supervision at a home child care premises.
Table 6: Staff/child ratios, group sizes and proportion of employees that must be qualified employees for different age categories in licensed child centre–based care
| Age categories | Age range | Ratio of employees to children | Maximum number of children in group | Proportion of employees that must be qualified employees |
|---|---|---|---|---|
| Infant | Younger than 18 months | 3 to 10 | 10 | 1/3 |
| Toddler | 18 months or older but younger than 30 months | 1 to 5 | 15 | 1/3 |
| Preschool | 30 months or older but younger than 6 years | 1 to 8 | 24 | 2/3 |
| Kindergarten | 44 months or older but younger than 7 years | 1 to 13 | 26 | 1/2 |
| Primary/junior school age | 68 months or older but younger than 13 years | 1 to 15 | 30 | 1/2 |
| Junior school age | 9 years or older but younger than 13 years | 1 to 20 | 20 | 1/1 |
Further information about requirements related to staffing, group size, and ages of children for the family age group can be found on the ministry’s family age group web page.
The ministry monitors and enforces staff qualification requirements in all licensed child care centres and home child care agencies. Centres and agencies meet the requirements by employing supervisors, staff, and home child care visitors who are RECEs, or through director approvals as described above. It is estimated that:
- 78% of licensed child care centres employed RECEs for supervisor positions
- 97% of licensed home child care agencies employed RECEs for all home child care visitor positions.
In 2019, the most recent year of data available, there were 31,083 full-time program staff employed by licensed child care centres of which 18,315 (59%) were RECEs.
Pedagogical framework
How Does Learning Happen? Ontario’s Pedagogy for the Early Years, 2014 (PDF) is a professional learning resource for those working in child care and child and family programs. It supports pedagogy and program development in early years settings that is shaped by views about children, educators, and families, and the relationships among them. Additional regulations under the Child Care and Early Years Act, 2014 are also in place to help child care licensees embed How Does Learning Happen? into practice.
As of March 31, 2020, all licensed child care centres and home child care agencies achieved compliance with the requirements regarding the development and implementation of a program statement consistent with How Does Learning Happen? either before their licence was first issued or before it was renewed. The ministry continues to support the implementation of the How Does Learning Happen? pedagogy in licensed child care programs in the province.
Access
As of March 31, 2020, there were 462,802 licensed child care spaces in centres across the province, with 16,206 spaces added to the system over the previous year. It is estimated that there are enough spaces in licensed child care centres for 23% of children in the province.
Table 7: Ontario child population, licensed spaces and percentage of children with access to licensed child care, 2018-19 to 2019-20
| Year | 2018-19 | 2019-20 |
|---|---|---|
| Child population aged 0-12 | 1,969,144 | 1,987,967 |
| Licensed spaces in centres for children aged 0-12 | 446,596 | 462,802 |
| Percentage of children aged 0-12 for whom there are licensed child care spaces | 22.7% | 23.3% |
Data source for child population: Ontario Ministry of Finance
Affordability
The funding under the Canada-Ontario Early Learning and Child Care Agreement supports new full and/or partial fee subsidies and increased access through the following priorities:
- Supporting children aged 0-6 years through additional fee subsidies, increased access, broadly reducing licensed child care fees and by increasing affordability, and/or not-for-profit community-based capital projects (excluding capital projects for child care programs that run during school hours for kindergarten and school age children).
- Supporting children aged 0-12 years through additional fee subsidies, increased access, and/or broadly reducing licensed child care fees and by increasing affordability.
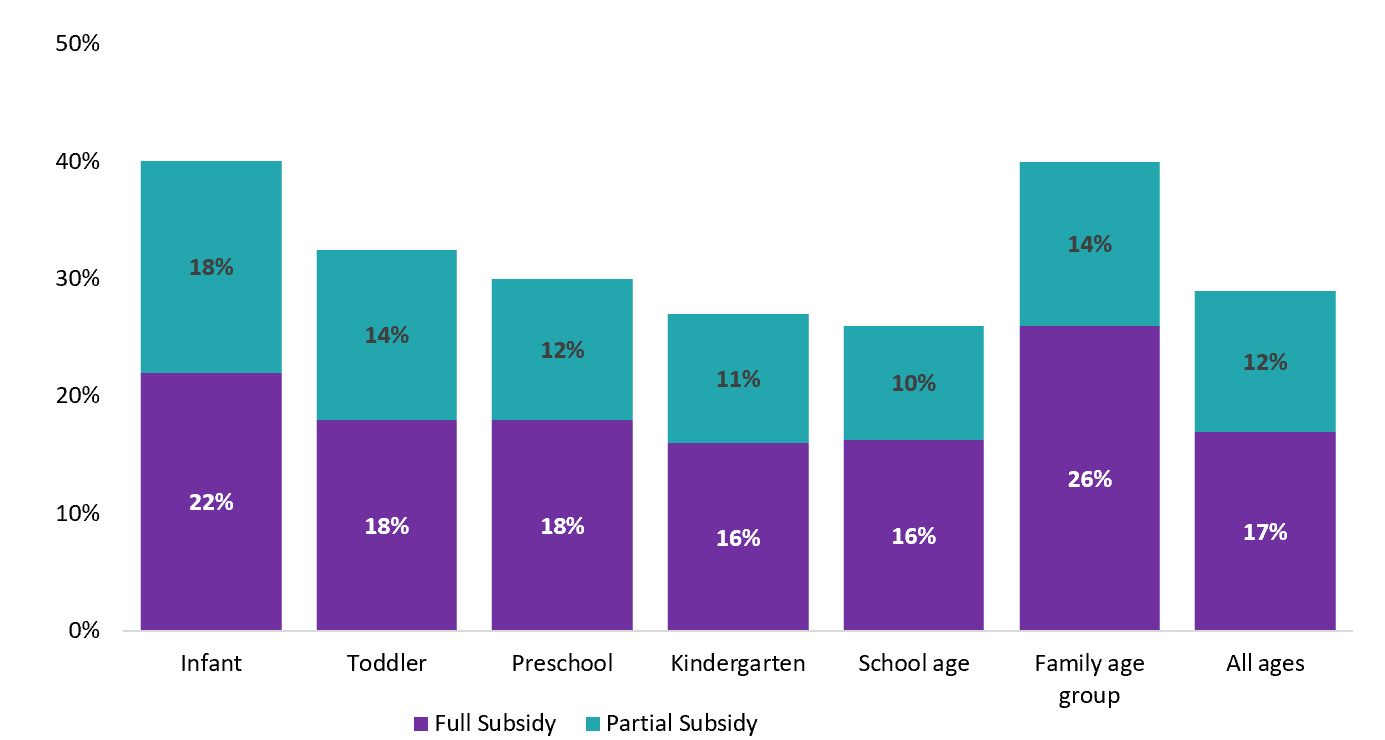
In 2019, the most recent year of data available, approximately 29% of children in licensed child care centres received a subsidy (see Figure 15), as did 68% of children in licensed home child care (see Figure 16).
Figure 15: Percentage of children in licensed child care centres receiving a full or partial subsidy by age, 2019
| Subsidy type | Full subsidy | Partial subsidy |
|---|---|---|
| Infant | 22% | 18% |
| Toddler | 18% | 14% |
| Preschool | 18% | 12% |
| Kindergarten | 16% | 11% |
| School age | 16% | 10% |
| Family age group | 26% | 14% |
| All ages | 17% | 12% |
Data source: 2019 Licensed Child Care Operations Survey, Ontario Ministry of Education (as of March 31, 2019).
Figure 16: Percentage of children in licensed home child care receiving a full or partial subsidy by age, 2019footnote 22
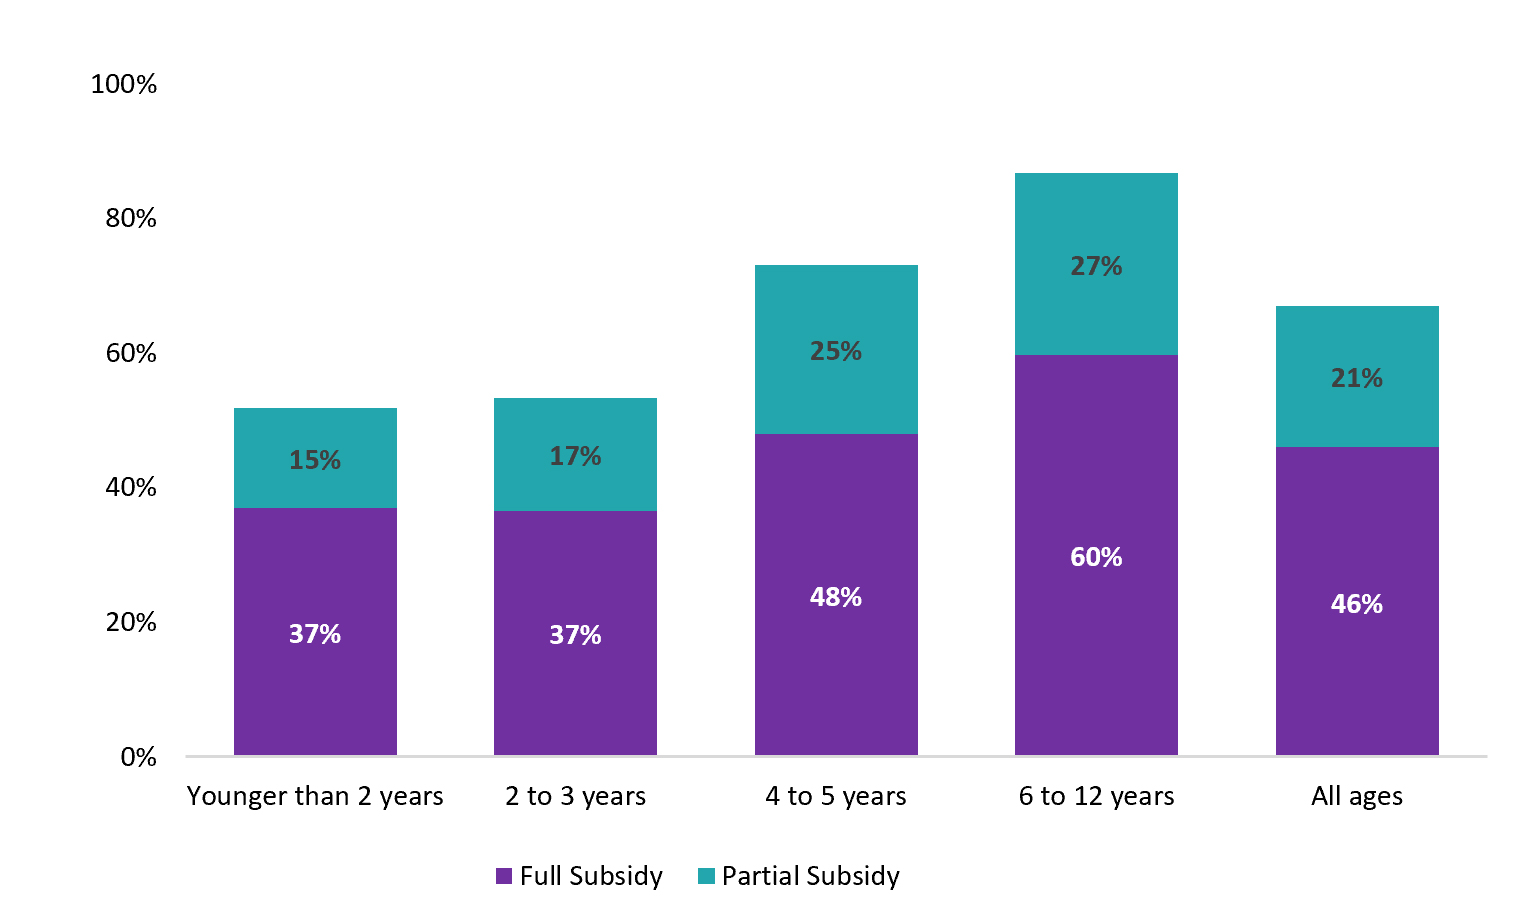
| Subsidy type | Full subsidy | Partial subsidy |
|---|---|---|
| Younger than 2 years | 37% | 15% |
| 2 to 3 years | 37% | 17% |
| 4 to 5 years | 48% | 25% |
| 6 to 12 years | 60% | 27% |
| All ages | 46% | 21% |
Data source: 2019 Licensed Child Care Operations Survey, Ontario Ministry of Education (as of March 31, 2019).
In 2018, the most recent year of data available, 147,764 children in Ontario received fee subsidies.
It is estimated that 75% of children who receive fee subsidies live in families with incomes of $40,000 and below (see Table 8).
Table 8: Percentage of children receiving fee subsidies by family income, 2018footnote 25
| Family income | Percentage |
|---|---|
| $20,000 and below | 41% |
| $20,001 - $40,000 | 34% |
| $40,001 - $60,000 | 17% |
| $60,001 - $80,000 | 6% |
| $80,001 - $100,000 | 2% |
| $100,000 and above | 1% |
| Total | 100% |
Data source: Education Finance Information System (estimated percentages), Ontario Ministry of Education
Flexibility and inclusion
Non-standard hours
Flexibility in child care service delivery is important for meeting the needs of parents and caregivers who work non-standard schedules. In Ontario, a small proportion of licensed child care centres and home child care providers offer care during non-standard hours:
- 10% of child care centres reported the availability of weekend care, and less than 1% reported the availability of care during the evening or overnight.
- 10% of home child care providers reported the availability of weekend care, 12% reported the availability of evening care, and 7% reported the availability of overnight care.
Special needs resourcing
The province provides Special Needs Resourcing funding to service system managers and First Nations to support the inclusion of children with special needs in licensed child care settings, including home child care, camps, and authorized recreation programs, at no additional cost to parents/guardians. Under Ontario Regulation 138/15, a “child with special needs” means a child whose cognitive, physical, social, emotional, or communicative needs, or whose needs relating to overall development, are of such a nature that additional supports are required for the child. A total of 31,483 children were funded through Special Needs Resourcing between January 1 and December 31, 2018, the most recent year of data available.
Indigenous-led child care centres
A total of 27 licensed child care centres reported that they were Indigenous-led organizations operating in urban and rural communities.
French-language and bilingual child care
As of March 31, 2020, a total of 308 centres offered French-language programs and 101 centres offered bilingual programs.
Children in licensed child care by income
The ministry does not collect income data from families that enroll their children in licensed child care. This indicator is estimated using the number of licensed child care spaces in the province, and data on the distribution of families across income levels from Statistics Canada.
As of March 31, 2020, there were 462,802 licensed child care spaces for children aged 0-12 in Ontario. Approximately 21% of families with children in the province earned a family income below $40,000, 40% earned between $40,000 and $100,000, and 39% earned above $100,000.
It is estimated, based on the income distribution, that:
- more than 97,000 spaces are used by children from families with income below $40,000
- more than 185,000 spaces are used by children from families with income between $40,000 and $100,000
- about 180,000 are used by children from families with income above $100,000.
EarlyON Child and Family Centres indicators
The indicators reported in this section are reflective of the areas of investment under the Canada-Ontario Early Learning and Child Care Agreement for increasing quality, accessibility, affordability, flexibility, and inclusion in child and family centres (see Appendix: List of Indicators under the Agreement).
Quality
Staff qualifications
Experiences in EarlyON Child and Family Centres are designed to foster positive outcomes and support nurturing relationships for children and their parents and caregivers based on the latest evidence and research. RECEs play a key role in delivering high quality early years programs because they have specialized knowledge and expertise in child development and in play- and inquiry-based learning.
Every EarlyON Child and Family Centre should employ at least one RECE, who oversees all mandatory core services related to supporting early learning and development. If an EarlyON Child and Family Centre is unable to recruit at least one RECE to deliver these core services, the service system manager may grant an exemption from the requirement, but must report the number of exemptions to the ministry.
EarlyON Child and Family Centres must ensure that they have at least one RECE on staff by January 1, 2023. However, EarlyON staff who are not RECEs but have more than 10 years of experience in relevant programs can be employed to meet this staffing requirement through a new grandparenting provision.
Pedagogical framework
EarlyON Child and Family Centres are expected to provide programs that reflect the view of children, parents and caregivers, and educators as competent, capable, curious, and rich in potential and experience. Guided by How Does Learning Happen? Ontario’s Pedagogy for the Early Years, EarlyON Child and Family Centres offer an environment that engages parents and caregivers as co-learners and leaders in influencing positive child, family, and community experiences and outcomes. In 2020, all 47 service system managers reported that the EarlyON Child and Family Centres under their management were in compliance with How Does Learning Happen?.
Access, affordability, flexibility, and inclusion
As of March 31, 2020, there were 1,296 EarlyON Child and Family Centre locations across Ontario, of which 475 were main EarlyON Child and Family Centre locations and 821 were mobile/satellite EarlyON Child and Family Centre locations.
Of the total number of locations, 396 locations offered non-standard hours, 116 offered French-language programming, and 65 offered Indigenous programming.
As of summer 2020, 81 new EarlyON Child and Family rooms in 45 locations are in the process of being established. These capital projects were initially approved in 2017-18 through the Community-Based Early Years and Child Care Capital Program, with the EarlyON Child and Family Centre portion of the capital projects funded under the Canada-Ontario Early Learning and Child Care Agreement.
The ministry is also monitoring EarlyON expansion supported through operating funding under the agreement. In 2018-19, the ministry allocated approximately $8.6 million to service system managers for community-based EarlyON Child and Family Centre funding needs, including:
- capital costs associated with previously approved projects
- first-time equipping
- minor capital renovations
- supplies to support the delivery and daily operation of programs
- maintenance.
In 2018, the most recent year of data available, 401,116 children were served by child and family programs at EarlyON centres,
Table 9: Number of children served and visits to EarlyON Child and Family Centres, 2017 to 2018footnote 33
| Item | 2017 | 2018 | Per cent increase |
|---|---|---|---|
| Number of children served | 334,268 | 401,116 | 20% |
| Number of visits by children | 2,119,624 | 2,733,002 | 29% |
| Number of visits by parents or caregivers | 1,636,106 | 2,083,118 | 27% |
Data source: Ontario Ministry of Education.
Professional learning indicators
The indicators reported in this section are reflective of the area of investment under the agreement for innovative approaches to providing access to high quality training and professional learning opportunities for the early years and child care workforce (see Appendix: List of Indicators under the Agreement).
Early Childhood Educators Qualifications Upgrade Program
This program enables individuals working in eligible early years and child care settings to apply for grants to support them in obtaining an early childhood education diploma and becoming eligible to apply for membership with the College of Early Childhood Educators. The program also provides opportunities for leadership development, targeted to those who are working in supervisory roles or who aspire to do so, and who are already RECEs. In addition, the program prioritizes funding for Francophone and First Nations, Métis, and Inuit applicants, as well as individuals working under director approvals or Letters of Permission.
Financial support is available to eligible applicants in the form of education grants, travel grants, and training allowances.
In 2019-20, the ministry allocated $3.5 million in provincial funding and $2 million in federal funding for the Early Childhood Educators Qualifications Upgrade Program. The ministry continues to work towards expanding access to the program to increase the number of RECEs in early years and child care programs. For example, part-time students (in addition to full-time students) are now eligible for direct sponsorship, where the grant program pays the school directly for the cost of tuition fees rather than requiring the students to pay up front and be reimbursed. In 2019-20, a total of 2,038 applications were approved under the Early Childhood Educators Qualifications Upgrade Program, an increase of 30% from 2018-19.
Centres of Excellence for Early Years and Child Care
Centres of Excellence for Early Years and Child Care were created as part of Ontario’s action plan under the Canada-Ontario Early Learning and Child Care Agreement. The Provincial, Indigenous, and Francophone Centres of Excellence were established to support professional learning across the province. They also served to connect practitioners, educational institutions, and service providers through innovative specialized networks across Ontario. A secretariat was put in place to coordinate engagement and communication strategies for the centres.
The Centres of Excellence were established to:
- support alignment with How Does Learning Happen? Ontario’s Pedagogy for the Early Years and promote cohesion in pedagogical approaches and practices across early years programs
- build the pedagogical leadership capacity of program staff in the early years sector through innovative models and strategies that are grounded in current research and that support positive, inclusive, and culturally relevant early years experiences for all children and their families
- create linkages to and/or develop professional learning resources that are responsive to the needs of the sector and accessible online through a Centre of Excellence portal.
The three Centres of Excellence trained their staff to lead networks across the province and offered innovative professional learning in all six regions of the province (as identified by the ministry). The 2018-20 Centres of Excellence agreements expired on March 31, 2020. In 2020-21, the ministry will invest in professional learning opportunities for Francophone and Indigenous professionals that will better meet their needs through more targeted, differentiated cultural and regional approaches, given that the needs are greatest in the Francophone and Indigenous sectors.
Appendix: List of indicators under the Agreement
| Principles | Indicators related to planned investment | Indicators as reported by Ontario | Reference to the data in the report |
|---|---|---|---|
| High quality child care | |||
| High quality | Number and percentage of providers with Early Childhood Education (ECE) certification | Number and percentage of program staff who are Registered Early Childhood Educators (RECEs) Percentage of licensed child care centres employing only RECEs for the positions requiring qualified employees | See "Staff Qualifications" under "Licensed Child Care Indicators" |
High quality | Number and percentage of programs adopting Ontario’s Pedagogy for the Early Years – How Does Learning Happen? | Number of affirmations confirming programming alignment with How Does Learning Happen? | See "Pedagogical Framework" under "Licensed Child Care Indicators" |
| Accessible affordable and flexible | Number and percentage of children who have access to licensed child care | Percentage of children aged 0-12 for whom there are licensed child care spaces | See "Access" under "Licensed Child Care Indicators" |
Accessible affordable and flexible | Number and percentage of children receiving subsidies | Number and percentage of children receiving child care fee subsidies | See "Affordability" under "Licensed Child Care Indicators" |
Accessible affordable and flexible | Number and percentage of licensed child care programs that offer flexible hours | Number and percentage of programs providing care during non-standard hours | See "Flexibility and Inclusion" under "Licensed Child Care Indicators" |
Accessible affordable and flexible | Number of additional licensed child care spaces created | Number of additional licensed child care spaces created in licensed centres | See "Access" under "Licensed Child Care Indicators" |
Accessible affordable and flexible | Number of children receiving subsidy by family income | Number and percentage of children receiving child care fee subsidies by family income | See "Affordability" under "Licensed Child Care Indicators" |
| Inclusive | Number of child care programs designed to serve French linguistic minority communities and Indigenous People off-reserve | Number of French-language licensed child care centres | See "French-language and Bilingual Child Care" under "Licensed Child Care Indicators" |
Inclusive | Number of child care programs designed to serve French linguistic minority communities and Indigenous People off-reserve | Number of Indigenous-led centres in urban and rural communities | See "Indigenous-led Child Care Centres" under "Licensed Child Care Indicators" |
Inclusive | Number of children with additional support needs participating in child care programs | Number of children funded through Special Needs Resourcing | See "Special Needs Resourcing" under "Licensed Child Care Indicators" |
Inclusive | Number and proportion of children from low-income and middle class families participating in early learning and child care programs | Number and percentage of children for whom a licensed space is available by income | See "Children in Licensed Child Care by Income" under "Licensed Child Care Indicators" |
| High quality early learning | |||
| High quality | Number and percentage of providers with Early Childhood Education (ECE) certification | Qualification requirements for program staff working in child and family centres | See "Staff Qualifications" under "EarlyON Child and Family Centres Indicators" |
High quality | Number and percentage of programs adopting Ontario’s Pedagogy for the Early Years – How Does Learning Happen? | Service guideline requires programming alignment with How Does Learning Happen? | See "Pedagogical Framework" under "EarlyON Child and Family Centres Indicators" |
| Accessible affordable and flexible | Number of new EarlyON Child and Family Centres (including full and part-time locations) | Number of EarlyON Child and Family programs offering full- and part-time hours | See "Access, Affordability, Flexibility and Inclusion" under "EarlyON Child and Family Centres Indicators" |
Accessible affordable and flexible | Number of child and family visits to early learning programs | Number of child and family visits to EarlyON Child and Family Centres | |
Accessible affordable and flexible | Number and percentage of children who have access to early learning programs | Number and percentage of children served by EarlyON Child and Family Centres | |
Accessible affordable and flexible | Number and percentage of early learning programs that offer flexible hours | Number and percentage of EarlyON Child and Family programs that offer programming during non- standard hours | |
| Inclusive | Number of early learning programs designed to serve French linguistic minority communities and Indigenous People off-reserve | Number of child and family centres that offer culturally relevant programming for Indigenous children and families | See "Access, Affordability, Flexibility and Inclusion" under "EarlyON Child and Family Centres Indicators" |
Inclusive | Number of early learning programs designed to serve French linguistic minority communities and Indigenous People off-reserve | Number of child and family centres that offer French- language programming for Francophone children and families | |
| Professional learning | |||
| Early Childhood Educators Qualifications Upgrade Program | Number of individuals supported through the Early Childhood Educators Qualifications Upgrade Program per annum | Number of individuals supported through the Early Childhood Educators Qualifications Upgrade Program | See "Early Childhood Educators Qualifications Upgrade Program" under "Professional Learning Indicators" |
| Innovative service delivery | Innovative service delivery to support professional learning | Number of Centres of Excellence established | See "Centres of Excellence for Early Years and Child Care" under "EarlyON Child and Family Centres" |
20-040
ISSN 2561-3227 (Online)
The Ministry of Education acknowledges the Government of Canada’s support in connection with the Multilateral Early Learning and Child Care Framework and the Canada-Ontario Early Learning and Child Care Agreement. Part 3 of this document outlines Ontario’s progress towards meeting early learning and child care goals under the agreement.
Footnotes
- footnote[1] Back to paragraph The “family age group” designation allows children of different ages in the same family to be placed in the same group in a play activity room, as long as they are between ages 0-12. This designation is used by licensed child care centres and came into effect September 1, 2017.
- footnote[2] Back to paragraph “Approved homes” refers to the maximum number of homes with which an agency is permitted to enter into a contract.
- footnote[3] Back to paragraph Data source: 2019 Licensed Child Care Operations Survey, Ontario Ministry of Education. Due to the COVID‑19 pandemic, the licensed child care survey was not collected in 2020.
- footnote[4] Back to paragraph “Active homes” refers to the number of home child care providers that have a contract/agreement with an agency.
- footnote[5] Back to paragraph In years prior to 2013-14, the total number of spaces may not be equal to the sum of the spaces, due to the exclusion of alternate capacity from the totals up to that point. (Alternate capacity refers to spaces that are licensed for different age groups to be used at different times.)
- footnote[6] Back to paragraph “Auspice” refers to the ownership and operation of a service. In this report, licensed child care centres are categorized into two types of auspice: not-for-profit and for-profit.
- footnote[7] Back to paragraph Data for 2015-16 and 2016-17 differ from corresponding data in the 2018 edition of the Early Years and Child Care Annual Report owing to updated information.
- footnote[8] Back to paragraph Data for 2015-16 and 2016-17 differ from corresponding data in the 2018 edition of the Early Years and Child Care Annual Report owing to updated information.
- footnote[9] Back to paragraph Different sets of age categories were used to collect data for licensed child care centres and licensed home child care agencies. Age categories used for licensed child care centres are in accordance with the Child Care and Early Years Act, 2014. These age categories do not apply to licensed home child care.
- footnote[10] Back to paragraph Ontario Regulation 137/15 sets out rules under the Child Care and Early Years Act, 2014 governing staff in licensed child care centres. For each group of children in licensed child care centres, the licensee is required to employ at least one program staff member who is listed on the College of Early Childhood Educators’ Public Register as a member in good standing or who has been otherwise approved by a director. For more information, see “Staff Qualifications” under “Licensed Child Care Indicators”.
- footnote[11] Back to paragraph Data source: EarlyON web page on Ontario.ca, Ontario Ministry of Education.
- footnote[12] Back to paragraph 113,323 EDI questionnaires were analysed for Cycle 1; 110,916 for Cycle 2; 119,494 for Cycle 3; 125,858 for Cycle 4; and 123,912 for Cycle 5.
- footnote[13] Back to paragraph “Vulnerable” describes children who score below the 10th percentile of the Ontario EDI baseline population scores. This indicates that they are struggling in comparison to the baseline population.
- footnote[14] Back to paragraph Quebec is not part of the Multilateral Early Learning and Child Care Framework.
- footnote[15] Back to paragraph Actual allocations may vary according to the latest population estimates.
- footnote[16] Back to paragraph Totals may not add up due to rounding.
- footnote[17] Back to paragraph Actual expenditures in 2019-20 are lower than the amount allocated for professional development due to underspending in 2019-20. The balance is being carried forward into 2020-21.
- footnote[18] Back to paragraph Data source: Child Care Licensing System, Ontario Ministry of Education (as of March 31, 2020).
- footnote[19] Back to paragraph Data source: 2019 Licensed Child Care Operations Survey, Ontario Ministry of Education (as of March 31, 2019).
- footnote[20] Back to paragraph The estimation does not account for children cared for in homes contracted with licensed home child care agencies.
- footnote[21] Back to paragraph The 2018-19 child population figure has been changed from the previous annual report due to the availability of updated population data.
- footnote[22] Back to paragraph The percentage reported in the “all ages” column does not add up due to rounding.
- footnote[23] Back to paragraph Data source: Education Finance Information System, Ontario Ministry of Education. The total number includes federal, provincial, and municipal funding sources.
- footnote[24] Back to paragraph Data source: Education Finance Information System, Ontario Ministry of Education.
- footnote[25] Back to paragraph The percentage of children receiving subsidies by family income does not add up due to rounding.
- footnote[26] Back to paragraph Data source: 2019 Licensed Child Care Operations Survey, Ontario Ministry of Education (as of March 31, 2019).
- footnote[27] Back to paragraph Data source: Education Finance Information System, Ontario Ministry of Education. The total number includes federal, provincial, and municipal funding sources.
- footnote[28] Back to paragraph Data source: 2019 Licensed Child Care Operations Survey, Ontario Ministry of Education (as of March 31, 2019).
- footnote[29] Back to paragraph Data source: Statistics Canada, 2016 Census of Population, Statistics Canada Catalogue no. 98-400-X2016104.
- footnote[30] Back to paragraph Data source: Ontario Ministry of Education.
- footnote[31] Back to paragraph Percentage is an estimate based on the number of children served and the total population of children in the province aged 0-6.
- footnote[32] Back to paragraph Data source: Ontario Ministry of Education. Based on the most recent year of data available.
- footnote[33] Back to paragraph The 2018 figures have been updated from those published in the 2019 annual report due to the availability of final 2018 data.
- footnote[34] Back to paragraph Data source: Ontario Ministry of Education. The 2019-20 total is based on an annual report submitted by the program administrator. The total number includes federal and provincial funding sources.
- footnote[35] Back to paragraph This column lists the indicators outlined in the Canada-Ontario Early Learning and Child Care Agreement.
- footnote[36] Back to paragraph “Early learning” under the Canada-Ontario Early Learning and Child Care Agreement refers to EarlyON Child and Family Centres in the context of Ontario.