Ontario’s Early Years and Child Care Annual Report 2022
Ontario’s Early Years and Child Care Annual Report 2022 describes the early years and child care system, key data and measures for child care and indicators under the Canada-Ontario Early Learning and Child Care Agreement.
Introduction
We know the integral role that the early years and child care system plays in supporting families and giving every child the best possible start in life. That is why the provincial government is committed to building a system that is high quality, inclusive and affordable.
To enable a better understanding of Ontario’s early years and child care system, this report provides an annual snapshot and year-over-year trends in the sector. In addition, the report supports Ontario's commitments to publishing the progress under the federal-provincial early learning and child care agreements. Most of the data presented in this report was collected between March 2021 and March 2022.
In 2021–22, Ontario’s early years and child care system continues to recover from the COVID‑19 pandemic and has seen a positive recovery. The number of licensed child care spaces grew by 8,459 to 472,997 spaces, with an increase from all age groups including 4.5% for infants, 4.0% for toddlers, 3.8% for preschool, 0.7% for kindergarten, 0.3% for school age and an increase from 842 to 924 spaces for the family age group.
- The number of licensed child care centres increased by 0.7% from 5,506 to 5,545 centres.
- Of the total number of licensed child care centres, 2,996 centres were located in publicly funded schools, 9 more centres compared to last year.
- The number of home child care agencies increased by 4.3% from 139 to 145. There were 8,731 approved homes affiliated with these agencies, representing a 2.0% increase.
When compared to March 2020 before the COVID‑19 pandemic:
- The child care sector has seen an increase of 10,195 spaces in centres, an increase from almost all age groups including 7.8% for infants, 6.2% for toddlers, 4.2% for preschool, and 0.9% for kindergarten. The only exception is the school age spaces which slightly decreased by about 0.3%.
- The number of home child care agencies increased by 10.7% from 131 to 145 since 2020, with a 5.2% increase in the number of approved homes.
Emergency child care
Emergency child care was a key Ministry of Education support program implemented at different times over the course of the COVID‑19 pandemic to mitigate the impacts that child care and school closures have had on front-line workers. This program was fully subsidized by the province so as not to financially penalize front-line workers while ensuring their children were in a safe environment while they continued to perform critical functions that Ontarians rely on.
The ECC program was implemented over several iterations. The first iteration ran from mid-March until the end of June 2020. The second iteration ran from January 4 to February 16, 2021. The third iteration, which ran from mid-April to the end of June 2021, at its peak, served over 12,000 children each day across over 700 sites province-wide. The fourth iteration of the ECC ran from January 5 to January 14, 2022 and served up to 8,900 children per day across almost 700 locations.
The Early Learning and Child Care Agreement
In June 2017, following the establishment of the Federal-Provincial-Territorial (FPT) Multilateral Early Learning and Child Care Framework, Ontario entered into the Early Learning and Child Care (ELCC) agreement with the federal government.
Priorities
The FPT Multilateral ELCC Framework was designed to underpin ELCC funding of activities that would support an early learning and child care system that is high quality, accessible, affordable, flexible, and inclusive. The federal government invested $7.5 billion over 11 years in early learning and child care. This agreement was renewed in 2020 for a one-year period.
In August 2021, Canada and Ontario renewed the ELCC agreement for a further four years from April 1, 2021 to March 31, 2025, with expected funding levels of $146 million in fiscal year 2021–22 rising to $211 million in fiscal year 2024–25.
In Ontario, funding under the ELCC agreement is used to support:
- over 11,000 children through subsidized child care spaces and community-based capital projects
- the operation of more than 80 EarlyON Child and Family Centres in 45 locations across the province, providing families with culturally and linguistically appropriate programs
- the workforce by assisting over 2,000 child care staff to obtain their certification (2021 data)
- in fiscal year 2021–22, short-term measures to minimize the impacts of COVID‑19 on Ontario's early years and child care sector
Implementation activities
In 2021–22, the ELCC funding has supported access to:
- affordable, high quality licensed child care ($100 million)
- no-cost, high quality early years experiences through EarlyON Child and Family Centres ($41.7 million)
- High quality training and professional learning opportunities for the early years and child care workforce ($5 million)
Ontario's approach for the one-time Early Childhood Workforce funding provides for flexible, multi-faceted strategies recognizing the importance of not only recruiting new individuals into the profession, but also retaining, supporting, and recognizing the existing child care and early years workforce.
The Early Childhood Workforce Agreement
Priorities
In August 2021, Canada and Ontario also signed the Early Childhood Workforce Agreement (WFA) for $149.9 million in one-time funding to support the retention and recruitment of a high-quality child care and early years workforce. This funding will support the following objectives:
- sustain the existing child care and early years workforce to ensure a more stable and high-quality early years and child care system
- enhance access to opportunities for the workforce that promote retention and recruitment, including professional development, training, and qualification upgrade programs
- grow the number of qualified staff in the early years and child care workforce to increase access to licensed child care for families
- attract and support the development of an increasingly diverse workforce to reflect the children and families accessing early years and child care programs more effectively
Ontario will utilize the investment to build on the success of existing programs that support the child care and early years workforce, funded by the provincial and federal government, and implemented by Consolidated Municipal Service Managers/District Social Services Administration Boards (CMSMs/DSSABs), First Nation, Francophone, and other child care and early years partners.
Federal investments will be incremental and will not displace existing Ontario spending in support of the early childhood workforce.
Implementation activities
This funding will help support and retain the current child care and early years workforce, and attract new individuals into the profession. The Ministry of Education is investing in the following initiatives to achieve this objective:
- Professional Learning and Development Strategy ($74 million)
- Workforce Capacity and Innovation Fund ($71.5 million)
- ECE Qualifications Upgrade Program ($3.0 million)
- Equity-based Communities of Practice ($1.5 million)
Ontario’s CWELCC action plan includes the indicators for the initiatives under the Early Childhood Workforce Agreement that will be used to measure progress.
The Canada-wide Early Learning and Child Care Agreement
In March 2022, Ontario signed a historic deal with the federal government that will lower licensed child care fees to an average of $10 a day by September 2025. As a first step, families will see an average 25% reduction in their fees retroactive to April 1, 2022, which will be further reduced to 50% by the end of December 2022.
Priorities
Ontario’s action plan under the Canada-wide Early Learning and Child Care (CWELCC) Agreement outlines the key principles and priorities for this funding as well as the actions to be taken in the fiscal years 2022–23 and 2023–24 to work towards the goal of implementing CWELCC. The action plan sets targets that align with five priority areas:
- Lowering fees
- by 2025–26, average parent fees for children under six will be $10/day inclusive of fee subsidies
- Increasing access
- by the end of 2026, 86,000 new licensed child care spaces (above 2019 levels) for children under six are operational
- Enhancing quality
- by the end of 2025-26, Registered Early Childhood Educators (RECEs) make up 60% of the workforce in licensed child care
- Supporting inclusion
- by 2025-26, more Indigenous and Francophone children, as well as children from vulnerable families, can access high-quality, inclusive child care
- Strengthening data/reporting
- by 2025-26, Ontario’s data and reporting systems are modernized and upgraded to effectively support implementation and measure success
Implementation activities
The ministry’s early implementation activities focussed on enrolling licensed programs into CWELCC, enabling the first fee reduction of 25%, and providing wage floor for Registered Early Childhood Educators (RECEs).
Key milestones in the CWELCC implementation journey included:
- April 2022: The ministry released the funding guidelines, referred to as the Addendum to Ontario Child Care and EarlyON Child and Family Centres Service Management and Funding Guideline (2022).
- May 2022: The first CWELCC cashflow payment was flowed to service system managers to support implementation.
- July 2022: The ministry established a Minister’s Advisory Group of sector partners to engage in roundtable discussions on key priorities.
- August 2022: The ministry released a revised addendum to provide additional clarification to further assist service system managers and licensees in implementing CWELCC across the province.
- December 2022: The ministry released the 2023 CWELCC funding allocations and guidelines and initial space targets to service system managers.
Reporting on progress
Ontario’s CWELCC action plan outlines the indicators that will be used to measure progress and commits to reporting on the results achieved according to the indicators and targets starting in the fiscal year 2023 to 2024.
As of November 1, 2022:
- 92% of licensed programs have opted-in to the CWELCC system
- 27% of licensed programs that have opted in have provided rebates to parents
In summary
Our early years and child care sector has showed high resilience and has successfully emerged from the COVID pandemic. To our partners: child care workers, child care operators, First Nation communities, Consolidated Municipal Service Managers and District Social Services Administration Boards, we would like to say thank you for all you have done throughout the pandemic to keep Ontario’s children well cared for and safe. Data in this report demonstrates what we have achieved together.
Looking to the future, we value our early years and child care partners’ support, cooperation, and advice in continuing our journey together to implement the Canada-Wide Early Leaning and Child Care system in the province.
Part 1: Overview of the early years and child care system
The Ministry of Education sets overall policy, legislation, and regulations for the child care and early years sector, under the authority of the Child Care and Early Years Act, 2014, and licenses child care providers across the province. The ministry also conducts inspections and investigates complaints about licensed and unlicensed child care.
The ministry oversees and licenses two types of child care:
- licensed child care centres
- home child care agencies, that contract with home child care providers
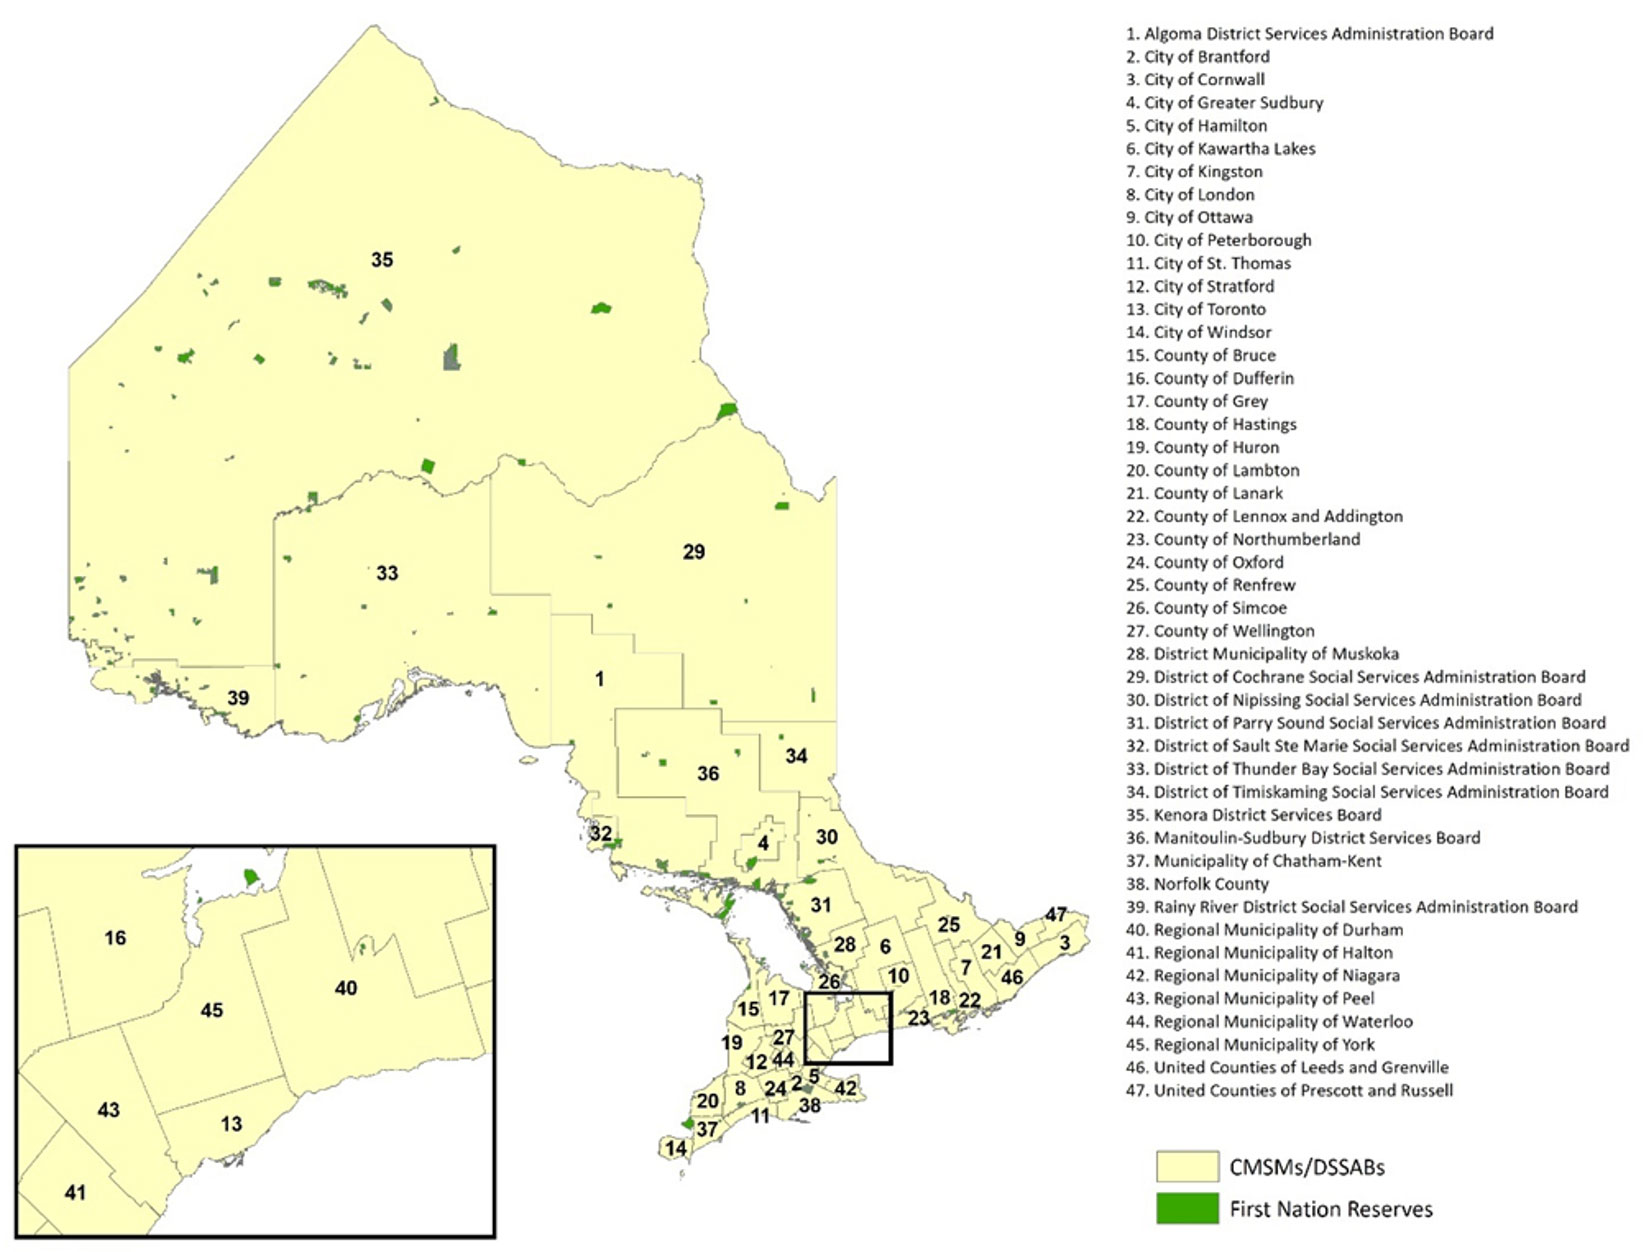
The provincial government provides funding to 47 local service system managers, known as Consolidated Municipal Service Managers (CMSMs) and District Social Services Administration Boards (DSSABs), to support licensed child care and child and family programs in the province (see Figure 1). These service system managers have the authority to determine funding priorities within their local systems, provided they comply with provincial legislation, policies, and guidelines.
Figure 1: Consolidated Municipal Service Managers and District Social Services Administration Boards in Ontario
| Location name | Type |
|---|---|
| Algoma District Services Administration Board | Consolidated Municipal Service Managers/District Social Services Administration Boards |
| City of Brantford | Consolidated Municipal Service Managers/District Social Services Administration Boards |
| City of Cornwall | Consolidated Municipal Service Managers/District Social Services Administration Boards |
| City of Greater Sudbury | Consolidated Municipal Service Managers/District Social Services Administration Boards |
| City of Hamilton | Consolidated Municipal Service Managers/District Social Services Administration Boards |
| City of Kawartha Lakes | Consolidated Municipal Service Managers/District Social Services Administration Boards |
| City of Kingston | Consolidated Municipal Service Managers/District Social Services Administration Boards |
| City of London | Consolidated Municipal Service Managers/District Social Services Administration Boards |
| City of Ottawa | Consolidated Municipal Service Managers/District Social Services Administration Boards |
| City of Peterborough | Consolidated Municipal Service Managers/District Social Services Administration Boards |
| City of St. Thomas | Consolidated Municipal Service Managers/District Social Services Administration Boards |
| City of Stratford | Consolidated Municipal Service Managers/District Social Services Administration Boards |
| City of Toronto | Consolidated Municipal Service Managers/District Social Services Administration Boards |
| City of Windsor | Consolidated Municipal Service Managers/District Social Services Administration Boards |
| County of Bruce | Consolidated Municipal Service Managers/District Social Services Administration Boards |
| County of Dufferin | Consolidated Municipal Service Managers/District Social Services Administration Boards |
| County of Grey | Consolidated Municipal Service Managers/District Social Services Administration Boards |
| County of Hastings | Consolidated Municipal Service Managers/District Social Services Administration Boards |
| County of Huron | Consolidated Municipal Service Managers/District Social Services Administration Boards |
| County of Lambton | Consolidated Municipal Service Managers/District Social Services Administration Boards |
| County of Lanark | Consolidated Municipal Service Managers/District Social Services Administration Boards |
| County of Lennox & Addington | Consolidated Municipal Service Managers/District Social Services Administration Boards |
| County of Northumberland | Consolidated Municipal Service Managers/District Social Services Administration Boards |
| County of Oxford | Consolidated Municipal Service Managers/District Social Services Administration Boards |
| County of Renfrew | Consolidated Municipal Service Managers/District Social Services Administration Boards |
| County of Simcoe | Consolidated Municipal Service Managers/District Social Services Administration Boards |
| County of Wellington | Consolidated Municipal Service Managers/District Social Services Administration Boards |
| District Municipality of Muskoka | Consolidated Municipal Service Managers/District Social Services Administration Boards |
| District of Cochrane Social Services Administration Board | Consolidated Municipal Service Managers/District Social Services Administration Boards |
| District of Nipissing Social Services Administration Board | Consolidated Municipal Service Managers/District Social Services Administration Boards |
| District of Parry Sound Social Services Administration Board | Consolidated Municipal Service Managers/District Social Services Administration Boards |
| District of Sault Ste Marie Social Services Administration Board | Consolidated Municipal Service Managers/District Social Services Administration Boards |
| District of Thunder Bay Social Services Administration Board | Consolidated Municipal Service Managers/District Social Services Administration Boards |
| District of Timiskaming Social Services Administrations Board | Consolidated Municipal Service Managers/District Social Services Administration Boards |
| Kenora District Services Board | Consolidated Municipal Service Managers/District Social Services Administration Boards |
| Manitoulin-Sudbury District Services Board | Consolidated Municipal Service Managers/District Social Services Administration Boards |
| Municipality of Chatham-Kent | Consolidated Municipal Service Managers/District Social Services Administration Boards |
| Norfolk County | Consolidated Municipal Service Managers/District Social Services Administration Boards |
| Rainy River District Social Services Administration Board | Consolidated Municipal Service Managers/District Social Services Administration Boards |
| Regional Municipality of Durham | Consolidated Municipal Service Managers/District Social Services Administration Boards |
| Regional Municipality of Halton | Consolidated Municipal Service Managers/District Social Services Administration Boards |
| Regional Municipality of Niagara | Consolidated Municipal Service Managers/District Social Services Administration Boards |
| Regional Municipality of Peel | Consolidated Municipal Service Managers/District Social Services Administration Boards |
| Regional Municipality of Waterloo | Consolidated Municipal Service Managers/District Social Services Administration Boards |
| Regional Municipality of York | Consolidated Municipal Service Managers/District Social Services Administration Boards |
| United Counties of Leeds & Grenville | Consolidated Municipal Service Managers/District Social Services Administration Boards |
| United Counties of Prescott and Russell | Consolidated Municipal Service Managers/District Social Services Administration Boards |
Data sources: Ontario Ministry of Education and Statistics Canada.
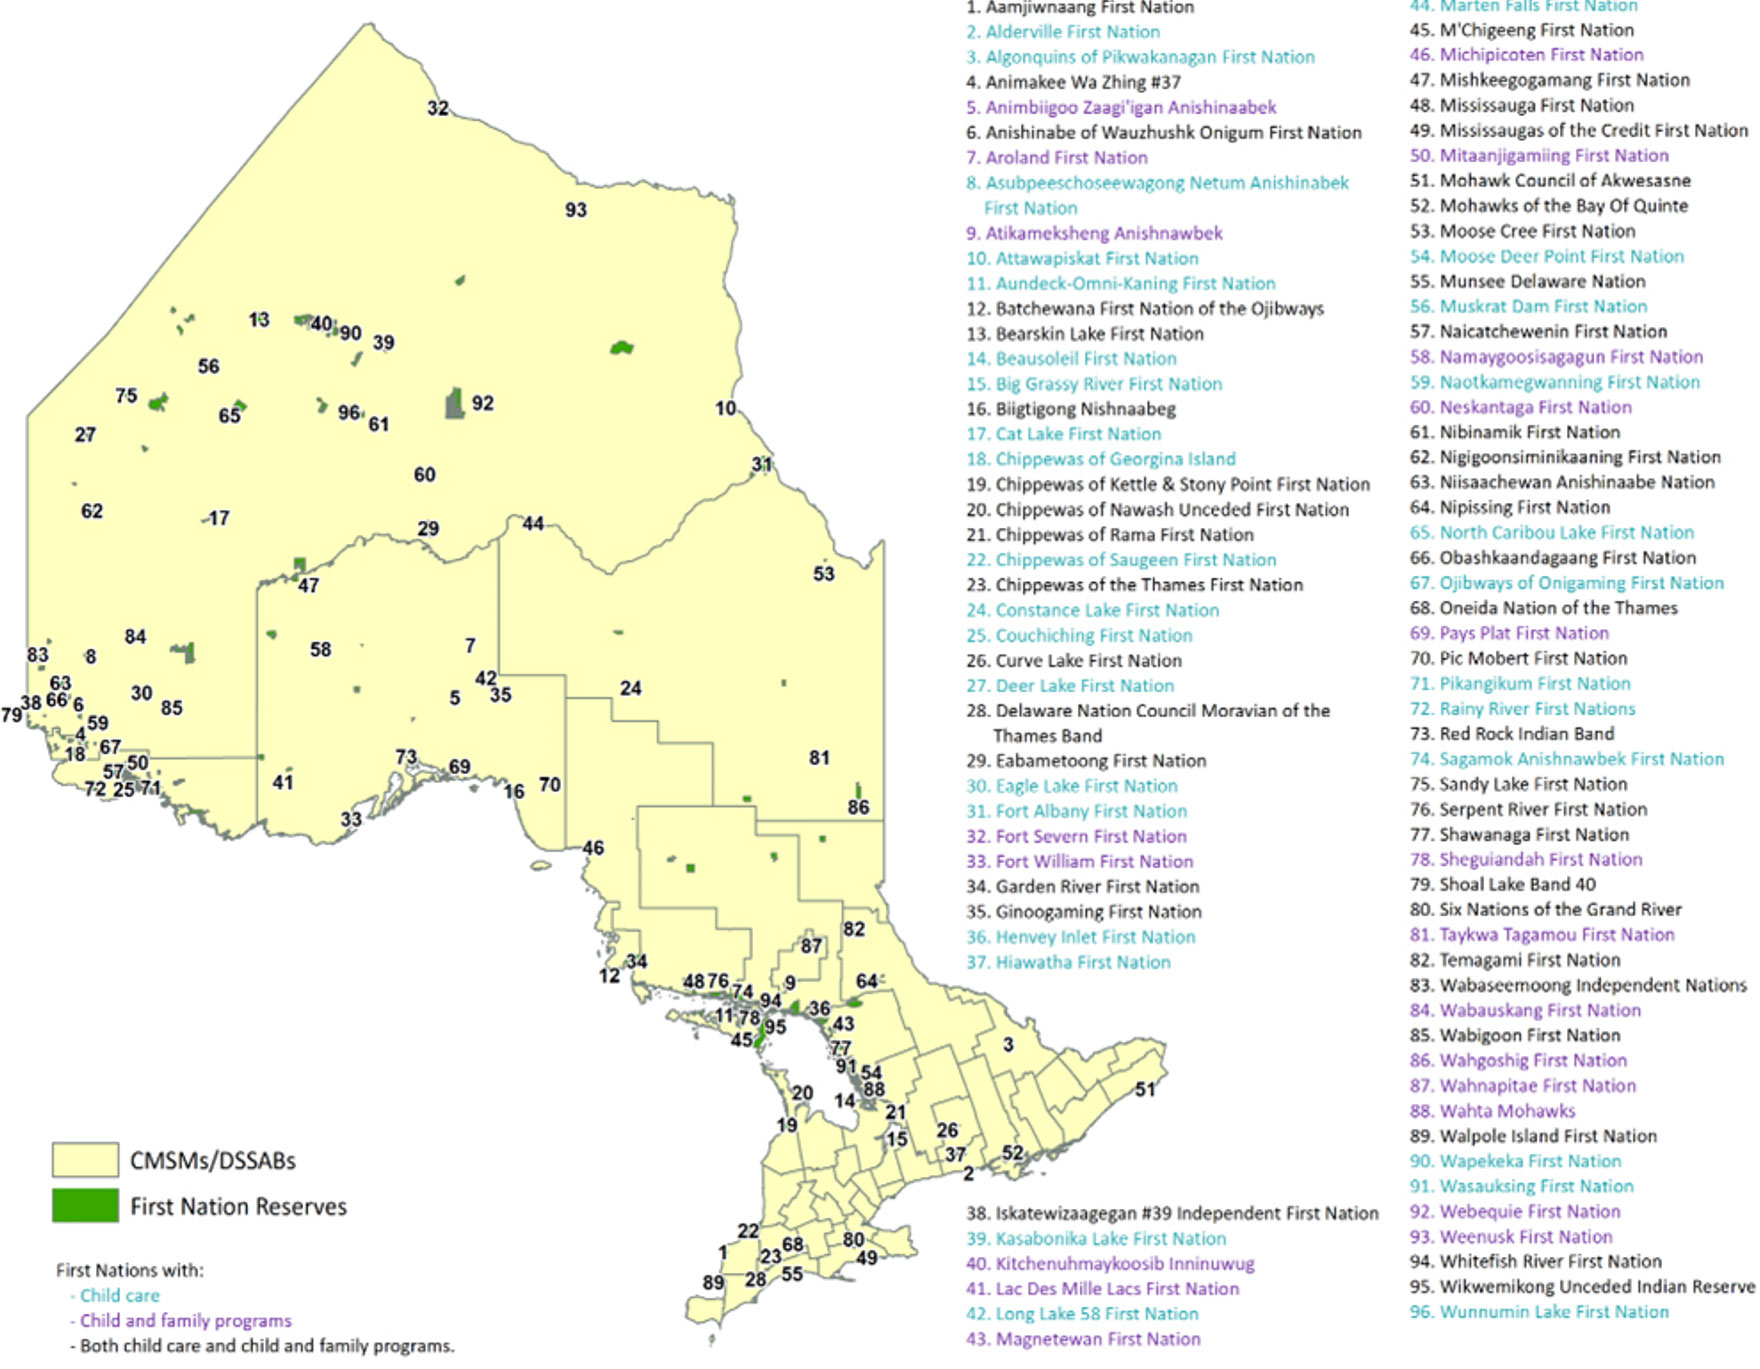
As of March 31, 2022, the province was funding 96 First Nations to support child care and/or child and family programs on reserve (see Figure 2), of which:
- 31 received funding for child care only
- 21 received funding for child and family programs only
- 44 received funding for child care and child and family programs
Figure 2: Ontario First Nations receiving provincial funding for child care and/or child and family programs
| Location name | Type | Key |
|---|---|---|
| Aamjiwnaang First Nation | First Nation Reserves | Received provincial funding for child care and child and family programs |
| Animakee Wa Zhing #37 | First Nation Reserves | Received provincial funding for child care and child and family programs |
| Anishinabe of Wauzhushk Onigum First Nation | First Nation Reserves | Received provincial funding for child care and child and family programs |
| Batchewana First Nation of the Ojibways | First Nation Reserves | Received provincial funding for child care and child and family programs |
| Bearskin Lake First Nation | First Nation Reserves | Received provincial funding for child care and child and family programs |
| Biigtigong Nishnaabeg | First Nation Reserves | Received provincial funding for child care and child and family programs |
| Chippewas of Kettle & Stony Point First Nation | First Nation Reserves | Received provincial funding for child care and child and family programs |
| Chippewas of Nawash Unceded First Nation | First Nation Reserves | Received provincial funding for child care and child and family programs |
| Chippewas of Rama First Nation | First Nation Reserves | Received provincial funding for child care and child and family programs |
| Chippewas of the Thames First Nation | First Nation Reserves | Received provincial funding for child care and child and family programs |
| Curve Lake First Nation | First Nation Reserves | Received provincial funding for child care and child and family programs |
| Delaware Nation Council Moravian of the Thames Band | First Nation Reserves | Received provincial funding for child care and child and family programs |
| Eabametoong First Nation | First Nation Reserves | Received provincial funding for child care and child and family programs |
| Garden River First Nation | First Nation Reserves | Received provincial funding for child care and child and family programs |
| Ginoogaming First Nation | First Nation Reserves | Received provincial funding for child care and child and family programs |
| Iskatewizaagegan #39 Independent First Nation | First Nation Reserves | Received provincial funding for child care and child and family programs |
| M’Chigeeng First Nation | First Nation Reserves | Received provincial funding for child care and child and family programs |
| Mishkeegogamang First Nation | First Nation Reserves | Received provincial funding for child care and child and family programs |
| Mississauga First Nation | First Nation Reserves | Received provincial funding for child care and child and family programs |
| Mississaugas of the Credit First Nation | First Nation Reserves | Received provincial funding for child care and child and family programs |
| Mohawk Council of Akwesasne | First Nation Reserves | Received provincial funding for child care and child and family programs |
| Mohawks of the Bay of Quinte | First Nation Reserves | Received provincial funding for child care and child and family programs |
| Moose Cree First Nation | First Nation Reserves | Received provincial funding for child care and child and family programs |
| Munsee Delaware Nation | First Nation Reserves | Received provincial funding for child care and child and family programs |
| Naicatchewenin First Nation | First Nation Reserves | Received provincial funding for child care and child and family programs |
| Nibinamik First Nation | First Nation Reserves | Received provincial funding for child care and child and family programs |
| Nigigoonsiminikaaning First Nation | First Nation Reserves | Received provincial funding for child care and child and family programs |
| Niisaachewan Anishinaabe Nation | First Nation Reserves | Received provincial funding for child care and child and family programs |
| Nipissing First Nation | First Nation Reserves | Received provincial funding for child care and child and family programs |
| Obashkaandagaang First Nation | First Nation Reserves | Received provincial funding for child care and child and family programs |
| Oneida Nation of the Thames | First Nation Reserves | Received provincial funding for child care and child and family programs |
| Pic Mobert First Nation | First Nation Reserves | Received provincial funding for child care and child and family programs |
| Red Rock Indian Band | First Nation Reserves | Received provincial funding for child care and child and family programs |
| Sandy Lake First Nation | First Nation Reserves | Received provincial funding for child care and child and family programs |
| Serpent River First Nation | First Nation Reserves | Received provincial funding for child care and child and family programs |
| Shawanaga First Nation | First Nation Reserves | Received provincial funding for child care and child and family programs |
| Shoal Lake Band 40 | First Nation Reserves | Received provincial funding for child care and child and family programs |
| Six Nations of the Grand River | First Nation Reserves | Received provincial funding for child care and child and family programs |
| Temagami First Nation | First Nation Reserves | Received provincial funding for child care and child and family programs |
| Wabaseemoong Independent Nations | First Nation Reserves | Received provincial funding for child care and child and family programs |
| Wabigoon First Nation | First Nation Reserves | Received provincial funding for child care and child and family programs |
| Walpole Island First Nation | First Nation Reserves | Received provincial funding for child care and child and family programs |
| Whitefish River First Nation | First Nation Reserves | Received provincial funding for child care and child and family programs |
| Wikwemikong Unceded Indian Reserve | First Nation Reserves | Received provincial funding for child care and child and family programs |
Data sources: Ontario Ministry of Education and Statistics Canada.
Part 2: Early years and child care key data and measures
Child care is foundational to supporting early childhood development and student success. It is also a key enabler of workforce participation, particularly for women, both as parents and providers. Over the years, Ontario has advanced many initiatives to strengthen its early years and child care system, including:
- Full-day kindergarten: Universal full-day kindergarten provides a full-day of free high-quality programming for all children aged 4 to 5 years in the publicly funded school system across the province.
- Fee subsidies for low-income families: Ontario's child care fee subsidy system supports low-income families to access child care.
- Operator subsidies: Ontario invests in operator subsidies to help offset costs that would otherwise result in higher child care fees. Support is provided for general operating costs, as well as wage enhancements for qualified staff.
- Ontario child care access and relief from expense (CARE) tax credit: introduced in 2019, this tax credit helps an estimated 300,000 families each year with up to 75% of their eligible child care expenses so they can work, run a business or study to acquire new skills.
- Child care spaces in schools: Ontario has committed up to $1 billion over 5 years (beginning in 2019) to create up to 30,000 new child care spaces in schools.
- Wage enhancement grant/home child care enhancement grants: Since 2015, Ontario has supported recruitment and retention of early childhood educators in child care through the Ontario Wage Enhancement Grant.
- Ontario's college of early childhood educators: Ontario values the important role of child care and early years professionals. The College is the self-regulatory body for the early childhood education profession in the province, the only regulatory college for early childhood educators in Canada.
- Modern legislative framework and quality standards: the Child Care and Early Years Act, 2014 (CCEYA) is the legislation that governs child care in Ontario. The legislation requires that programming in licensed spaces is aligned with the provincial pedagogy, How does learning happen, which sets out a vision, values, foundations, and approaches to guide practice for high quality experiences in licensed child care and early years settings.
- Licensing and enforcement: Ontario has a modern regulatory framework. The Ministry of Education issues child care licences under the CCEYA and is responsible for enforcement of that legislation.
- Annual data collection: Ontario has conducted an annual data collection of child care program operations from licensed child care centres and home child care agencies since 2012 and has been reporting on the Early Development Instrument (EDI) indicators since 2003.
- EarlyON Child and Family Centres: in addition to Ontario's robust child care system, Ontario also has offered EarlyON Child and Family Centres to provide key supports to caregivers and children
These initiatives continue to shape Ontario’s early years and child care system and benefiting children and families in the province. A stable and accessible child care system will be crucial in supporting Ontarians continued recovery from the pandemic and moving forward with the work on the Canada-wide early learning and child care system.
In 2022–23, the government will continue to support families and the early years and child care system by:
- investing more than $3.9 billion in funding to early years and child care funding, including supporting parents through the Ontario CARE Tax Credit
- continuing to support the early years and child care sector to ensure the health and safety of families and the viability of these critical programs
- supporting families in need of fee subsidies and providing funding to CMSMs and DSSABs for this purpose
- allocating funding to CMSMs and DSSABs to support continued provincial wage enhancements for eligible child care professionals
- continuing with the provinces commitment to create up to 30,000 child care spaces in schools
Licensed child care
In Ontario, licensed child care is provided in centres and homes, and is delivered by a mix of not-for-profit and for-profit organizations, municipalities, school boards and First Nations. As of March 31, 2022, there were 5,545 licensed child care centres in Ontario. The total number of spaces in licensed centres was 472,997, which included:
- 35,783 spaces in centres that provide services in French
- 7,479 spaces in centres that provide bilingual services
- 3,290 spaces in centres in First Nations communities
As of March 31, 2022, a total of 145 licensed home child care agencies were in operation in the province. These agencies were permitted to contract with a maximum of 8,731 approved homes.
Overall trends in licensed child care
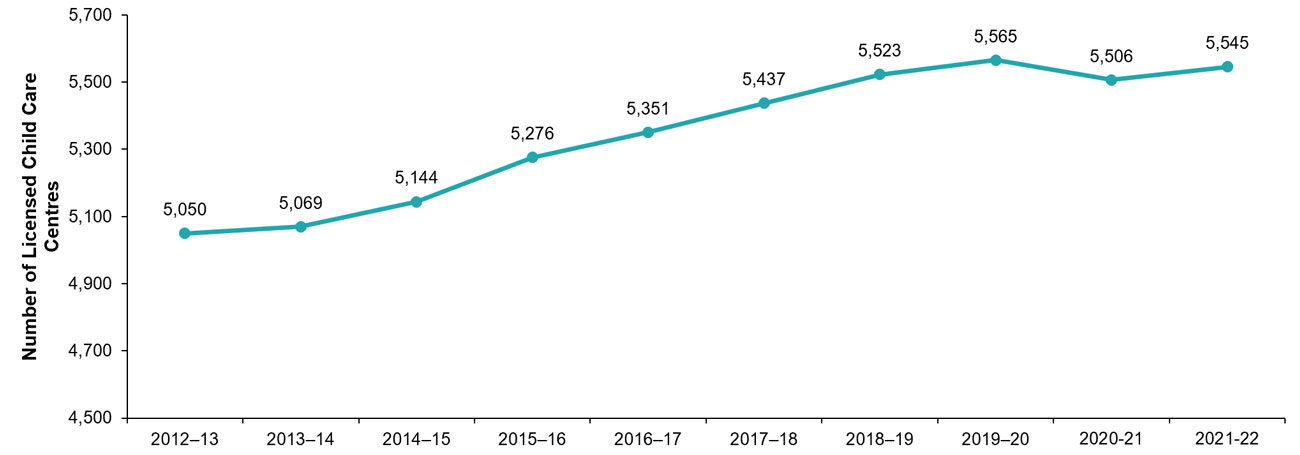
Overall, Ontario’s licensed child care sector continued to grow over the past year. Since 2012–13 (see Figure 3 and Table 1 ):
- The number of licensed child care centres increased by 9.8%, from 5,050 to 5,545. Licensed spaces have increased by 60.6%, from 294,490 to 472,997.
- The number of spaces has grown across all age groups, including kindergarten (165.3%), school age (62.5%), toddler (59.3%), infant (58.4%) and preschool (16.7%).
Figure 3: Number of licensed child care centres, 2012–13 to 2021–22
| Year | 2012–13 | 2013–14 | 2014–15 | 2015–16 | 2016–17 | 2017–18 | 2018–19 | 2019–20 | 2020–21 | 2021–22 |
|---|---|---|---|---|---|---|---|---|---|---|
| Number of Centres | 5,050 | 5,069 | 5,144 | 5,276 | 5,351 | 5,437 | 5,523 | 5,565 | 5,506 | 5,545 |
Data source: Child Care Licensing System, Ontario Ministry of Education (as of March 31 each year).
| Year | 2012–13 | 2013–14 | 2014–15 | 2015–16 | 2016–17 | 2017–18 | 2018–19 | 2019–20 | 2020–21 | 2021–22 |
|---|---|---|---|---|---|---|---|---|---|---|
| Number of Spaces | 294,490 | 317,868 | 350,801 | 389,286 | 406,395 | 427,032 | 446,596 | 462,802 | 464,538 | 472,997 |
| Infant | 9,634 | 10,250 | 11,025 | 11,759 | 12,231 | 12,755 | 13,626 | 14,151 | 14,602 | 15,260 |
| Toddler | 32,578 | 34,772 | 37,833 | 41,211 | 42,900 | 44,529 | 46,865 | 48,858 | 49,883 | 51,888 |
| Preschool | 102,731 | 102,133 | 102,380 | 104,802 | 105,955 | 108,375 | 112,042 | 115,001 | 115,431 | 119,846 |
| Kindergarten | 40,796 | 52,168 | 64,340 | 85,014 | 92,035 | 98,310 | 103,308 | 107,260 | 107,453 | 108,247 |
| School age | 108,795 | 118,545 | 135,223 | 146,500 | 153,274 | 162,901 | 170,337 | 176,840 | 176,327 | 176,832 |
| Family age | N/A | N/A | N/A | N/A | N/A | 162 | 418 | 692 | 842 | 924 |
Data source: Child Care Licensing System, Ontario Ministry of Education (as of March 31 each year).
Overall, the number of approved homes has increased by 46.5% since 2021–23, from 5,960 to 8,731 (see the line in Figure 4a), and the number of licensed home child care agencies has increased by 14.2%, from 127 to 145 (see the bars in Figure 4b).
Figure 4a: Number of approved homes, 2012–13 to 2021–22
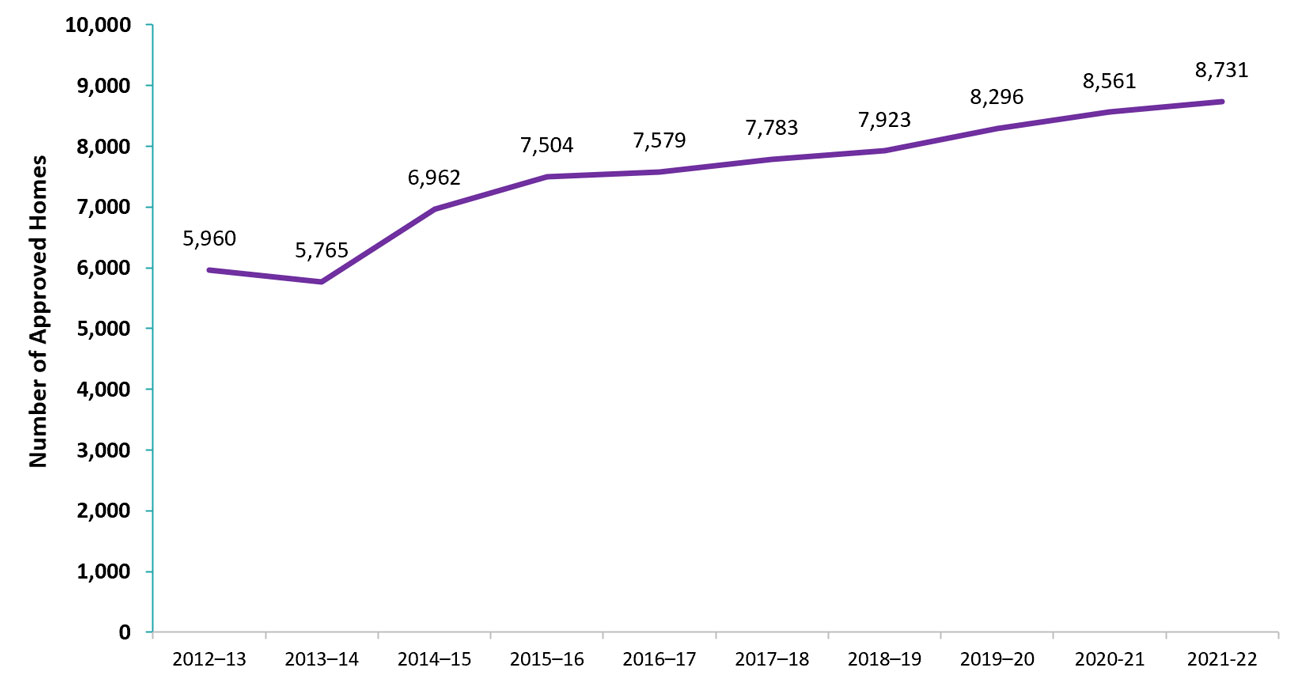
Figure 4b: Number of licensed home child care agencies, 2012–13 to 2021–22
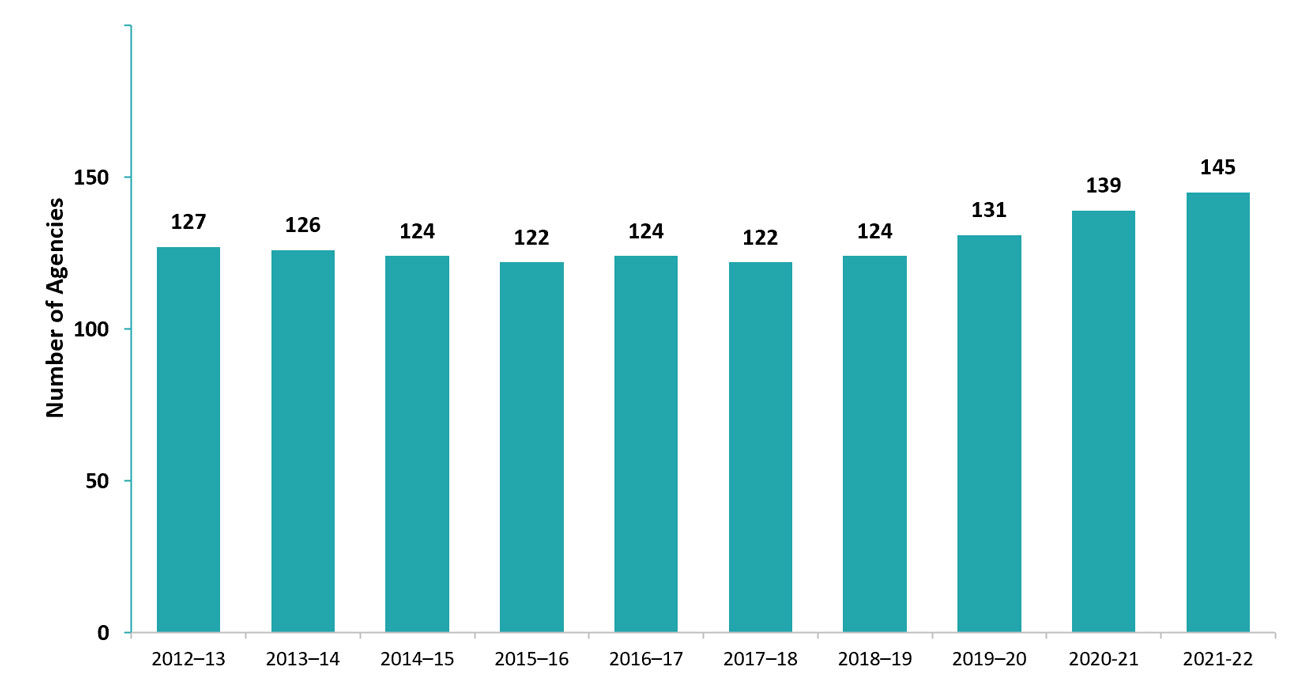
| Year | 2012–13 | 2013–14 | 2014–15 | 2015–16 | 2016–17 | 2017–18 | 2018–19 | 2019–20 | 2020–21 | 2021–22 |
|---|---|---|---|---|---|---|---|---|---|---|
| Number of approved homes | 5,960 | 5,765 | 6,962 | 7,504 | 7,579 | 7,783 | 7,923 | 8,296 | 8,561 | 8,731 |
| Number of agencies | 127 | 126 | 124 | 122 | 124 | 122 | 124 | 131 | 139 | 145 |
Data source: Child Care Licensing System, Ontario Ministry of Education (as of March 31 each year).
Child care by type of auspicefootnote 6
As of March 31, 2022:
- 74.5 of licensed child care centres were not-for-profit (operated by not-for-profit organizations and First Nations) and 25.5% were for-profit
- 78.3% of child care spaces were in not-for-profit centres and 21.7% were in for-profit centres
- 75.2% of licensed home child care agencies were not-for-profit and 24.8% were for-profit
- 84.8% of approved child care homes were affiliated with not-for-profit agencies and 15.2% were affiliated with for-profit agencies
For more detailed data and a look at changes over time, see Table 2 and Table 3.
| Year | 2012–13 | 2013–14 | 2014–15 | 2015–16 | 2016–17 | 2017–18 | 2018–19 | 2019–20 | 2020–21 | 2021–22 |
|---|---|---|---|---|---|---|---|---|---|---|
| Number of centres | 5,050 | 5,069 | 5,144 | 5,276 | 5,351 | 5,437 | 5,523 | 5,565 | 5,506 | 5,545 |
| Not-for-profit | 3,859 | 3,847 | 3,942 | 4,007 | 4,053 | 4,128 | 4,186 | 4,187 | 4,138 | 4,133 |
| For-profit | 1,191 | 1,222 | 1,202 | 1,269 | 1,298 | 1,309 | 1,337 | 1,378 | 1,368 | 1,412 |
| Number of spaces | 294,490 | 317,868 | 350,801 | 389,286 | 406,395 | 427,032 | 446,596 | 462,802 | 464,538 | 472,997 |
| Not-for-profit | 222,851 | 240,881 | 272,899 | 305,317 | 319,608 | 337,318 | 352,949 | 365,653 | 366,609 | 370,222 |
| For-profit | 71,639 | 76,987 | 77,902 | 83,969 | 86,787 | 89,714 | 93,647 | 97,149 | 97,929 | 102,775 |
Data source: Child Care Licensing System, Ontario Ministry of Education (as of March 31 each year).
| Year | 2012–13 | 2013–14 | 2014–15 | 2015–16 | 2016–17 | 2017–18 | 2018–19 | 2019–20 | 2020–21 | 2021–22 |
|---|---|---|---|---|---|---|---|---|---|---|
| Number of agencies | 127 | 126 | 124 | 122 | 124 | 122 | 124 | 131 | 139 | 145 |
| Not-for-profit | 116 | 113 | 111 | 108 | 109 | 105 | 104 | 105 | 106 | 109 |
| For-profit | 11 | 13 | 13 | 14 | 15 | 17 | 20 | 26 | 33 | 36 |
| Number of approved homes | 5,960 | 5,765 | 6,962 | 7,504 | 7,579 | 7,783 | 7,923 | 8,296 | 8,561 | 8,731 |
| Not-for-profit | 5,640 | 5,403 | 6,500 | 6,992 | 7,017 | 7,114 | 7,148 | 7,320 | 7,305 | 7,405 |
| For-profit | 320 | 362 | 462 | 512 | 562 | 669 | 775 | 976 | 1,256 | 1,326 |
Data source: Child Care Licensing System, Ontario Ministry of Education (as of March 31 each year).
Licensed child care centres — openings and closures
Licensed child care centres open and close on a regular basis (that is, not related to the COVID‑19 pandemic) with more centres opening than closing in most years. Child care centres open for reasons such as the expansion of an existing program, a desire to provide a child care service in a community or local planning efforts by CMSMs and DSSABs to address an increase in the need for child care. Centres that close typically do so due to low enrolment.
In 2021–22, 211 child care centres opened and 172 closed. On average, there has been an annual net increase of 62 centres per year for the past 10 years (see Figure 5). 495 more child care centres were in operation over the past ten years.
Figure 5: Number of licensed child care centre openings and closures, 2012–13 to 2021–22
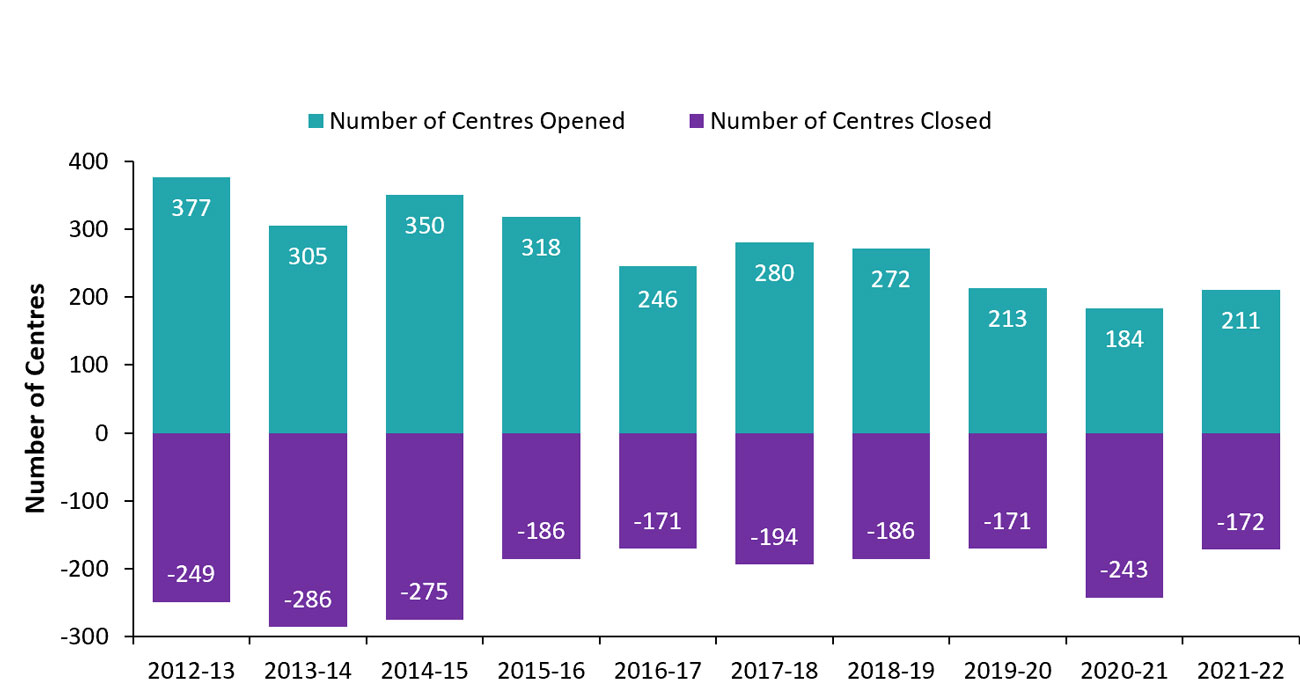
| Year | 2012–13 | 2013–14 | 2014–15 | 2015–16 | 2016–17 | 2017–18 | 2018–19 | 2019–20 | 2020–21 | 2021–22 |
|---|---|---|---|---|---|---|---|---|---|---|
| Number of centres opened | 377 | 305 | 350 | 318 | 246 | 280 | 272 | 213 | 184 | 211 |
| Number of centres closed | −249 | −286 | −275 | −186 | −171 | −194 | −186 | −171 | −243 | −172 |
Data source: Child Care Licensing System, Ontario Ministry of Education (as of March 31 each year).
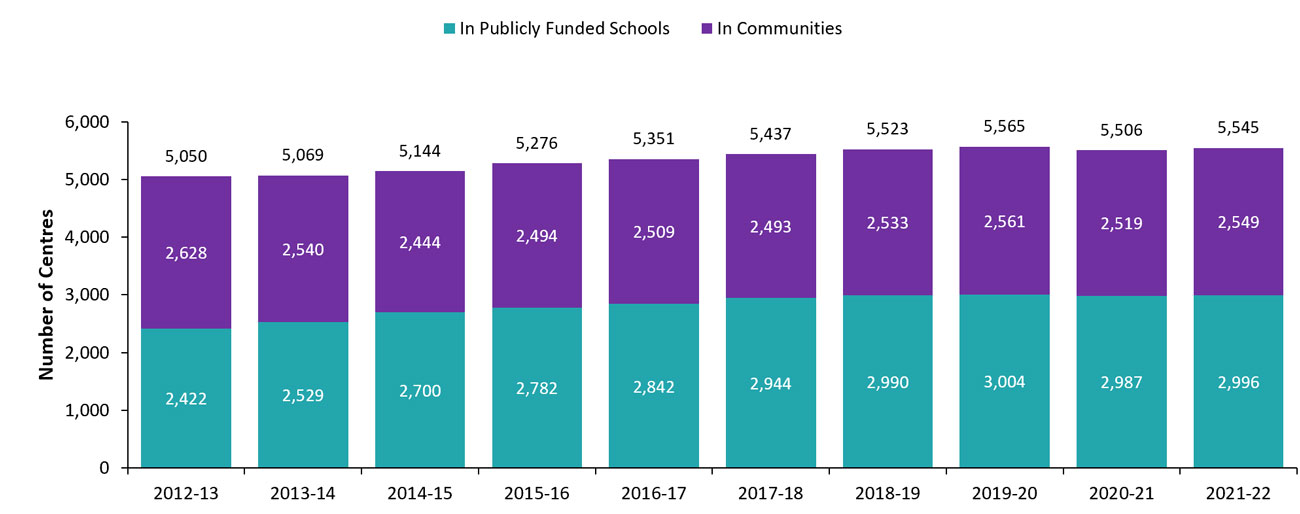
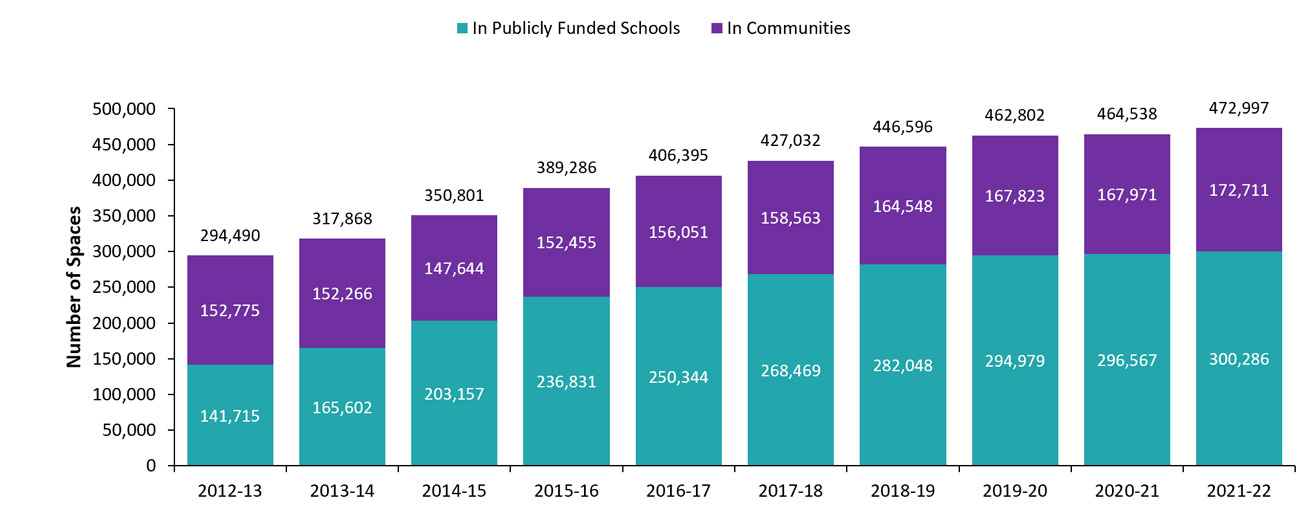
Licensed child care in publicly funded schools and in communities
As of March 31, 2022, 54.0% of child care centres and 63.5% of child care spaces were in publicly funded schools. The remaining 46.0% of child care centres and 36.5% of child care spaces were located elsewhere in the community. The number of licensed child care centres located in publicly funded schools increased by 0.3% in 2021–22 compared to the previous year and spaces increased by 1.3% in the same period. Since 2012–13, the number of child care centres located in publicly funded schools has increased by 23.7% (see Figure 6), and spaces have increased by 111.9% (see Figure 7).
Figure 6: Number of licensed child care centres in publicly funded schools and in communities, 2012–13 to 2021–22
| Year | 2012–13 | 2013–14 | 2014–15 | 2015–16 | 2016–17 | 2017–18 | 2018–19 | 2019–20 | 2020–21 | 2021–22 |
|---|---|---|---|---|---|---|---|---|---|---|
| In publicly funded schools | 2,422 | 2,529 | 2,700 | 2,782 | 2,842 | 2,944 | 2,990 | 3,004 | 2,987 | 2,996 |
| In communities | 2,628 | 2,540 | 2,444 | 2,494 | 2,509 | 2,493 | 2,533 | 2,561 | 2,519 | 2,549 |
| Total | 5,050 | 5,069 | 5,144 | 5,276 | 5,351 | 5,437 | 5,523 | 5,565 | 5,506 | 5,545 |
Data source: Child Care Licensing System, Ontario Ministry of Education (as of March 31 each year).
Figure 7: Number of licensed child care spaces in publicly funded schools and in communities, 2012–13 to 2021–22
| Year | 2012–13 | 2013–14 | 2014–15 | 2015–16 | 2016–17 | 2017–18 | 2018–19 | 2019–20 | 2020–21 | 2021–22 |
|---|---|---|---|---|---|---|---|---|---|---|
| In publicly funded schools | 141,715 | 165,602 | 203,157 | 236,831 | 250,344 | 268,469 | 282,048 | 294,979 | 296,567 | 300,286 |
| In communities | 152,775 | 152,266 | 147,644 | 152,455 | 156,051 | 158,563 | 164,548 | 167,823 | 167,971 | 172,711 |
| Total | 294,490 | 317,868 | 350,801 | 389,286 | 406,395 | 427,032 | 446,596 | 462,802 | 464,538 | 472,997 |
Data source: Child Care Licensing System, Ontario Ministry of Education (as of March 31 each year).
First Nations licensed child care on reserve
As of March 31, 2022, 73 licensed child care centres were operating on 58 First Nations in Ontario. The number of licensed child care spaces on reserve has increased by 2.5% since 2012–13 (see Table 4).
| Year | 2012–13 | 2013–14 | 2014–15 | 2015–16 | 2016–17 | 2017–18 | 2018–19 | 2019–20 | 2020–21 | 2021–22 |
|---|---|---|---|---|---|---|---|---|---|---|
| Number of centres | 76 | 74 | 75 | 76 | 76 | 76 | 75 | 75 | 74 | 73 |
| Infant | 232 | 254 | 270 | 296 | 290 | 290 | 290 | 309 | 309 | 303 |
| Toddler | 692 | 702 | 727 | 727 | 727 | 731 | 717 | 747 | 747 | 742 |
| Preschool | 1,624 | 1,620 | 1,568 | 1,541 | 1,553 | 1,551 | 1,529 | 1,584 | 1,568 | 1,550 |
| Kindergarten | 205 | 172 | 177 | 192 | 192 | 227 | 225 | 228 | 208 | 188 |
| School age | 458 | 443 | 398 | 413 | 413 | 416 | 413 | 459 | 459 | 492 |
| Family age | N/A | N/A | N/A | N/A | N/A | N/A | 15 | 15 | 15 | 15 |
| Total number of spaces | 3,211 | 3,191 | 3,140 | 3,169 | 3,175 | 3,215 | 3,189 | 3,342 | 3,306 | 3,290 |
Data source: Child Care Licensing System, Ontario Ministry of Education (as of March 31 each year).
French-language and bilingual licensed child care
Some licensed child care centres offer services in French or in both English and French (bilingual). In 2021–22, of the 5,545 licensed child care centres, 307 (5.5%) offered programs in French and 101 (1.8%) offered bilingual programs. Of the 472,997 licensed child care spaces, 35,783 (7.6%) were for programs in French and 7,479 (1.6%) were for bilingual programs. For further details about how these spaces are distributed by age, see Figure 8.
Figure 8: Number of licensed child care spaces in French-language and bilingual child care by age group, 2021–22
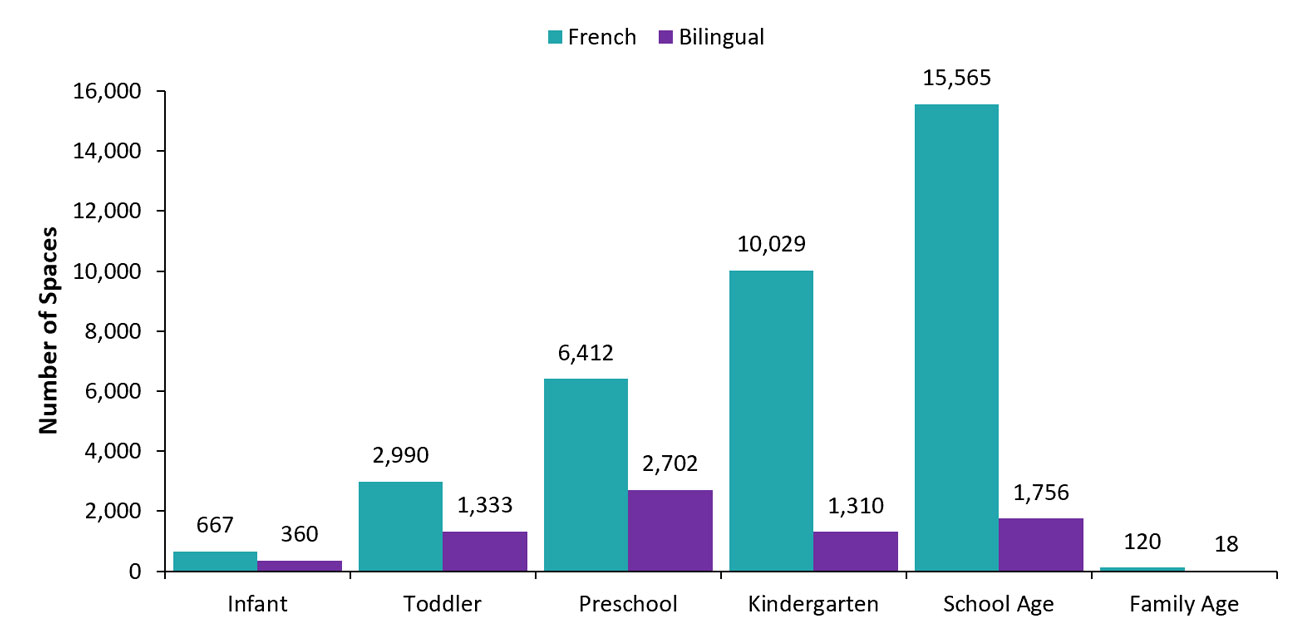
| Age | French | Bilingual |
|---|---|---|
| Infant | 667 | 360 |
| Toddler | 2,990 | 1,333 |
| Preschool | 6,412 | 2,702 |
| Kindergarten | 10,029 | 1,310 |
| School age | 15,565 | 1,756 |
| Family age | 120 | 18 |
Data source: Child Care Licensing System, Ontario Ministry of Education (as of March 31 each year).
Parent fees by age group
In 2022, the most recent year for which data is available, mean parent fees among licensed child care centres ranged from $75.01 per day for infants to $23.58 per day for school-aged children. Mean parent fees among licensed home child care agencies ranged from $48.69 per day for children under two years of age to $27.23 per day for children aged six to 12 years.
Licensed child care continues to be more expensive for younger children than it is for older children. In general, daily parent fees for younger children were higher among licensed child care centres than home child care agencies. Fees for older children were lower in licensed child care centres compared to home child care agencies (see Figures 9 and 10).
Figure 9: Mean daily fees by age group among licensed child care centres, 2022
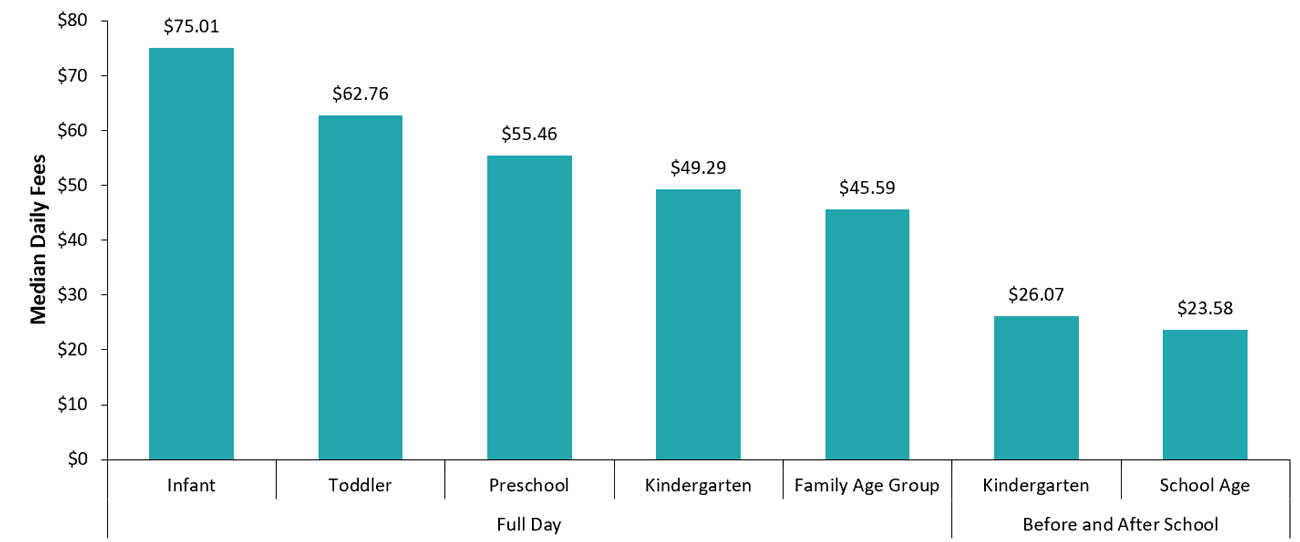
| Age | Mean daily fee $ |
|---|---|
| Infant | 75.01 |
| Toddler | 62.76 |
| Preschool | 55.46 |
| Kindergarten | 49.29 |
| Family age group | 45.59 |
| Age | Mean daily fee $ |
|---|---|
| Kindergarten | 26.07 |
| School age | 23.58 |
Data source: 2022 Licensed Child Care Operations Survey, Ontario Ministry of Education (as of March 31, 2022).
Figure 10: Mean daily fees by age group among licensed home child care agencies, 2022
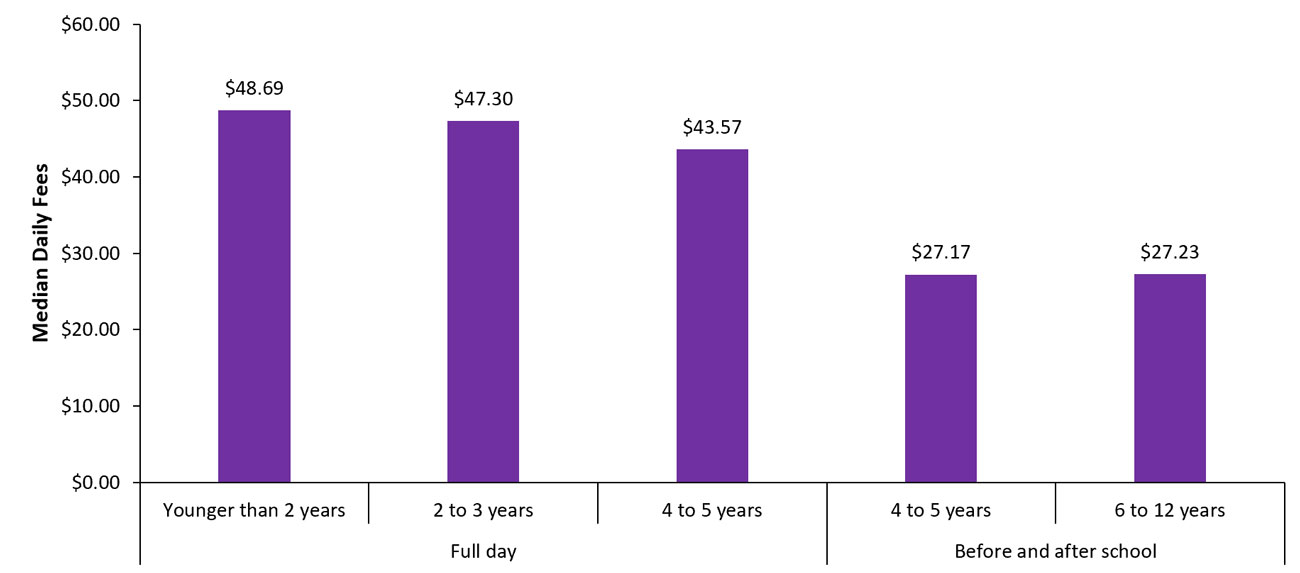
| Age | Mean daily fee $ |
|---|---|
| Younger than 2 years | 48.69 |
| 2 to 3 years | 47.30 |
| 4 to 5 years | 43.57 |
| Age | Mean daily fee $ |
|---|---|
| 4 to 5 years | 27.17 |
| 6 to 12 years | 27.23 |
Data source: 2022 Licensed Child Care Operations Survey, Ontario Ministry of Education (as of March 31, 2022).
Staff wages by category
Program staff fall into one of three categories: Registered Early Childhood Educators (RECEs), staff approved by a ministry director
Figure 11: Hourly wages of full-time program staff in licensed child care centres, 2022
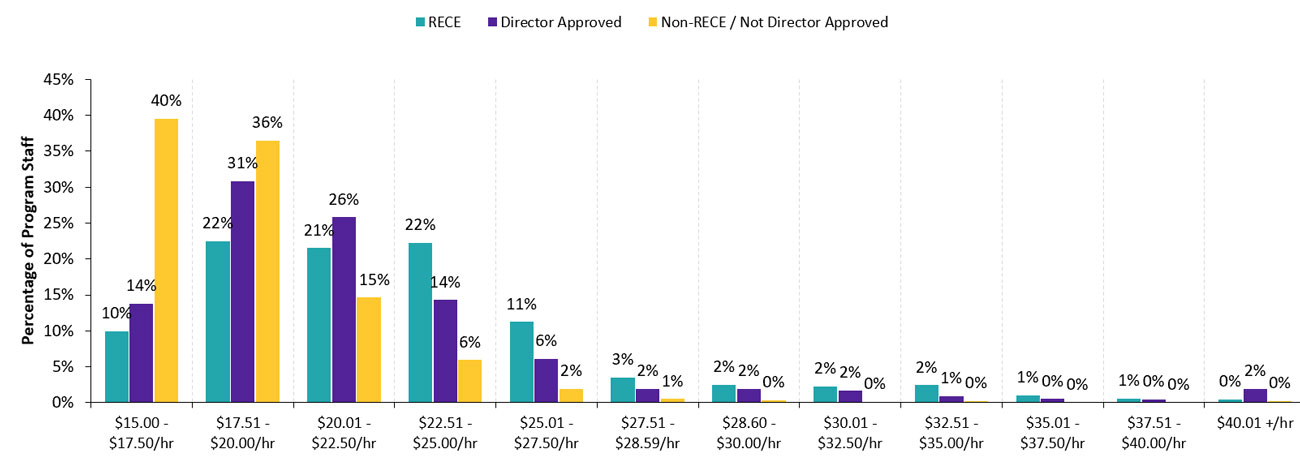
| Wage range | RECE % | Director approved % | Non-RECE/not director approved % |
|---|---|---|---|
| $15.00–$17.50/hr | 10 | 14 | 40 |
| $17.51–$20.00/hr | 22 | 31 | 36 |
| $20.01–$22.50/hr | 21 | 26 | 15 |
| $22.51–$25.00/hr | 22 | 14 | 6 |
| $25.01–$27.50/hr | 11 | 6 | 2 |
| $27.51–$28.59/hr | 3 | 2 | 1 |
| $28.60–$30.00/hr | 2 | 2 | 0 |
| $30.01–$32.50/hr | 2 | 2 | 0 |
| $32.51–$35.00/hr | 2 | 1 | 0 |
| $35.01–$37.50/hr | 1 | 0 | 0 |
| $37.51–$40.00/hr | 1 | 0 | 0 |
| $40.01+/hr | 0 | 2 | 0 |
Data source: 2022 Licensed Child Care Operations Survey, Ontario Ministry of Education (as of March 31, 2022).
EarlyON Child and Family Centres
EarlyON Child and Family Centres offer free drop-in programs for caregivers and children from birth to six years old. The centres are open to all families in Ontario and offer a range of services:
- activities such as reading, storytelling, games, and sing-alongs
- advice from professionals trained in early childhood development
- information about other family services in the community
- opportunities to connect with other families with young children
The ministry’s EarlyON Child and Family Centre web page allows parents and caregivers to find child and family programs in their communities.
The CMSMs and DSSABs assumed responsibility for EarlyON Child and Family Centres in January 2018. These service system managers are responsible for the local management of EarlyON centres as part of their responsibility for the management of child care and other human services.
As of March 2022, there were 611 main EarlyON Child and Family Centre locations and 358 mobile/satellite EarlyON Child and Family Centre locations. In addition, there were approximately 198 EarlyON Child and Family Centres offering virtual services supports to meet the needs of families across the province.
Of the total number of EarlyON Child and Family Centre locations, 381 offer non-standard hours, 151 offer French-language programming, and 183 offer Indigenous programming.
Indigenous-led programs and programs on reserve
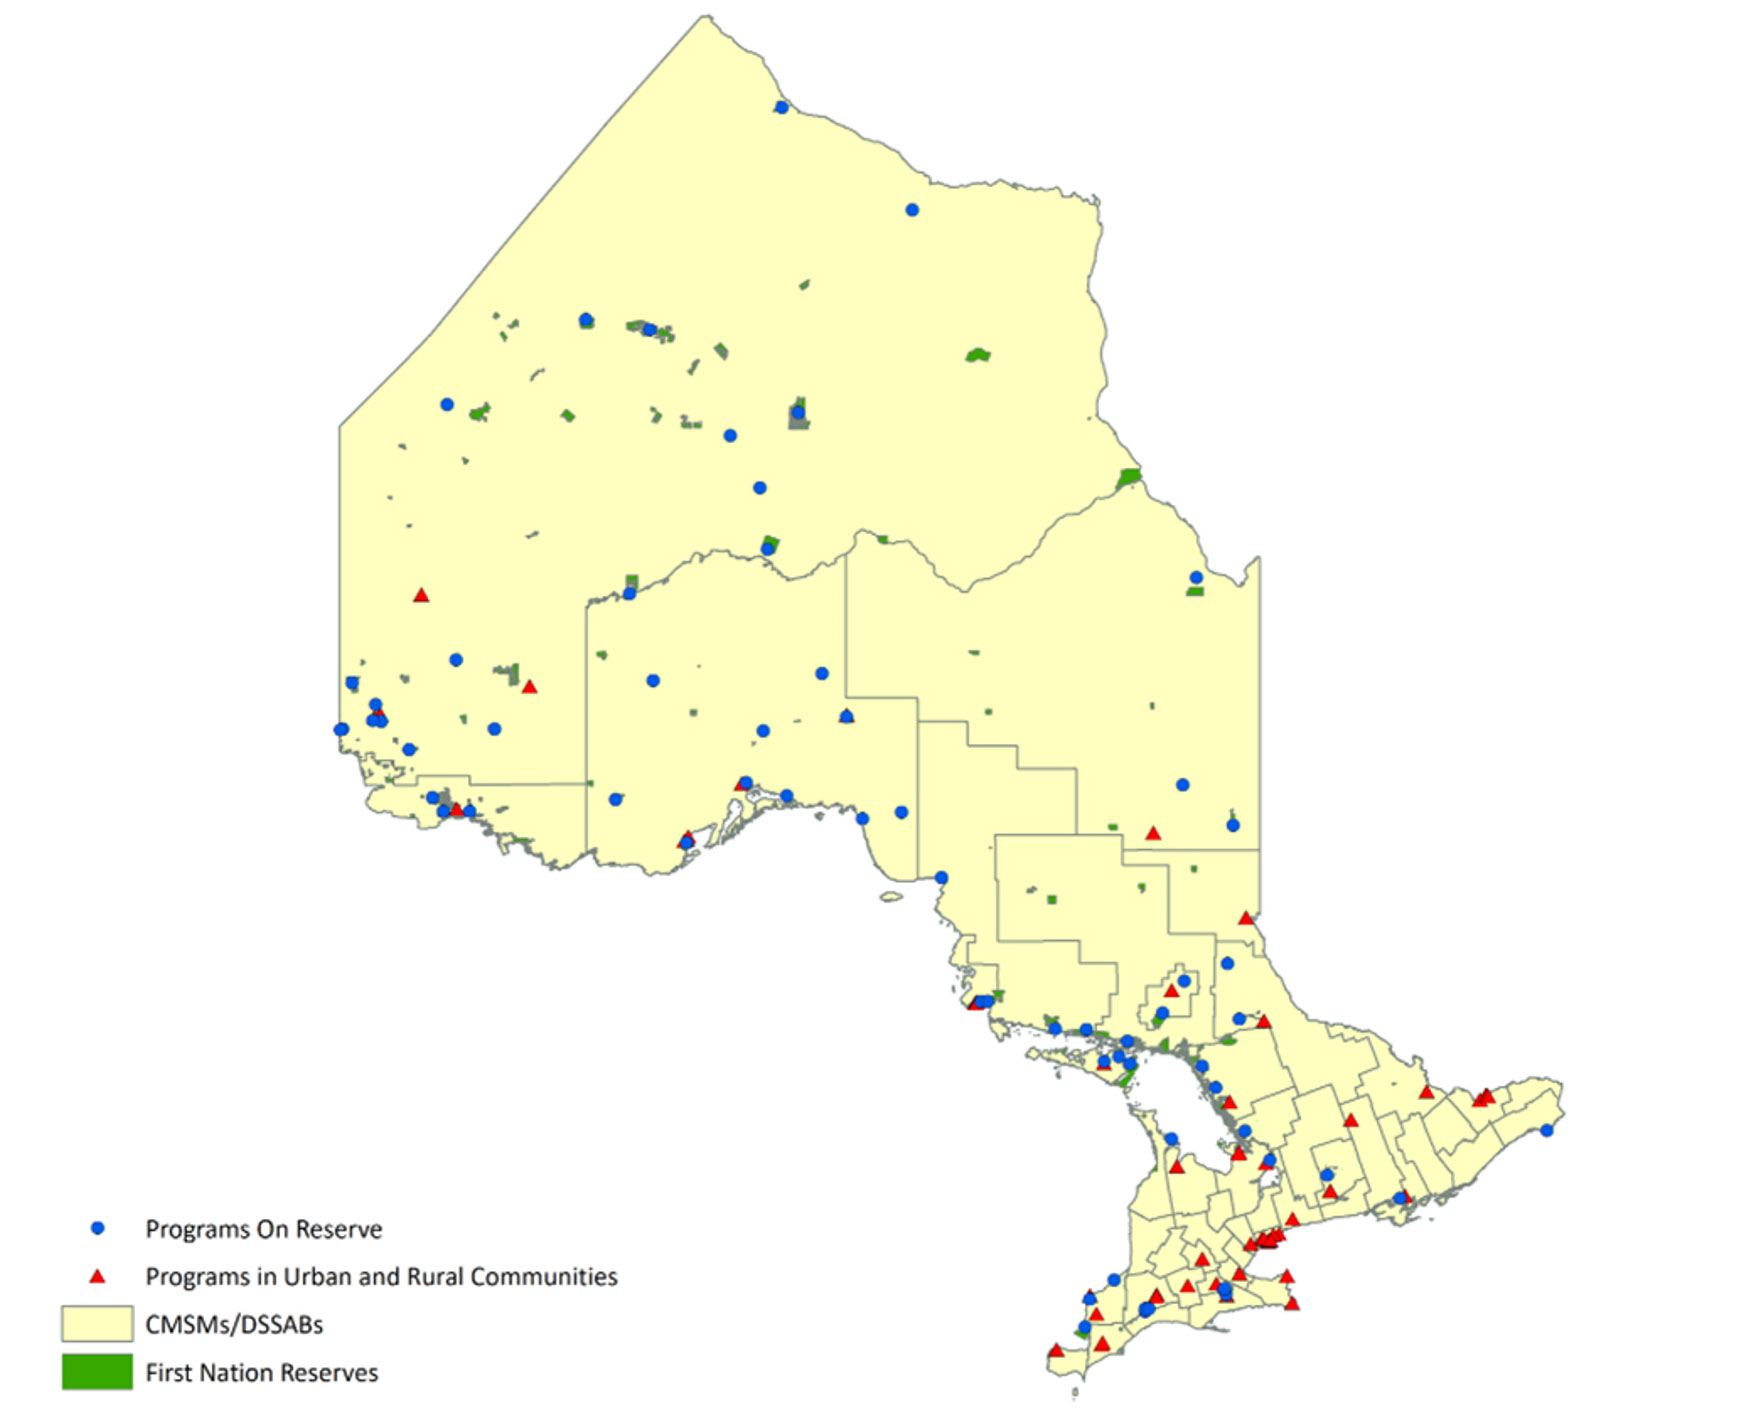
As part of Ontario’s commitment to reconciliation with Indigenous peoples, the ministry established or enhanced 65 programs in First Nation communities (five were enhanced and 60 new child and family programs established) and 61 programs in urban and rural communities (including 10 child care programs, 14 joint child care and child and family programs, and 37 child and family programs). See Figure 12.
Figure 12: Indigenous-led child care and child and family programs
| Key | Longitude | Latitude |
|---|---|---|
| Program on reserve | −88.51612547 | 52.74551493 |
| Program on reserve | −88.01144188 | 52.20458408 |
| Program on reserve | −94.54344008 | 49.89244761 |
| Program on reserve | −82.49335912 | 42.59193425 |
| Program on reserve | −92.94053167 | 48.7109575 |
| Program on reserve | −80.07211576 | 46.97319544 |
| Program on reserve | −85.42101384 | 55.00878088 |
| Program on reserve | −80.83297866 | 49.00291299 |
| Program on reserve | −81.77602623 | 46.06616388 |
| Program on reserve | −79.77738263 | 44.99468503 |
| Program on reserve | −94.44642813 | 49.70772064 |
| Program on reserve | −84.92716448 | 47.961158 |
| Program on reserve | −90.22974745 | 51.09183391 |
| Program on reserve | −90.46931484 | 48.83889662 |
| Program on reserve | −94.94315428 | 50.12991664 |
| Program on reserve | −87.88806256 | 51.55889818 |
| Program on reserve | −79.87386116 | 46.3234159 |
| Program on reserve | −88.24532269 | 49.02890794 |
| Program on reserve | −77.14140526 | 44.18573017 |
| Program on reserve | −79.9743632 | 48.55009597 |
| Program on reserve | −80.81123652 | 46.77296054 |
| Program on reserve | −80.0951481 | 43.00001813 |
| Program on reserve | −87.55723745 | 48.88316696 |
| Program on reserve | −82.4681282 | 46.20206599 |
| Program on reserve | −92.52151557 | 49.62547562 |
| Program on reserve | −87.63473886 | 55.99066182 |
| Program on reserve | −86.95750847 | 50.23219119 |
| Program on reserve | −84.26152431 | 46.52850474 |
| Program on reserve | −81.46830082 | 42.78799233 |
| Program on reserve | −81.47338783 | 42.81898334 |
| Program on reserve | −93.17646179 | 50.37951434 |
| Program on reserve | −80.13569874 | 43.05518218 |
| Program on reserve | −87.95905849 | 49.60261504 |
| Program on reserve | −81.91557368 | 45.8833198 |
| Program on reserve | −84.15020002 | 46.53684933 |
| Program on reserve | −90.97214707 | 53.92403858 |
| Program on reserve | −82.4160557 | 42.93599504 |
| Program on reserve | −95.09931025 | 49.62564713 |
| Program on reserve | −80.27345222 | 45.51398427 |
| Program on reserve | −80.50075679 | 45.76940789 |
| Program on reserve | −93.38618264 | 48.711037 |
| Program on reserve | −85.60874046 | 48.69799071 |
| Program on reserve | −80.60051648 | 51.26263272 |
| Program on reserve | −93.57322355 | 48.86138288 |
| Program on reserve | −74.64541366 | 44.99974921 |
| Program on reserve | −94.58714442 | 49.7145092 |
| Program on reserve | −81.40975981 | 42.81942534 |
| Program on reserve | −81.72808962 | 45.79754173 |
| Program on reserve | −93.97296119 | 49.39471385 |
| Program on reserve | −86.54424226 | 49.75792015 |
| Program on reserve | −89.884895 | 53.823251 |
| Program on reserve | −82.16181733 | 45.82547182 |
| Program on reserve | −78.37530686 | 44.46253162 |
| Program on reserve | −80.11751507 | 43.07040711 |
| Program on reserve | −89.26267604 | 48.35433571 |
| Program on reserve | −81.02682287 | 44.90303172 |
| Program on reserve | −81.99881499 | 43.17839181 |
| Program on reserve | −82.99862836 | 46.20834662 |
| Program on reserve | −81.17876023 | 46.39797902 |
| Program on reserve | −79.35127 | 44.64665803 |
| Program on reserve | −86.26900785 | 48.6260545 |
| Program on reserve | −87.36030342 | 52.98405156 |
| Program on reserve | −93.32765709 | 53.06308805 |
| Program on reserve | −95.13574475 | 49.61399338 |
| Program on reserve | −89.44999142 | 50.28335218 |
| Program in urban and rural community | −93.39832227 | 48.61132804 |
| Program in urban and rural community | −78.96350418 | 43.93533716 |
| Program in urban and rural community | −80.92765221 | 44.57641104 |
| Program in urban and rural community | −79.87588926 | 44.74389203 |
| Program in urban and rural community | −79.41803819 | 44.61291617 |
| Program in urban and rural community | −79.88581525 | 44.72769518 |
| Program in urban and rural community | −80.74319425 | 43.11309514 |
| Program in urban and rural community | −82.40857615 | 42.98944225 |
| Program in urban and rural community | −80.49261705 | 43.44752302 |
| Program in urban and rural community | −82.20892703 | 42.38030109 |
| Program in urban and rural community | −82.18586924 | 42.40422301 |
| Program in urban and rural community | −81.26794702 | 43.00579725 |
| Program in urban and rural community | −75.68618205 | 45.42647824 |
| Program in urban and rural community | −75.77923303 | 45.37325021 |
| Program in urban and rural community | −75.66025703 | 45.43128425 |
| Program in urban and rural community | −75.659067 | 45.43716906 |
| Program in urban and rural community | −76.68922405 | 45.47275509 |
| Program in urban and rural community | −77.05651516 | 44.21782712 |
| Program in urban and rural community | −77.97366606 | 45.140287 |
| Program in urban and rural community | −81.33019412 | 48.47083224 |
| Program in urban and rural community | −82.16362709 | 45.81168823 |
| Program in urban and rural community | −84.35698002 | 46.52043202 |
| Program in urban and rural community | −81.01630709 | 46.66711108 |
| Program in urban and rural community | −79.44893904 | 46.30716523 |
| Program in urban and rural community | −94.48604599 | 49.76570087 |
| Program in urban and rural community | −88.31390084 | 49.02536685 |
| Program in urban and rural community | −86.53493775 | 49.7815039 |
| Program in urban and rural community | −89.2483248 | 48.39443104 |
| Program in urban and rural community | −89.29021099 | 48.38094611 |
| Program in urban and rural community | −94.55887787 | 49.75591696 |
| Program in urban and rural community | −79.3794942 | 43.65327318 |
| Program in urban and rural community | −79.1909611 | 43.75114806 |
| Program in urban and rural community | −79.36982125 | 43.66915502 |
| Program in urban and rural community | −79.28806103 | 43.73860815 |
| Program in urban and rural community | −79.49089212 | 43.68657404 |
| Program in urban and rural community | −79.44843321 | 43.69158513 |
| Program in urban and rural community | −79.33589504 | 43.67922723 |
| Program in urban and rural community | −78.32633613 | 44.27835011 |
| Program in urban and rural community | −78.32217025 | 44.27766513 |
| Program in urban and rural community | −79.86725312 | 43.26275212 |
| Program in urban and rural community | −78.97030809 | 42.89850506 |
| Program in urban and rural community | −80.08328005 | 42.99404603 |
| Program in urban and rural community | −82.97510025 | 42.31501124 |
| Program in urban and rural community | −80.25770417 | 43.13897712 |
| Program in urban and rural community | −79.06098316 | 43.23815325 |
| Program in urban and rural community | −81.27571021 | 42.98130519 |
| Program in urban and rural community | −79.74909406 | 47.50823413 |
| Program in urban and rural community | −94.55887787 | 49.75591696 |
| Program in urban and rural community | −93.75916293 | 51.08648286 |
| Program in urban and rural community | −79.67466303 | 43.63050602 |
| Program in urban and rural community | −79.87518017 | 44.7496091 |
| Program in urban and rural community | −82.29617306 | 42.76310406 |
| Program in urban and rural community | −75.64043202 | 45.41055025 |
| Program in urban and rural community | −80.03478621 | 45.34900601 |
| Program in urban and rural community | −84.31952908 | 46.53269711 |
| Program in urban and rural community | −84.3292741 | 46.51159521 |
| Program in urban and rural community | −79.44893904 | 46.30716523 |
| Program in urban and rural community | −94.45251774 | 49.78325394 |
| Program in urban and rural community | −91.92008182 | 50.098065 |
| Program in urban and rural community | −89.22810985 | 48.43004015 |
| Program in urban and rural community | −80.942178 | 44.568058 |
Data sources: Ontario Ministry of Education; Statistics Canada.
Early years developmental health and well-being
Information on children’s developmental health and well-being prior to Grade 1 is collected throughout the province using the Early Development Instrument (EDI). The EDI is a questionnaire that teachers complete about the skills and abilities of each of their Year 2 (senior) kindergarten students. It measures developmental health and well-being across five domains:
- physical health and well-being
- social competence
- emotional maturity
- language and cognitive development
- communication skills and general knowledge
The EDI is used as a population measure (such as, a measure of whole populations based on geographical or administrative boundaries) by the ministry, municipalities, school boards, and community organizations to inform decision-making and plan early years programs and services. The ministry uses the EDI as a key indicator to monitor the state of young children in Ontario.
Since 2004, the EDI has been collected across the province in three-year cycles:
- over a three-year period for Cycle 1 (2004–06), Cycle 2 (2007–09) and Cycle 3 (2010–12)
- in a single year, every three years, for Cycle 4 (2015) and Cycle 5 (2018)
footnote 10
EDI results can be compared over time to get a sense of how young children’s developmental health and well-being is changing in Ontario. Examining the percentage of vulnerable children
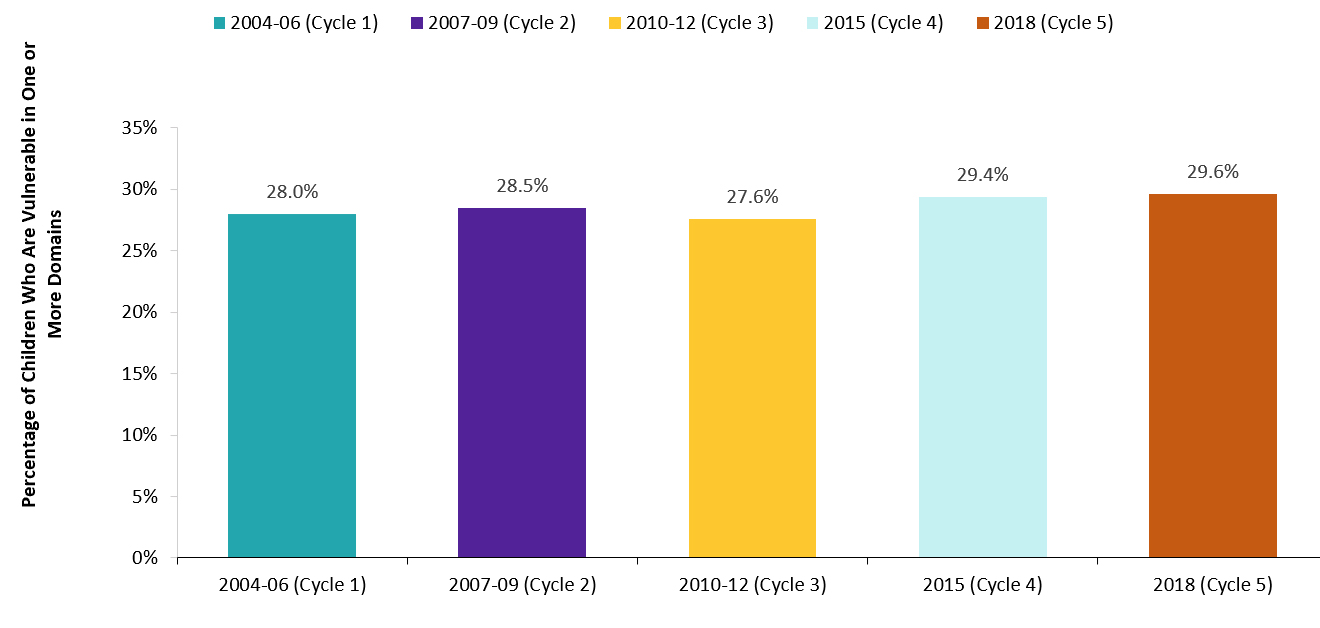
Overall, results remained relatively stable between Cycle 4 and Cycle 5. In 2018, 70.4% of children were considered developmentally ready when they entered Grade 1, compared to 70.6% in 2015.
Additional information about the EDI is available from the Offord Centre for Child Studies at McMaster University.
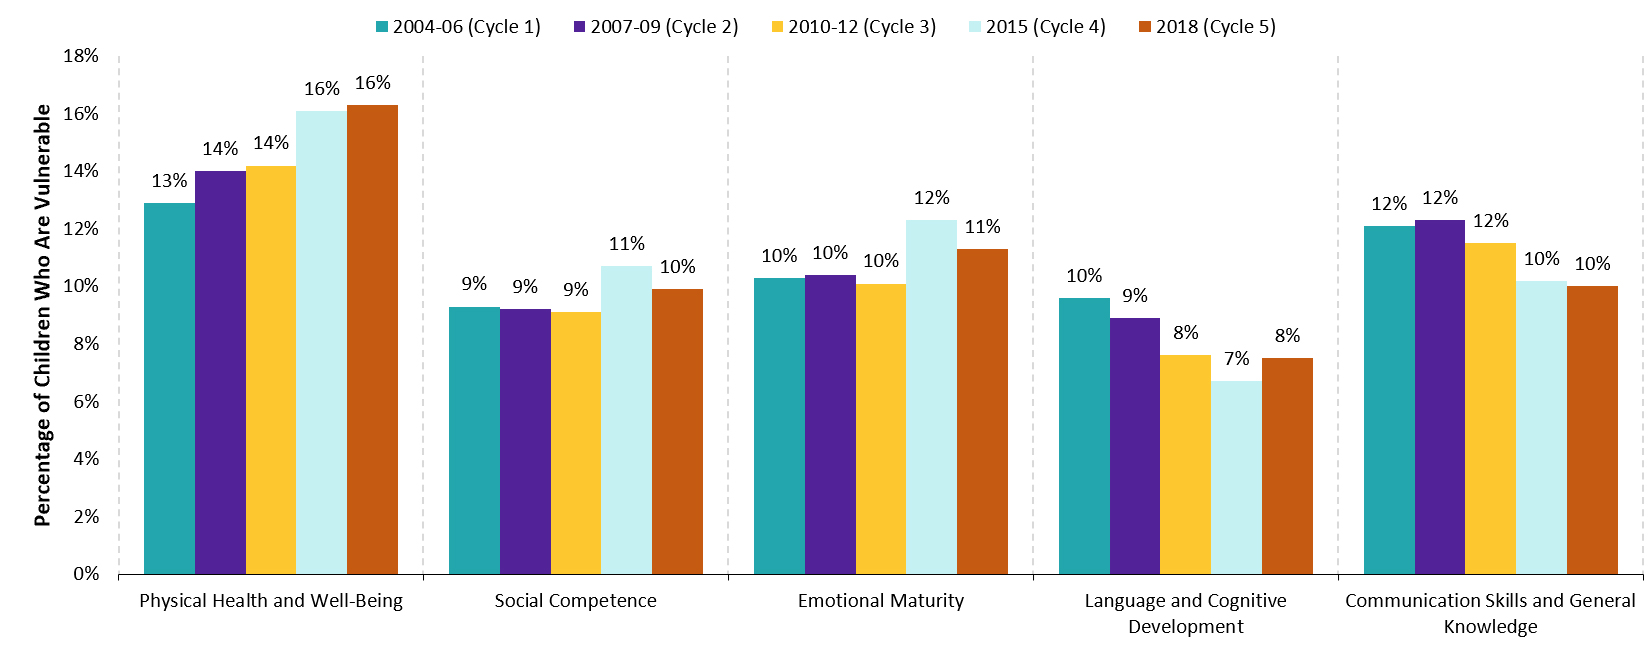
Figure 13: Percentage of vulnerable children by EDI domain, 2004–18
| Cycle | 2004–06 (Cycle 1) % | 2007–09 (Cycle 2) % | 2010–12 (Cycle 3) % | 2015 (Cycle 4) % | 2018 (Cycle 5) % |
|---|---|---|---|---|---|
| Physical health and well-being | 13 | 14 | 14 | 16 | 16 |
| Social competence | 9 | 9 | 9 | 11 | 10 |
| Emotional maturity | 10 | 10 | 10 | 12 | 11 |
| Language and cognitive development | 10 | 9 | 8 | 7 | 8 |
| Communication skills and general knowledge | 12 | 12 | 12 | 10 | 10 |
Data source: Offord Centre for Child Studies, McMaster University.
Figure 14: Percentage of children who are vulnerable in one or more EDI domains, 2004–18
| Cycle | Percentage of children vulnerable in one or more domains % |
|---|---|
| 2004–06 (Cycle 1) | 28.0 |
| 2007–09 (Cycle 2) | 28.5 |
| 2010–12 (Cycle 3) | 27.6 |
| 2015 (Cycle 4) | 29.4 |
| 2018 (Cycle 5) | 29.6 |
Data source: Offord Centre for Child Studies, McMaster University.
Part 3: Indicators under the Canada-Ontario Early Learning and Child Care Agreement
The federal government committed $400 million in their 2016 budget, and an additional $7 billion over 10 years in their 2017 budget, to establish a Multilateral Early Learning and Child Care Framework with provinces and territories. Under the framework, the federal government and these provinces and territories agreed to work together over time to achieve broad long-term goals for early learning and child care systems that are high quality, accessible, affordable, flexible, and inclusive. These provinces and territories also agreed to report annually on progress made in relation to the framework and on the impact of federal funding, while reflecting the priorities of each jurisdiction in early learning and child care.
On June 12, 2017, Ontario was the first province to sign an agreement under the framework, known as the three-year Canada-Ontario Early Learning and Child Care Agreement. Under the agreement, the federal government agreed to allocate $439 million to Ontario over three years (2017–18, 2018–19 and 2019–20).
- $100 million to support access for children and families to child care
- $40 million to support access to EarlyON Child and Family Centres
- $6 million to support innovative approaches that provide access to high quality training and professional learning opportunities for the early years and child care workforce
In July 2020, the federal and provincial governments agreed on a one-year extension of the Canada-Ontario Early Learning and Child Care Agreement, which allocated nearly $147 million in 2020–21 for early learning and child care investments. In August 2021, the federal and provincial governments agreed on a four-year renewal of the Canada-Ontario Early Learning and Child Care Agreement. Under the renewal, Ontario will receive nearly $147 million in federal funding in 2021–22 to continue early learning and child care investments in the province, and the annual funding will gradually increase to $211 million in 2024-25.
This section highlights Ontario’s progress in working towards increasing quality, accessibility, affordability, flexibility, and inclusion in early learning and child care under the Canada-Ontario Early Learning and Child Care Agreement. For more about the indicators that are being used to measure Ontario’s progress, see Appendix: List of Indicators under the Canada-Ontario Early Learning and Child Care Agreement.
Expenditures and actions
Under the agreement, Ontario received $146.7 million in federal funding in the 2021–22 fiscal year, of which $2.9 million was carried forward to the 2022–23 fiscal year. Ontario’s actual expenditures in the 2021–22 fiscal year were $143.8 million.
The 2021–22 funding supported the following three action areas:
- increasing access to affordable, high quality licensed child care
- increasing access to EarlyON Child and Family Centres
- innovative approaches to providing access to high quality training and professional learning opportunities for the early years and child care workforce
| Areas | Federal allocations | Actions | Actual expenditures |
|---|---|---|---|
| Licensed child care | Ontario allocated $100 million of the federal funding for increased subsidies and access to licensed child care in Ontario. There are two components to this investment, including $80 million for children aged 0–6, and $20 million to support access to affordable child care across the system based on local priorities. | The federal funding was provided to service system managers through provincial-municipal service agreements. In December 2021, service system managers received consolidated 2022 service agreement and funding guidelines for licensed child care and EarlyON Child and Family Centres, including funding under the Canada-Ontario Early Learning and Child Care Agreement. | $100.0 million |
| EarlyON Child and Family Centres | Ontario allocated $40.3 million of the federal funding to support EarlyON Child and Family Programs. | The federal funding was provided to service system managers to support 611 main EarlyON Child and Family Centre locations, 358 mobile/satellite EarlyON Child and Family Centre locations and 198 EarlyON across Ontario. | $40.3 million |
| Professional development | Ontario allocated $2 million of the federal funding to increase the number of students supported through the Early Childhood Educators Qualifications Upgrade Program. | The federal funding was provided through grants that were made available for 2021-22 to support individuals working in eligible early years and child care settings to obtain an early childhood education diploma and/or leadership certification. | $2.0 million |
| Professional development | Ontario allocated $1.5 million of the federal funding to support professional learning for the early years and child care workforce. | This funding supports culturally relevant professional learning strategies for Francophone and First Nation, Metis, Inuit and Indigenous staff working in the child care and early years sector. | $1.5 million |
Data source: Ontario Ministry of Education
Licensed child care indicators
The indicators reported in this section are reflective of the areas of investment under the agreement for increasing quality, accessibility, affordability, flexibility, and inclusion in licensed child care (see Appendix: List of Indicators under the Canada-Ontario Early Learning and Child Care Agreement).
Quality
Staff qualifications
Ontario Regulation 137/15 under the Child Care and Early Years Act, 2014 sets out the minimum requirements for staff qualifications in licensed child care centres and home child care agencies, including requirements for the ratio of employees to children, the maximum number of children in a group, and the proportions of employees that must be qualified employees in licensed child care centres, which varies for different age groups (see Table 6). The minimum requirements are as follows:
A supervisor shall be a person who:
- is a member in good standing of the College of Early Childhood Educators, has at least two years of experience providing licensed child care and is approved by a ministry director
- in the opinion of a director, is capable of planning and directing the program of a child care centre, being in charge of children and overseeing staff
A qualified employee for any licensed age group shall be a person who is:
- an employee who is a member in good standing of the College of Early Childhood Educators
- an employee who is otherwise approved by a director
With respect to a licensed junior school age group or a licensed primary/junior school age group that includes only children who are junior school age, the following are also qualified employees:
- an employee who has a diploma or degree in child and youth care
- an employee who has a diploma or degree in recreation and leisure services
- an employee who is a member in good standing with the Ontario College of Teachers
A home child care visitor is an employee of a home child care agency who monitors and provides support at licensed home child care locations. A home child care visitor shall be a person who:
- is a member in good standing of the College of Early Childhood Educators, has at least two years of experience working with children under 13 years old, and is approved by a director
- is, in the opinion of a director, capable of providing support and supervision at a home child care premises
| Age categories | Age range | Ratio of employees to children | Maximum number of children in group | Proportion of employees that must be qualified employees |
|---|---|---|---|---|
| Infant | Younger than 18 months | 3 to 10 | 10 | 1/3 |
| Toddler | 18 months or older but younger than 30 months | 1 to 5 | 15 | 1/3 |
| Preschool | 30 months or older but younger than 6 years | 1 to 8 | 24 | 2/3 |
| Kindergarten | 44 months or older but younger than 7 years | 1 to 13 | 26 | 1/2 |
| Primary/junior school age | 68 months or older but younger than 13 years | 1 to 15 | 30 | 1/2 |
| Junior school age | 9 years or older but younger than 13 years | 1 to 20 | 20 | 1/1 |
Data source: Ontario Ministry of Education
For further information about child care rules in Ontario see Child Care Rules in Ontario.
The ministry monitors and enforces staff qualification requirements in all licensed child care centres and home child care agencies. Centres and agencies meet the requirements by employing supervisors, staff and home child care visitors who are RECEs, or through director approvals as described above. It is estimated that:
- 83% of licensed child care centres employed at least one RECE for supervisor positions
- 97% of licensed home child care agencies employed at least one RECE for all home child care visitor positions
In 2022, the most recent year for which there is data available, there were 32,445 full-time program staff employed by licensed child care centres of which 19,112 (58.9%) were RECEs.
Pedagogical framework
How does learning happen: Ontario’s pedagogy for the early years, 2014 is a professional learning resource for those working in child care and child and family programs. It supports pedagogy and program development in early years settings that is shaped by views about children, educators, and families, and the relationships among them. Additional regulations under the Child Care and Early Years Act, 2014 are also in place to help child care licensees embed How does learning happen into practice.
As of March 31, 2022, all licensed child care centres and home child care agencies had achieved compliance with the requirements regarding the development and implementation of a program statement that is consistent with How does learning happen either before their licence was first issued or before it was renewed. The ministry continues to support the implementation of the How does learning happen? pedagogy in licensed child care programs in the province.
In 2020, the ministry released Building on how does learning happen: pedagogical approaches to re-opening early years and child care programs in Ontario to support providers and staff in engaging with children and families while adhering to health and safety measures.
Access
As of March 31, 2022, there were 472,997 licensed child care spaces in centres across the province, with 8,459 spaces added to the system over the previous year (see Table 7). It is estimated that there are enough spaces in licensed child care centres for 24% of children in the province.
| Year | 2012–13 | 2013–14 | 2014–15 | 2015–16 | 2016–17 | 2017–18 | 2018–19 | 2019–20 | 2020–21 | 2021–22 |
|---|---|---|---|---|---|---|---|---|---|---|
| Child population aged 0–12 | 1,901,206 | 1,908,491 | 1,915,795 | 1,934,191 | 1,939,255 | 1,950,021 | 1,959,118 | 1,964,136 | 1,947,747 | 1,958,080 |
| Spaces in Licensed Child Care Centres | 294,490 | 317,868 | 350,801 | 389,286 | 406,395 | 427,032 | 446,596 | 462,802 | 464,538 | 472,997 |
| Percentage of children aged 0–12 for whom there are licensed child care spaces % | 15.5 | 16.7 | 18.3 | 20.1 | 21.0 | 21.9 | 22.8 | 23.6 | 23.9 | 24.2 |
Data source: Child population data from Summer 2022 population projections, Ontario Ministry of Finance, and space data from the Child Care Licensing System (CCLS), Ontario Ministry of Education (as of March 31 each year).
Affordability
The funding under the Canada-Ontario Early Learning and Child Care Agreement supports new full and/or partial fee subsidies and increased access through the following priorities:
- Supporting children aged 0–6 years through additional fee subsidies, increased access, broadly reducing licensed child care fees and by increasing affordability and/or not-for-profit community-based capital projects (excluding capital projects for child care programs that run during school hours for kindergarten and school age children).
- Supporting children aged 0–12 years through additional fee subsides, increased access and/or broadly reducing licensed child care fees and by increasing affordability.
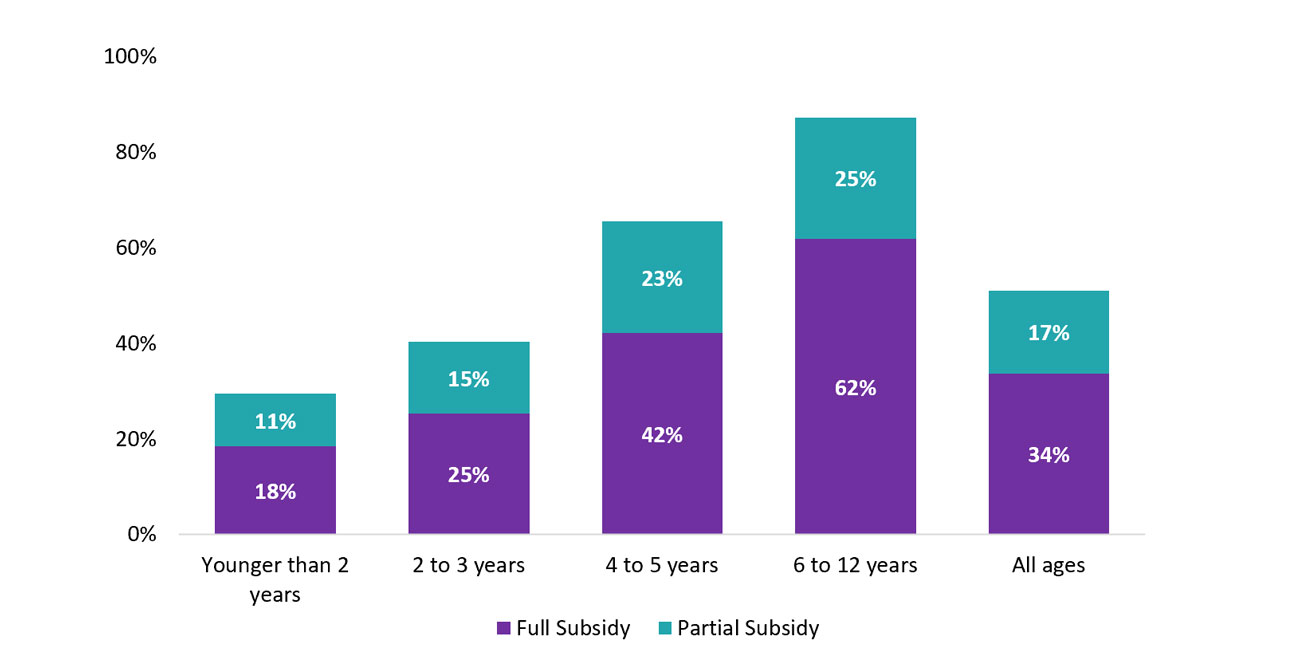
In 2022, the most recent year for which there is data available, approximately 26.7% of children in licensed child care centres received a subsidy (see Figure 15), as did 51.0% of children in licensed home child care (see Figure 16).
Figure 15: Percentage of children in licensed child care centres receiving a full or partial subsidy by age, 2022
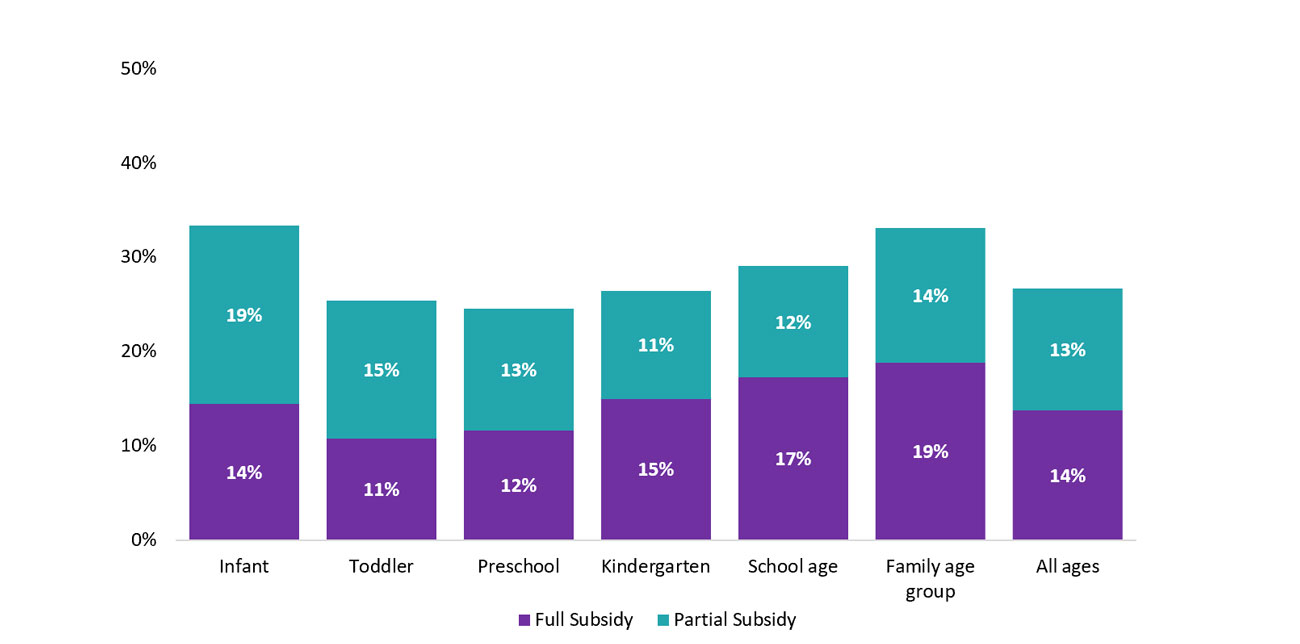
| Subsidy type | Full subsidy % | Partial subsidy % |
|---|---|---|
| Infant | 14.4 | 19.0 |
| Toddler | 10.8 | 14.7 |
| Preschool | 11.6 | 12.9 |
| Kindergarten | 15.0 | 11.5 |
| School age | 17.2 | 11.8 |
| Family age group | 18.8 | 14.2 |
| All ages | 13.8 | 12.9 |
Data source: 2022 Licensed Child Care Operations Survey, Ontario Ministry of Education (as of March 31, 2022).
Figure 16: Percentage of children in licensed home child care receiving a full or partial subsidy by age, 2022
| Subsidy type | Full subsidy % | Partial subsidy % |
|---|---|---|
| Younger than 2 years | 18.4 | 11.0 |
| 2 to 3 years | 25.3 | 15.0 |
| 4 to 5 years | 42.0 | 23.5 |
| 6 to 12 years | 61.9 | 25.4 |
| All ages | 33.7 | 17.4 |
Data source: 2022 Licensed Child Care Operations Survey, Ontario Ministry of Education (as of March 31, 2022).
In 2020, the most recent year for which there is data available, 117,388 children in Ontario received fee subsidies.
It is estimated that 71% of children who receive fee subsidies live in families with incomes of $40,000 and below (see Table 8).
| Family income | Percentage % |
|---|---|
| $20,000 and below | 36 |
| $20,001 – $40,000 | 35 |
| $40,001 – $60,000 | 19 |
| $60,001 – $80,000 | 7 |
| $80,001 – $100,000 | 2 |
| $100,000 and above | 1 |
| Total | 100 |
Data source: Education Finance Information System (estimated percentages), Ontario Ministry of Education.
Flexibility and inclusion
Non-standard hours
Flexibility in child care service delivery is important for meeting the needs of parents and caregivers who work non-standard schedules. In Ontario, a small proportion of licensed child care centres and home child care providers offer care during non-standard hours:
- 9.9% of child care centres reported the availability of weekend care and less than 1% reported the availability of care during the evening or overnight
- 8.8% of home child care providers reported the availability of weekend care, 8.0% reported the availability of evening care and 5.1% reported the availability of overnight care
Special needs resourcing
The province provides Special Needs Resourcing funding to service system managers and First Nations to support the inclusion of children with special needs in licensed child care settings, including home child care, camps, and authorized recreation programs, at no additional cost to parents/guardians. Under Ontario Regulation 138/15, a “child with special needs” means a child whose cognitive, physical, social, emotional, or communicative needs, or whose needs relating to overall development, are of such a nature that additional supports are required for the child. A total of 27,504 children were funded through Special Needs Resourcing between January 1 and December 31, 2020, the most recent year for which there is data available.
Indigenous-led child care centres
A total of 20 licensed child care centres reported that they were Indigenous-led organizations operating in urban and rural communities.
French-language and bilingual child care
As of March 31, 2022, a total of 307 centres offered French-language programs and 101 centres offered bilingual programs.
Children in licensed child care by income
The ministry does not collect income data from families that enroll their children in licensed child care. This indicator is estimated using the number of licensed child care spaces in the province and data on the distribution of families across income levels from Statistics Canada.
As of March 31, 2022, there were 472,997 licensed child care spaces for children aged 0–12 years in Ontario. Approximately 21.6% of families with children in the province earned a family income below $40,000, 39.7% earned between $40,000 and $100,000, and 38.7% earned above $100,000.
It is estimated, based on the income distribution, that:
- more than 102,000 spaces are used by children from families with income below $40,000
- about 188,000 spaces are used by children from families with income between $40,000 and $100,000
- about 183,000 are used by children from families with income above $100,000
EarlyON Child and Family Centres indicators
The indicators reported in this section are reflective of the areas of investment under the Canada-Ontario Early Learning and Child Care Agreement for increasing quality, accessibility, affordability, flexibility and inclusion in child and family centres (see Appendix: List of Indicators under the Canada-Ontario Early Learning and Child Care Agreement).
Quality
Staff qualifications
Experiences in EarlyON Child and Family Centres are designed to foster positive outcomes and support nurturing relationships for children and their parents and caregivers based on the latest evidence and research. Registered Early Childhood Educators (RECEs) play a key role in delivering high quality early years programs because they have specialized knowledge and expertise in child development and in play- and inquiry-based learning.
Every EarlyON Child and Family Centre should employ at least one RECE, who oversees all mandatory core services related to supporting early learning and development. If an EarlyON Child and Family Centre is unable to recruit at least one RECE to deliver these core services, the service system manager may grant an exemption from the requirement but must report the number of exemptions to the ministry.
EarlyON Child and Family Centres must ensure that they have at least one RECE on staff by January 1, 2023. However, EarlyON staff who are not RECEs but have more than 10 years of experience in relevant programs can be employed to meet this staffing requirement through a new grandparenting provision.
Pedagogical framework
EarlyON Child and Family Centres are expected to provide programs that reflect the view of children, parents and caregivers, and educators as competent, capable, curious, and rich in potential and experience. Guided by How does learning happen: Ontario’s pedagogy for the early years, EarlyON Child and Family Centres offer an environment that engages parents and caregivers as co-learners and leaders in influencing positive child, family, and community experiences and outcomes.
Access, affordability, flexibility, and inclusion
As of March 2022, there were 611 main EarlyON Child and Family Centre locations and 358 mobile/satellite EarlyON Child and Family Centre locations. In addition, there were approximately 198 EarlyON Child and Family Centres offering virtual services supports to meet the needs of families across the province.
Of the total number of locations, 381 locations offered non-standard hours, 151 offered French-language programming and 183 offered Indigenous programming.
As of Summer 2020, 81 new EarlyON Child and Family centres in 45 locations were either complete or in the process of being established. These capital projects were initially approved in 2017–18 through the Community-Based Early Years and Child Care Capital Program, with the EarlyON Child and Family Centre portion of the capital projects funded under the Canada-Ontario Early Learning and Child Care Agreement.
The ministry is also monitoring EarlyON expansion supported through operating funding under the agreement. In 2018–19, the ministry allocated approximately $8.6 million to service system managers for community-based EarlyON Child and Family Centre funding needs, including:
- capital costs associated with previously approved projects
- first-time equipping
- minor capital renovations
- supplies to support the delivery and daily operation of programs
- maintenance
In 2020, the most recent year for which there is data available, 150,740 children were served by child and family programs at EarlyON centres,
| Item | 2019 | 2020 | Percentage Change % |
|---|---|---|---|
| Number of children served | 384,851 | 150,740 | −60.8 |
| Number of visits by children | 2,590,151 | 711,279 | −72.5 |
| Number of visits by parents or caregivers | 2,105,538 | 593,256 | −71.8 |
Data source: Ontario Ministry of Education.
Professional learning indicators
The indicators reported in this section are reflective of the area of investment under the agreement for innovative approaches to providing access to high quality training and professional learning opportunities for the early years and child care workforce (see Appendix: List of Indicators under the Canada-Ontario Early Learning and Child Care Agreement).
Early childhood educators’ qualifications upgrade program
This program enables individuals working in eligible child care and early years settings to apply for grants to support them in obtaining an early childhood education diploma and becoming eligible to apply for membership with the College of Early Childhood Educators. The program also provides opportunities for leadership development, targeted to those who are working in supervisory roles or who aspire to do so, and who are already RECEs. In addition, the program prioritizes Francophone and First Nations, Métis, and Inuit applicants, as well as individuals working under director approvals or Letters of Permission.
Financial support is available to eligible applicants in the form of education grants, travel grants, and training allowances. In 2021–22, the ministry allocated $3.5 million in provincial funding and $2 million in federal funding under the ELCC Agreement, and $1.5 million in federal funding under the Early Childhood Workforce Funding Agreement for the Early Childhood Educators Qualifications Upgrade Program. The ministry continues to work towards expanding access to the program to increase the number of RECEs in child care and early years programs. For example, part-time students (in addition to full-time students) are now eligible for direct sponsorship, where the grant program pays the college directly for the cost of tuition fees rather than requiring the students to pay up front and be reimbursed. In 2021–22, a total of 2,322 applications were approved under the Early Childhood Educators Qualifications Upgrade Program, an increase of 14% from 2020–21.
Professional learning strategy for Francophone and Indigenous professionals
Given that the professional learning needs are often heightened in Francophone and Indigenous communities and fewer supports are available, focused professional learning opportunities have been provided to better meet needs through more targeted, differentiated cultural and regional approaches.
In 2021–22, the ministry allocated $2.25 million in federal funding to three organizations to support three professional learning for Francophone and Indigenous professionals in the early years and child care sector. This funding was allocated to the following organizations:
- Association francophone à l’éducation des services à l’enfance de l’Ontario (AFÉSEO) for early years and child care professionals working in francophone settings
- FIREFLY for early years and child care professionals in First Nations communities on-reserve
- Ontario Aboriginal Head Start Association (OAHSA) for early years and child care professionals working with First Nation, Metis, Inuit, or Indigenous off-reserve settings
Funds provided to these organizations aim to enhance culturally relevant experiences through the delivery of high-quality child care and early years programs, in alignment with How does learning happen. The organizations also create linkages to and/or develop professional learning resources that are responsive to the needs of the sector.
Appendix: List of indicators under the Agreement
| Principles | Indicators related to planned investment | Indicators as reported by Ontario | Reference to the data in the report |
|---|---|---|---|
| High quality child care | |||
| High quality | Number and percentage of providers with Early Childhood Education (ECE) certification | Number and percentage of program staff who are Registered Early Childhood Educators (RECEs) Percentage of licensed child care centres employing only RECEs for the positions requiring qualified employees | See "Staff Qualifications" under "Licensed Child Care Indicators" |
| High quality | Number and percentage of programs implementing Ontario’s pedagogy for the early years, How does learning happen | Number of affirmations confirming programming alignment with How does learning happen | See "Pedagogical Framework" under "Licensed Child Care Indicators" |
| Accessible affordable and flexible | Number and percentage of children who have access to licensed child care | Percentage of children aged 0–12 years for whom there are licensed child care spaces | See "Access" under "Licensed Child Care Indicators" |
| Accessible affordable and flexible | Number and percentage of children receiving subsidies | Number and percentage of children receiving child care fee subsidies | See "Affordability" under "Licensed Child Care Indicators" |
| Accessible affordable and flexible | Number and percentage of licensed child care programs that offer flexible hours | Number and percentage of programs providing care during non-standard hours | See "Flexibility and Inclusion" under "Licensed Child Care Indicators" |
| Accessible affordable and flexible | Number of additional licensed child care spaces created | Number of additional licensed child care spaces created in licensed centres | See "Access" under "Licensed Child Care Indicators" |
| Accessible affordable and flexible | Number of children receiving subsidy by family income | Number and percentage of children receiving child care fee subsidies by family income | See "Affordability" under "Licensed Child Care Indicators" |
| Inclusive | Number of child care programs designed to serve French linguistic minority communities and Indigenous People off-reserve | Number of French-language licensed child care centres | See "French-language and Bilingual Child Care" under "Licensed Child Care Indicators" |
| Inclusive | Number of child care programs designed to serve French linguistic minority communities and Indigenous People off-reserve | Number of Indigenous-led centres in urban and rural communities | See "Indigenous-led Child Care Centres" under "Licensed Child Care Indicators" |
| Inclusive | Number of children with additional support needs participating in child care programs | Number of children funded through Special Needs Resourcing | See "Special Needs Resourcing" under "Licensed Child Care Indicators" |
| Inclusive | Number and proportion of children from low-income and middle class families participating in early learning and child care programs | Number and percentage of children for whom a licensed space is available by income | See "Children in Licensed Child Care by Income" under "Licensed Child Care Indicators" |
| High quality early learning | |||
| High quality | Number and percentage of providers with Early Childhood Education (ECE) certification | Qualification requirements for program staff working in child and family centres | See "Staff Qualifications" under "EarlyON Child and Family Centres Indicators" |
| High quality | Number and percentage of programs adopting Ontario’s pedagogy for the early years, How does learning happen | Service guideline requires programming alignment with How does learning happen | See "Pedagogical Framework" under "EarlyON Child and Family Centres Indicators" |
| Accessible affordable and flexible | Number of new EarlyON Child and Family Centres (including full and part-time locations) | Number of EarlyON Child and Family programs offering full- and part-time hours | See "Access, Affordability, Flexibility and Inclusion" under "EarlyON Child and Family Centres Indicators" |
| Accessible affordable and flexible | Number of child and family visits to early learning programs | Number of child and family visits to EarlyON Child and Family Centres | See "Access, Affordability, Flexibility and Inclusion" under "EarlyON Child and Family Centres Indicators" |
| Accessible affordable and flexible | Number and percentage of children who have access to early learning programs | Number and percentage of children served by EarlyON Child and Family Centres | See "Access, Affordability, Flexibility and Inclusion" under "EarlyON Child and Family Centres Indicators" |
| Accessible affordable and flexible | Number and percentage of early learning programs that offer flexible hours | Number and percentage of EarlyON Child and Family that offer programming during non- standard hours | See "Access, Affordability, Flexibility and Inclusion" under "EarlyON Child and Family Centres Indicators" |
| Inclusive | Number of early learning programs designed to serve French linguistic minority communities and Indigenous People off-reserve | Number of child and family centres that offer culturally relevant programming for Indigenous children and families | See "Access, Affordability, Flexibility and Inclusion" under "EarlyON Child and Family Centres Indicators" |
| Inclusive | Number of early learning programs designed to serve French linguistic minority communities and Indigenous People off-reserve | Number of child and family centres that offer French-language programming for Francophone children and families | See "Access, Affordability, Flexibility and Inclusion" under "EarlyON Child and Family Centres Indicators" |
| Professional learning | |||
| Early Childhood Educators qualifications upgrade program | Number of individuals supported through the Early Childhood Educators Qualifications Upgrade Program per annum | Number of individuals supported through the Early Childhood Educators Qualifications Upgrade Program | See "Early Childhood Educators Qualifications Upgrade Program" under "Professional Learning Indicators" |
| Innovative service delivery | Innovative service delivery to support professional learning | Number of professional learning initiatives supported | See “Professional Learning Strategy for Francophone and Indigenous Professionals” |
The Ministry of Education acknowledges the Government of Canada's support in connection with the Multilateral Early Learning and Child Care Framework and the Canada-Ontario Early Learning and Child Care Agreement. Part 3 of this document outlines Ontario's progress towards meeting early learning and child care goals under the agreement.
Footnotes
- footnote[1] Back to paragraph The "family age group" designation allows children of different ages in the same family to be placed in the same group in a play activity room, as long as they are between the ages of 0–12 years. This designation is used by licensed child care centres and came into effect on September 1, 2017.
- footnote[2] Back to paragraph "Approved homes" refers to the maximum number of homes that an agency is permitted to contract with.
- footnote[3] Back to paragraph Data source: 2022 Licensed Child Care Operations Survey, Ontario Ministry of Education. All licensed child care centres and home child care agencies that were operating as of March 31, 2022, were asked to complete the 2022 survey, and more than 98% did so.
- footnote[4] Back to paragraph "Active homes" refers to the number of home child care providers that have a contract/agreement with an agency.
- footnote[5] Back to paragraph The "family age group" designation allows children of different ages in the same family to be placed in the same group in a play activity room, as long as they are between the ages of 0–12 years. This designation is used by licensed child care centres and came into effect on September 1, 2017.
- footnote[6] Back to paragraph "Auspice" refers to the ownership and operation of a service. In this report, licensed child care centres are categorized into two types of auspice: not-for-profit and for-profit.
- footnote[7] Back to paragraph Different sets of age categories were used to collect data for licensed child care centres and licensed home child care agencies. Age categories used for licensed child care centres are in accordance with the Child Care and Early Years Act, 2014. These age categories do not apply to licensed home child care.
- footnote[8] Back to paragraph Ontario Regulation 137/15 sets out rules under the Child Care and Early Years Act, 2014 governing staff in licensed child care centres. For each group of children in licensed child care centres, the licensee is required to employ at least one program staff member who is listed on the College of Early Childhood Educators’ Public Register as a member in good standing or who has been otherwise approved by a director. For more information, see “Staff Qualifications” under “Licensed Child Care Indicators”.
- footnote[9] Back to paragraph Data source: EarlyON web page on Ontario.ca, Ontario Ministry of Education.
- footnote[10] Back to paragraph 113,323 EDI questionnaires were analysed for Cycle 1; 110,916 for Cycle 2; 119,494 for Cycle 3; 125,858 for Cycle 4; and 123,912 for Cycle 5.
- footnote[11] Back to paragraph "Vulnerable" describes children who score below the 10th percentile of the Ontario EDI baseline population scores. This indicates that they are struggling in comparison to the baseline population.
- footnote[12] Back to paragraph Actual allocations may vary according to the latest population estimates.
- footnote[13] Back to paragraph Totals may not add up due to rounding.
- footnote[14] Back to paragraph Figure is subject to change upon the completion of the 2021–22.
- footnote[15] Back to paragraph Final expenditures are subject to change pending the 2021–22 audit.
- footnote[16] Back to paragraph Data source: Child Care Licensing System, Ontario Ministry of Education, as of March 31, 2022.
- footnote[17] Back to paragraph Data source: 2022 Licensed Child Care Operations Survey, Ontario Ministry of Education (as of March 31, 2022).
- footnote[18] Back to paragraph The estimation does not account for children cared for in homes contracted with licensed home child care agencies. All the “Percentage of children aged 0–12 for whom there are licensed child care spaces” are updated with the 2022 Summer child population projection data, Ontario Ministry of Finance.
- footnote[19] Back to paragraph Data source: Education Finance Information System, Ontario Ministry of Education. The total number includes federal, provincial, and municipal funding sources.
- footnote[20] Back to paragraph Data source: Education Finance Information System, Ontario Ministry of Education.
- footnote[21] Back to paragraph The percentage of children receiving subsidy by family income does not add up due to rounding.
- footnote[22] Back to paragraph Data source: 2022 Licensed Child Care Operations Survey, Ontario Ministry of Education (as of March 31, 2022).
- footnote[23] Back to paragraph Data source: Education Finance Information System, Ontario Ministry of Education. The total number includes federal, provincial, and municipal funding sources.
- footnote[24] Back to paragraph Data source: 2022 Licensed Child Care Operations Survey, Ontario Ministry of Education (as of March 31, 2022).
- footnote[25] Back to paragraph Data source: Statistics Canada, 2016 Census of Population, Statistics Canada Catalogue no. 98-400-X2016104.
- footnote[26] Back to paragraph Data source: Ontario Ministry of Education.
- footnote[27] Back to paragraph Percentage is an estimate based on the number of children served and the total population of children in the province aged 0–6 years.
- footnote[28] Back to paragraph Data source: Ontario Ministry of Education. Based on the most recent year of data available.
- footnote[29] Back to paragraph Data source: Ontario Ministry of Education. The 2020–21 total is based on an annual report submitted by the program administrator. The total number includes federal and provincial funding sources.
- footnote[30] Back to paragraph This column lists the indicators outlined in the Canada-Ontario Early Learning and Child Care Agreement.
- footnote[31] Back to paragraph "Early learning" under the Canada-Ontario Early Learning and Child Care Agreement refers to EarlyON Child and Family Centres within the context of Ontario.