Ontario’s housing and homelessness system
Ontario plans and manages housing and homelessness from a system planning approach.
The Ontario government sets the overall vision and establishes the legislative and policy framework for housing and homelessness initiatives. Within the framework, 47 local Service Managers identify needs in their communities, develop 10 year local housing and homelessness plans and design and deliver services to people either directly or through delivery partners. Housing and homelessness plans need to be consistent with the Policy Statement: Service Manager Housing and Homelessness Plans. They integrate housing and homelessness planning and service delivery with other local activities. The 47 Service Managers are comprised of municipalities and District Social Services Administration Boards which serve northern communities. This approach allows Service Managers to address unique local circumstances, challenges and opportunities and helps ensure that the solutions they implement respond to the highest priority need.
In addition, Ontario works closely with Indigenous partners to plan housing and homelessness services that best serve Indigenous peoples off-reserve. To do this, it engages with representative organizations on both systems planning and program design.
Across federal, provincial and municipal governments, approximately $5 billion was spent on housing and homelessness services in Ontario in 2017-18 (the most recent year spending information is currently available). Municipalities are the biggest contributors to community housing, with support from the federal government and the province. The province is the primary funder of homelessness services, with some municipalities making a large contribution and some communities receiving federal funding as well. The province is the primary funder of supportive housing programs, which combines subsidized housing with support services.
Spending varies from year to year, but overall the province is the largest contributor to housing and homelessness spending in Ontario.
Chart 1: Share of spending by program type
This chart shows the share of spending by different levels of government across community housing, homelessness and supportive housing, over the four years from 2014-15 to 2017-18.
| Group | Municipal | Provincial | Federal |
|---|---|---|---|
| Community Housing | 54% | 11% | 35% |
| Homelessness | 23% | 69% | 8% |
| Supportive Housing | 0.5% | 99% | 0.5% |
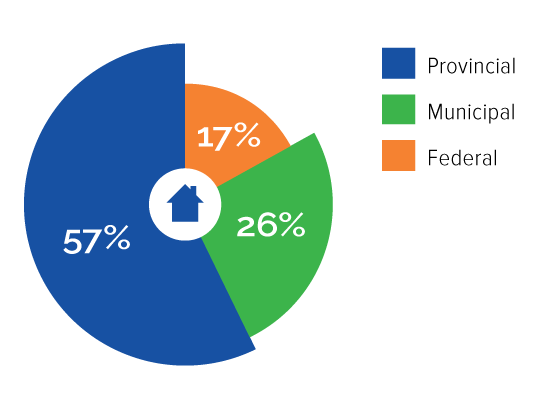
Chart 2: Share of total spending
This chart shows total spending by the federal, provincial and municipal governments as a 4-year average from 2014-15 to 2017-18. Federal share 17%, provincial share 57% and municipal share 26%.
The province welcomes the federal investments through the National Housing Strategy and has designed an approach that builds on existing programs that enable Service Managers and Indigenous Program Administrators to address priority local needs.
To promote communications and efficient service delivery across all orders of government, the Province, Service Managers and the federal government established a Co-ordination Forum to discuss housing and homelessness initiatives.