Analyses of information collected
To achieve the purposes of the ARA, analyses of the collected personal information is necessary. The ARA and Standards require that PSOs minimize the amount of personal information used in analyses and use it in the least identifiable form possible. Access is limited to those who need it to perform their duties under the ARA.
In addition to information collected under the ARA, section 9 permits a PSO to use other personal information it has lawfully collected for the purpose of eliminating systemic racism and advancing racial equity, subject to rules specified in the ARA, the regulations and the Standards.
This enables PSOs to use that information to analyze racial impacts and outcomes of a program, service, or function. For example, an organization that is already collecting personal information about individuals (e.g. age and sex) or tracking individual outcomes (such as performance measures) within a program, service, or function, may use this information for the purpose of identifying and monitoring systemic racism and racial disparities.
Units of Analysis
Standard 27. Primary Units of Analysis
PSOs must conduct analyses using primary units of analysis, namely the disaggregated categories of Indigenous identity and race. The disaggregated categories of religion and/or ethnic origin may also be primary units of analysis wherever these are collected under the ARA.
Units of analysis (categories) must be aggregated if doing so is necessary to protect individual privacy and does not affect findings of racial inequalities.
Rationale
Although personal information is collected about individuals, the purpose of the analysis is to identify and monitor systemic racial inequalities in outcomes for groups. This requires analyzing results by disaggregated categories of Indigenous identity and race, as well as other categories like religion and ethnic origin where these are collected under the ARA.
Guidance
The categories of Indigenous identity and race are the focus of analyses. Analyses using disaggregated categories are a minimum requirement. The Standard does not preclude additional analyses using merged or aggregated categories, such as “mixed or multiple race,” “racialized,” etc., as long as disaggregated analyses are also conducted.
Multiple Race Categories
Some people report more than one racial background. Analysis should be sensitive to commonalities and differences in experience and treatment among persons reporting multiple race categories.
In some cases, it may make sense to count persons who report White and some other race according to the other race category selected. For example, the experience of an individual reporting as Black and White may have experiences more closely resembling that of an individual reporting only as Black. For analytical purposes, therefore, it may be appropriate to categorize individuals that report both Black and White as Black. This approach is consistent with Statistics Canada’s practice (see Appendix D: Using Statistics Canada Data Sets for Benchmarking).
In other circumstances, it may be necessary and appropriate to aggregate or construct socially meaningful mixed-race categories. For example, a generic mixed-race category may be appropriate if there are insufficient or small numbers of individuals (fewer than 15) who select multiple race categories.
If a generic mixed-race category might obscure significant differences, and sample sizes are sufficient, consider using specific combinations of race categories such as ‘White and Black,” “White and South Asian,” “Black and South Asian,” “Black and Indigenous,” etc.
Intersectional Race Analysis
Analyses of racial disparities and disproportionalities may also include intersections among Indigenous identity, race, and/or religion, ethnic origin and any other relevant types of personal information (age, gender identity, immigration status, disabilities, sexual orientation, etc.).
Additional units of analysis may include categories of other personal information (if collected or used for the purpose set out in the Act) for intersectional analyses with Indigenous identity, race, and religion or ethnic origin. For example, in analyses of race and gender, the unit of analysis would be the combination of race and gender categories (interaction terms); for example, “South Asian male,” “South Asian female,” etc.
Analyses of Outcomes
Standard 28. Focus on Outcomes
PSOs must conduct disproportionality and/or disparity analyses using outcomes of individuals accessing a program, service, or function.
Rationale
Use of outcome data with Indigenous identity, race, and race-related data is necessary to identify and monitor potential systemic racial inequalities in programs, services, or functions.
Guidance
In addition to the personal information collected under the ARA, personal information that PSOs have already collected as part of administrative functions is an important source of data on the outcomes of programs, services, or policies. Personal information lawfully collected under another statute can be used for the purposes of analyses under the ARA (s. 9).
For the purpose of conducting analysis under this Standard, an outcome is client-focused. This could include outputs of an organization’s programs, services, or functions, such as receipt of benefits or services provided, access to programs delivered, etc. Outcomes should include the results or impacts of interactions between a client and service provider, such as those arising from a decision, treatment, or assessment. Where possible, outcomes should reflect the results or impacts at any stage of the clients’ interactions with the organization’s program, service, or function and should including the final outcome.
Racial disproportionalities and disparities can result from decisions that have the effect of privileging some and disadvantaging others. It is important to identify outcomes for individuals within a policy, program, service, or function, such as:
- Penalties, sanctions, or fines;
- Awards or privileges;
- Promotions and appointments;
- Access to appropriate treatments, services, or programs; or
- Quality of treatment or experiences.
Outcomes that reflect an individuals’ access, experiences, or treatment in the program, service, or function may have significant cumulative impacts on final outcomes for individuals. It may be helpful to map the pathway of potential outcomes at various stages of a clients’ involvement in a program, service, or function (see Appendix A for an example of mapping outcomes in the child protection system).
PSOs should engage with Indigenous, Black, and racialized communities, partners and stakeholders to identify meaningful outcomes to analyze and report. Consider a balanced approach that includes tracking and monitoring both positive and negative outcomes of policies, programs, services, and functions.
Minimum Requirements for Analysis
Standard 29. Racial Disproportionality and Disparity Indices
PSOs must produce racial disproportionality and/or racial disparity indices for each unit of analysis.
- A racial disproportionality index is a measure of a racial group’s overrepresentation or underrepresentation in a program, service, or function relative to the group’s representation in the reference population.
- A racial disparity index is a measure of group differences in outcomes by comparing the outcomes for one group with those of another.
Calculating Racial Disproportionality Index
The disproportionality index is calculated using this equation:
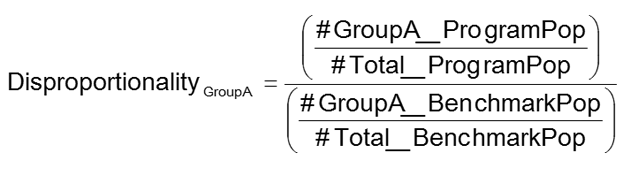
where:
- #GroupA_ProgramPop
- is the number of individuals of Group A in a program population
- #Total_ProgramPop
- is the total number of all individuals in the program population
- #GroupA_BenchmarkPop
- is the total number of individuals of Group A in a benchmark population (or eligible population)
- #Total_BenchmarkPop
- is the total number of all individuals in a benchmark population (or eligible population)
Calculating Racial Disparity Index
The racial disparity index (also known as a risk ratio or relative risk index) is calculated as follows:

- An equivalent equation is:
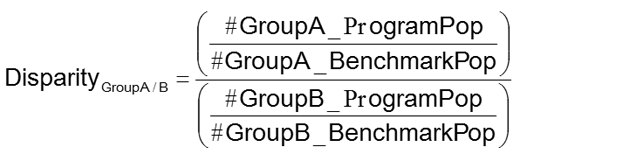
- The disparity index can be constructed using other statistics such as averages, rates, etc:

Rationale
Racial disproportionality and disparity indices are reliable and valid measures that are widely used to quantify racial inequalities within a program, service, or function.
Guidance
The racial disproportionality or disparity index are methodologies commonly used by various levels of government in Canada, the U.S., and the United Kingdom to compare the outcomes of populations or groups in sectors such as child welfare, youth and adult justice (including policing, courts, and corrections), education, and health.
In determining whether to use the racial disproportionality or disparity index, PSOs should engage with Indigenous, Black, and racialized communities, representatives, and partners, subject matter experts, and internal and external stakeholders.
See Appendix E for further guidance on racial disproportionality and disparity analyses and some illustrative examples.
Benchmarks and Reference Groups
Standard 30. Appropriate Benchmarks for Disproportionality Analyses
PSOs must choose and document the source(s) of appropriate benchmark(s) that reflect the most relevant eligible population to which the outcome is applicable and that are useful for interpreting year-over-year trends.
Rationale
The appropriate benchmark population shapes the interpretation of disproportionality analyses and the identification of long-term trends.
Guidance
A benchmark is a baseline against which outcomes may be compared or assessed. Benchmarks are integral to the calculation of racial disproportionalities and disparities. Appropriate benchmarks should come from the best available data sets that contain relevant data about the applicable population for a specific outcome, such as:
- Administrative data sets that contain comparable Indigenous identity, race, religion, and/or ethnic origin information; or
- Statistics Canada’s data sets, which are important and commonly used sources for establishing benchmarks of population groups in Ontario (see Appendix D for further considerations when using Statistics Canada data sets for benchmarking).
As an example of relevant benchmarks, when examining participation in a program, the number of people who are eligible for that program may be a more appropriate benchmark than the population of a city or region because not everyone in that population will be eligible.
Standard 31. Appropriate Reference Group for Disparity Analyses
PSOs must choose and document the source(s) of an appropriate reference group that allows for meaningful interpretation of patterns and trends that may be indicative of systemic racism. Where possible, the reference group should allow for interpreting results in the context of racial disparities reported in other sectors.
Rationale
The reference group is a type of benchmark used in racial disparity analyses to provide the contrast needed for meaningful interpretations of group differences in outcomes.
Guidance
Unlike benchmarks used to calculate disproportionalities, which may draw on a different data set, data used to construct the reference group should come from the same data set.
The choice of a reference group can affect the interpretation of findings by potentially hiding or revealing differences between groups. For example, using “all other groups” as a reference may result in lower disparities found if there are broad differences in outcomes between groups captured under that category.
In some circumstances, the appropriate reference group may be the group least likely to experience systemic barriers or systemic racism in Ontario. For example, to assess racial disparities in the justice sector, the outcomes of each group could be compared to the group least likely to experience systemic racism. In this case, the most appropriate reference group for consistent comparisons across the justice sector is the “White” category.
PSOs should engage with Indigenous, Black, and racialized communities and partners to determine the appropriate reference group. For example, in some cases, Indigenous communities or partners may not support or agree with comparisons between Indigenous peoples and non-Indigenous peoples.
Interpreting Analyses
Interpreting racial disproportionalities and disparities is a critical step in identifying potential notable racial inequalities.
Interpretation of disparity and disproportionality results involves attempting to understand the scope and magnitude of the results, and exploring possible explanations for the findings. This is done by:
- Comparing disproportionality or disparity results against a threshold;
- Examining the patterns of results over time; and
- (Where feasible) conducting analysis of more than one variable (multivariate analysis) to assess the extent to which other factors help explain the outcome (e.g. gender, age, poverty).
Interpretation is best informed by a combination of the following:
- Input from subject matter experts, stakeholders, and affected communities;
- Reference to existing research literature and other sources of information; and
- Comparisons against cross-sector and national findings.
Standard 32. Setting Thresholds to Identify Notable Differences
PSOs must set thresholds for each outcome measure of a program, service, or function, which, if met or exceeded, indicates a notable difference. Thresholds must be
- Reasonable, set in good faith, and reflect engagements with affected communities;
- Set consistently for all racial groups (different thresholds may not be set for different groups); and
- Focussed on adverse impacts or disadvantageous outcomes that would require remedial action.
Rationale
Using an appropriate threshold helps the organization to interpret the meaning of numerical results. It indicates whether the magnitude of the disproportionality and disparity indices represents a notable difference for further investigation, monitoring, and potential action.
Guidance
Appropriate and meaningful thresholds are expected to vary based on the nature and context of the outcome being assessed. Having common criteria for identifying thresholds is important to ensure transparency in the interpretation of analyses.
Thresholds should be established based on an analysis of numerical information (using statistical methods) as well as advice from community partners, stakeholders, and subject matter experts. If applicable, the thresholds should also be informed by case law.
The following considerations should underpin the accurate interpretation of results:
- Even small racial disproportionalities and disparities can be the result of systemic racism and can have tangible impacts on an individual’s or group’s quality of life.
- Tests for statistical significance do not necessarily provide guidance on the interpretation of results as evidence of notable differences.
- For small groups, tests of statistical significance may not show that significant differences exist in the sample used, even when they do exist in the population.
- For large groups, tests of statistical significance tend to indicate significant differences, even when very small.
- Interpret with caution and use statistical tests that are appropriate for smaller sample sizes (e.g. where the number of individuals in the underlying population is 25 or less). The reliability of results is lower with smaller samples.
Using thresholds to interpret results
A disparity or disproportionality index greater than or less than 1, does not necessarily indicate that group differences exist within a service, program, or function that are unfair or cause for concern. For example, a program may be designed to support a particular group, in which case the over-representation of that group in the program is to be expected.
Focussing on adverse impacts when setting a threshold (i.e. for either over- or under-representation) is important because not all differences are of concern. For example, if an organization sets a threshold of 2.0 to indicate a notable racial disproportionality in high school drop-out rates within a specific program, and finds a racial disproportionality index of 1.3 for Group A in a school district, and 2.6 for Group B, then there is evidence of a notable difference for Group B, but not for Group A. All disparity or disproportionality results should be reported, regardless of whether they meet the threshold.
Further assessments to understand potential racial inequalities
Racial disproportionality or disparities on their own may not be conclusive evidence of systemic racial inequalities.
Methods of further analysis could focus on determining the extent to which a racial disproportionality or disparity may be attributed, in whole or in part, to systemic racism. Multivariate analysis is one method used to identify other factors, such as socioeconomic conditions, that may help explain differences in group outcomes.
For example, a notable difference is found for Group A when compared with Group B. How much of this difference is due to a higher proportion of recent immigrants in Group A? A multivariate analysis helps to identify the unique effect of race on group differences, and how immigration status or other factors might contribute to outcomes independently of race.
Draw on other sources of information to help in the interpretation and understanding of findings. PSOs should use multiple methods, such as qualitative information obtained through focus groups, individual interviews with clients, employees, and experts, policy and program evaluations, research literature reviews, etc.
PSOs are encouraged to establish an advisory committee to support the analysis and interpretation of findings. To provide a diversity of perspectives, advisory committees could include clients, members of affected committees, subject matter experts, and internal and external stakeholders and partners.