2016–2020 Environmental penalties five year review
This report reviews environmental penalties from January 2016 to December 2020. An environmental penalty review is required every five years under the Environmental Protection Act and the Ontario Water Resources Act.
Executive summary
This report reviews environmental penalties from January 1, 2016, to December 31, 2020. An environmental penalty review is required every five years under the Environmental Protection Act and the Ontario Water Resources Act.
Environmental penalties are administrative penalties that can be imposed by the ministry when certain industrial facilities spill or have unlawful discharges to air, water or land. Environmental penalties take the form of an order, requiring the payment of a monetary amount for the violation. These penalties are one of the many ways Ontario holds polluters accountable and ensures compliance with environmental laws that help protect and preserve our air, land and water.
Environmental penalties apply to 148 facilities in nine industrial sectors: organic and inorganic chemical manufacturing, industrial minerals, metal mining, metal casting, iron and steel manufacturing, petroleum, pulp and paper and electric power generation. This Environmental Penalty Five-Year Review covers data for the five calendar years of 2016 to 2020.
The primary goal of environmental penalties is to encourage quick and effective compliance. Staff feedback and experience has indicated that environmental penalties continue to provide a quick and effective tool to address violations, where applicable (i.e., land, water and sulphur dioxide air violations at certain industrial facilities).
The review found that the use of environmental penalties continues to be complementary with investigations with no impact on prosecutions. The use of environmental penalties generally fills a gap which was not previously addressed by prosecution (for example, where prosecution is not warranted, but an order is not the most effective tool).
The ministry provides ongoing training, resources and advice to Provincial Officers who are considering issuing environmental penalties.
The ministry continues to report annually on environmental penalties issued to provide transparency to the public.
Ontario Community Environment Fund
The Ontario Community Environment Fund (OCEF) uses money collected from environmental penalties to support environmental improvement projects in the community where a violation or environmental impact occurred.
From 2016 to 2018, 27 projects received over $500,000. From the 27 projects, money was granted to Indigenous communities, conservation authorities, municipalities, and incorporated non-profit organizations across 14 different watersheds. These projects delivered environmental benefits including planting over 54,000 trees, shrubs and plants; restoring over 28 hectares of land and 16 kilometres of shoreline; and engaging over 3,100 volunteer hours.
Ontario Community Environment Fund grant recipients have included:
- Water First Education and Training Inc., which received six grants totaling $159,843. These have helped improve drinking water and restore traditional fish habitat in collaboration with the Taykwa Tagamou, Sagamok, Brunswick House, Matachewan and Wahgoshig First Nation communities. These projects engaged young adults in stream restoration training, and local students in water-science education and tree planting.
- The Earth Rangers Foundation, which received $8,050 to update their online catalogue of missions and run the Back to Nature program, encouraged youth to plant native shrubs and plants, remove invasive plants and pick up litter in the Credit River watershed.
- The Pine River Watershed Initiative Network, which received three grants, totalling $46,195.32, has protected shoreline and improved water quality in Bruce County by planting 9,750 trees and installing 3.1 kilometres of cattle exclusion fencing.
OCEF program improvement and 2021 re-launch
In 2019, the OCEF program was temporarily paused while the ministry considered how the fund could be enhanced and better aligned with ministry priorities. Legislative amendments were made in 2019 to broaden the purposes for which funds collected from environmental penalties could be used, to better align with ministry priorities. In addition to environmental restoration and remediation projects, the OCEF program now also supports projects that foster resilient communities or provide local solutions to environmental issues.
While outside the scope of the report review period, the OCEF program re-launched in 2021 with updated program objectives and eligibility, based on the Ministry’s compliance and enforcement regions. In early 2022, over $880,000 was awarded to 17 projects across four regions. A list of these projects can be found on the Ontario Newsroom.
Actions taken and updates to environmental penalties 2016 to 2020
New environmental penalties for petroleum facilities
On July 1, 2019, environmental penalties came into force for flaring events at petroleum facilities that exceed the sulphur dioxide discharge threshold. The regulation establishes a threshold of 225 kilograms for sulphur dioxide discharges from flaring-type incidents in a 24-hour period.
As part of Ontario Regulation 530/18, the ministry requires facilities to provide calculated emissions information after each flaring incident. Based on these emissions calculations, the ministry may issue an environmental penalty where a specified emission threshold is exceeded. Facilities are required to provide calculated (and eventually measured) emissions information for each flaring-type incident.
Other actions and updates to environmental penalties post-2020
Some regulatory changes and policy proposals occurred outside of the scope of this report period. These are included for reference, but no analytics are provided.
Compliance Policy
The ministry’s compliance policy provides direction to the ministry on how to address non-compliance, including when administrative penalties may be issued. Most non-compliances issues are corrected using voluntary compliance tools (for example, education).
Proposed updates to the compliance policy were posted on the Environmental Registry of Ontario in May 2021 (ERO 019-2972). Administrative penalties may be used when actual or potential environmental or health impacts occurred as a result of the non-compliance, or in instances where violators are unwilling to return to compliance.
Effluent monitoring and effluent limits / municipal industrial strategy for abatement regulations revoked
Effective July 1, 2021, the nine sector-specific industrial wastewater Effluent Monitoring and Effluent Limits regulations, also known as the Municipal Industrial Strategy for Abatement (MISA) regulations, under the Environmental Protection Act were revoked. The requirements of the regulations were transferred into existing individual site-specific Environmental Compliance Approvals and started applying to the regulated facilities once the regulations were revoked on July 1, 2021.
Amendments to the environmental penality regulations under the Environmental Protection Act and the Ontario Water Resources Act were made to ensure that the two environmental penalty regulations will continue to apply to the same industrial facilities and violations. Revoking the MISA regulations provided industrial wastewater facilities with greater flexibility to make operational improvements, and removed duplication and overlap, while having no impact on where environmental penalties could be issued.
Other sulphur dioxide (SO2) violation expansion
Effective on, or after April 26, 2022, the ministry introduced additional environmental penalties to hold heavy emitters accountable for not meeting sulphur dioxide requirements. Environmental penalties for violations under Ontario Regulation 88/22 and Ontario Regulation 530/18, including monitoring, reporting, record-keeping, and operating requirement violations may now be issued to petroleum facilities. Additional limit exceedance penalties will come into effect in 2024. Details can be found in Ontario Regulation 222/07 and the Guideline for Implementing Environmental Penalties.
Environmental penalty orders overview 2007 to 2020
Between the period from 2007 to 2020, there have been 203 environmental penalty orders issued for 458 violations, totaling $3,361,099.70 (Table 1).
This 2022 five-year review looked at penalty use from 2016 to 2020, a five-year period, as compared to the previous five-year reviews, which looked at four-year periods. Environmental penalties came into effect in August 2007 — no penalties were issued in 2007. The first five-year review covered 2008 to 2011, and the second five-year review covered 2012 to 2015 inclusive. Details on penalties issued is available by March 31 each year when the environmental penalty annual report is issued.
| Year | Number of orders issued | Number of violations included in orders | Total penalty value |
|---|---|---|---|
| 2007 | 0 | 0 | 0.00 |
| 2008 | 6 | 7 | $69,583.40 |
| 2009 | 13 | 19 | $112,143.20 |
| 2010 | 33 | 74 | $430,112.90 |
| 2011 | 10 | 32 | $167,642.95 |
| 2012 | 16 | 20 | $195,457.40 |
| 2013 | 13 | 27 | $113,781.20 |
| 2014 | 18 | 29 | $189,713.83 |
| 2015 | 15 | 34 | $172,708.60 |
| 2016 | 11 | 23 | $123,314.80 |
| 2017 | 12 | 52 | $255,217.00 |
| 2018 | 19 | 58 | $397,881.90 |
| 2019 | 19 | 50 | $362,521.32 |
| 2020 | 18 | 33 | $771,021.20 |
| Total | 203 | 458 | $3,361,099.70 |
Environmental penalty orders issued from 2016 to 2020
Between 2016 and 2020, 79 environmental penalty orders were issued for 216 violations, totalling $1,909,956.22 (Table 2). However, the 2016-2020 period saw a significant increase in the use of the environmental penalty tool, both in terms of the average number of violations that environmental penalties were issued for, and the average value of environmental penalties being issued per year (as noted below in Table 2). In this review, the average number of violations per year was 43 compared to 28 in the last review. Similarly, the average value of penalties issued per year in this review has increased to $381,000 compared to almost $168,000 in the previous five-year review.
Some of the increased penalty amounts were related to the expansion of environmental penalties to include sulphur dioxide related violations. As well, penalties were issued for violations at 36 different facilities. Six facilities received penalties for more than 10 violations, which accounted for over 60% (134) of the total 216 penalty violations. These violations were generally related to limit exceedances and acute lethality violations.
As well, one facility in the industrial minerals sector experienced operational issues and unlawful discharges during 2016 to 2020, representing 10% of the 216 penalty violations. To promote and ensure compliance, the ministry used a combination of compliance and enforcement tools, including environmental penalty orders, director’s order and investigations that lead to charges, for example, prosecution.
| Review period | Total number of penalty orders | Total number of violations | Average number of violations per year | Total value of penalties issued | Average value of penalties issued per year |
|---|---|---|---|---|---|
| 2008-2011 | 62 | 132 | 33 | $779,482.45 | $194,870.61 |
| 2012-2015 | 62 | 110 | 28 | $671,661.03 | $167,915.26 |
| 2016-2020 | 79 | 216 | 43 | $1,909,956.22 | $381,991.24 |
Environmental penalty orders issued by type of violation
The types of violations for which environmental penalties can be applied include acute lethality, limit exceedances, monitoring and reporting, sulphur dioxide exceedances (air), spills/spill prevention and contingency plan and not having required approvals (Figure 1). Acute lethality (20%) and limit exceedances (57%) were the most common types of violation addressed through penalties. Figure 1 shows the total number of environmental penalties that were issued for each type of violation, issued between 2016 to 2020.
Figure 1: Environmental penalty issued by type of violation, percentage of total number of violations (216) from 2016 to 2020.
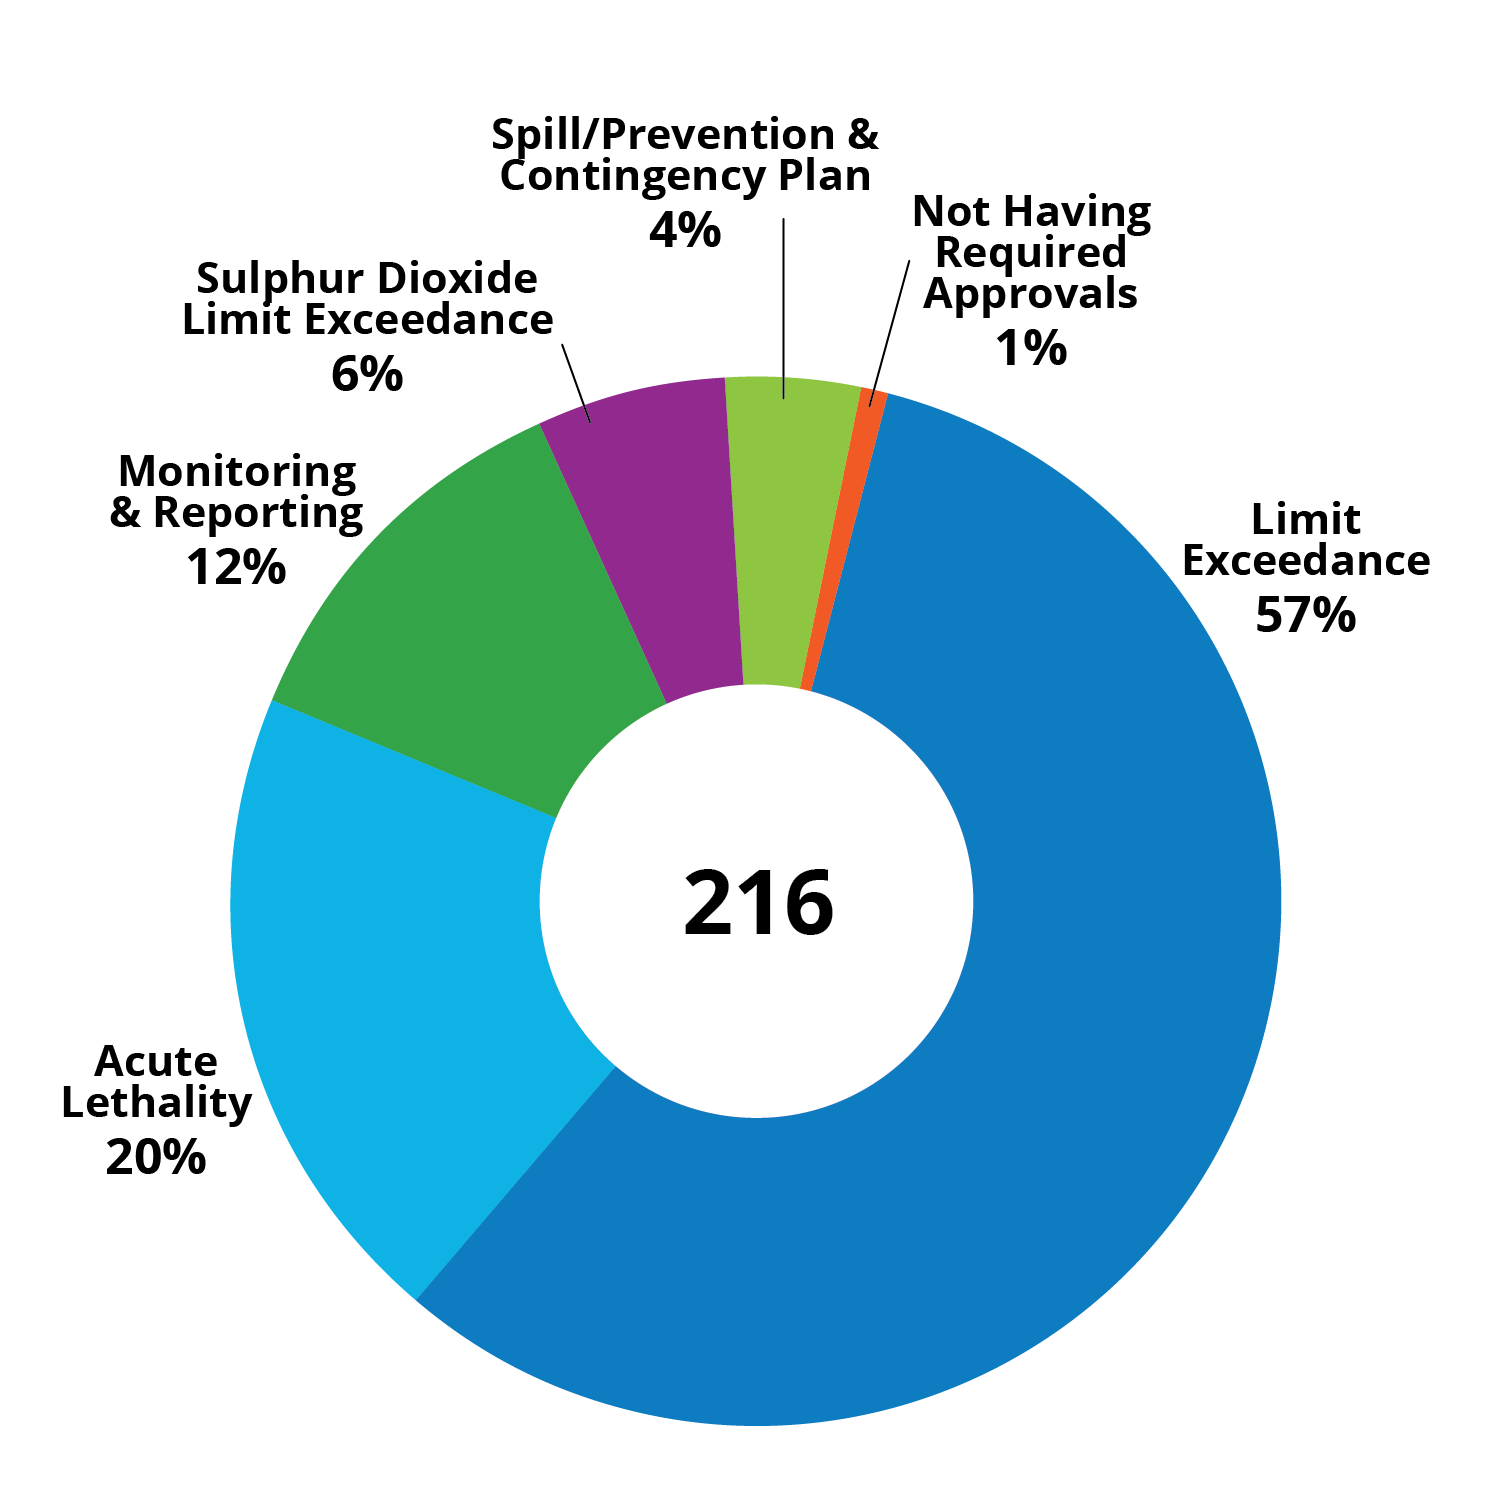
Figure 1 displays environmental penalties issued by violation type and their corresponding percentages from the total number of environmental penalties issued from 2016 to 2020. The total number of environmental penalties issued was 216.
Environmental penalty orders by sector
Environmental penalty orders applies to 148 facilities in nine industrial sectors found in Effluent Monitoring and Effluent Limits Regulations during the reporting period 2016-2020 (Figure 2). Metal mining, organic chemical, and electric power generation sectors have the most facilities subject to environmental penalties.
Figure 2: Number of Facilities that Environmental Penalty Orders apply to by Sector (2016-2020)
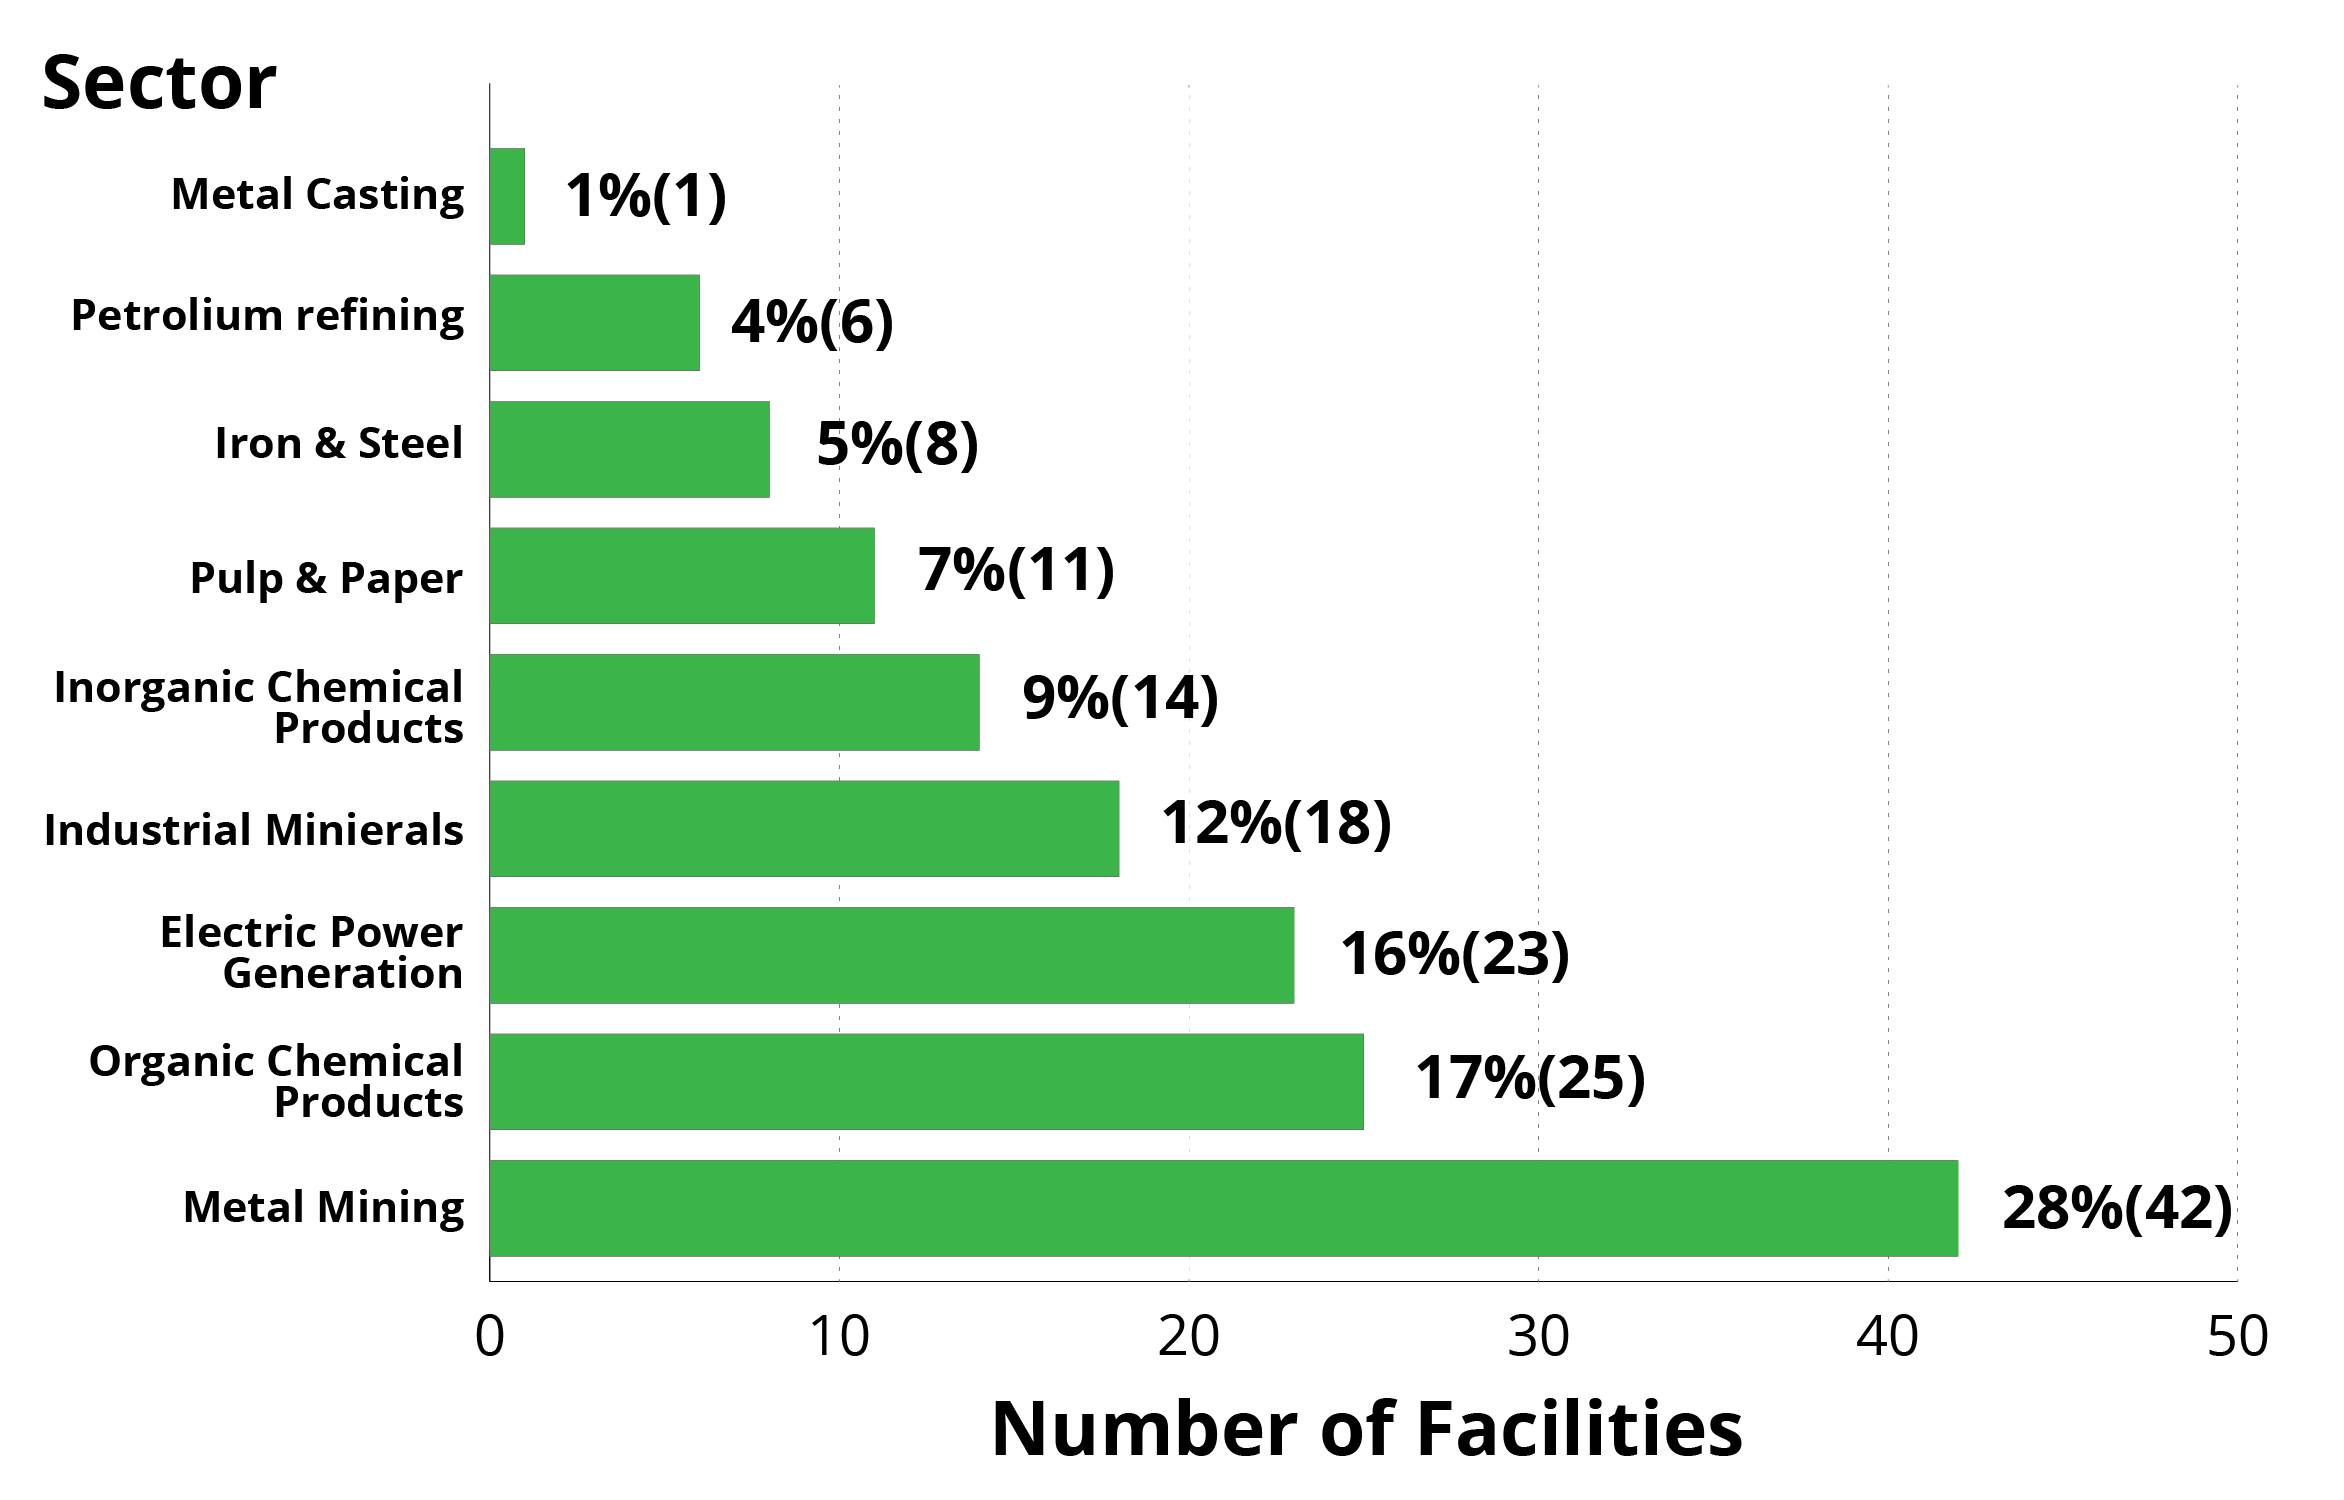
Figure 2 details the number of facilities that environmental penalty orders apply to by sector from 2016-2020. There are nine sectors represented in the figure and the number of facilities by sector are ranked lowest to highest.
Facilities in all sectors, except for metal casting, received environmental penalty orders between 2016 and 2020 (Table 3).
As illustrated in Table 3, issuance of environmental penalty orders varies among sectors. For example, facilities with acute lethality violations and limit exceedances were issued environmental penalty orders most frequently in the industrial minerals and pulp and paper sectors which also reported the most of these types of violations. The industrial minerals sector also received the most environmental penalty orders for monitoring and reporting violations. The petroleum sector was the only sector subject to penalties for sulphur dioxide limit exceedances. The distribution by sector of violations addressed through environmental penalty orders vary from previous report reviews. It reflects the addition of sulphur dioxide limit exceedances and repeated violations at one or two facilities within a sector.
| Sector | Acute lethality | Limit exceedance | Not having required approvals | Monitoring and reporting | Sulphur dioxide limit exceedance | Spill/prevention and contingency plan | Total | % Total |
|---|---|---|---|---|---|---|---|---|
| Industrial minerals | 13 | 43 | 0 | 12 | 0 | 0 | 68 | 31% |
| Pulp and paper | 10 | 39 | 0 | 1 | 0 | 1 | 51 | 24% |
| Metal mining | 7 | 16 | 0 | 7 | 0 | 4 | 34 | 16% |
| Petroleum | 3 | 7 | 0 | 3 | 12 | 3 | 28 | 13% |
| Electric power | 5 | 6 | 0 | 2 | 0 | 0 | 13 | 6% |
| Iron and steel | 5 | 8 | 0 | 0 | 0 | 0 | 13 | 6% |
| Inorganic chemical | 0 | 4 | 2 | 1 | 0 | 1 | 8 | 4% |
| Organic chemical | 1 | 0 | 0 | 0 | 0 | 0 | 1 | 0% |
| Grand total | 44 | 123 | 2 | 26 | 12 | 9 | 216 | 100% |
Appeals of environmental penalty orders
A total of four environmental penalty orders (5%) were appealed to the Ontario Land Tribunal during the period from 2016 to 2020.
In 2017, three environmental penalty orders issued to the same company containing 24 violations were appealed. The appeal process resulted in four violations being removed, reducing the amount of the overall penalty orders from $99,950 to $80,151.40.
In 2019, an environmental penalty order for $130,000 was appealed to the Ontario Land Tribunal. At the tribunal, an agreement was reached to revoke the penalty if the company complied with an updated director’s order. The company did not comply with the order and the penalty was not revoked. The company then went into a receivership process to find a new buyer. In early 2022 the company was purchased, and the environmental penalty order was paid in late 2022.
Environmental penalty amounts
Companies may seek up to a 35% reduction in their penalties under Ontario Regulation 222/07 if they can demonstrate actions taken to prevent or mitigate the violation and for having an environmental management system in place. When determining the penalty value, the ministry looks at efforts to prevent spills, unlawful discharges, and other violations and how quickly a company worked to remedy the events or non-compliance. This encourages facilities to put pollution prevention measures in place and improve their environmental performance.
Between 2016 and 2020, 79 environmental penalty orders were issued for 216 violations, worth $1,909,956.22.
The smallest environmental penalty amount, including reductions, issued for a single violation was $700, for a limit exceedance or monitoring violation, and the largest was $79,000 for a sulphur dioxide limit exceedance violation. Reductions were requested for most of the violations (86%). The average reduction per violation was 22%. Environmental penalty reductions ranged from $0 to $31,001.25 per violation. Total reductions equalled $580,084.78 during this period.
As well, a company was issued one environmental penalty order in 2017 and submitted information to qualify for a 30% reduction based on preventive and mitigative measures for three multi-day violations and requested additional reductions identifying that the penalty amounts were punitive. The director determined that the penalty amounts should be revised and reduced the penalty amount for these three multi-day violations by an additional 20%, for a total reduction of 44%, relative to the initial penalty amount for these violations. In this unique circumstance, the reductions ensured the penalty amount was not punitive in nature while providing a strong incentive for the company to comply with requirements under the Environmental Protection Act.
Environmental penalties and prosecutions
An investigation is conducted to determine if reasonable grounds exist to proceed with charging a company. A referral for an investigation is typically related to more serious violations or repeated/ongoing offenses. The ministry may prosecute facilities that are also subject to environmental penalties through the courts for the same violation of an environmental law if it is warranted. If a regulated person is convicted for the same violation where a penalty order has already been issued, the court shall consider the payment of a penalty as a mitigating factor when imposing a fine. Environmental penalties generally fill a gap which was not previously addressed by prosecution (for example, where prosecution is not warranted, but an order is not the most effective tool).
Between 2016 and 2020, there were 41 requests for investigation related to alleged violations that could also be subject to environmental penalties (Table 4). Most of these requests occurred in the industrial minerals (59%), metal mining (22%) and petroleum sectors (12%). All the requests for investigation in the industrial minerals sector are related to one company. Requests can include multiple violations and more than one type of violation. Of the 41 requests:
- 68% included effluent limit exceedances
- 32% included acute lethality violations
- 20% included spill violations
- 7% included violation of a director’s order
- 2% included a monitoring and reporting violation or not having an approval
There were two cases where the ministry investigated violations where an environmental penalty order was issued. The investigation determined no further enforcement action (for example, prosecution) was warranted. A case can include more than one referral for investigation.
There were eight investigation cases where prosecution occurred where an environment penalty order was applied or could have been used during the review period. A case can include more than one referral for investigation. There were:
- Two cases where a company was prosecuted for the same violation for which an environmental penalty order was issued:
- In one case related to a limit exceedance and acute lethality violation, a company was charged. All charges were withdrawn following compliance agreements involving new owners
- In one case, a conviction was obtained for a spill/discharge with a fine of $325,000. An environmental penalty order had been issued for the same violation with a penalty of $36,950
- Six cases were prosecuted where an environmental penalty could have been pursued but only prosecution was taken:
- In one case the company was charged and then all charges were later withdrawn following compliance agreements with new site owners
- Three cases resulted in convictions for limit exceedance violations, altering sewage works violation and a spill/discharge resulting in fines totalling $355,000
- Two cases are before the courts
In total there were four completed prosecutions that resulted in convictions for limit exceedance violations, altering sewage works without approval violation and spill/discharges with fines totalling $680,000.
| Sector | Unique facilities | 2016 | 2017 | 2018 | 2019 | 2020 | Total |
|---|---|---|---|---|---|---|---|
| Electric power generation | 1 | 0 | 0 | 0 | 0 | 1 | 1 |
| Industrial minerals | 1 | 4 | 13 | 6 | 1 | 0 | 24 |
| Iron and steel | 1 | 0 | 0 | 0 | 1 | 0 | 1 |
| Metal mining | 4 | 4 | 0 | 5 | 0 | 0 | 9 |
| Petroleum refining | 4 | 1 | 1 | 0 | 3 | 0 | 5 |
| Pulp and paper | 1 | 0 | 0 | 1 | 0 | 0 | 1 |
| Total | 12 | 9 | 14 | 12 | 5 | 1 | 41 |
Environmental penalty violation type analysis 2016 to 2020
This section refers to violations at facilities that may be subject to environmental penalties.
Limit exceedance
There are two types of limit exceedances included in this report: some which relate to effluent that is discharged to water and those that relate to sulphur dioxide air limit exceedances that result from flaring events at petroleum facilities.
Effluent limits
A limit exceedance refers to, discharge/emission that does not meet the level as identified in an environmental approval, order or regulation. Some limit exceedances pertain to a contaminant, such as total suspended solids, which may result from an exceedance of a daily or monthly limit. Other exceedances of limits pertain to operating parameters, such as temperature or pH that may result from continuous monitoring with any departure above the limit being considered a reportable exceedance. These operating parameters, while important on their own, also serve as an indicator to identify issues with effluent quality.
In total, there were 1,180 limit exceedances for both contaminants and operating parameters. Of these, 68% were attributable to one company who experienced operational issues. Regarding this company, the ministry issued three environmental penalty orders for 22 violations, including 10 limit exceedances. As well, a director’s order and investigation were commenced to address the operational issues and discharges.
Contaminant effluent limits
There were 539 limit exceedance violations during the period from January 1, 2016, to December 31, 2020, pertaining to a variety of limits for contaminants (Figure 3). There were more limit exceedances in the 2016-2020 reporting period, compared to the previous reporting period (2012-2015). However, 38% of these limit exceedances related to one company in the industrial minerals sector.
Figure 3: Limit Exceedances (Contaminants) Reported by Facilities (2016-2020)
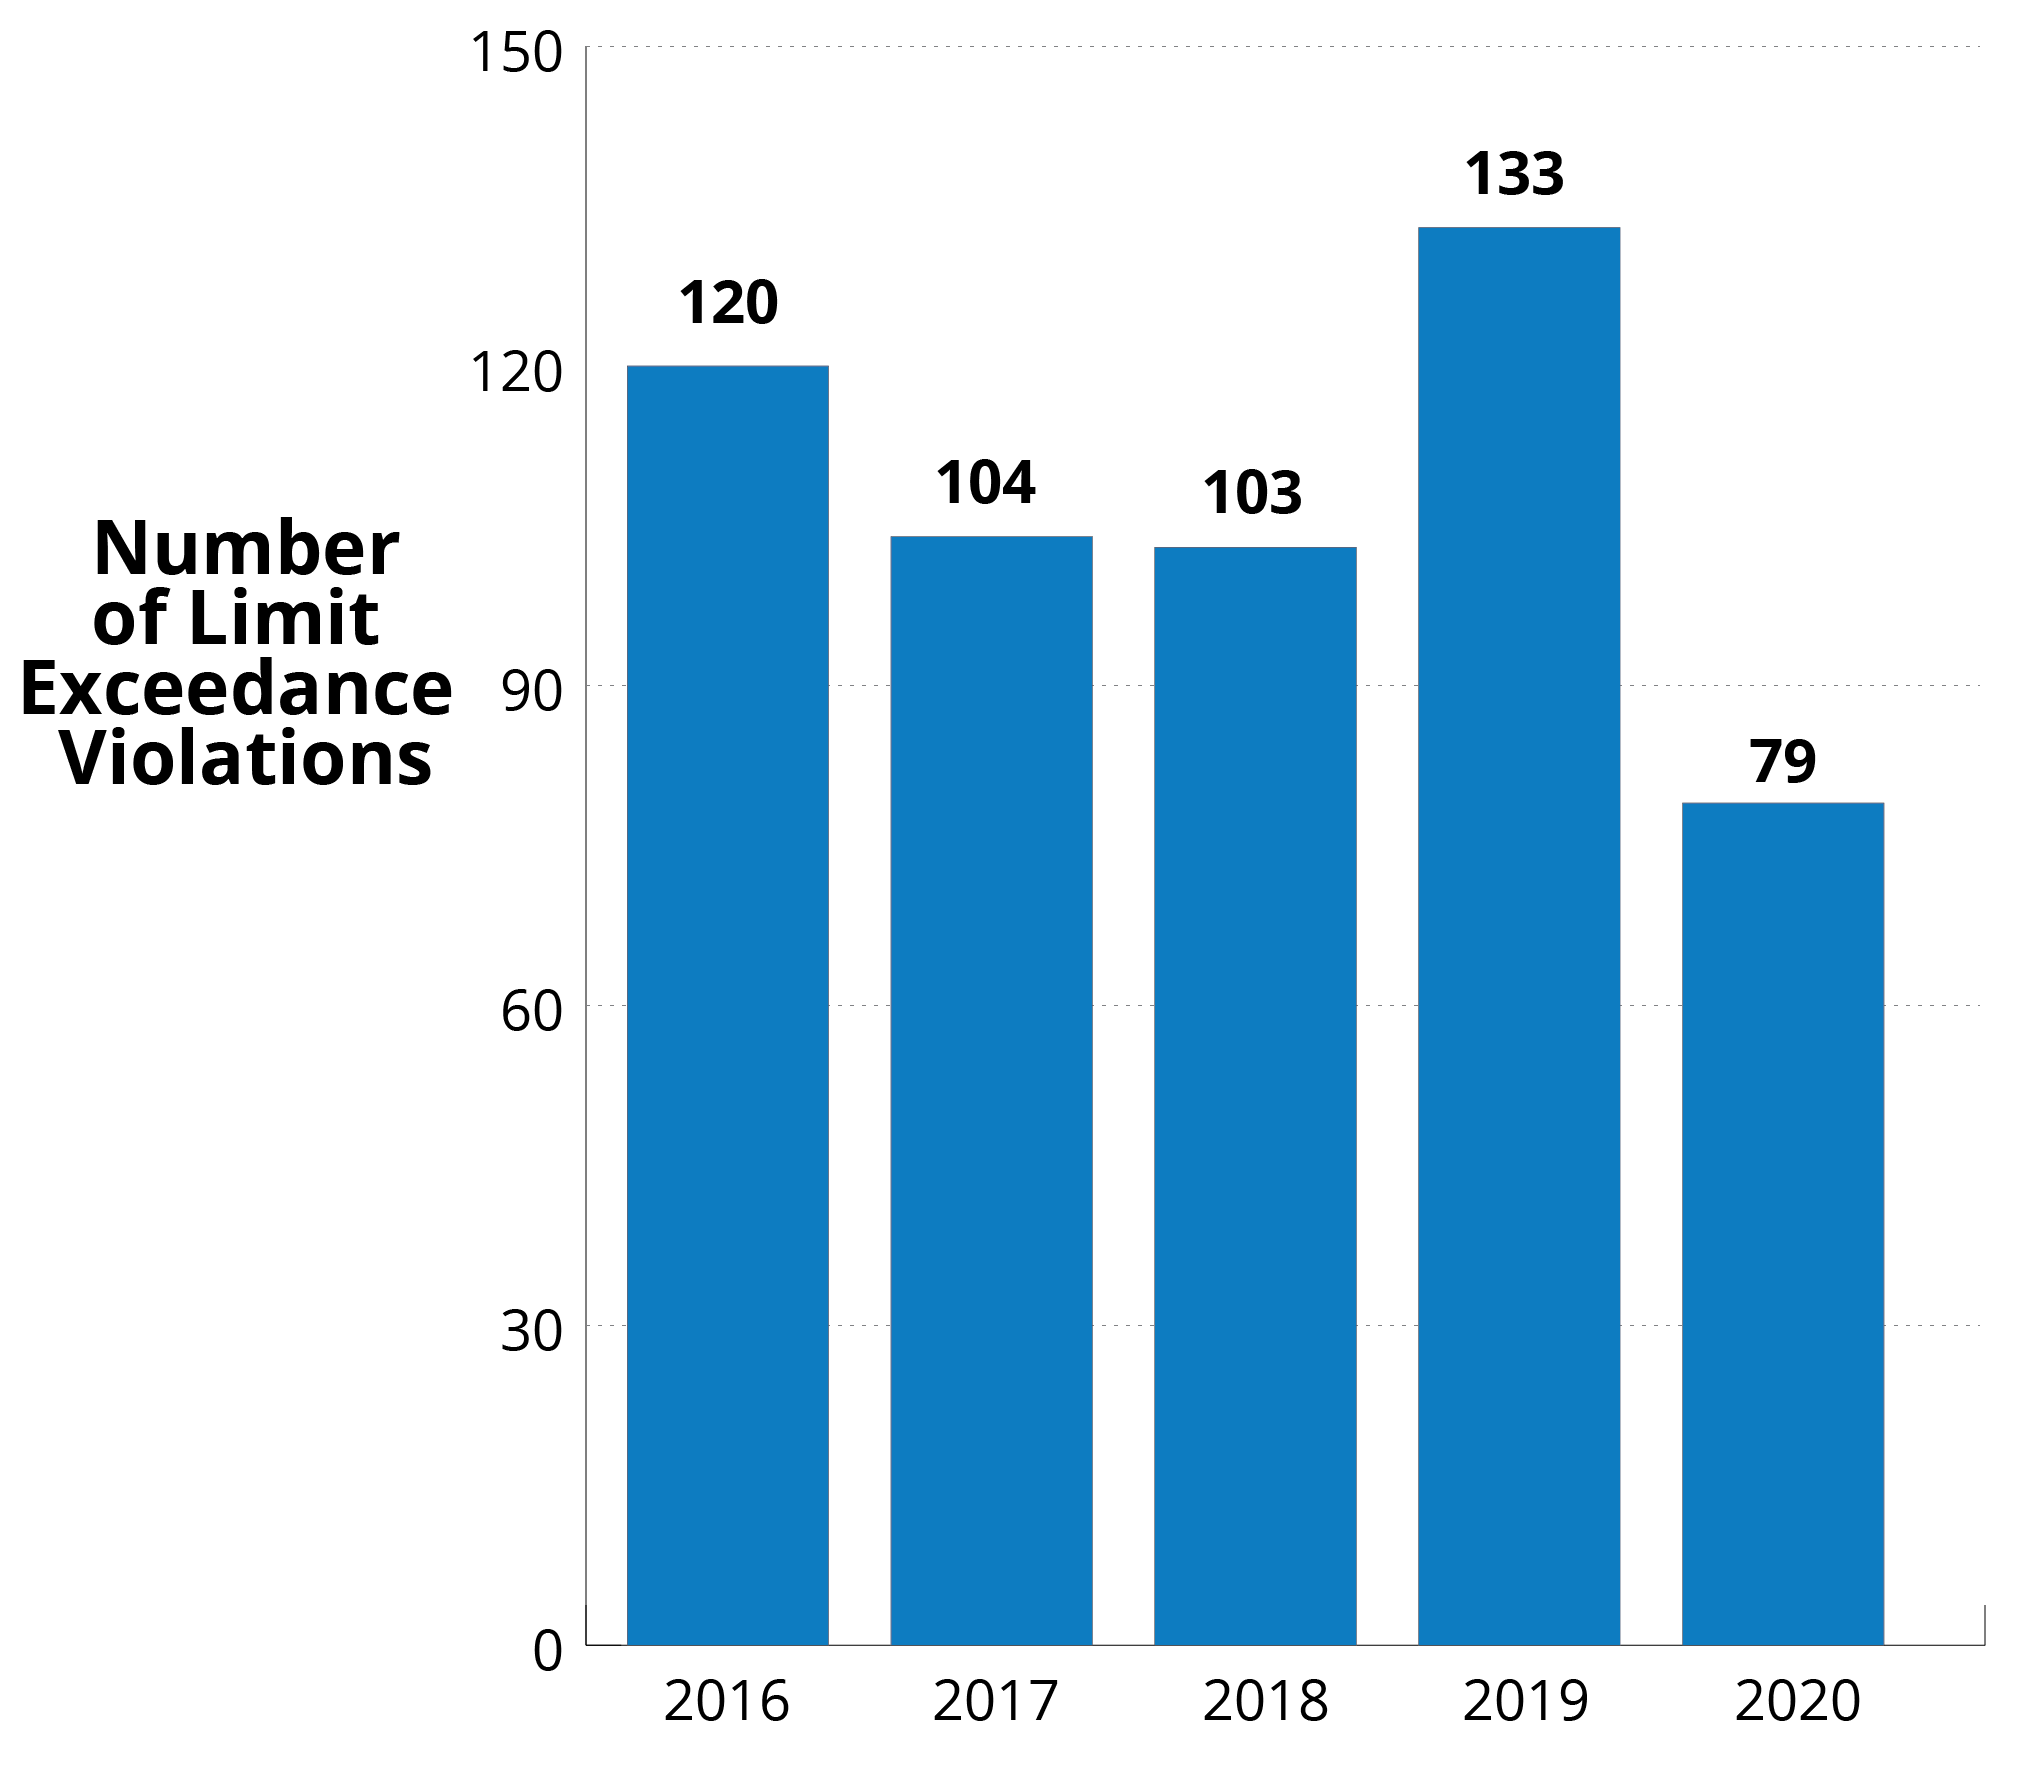
Figure 3 details the limit exceedances violations by contaminants reported by facilities from 2016 to 2020. The highest number reported was in 2019 with 133 limit exceedances. The lowest number reported was in 2020 with 79 limit exceedances.
Of the reported limit exceedance violations during 2016 to 2020, 110 were addressed using environmental penalty orders with a value of $386,066.37. Three of the limit exceedances involved a toxic substance as listed in the Environmental Penalties — Code of Toxic Substances which increased the severity (for example, gravity component) of these environmental penalty orders by a factor of 1.35. Note: 10 violations that occurred in 2020 were issued environmental penalty orders in 2021 valued at $23,027.20.
Operating parameters
There were 641 limit exceedances between 2016 and 2020 pertaining to operating parameters, such as temperature, pH, and dissolved oxygen. Five of these exceedances were addressed through environmental penalty orders with a penalty issued value of $15,667.70. Ninety-three per cent of the exceedances (593) were attributed to one facility. Provincial officer orders were used to address three incidents at two other facilities. The remaining forty-five incidents were generally short term in nature and were effectively and efficiently addressed through voluntary actions.
Acute lethality
Acute lethality is an effluent monitoring sample that fails an acute lethality test for rainbow trout or Daphnia magna (water flea). Facilities reported 101 acute lethality violations between 2016 and 2020 (Figure 4). The total number of reported acute lethality violations at regulated facilities increased slightly on average per year between 2016 to 2020 (20) and 2012 to 2015 (18).
Figure 4: Acute Lethality Violations Reported by Facilities (2016 to 2020)
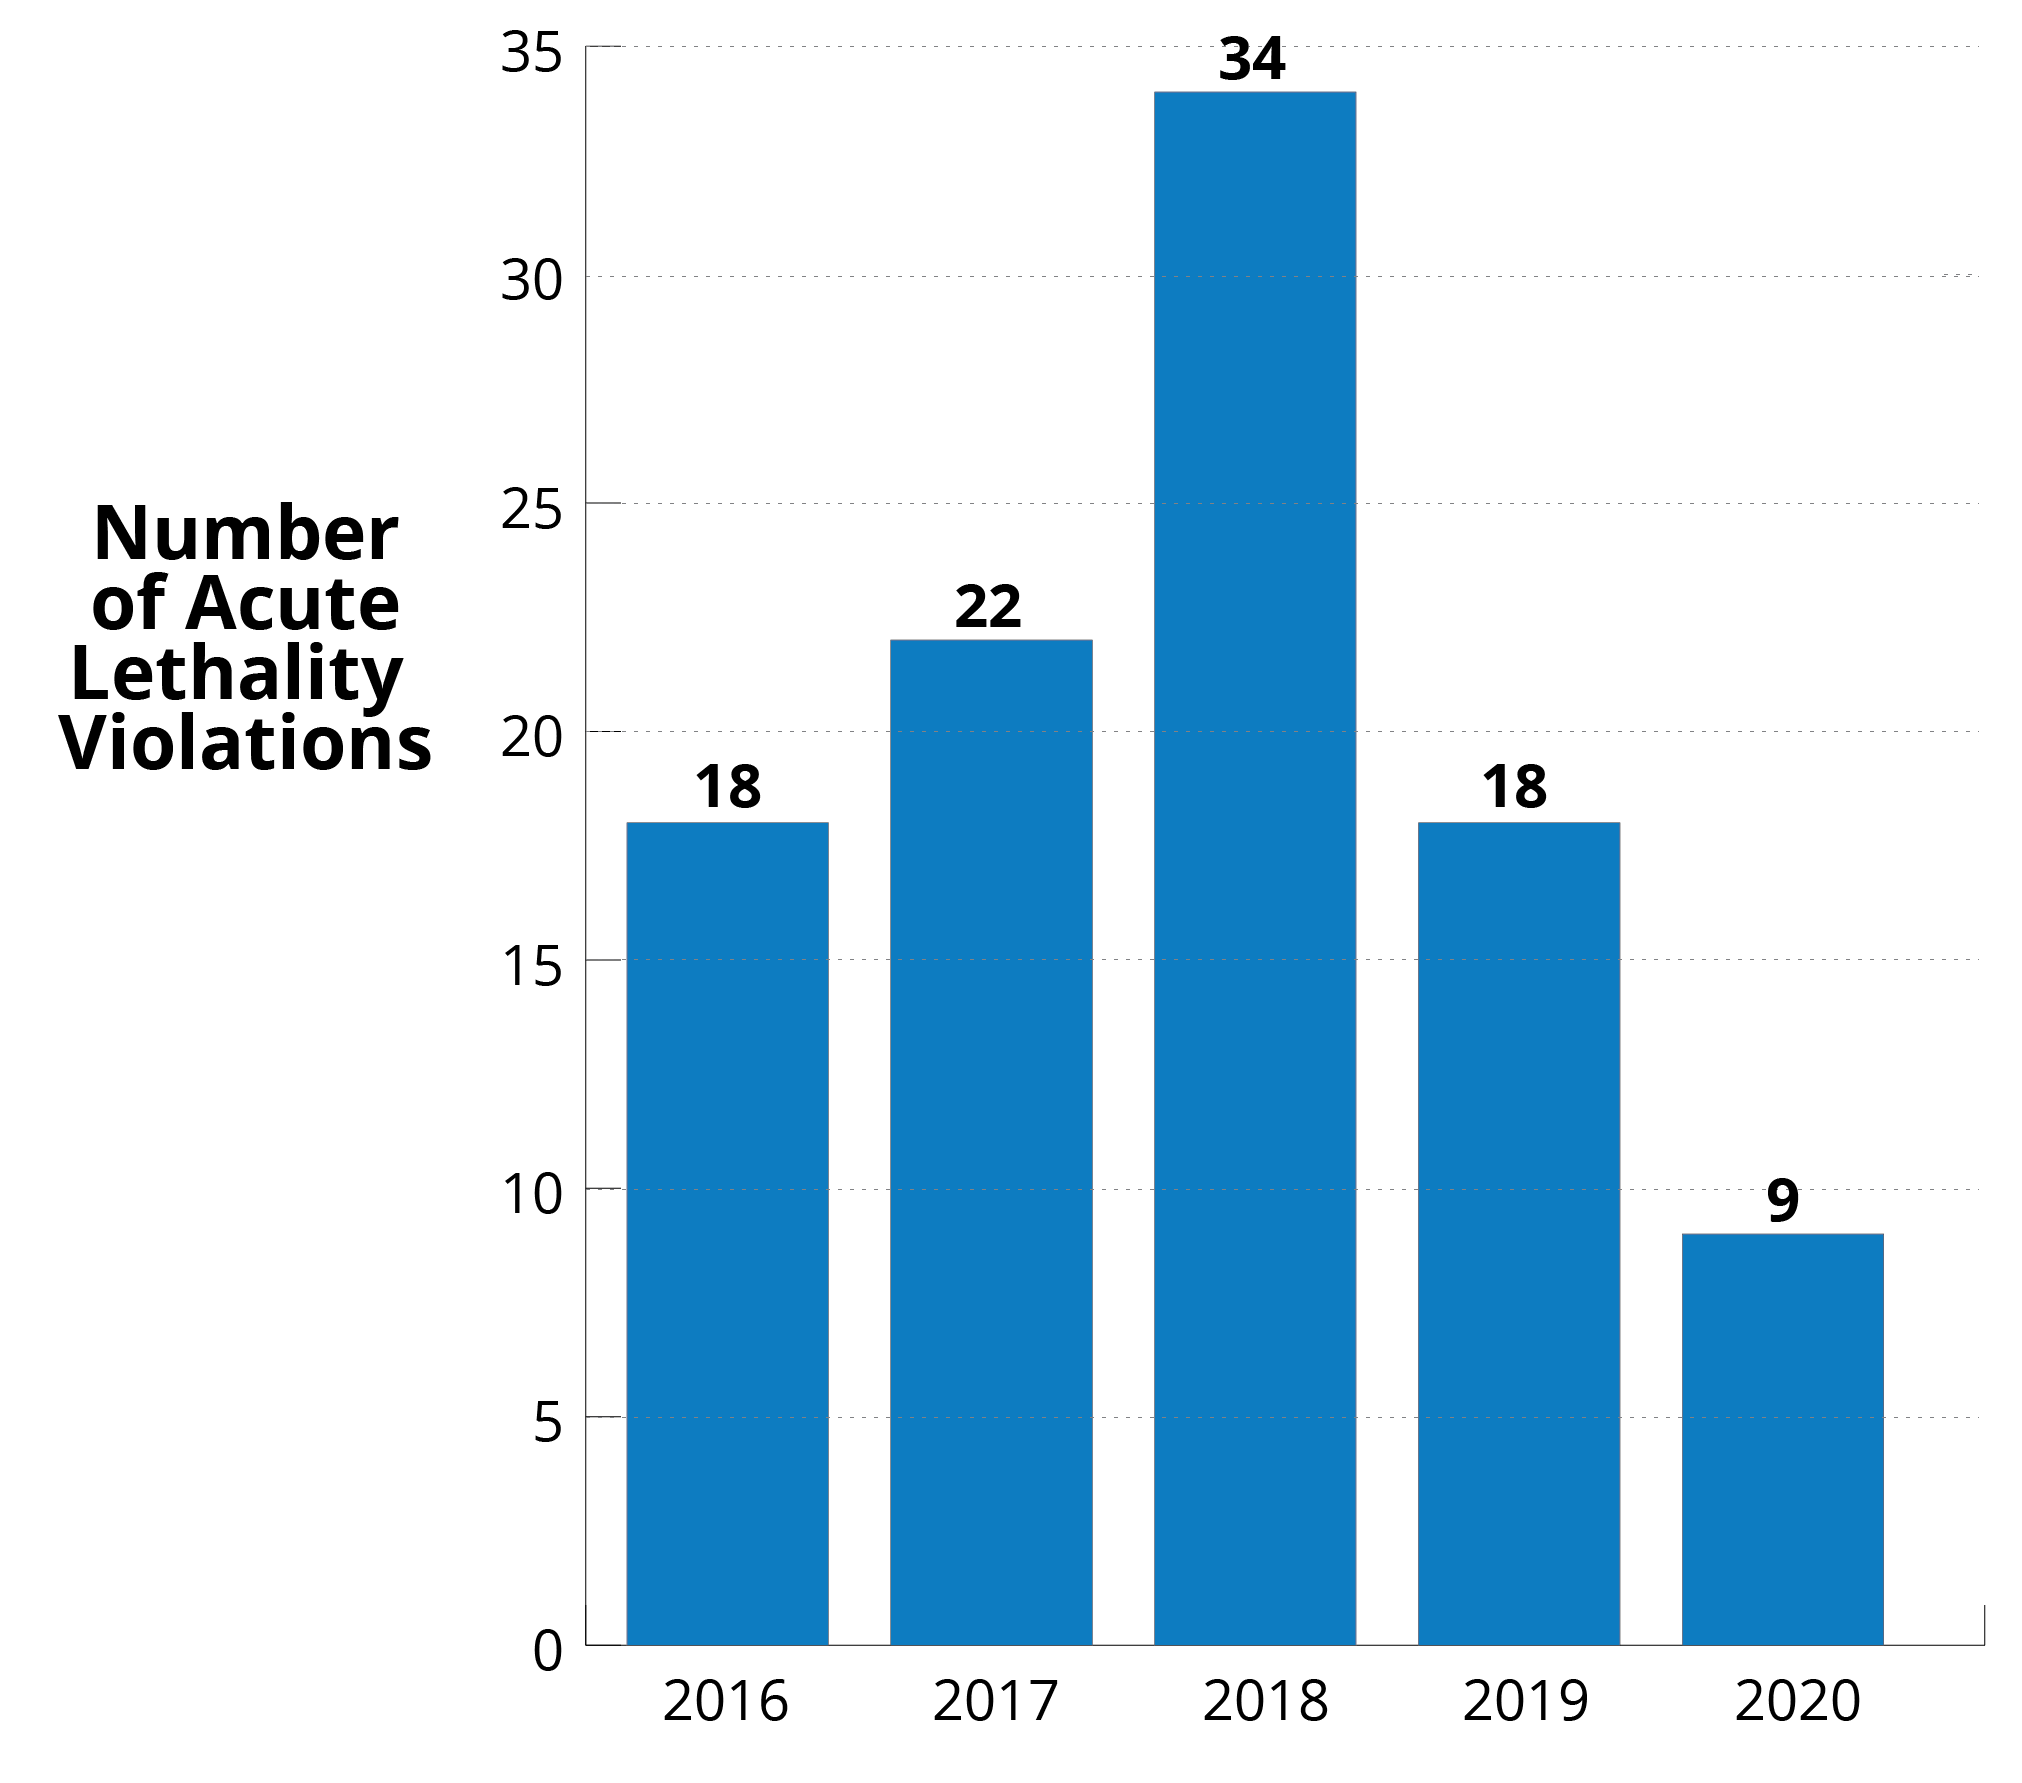
Figure 4 depicts the number of acute lethality violations reported by facilities from 2016 to 2020. The highest number reported was in 2018 with 34. The lowest number was reported in 2020 with 9.
Forty-two reported acute lethality violations, which may relate to a single event (for example, same day) or one cause (over several sampling events), were addressed through environmental penalty orders with a penalty value of $412,925.00. Four acute lethality violations that occurred in 2020 were addressed through environmental penalty orders issued in 2021 with a penalty value of $33,900.
A director’s order was also used to address 34 acute lethality violations at one facility. The remaining acute lethality violations reported by facilities were addressed through voluntary abatement plans at the facilities.
Sulphur dioxide limit exceedance
Environmental penalties issued in 2020 addressed 12 violations of the sulphur dioxide air limit exceedances in unique 24-hour periods that occurred in 2019 and 2020. The penalties were valued at $707,277.10. The introduction of environmental penalties for sulphur dioxide air limit exceedances that result from flaring events at petroleum facilities has resulted in an increase in the penalty amounts issued between the current and previous five-year review reporting period.
Note that 13 sulphur dioxide discharge limit exceedances that occurred in 2019 and 2020 were also addressed in environmental penalty orders that were issued in 2021 and valued at an additional $868,908.80.
Monitoring and reporting violations
Monitoring and reporting violations include failure to report a spill or discharge as required by legislation or failure to take a sample or calibrate equipment, as required by an environmental compliance approval or by a regulation. These types of violations interfere with the ministry’s ability to regulate discharges to the environment.
Between 2016 and 2020, 26 monitoring or reporting violations resulted in twelve environmental penalty orders. Twenty-one of the violations were related to reporting and three related to monitoring/sampling conditions. The value of monitoring and reporting violations ranged from a minimum of $700 for failing to report publicly a limit exceedance to $26,250 for a reporting requirement violation where a company did not promptly report a discharge that may impair waters (spill) to the ministry. Overall, monitoring and reporting violations totaled $129,446.25 (2016-2020).
Spills and discharges
Most spills involve an accidental, abnormal, or inadvertent release of a pollutant discharged into the natural environment from or out of a structure, vehicle, or other container. The owner of a spilled pollutant must clean up a spill and do everything practicable to prevent and eliminate the negative effects from a spill. A spill or discharge may be subject to an environmental penalty order if the spill is not reported as required, if the spill was not cleaned up as required, or causes or may cause an adverse effect or may impair the waters.
There were 1,175 spills to land and water reported by facilities subject to environmental penalties between 2016 and 2020. Most of the spills, just over 70% or 830 of the spills, were in the pulp and paper, iron and steel manufacturing and metal mining sectors. The average number of spills per year in the reporting period is 294. The largest number of spills was reported in 2020 (22 more than the average) with the lowest number reported in 2018 (106 lower than the average). (Figure 5).
Most of the spills (1,136) were assessed to have no or minor anticipated impacts. The spill clean-ups were addressed using voluntary actions that allow the owner to remedy the spill.
The ministry issued eight environmental penalty orders with a value totaling $171,225 for spills or discharges that may impair the quality of waters between 2016 and 2020 (Table 2). Four of the spills involved a toxic substance as listed in the Environmental Penalties — Code of Toxic Substances which increased the gravity component of these environmental penalty orders by a factor of 1.35.
A company who had six discharges that may impair the waters in 2020 was issued a penalty order in 2021 with a value of $130,500.
Figure 5: Number of Spills by Facilities (2016-2020)
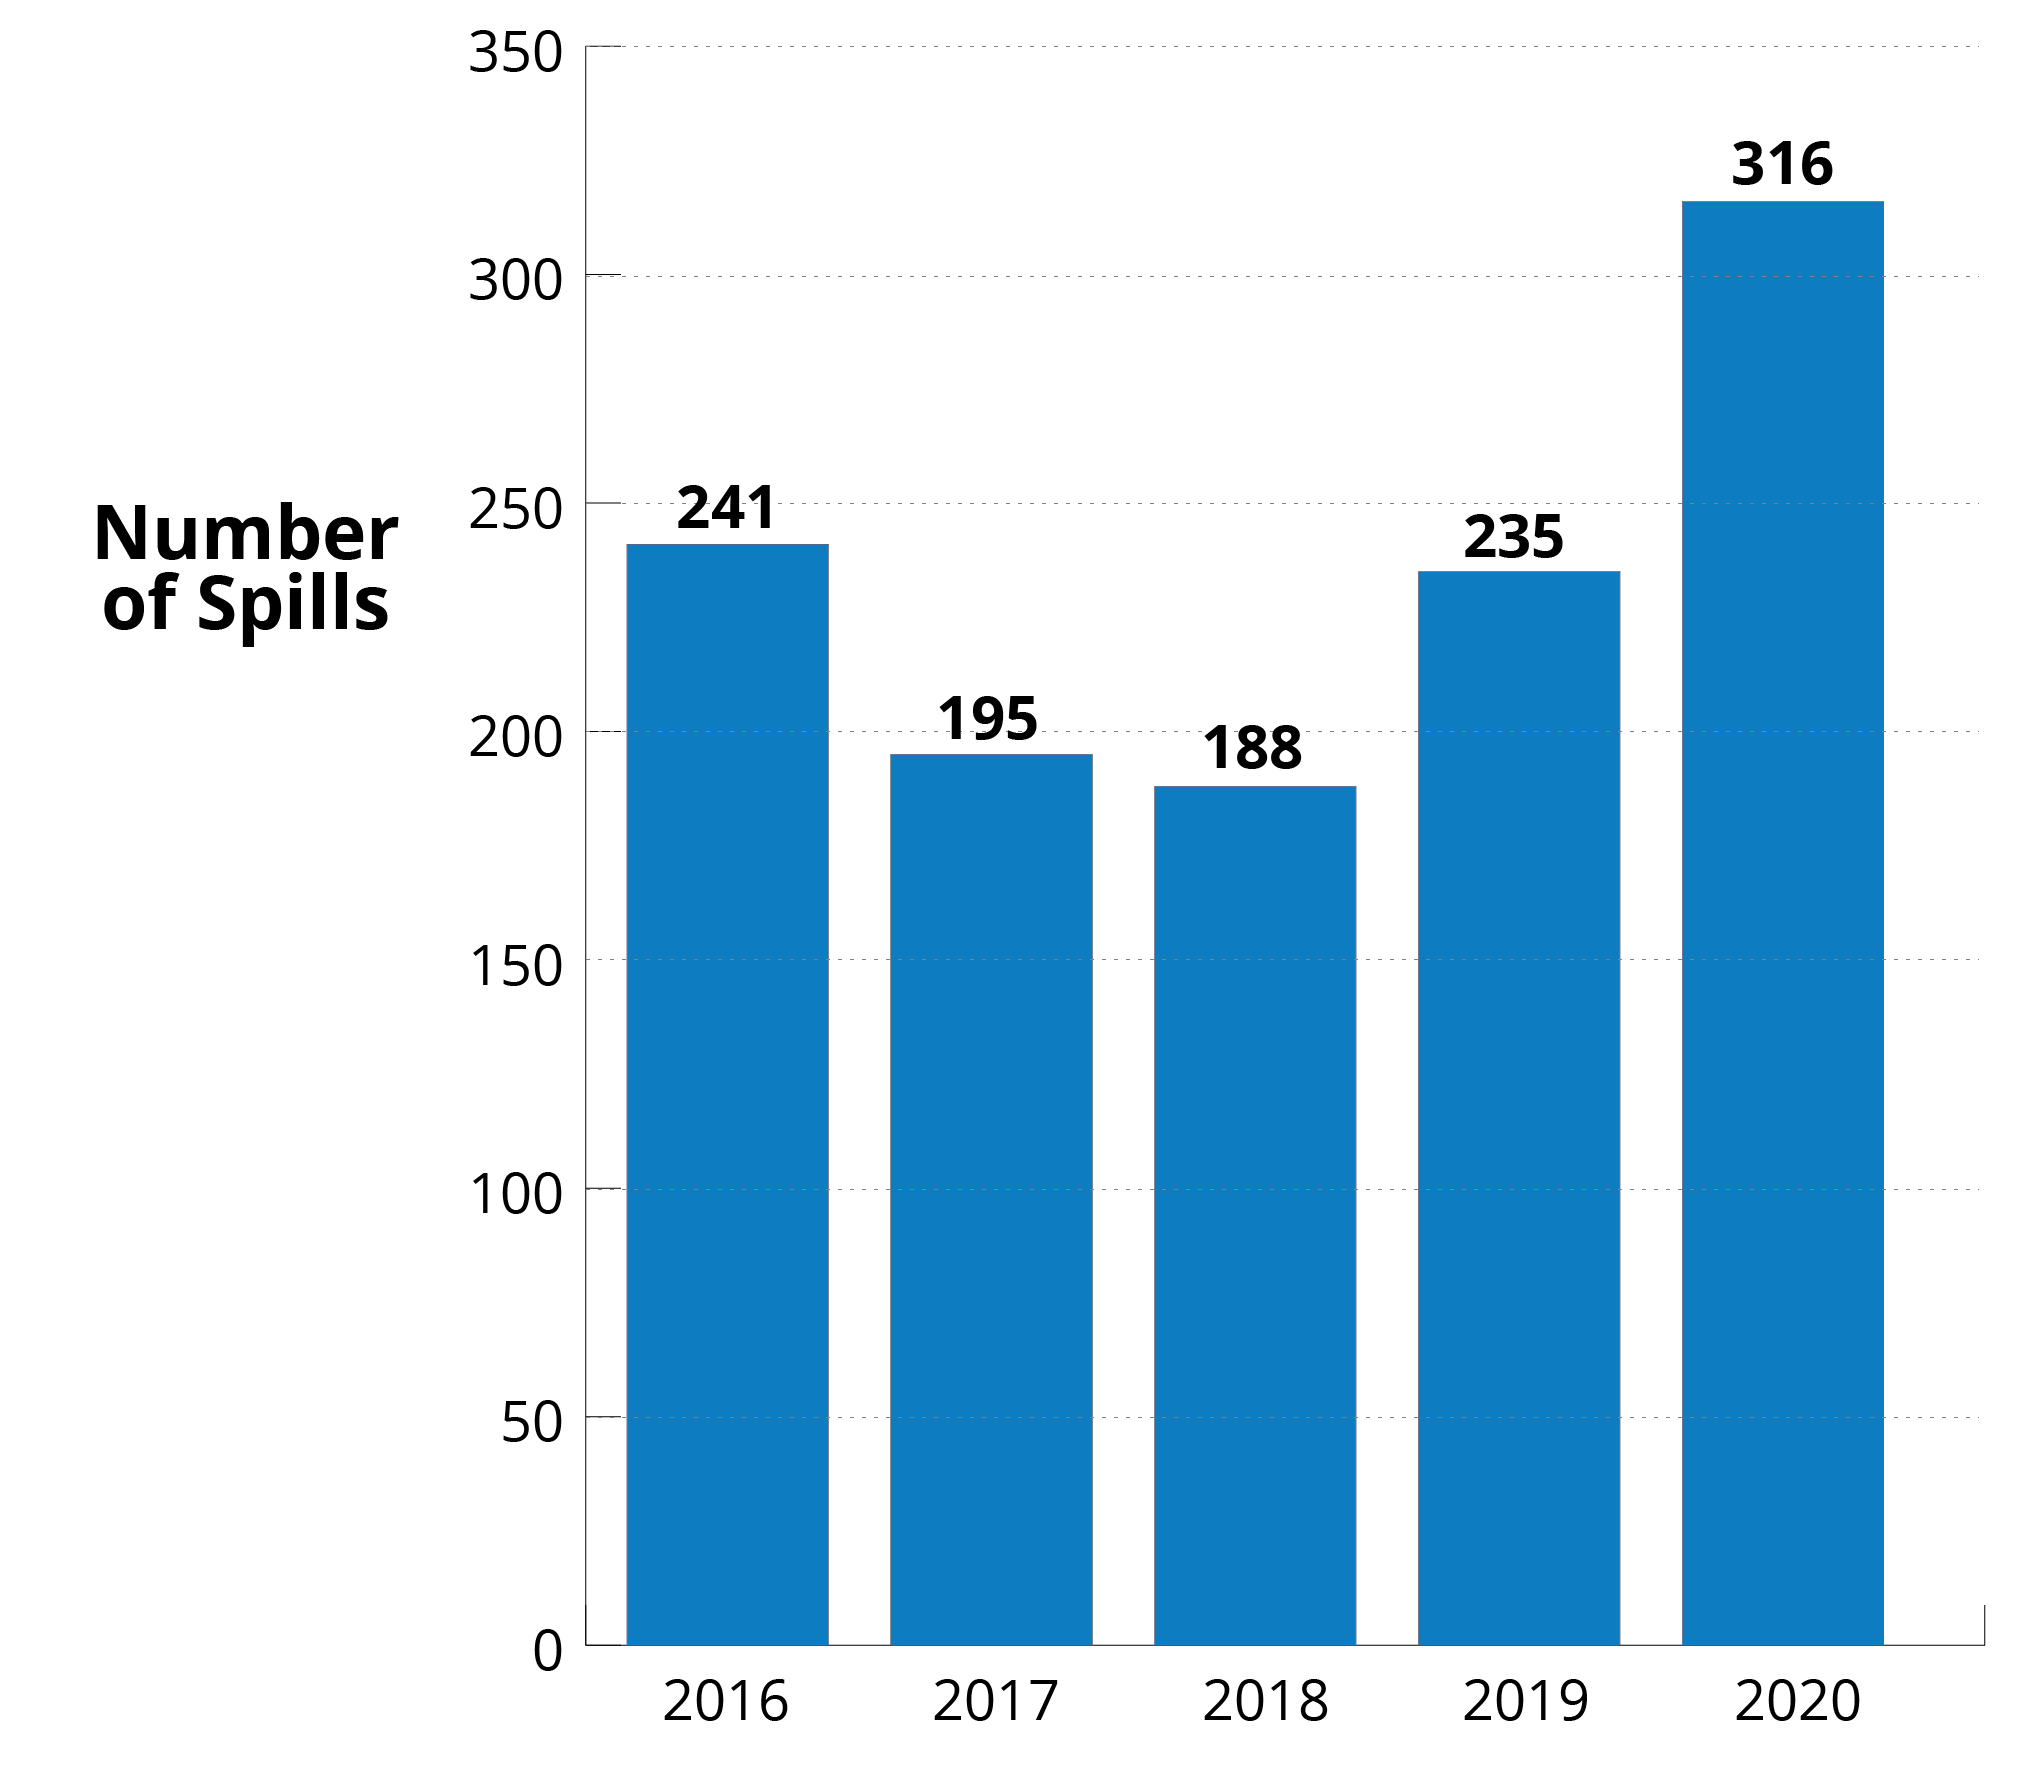
Figure 5 depicts the number of spills reported by facilities from 2016 to 2020. The highest number reported was in 2020 with 316. The lowest number was reported in 2018 with 188.
Spill prevention and contingency plan violation
An environmental penalty order was issued for $30,000 to address non-compliance with the requirements in section 91.1 of the Environmental Protection Act, whereby the company failed to develop a spill prevention and contingency plan to reduce the risk of pollutant spills and avert or correct any adverse effects from such spills.
Conclusions and recommendations
Application of environmental penalties
Environmental penalties were applied where needed to promote and achieve compliance for different types of violations, where they could be used (for example, acute lethality violation at 148 industrial facilities). Environmental penalties generally fill a gap which was not previously addressed by prosecution (for example where prosecution is not warranted, but an order is not the most effective tool). Staff feedback has indicated that environmental penalties continue to provide a quick and effective tool to address violations, where applicable (i.e., land, water and sulphur dioxide air violations at certain industrial facilities).
Monitoring and reporting on environmental penalties
The ministry reports annually to the public on environmental penalties issued in the previous calendar year.
Recommendation 1: It is recommended the ministry continue to monitor and report on the use of environmental penalties to promote consistent and effective implementation.
Environmental penalties and prosecutions
The review found that the use of environmental penalties continues to be complementary with investigations with no impact on prosecutions.
Requests for investigation and prosecutions continued, where appropriate for serious offences. There were cases where only a prosecution was pursued when a penalty could have been issued and cases where both the penalty tool and a prosecution were undertaken. In one case a business was prosecuted and convicted ($325,000 fine) for the same violation for which an environmental penalty order was issued ($36,950). There were four completed prosecutions that resulted in convictions for limit exceedance violations, altering sewage works without approval violation and spill/discharges with fines totalling $680,000.
Recommendation 2: It is recommended that the ministry continue to monitor what effect environmental penalties have on prosecutions.
Internal staff training and promotion
Training on environmental penalties is provided to all new Provincial Officers who attend the ministry’s Compliance Foundations training course. Environmental penalties are discussed during the Compliance Policy training module as an option to consider in cases of non-compliance at industrial facilities where the environmental penalty tool can be used.
Training was developed for the implementation of new sulphur dioxide penalties in July 2019. Since these penalties were introduced, the ministry has coordinated its approach with regional offices, legal, and subject matter experts to ensure the consistent application of penalties given to petroleum facilities.
The ministry provides ongoing training, resources and advice to Provincial Officers who are considering issuing environmental penalties.
Recommendation 3: It is recommended the ministry continue to engage staff in the application of environmental penalties through staff training opportunities.
Footnotes
- footnote[1] Back to paragraph In 2007, environmental penalty legislation introduced.
- footnote[2] Back to paragraph In December 2008, the scope of violations expanded to include non-compliance with monitoring and reporting requirements.
- footnote[3] Back to paragraph In 2019 environmental penalties expanded to include violations for flaring events at petroleum facilities.
- footnote[4] Back to paragraph The ministry delayed issuing penalties for violations that occurred before and during the provincial emergency (between March 16 and September 14, 2020) for the COVID‑19 pandemic.