Irrigation scheduling for tomatoes
Learn about irrigation scheduling for tomatoes using soil moisture monitoring and water budgeting. This information is for commercial tomato growers in Ontario.
ISSN 1198-712X, Published April 2008.
Introduction
Ontario produces over 98% of the total Canadian field tomato crop. Almost 90% of the Ontario crop is grown in the southern counties of Essex, Chatham-Kent and Haldimand-Norfolk. Tomatoes are the number one field vegetable (excluding potatoes) in farm value in the province, worth about $71 million in 2007. Most field tomatoes in Ontario are grown on relatively light soils, which produce earlier crops and facilitate mechanical harvesting of tomatoes grown for processing.
This factsheet provides an introduction to irrigation scheduling for tomatoes, introducing the basics of two methods of irrigation scheduling: soil moisture monitoring and water budgeting.
Transplanted field tomatoes are a long-season crop with high water requirements. An average cultivar requires about 40 cm (15.7 in.) of water over the growing season. Rainfall during the Ontario growing season is very irregular, typically ranging from 200–700 mm (7.9–27.6 in.) in total from May to September. In many years, rainfall does not supply the tomato crop with sufficient water for optimum yields. In fact, since the early 1980s, there has been a trend of decreasing precipitation during the growing season in southern Ontario.
Glossary
Available soil moisture is the amount of water a soil can hold that is accessible or available to the crop.
Evapotranspiration is the amount of water transpired by the plant and evaporated from crop and soil surfaces.
Field capacity is the amount of water held in a soil after the excess has drained by gravity following a saturating rainfall.
Permanent wilting point is the point of available soil water below which plants wilt beyond recovery.
Soil saturation is the state at which every soil pore is filled with water. Soils never stay this way for long.
The benefits of irrigation
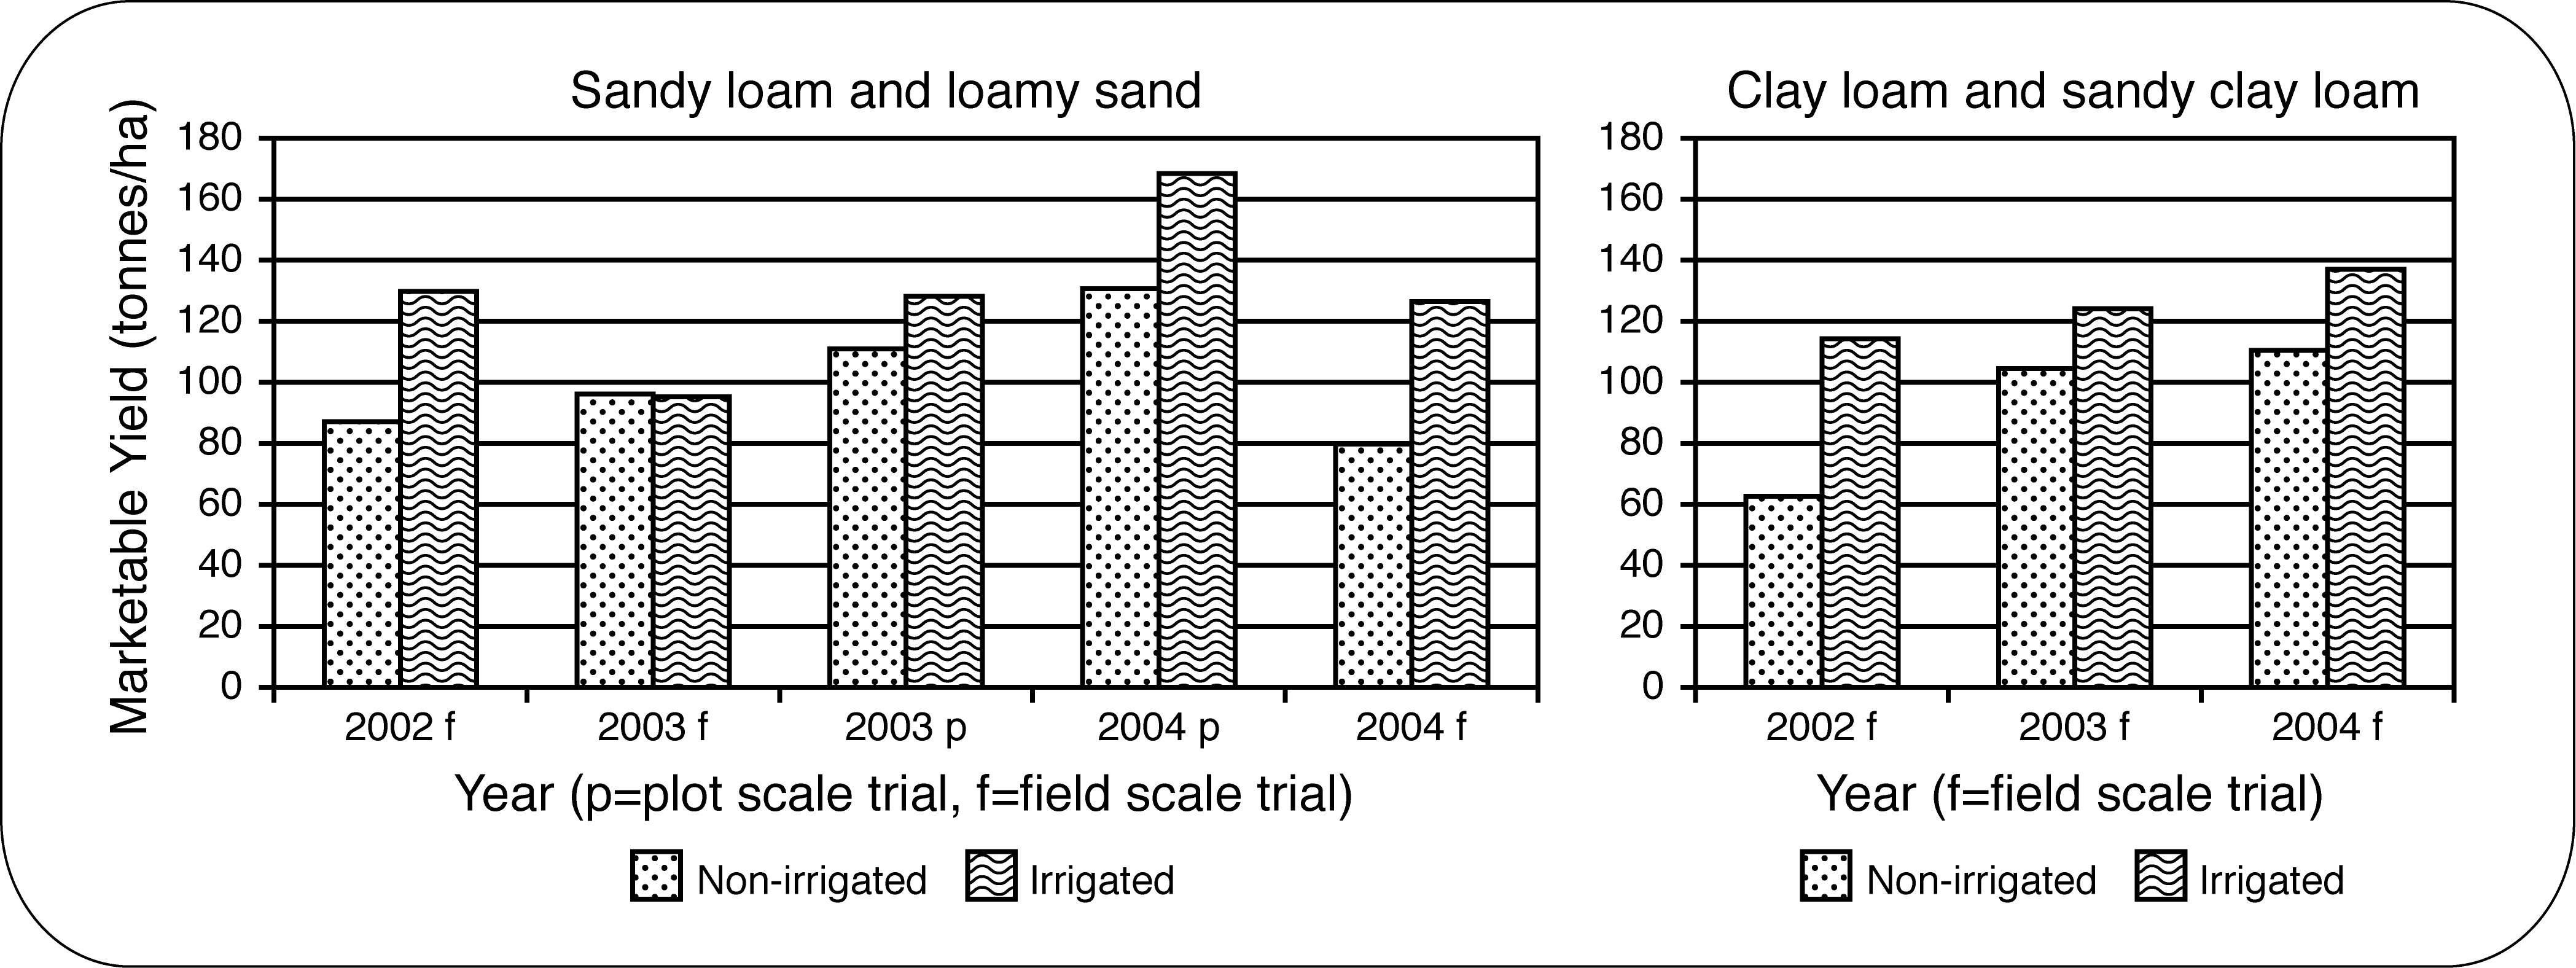
Irrigation of tomatoes can result in higher and more consistent yields, better quality, larger fruit, less blossom-end rot and less cracking. Recent research on processing tomatoes in Ontario has shown yield increases of up to 81% on a range of soil types with the use of properly scheduled irrigation. Tomato yields increased with irrigation in both wet and dry years and on sandy soils as well as on clay loams (Figure 1). On light soils, with their low water-holding capacity, the tomato crop can be very responsive to irrigation, but correct scheduling will provide maximum benefit. Proper scheduling is critical when irrigating tomatoes on heavier soils.
One consideration for tomatoes grown for paste is that solids, especially soluble solids, tend to be lower when the crop is irrigated. Figure 2 summarizes some Ontario irrigation research that examined solids.
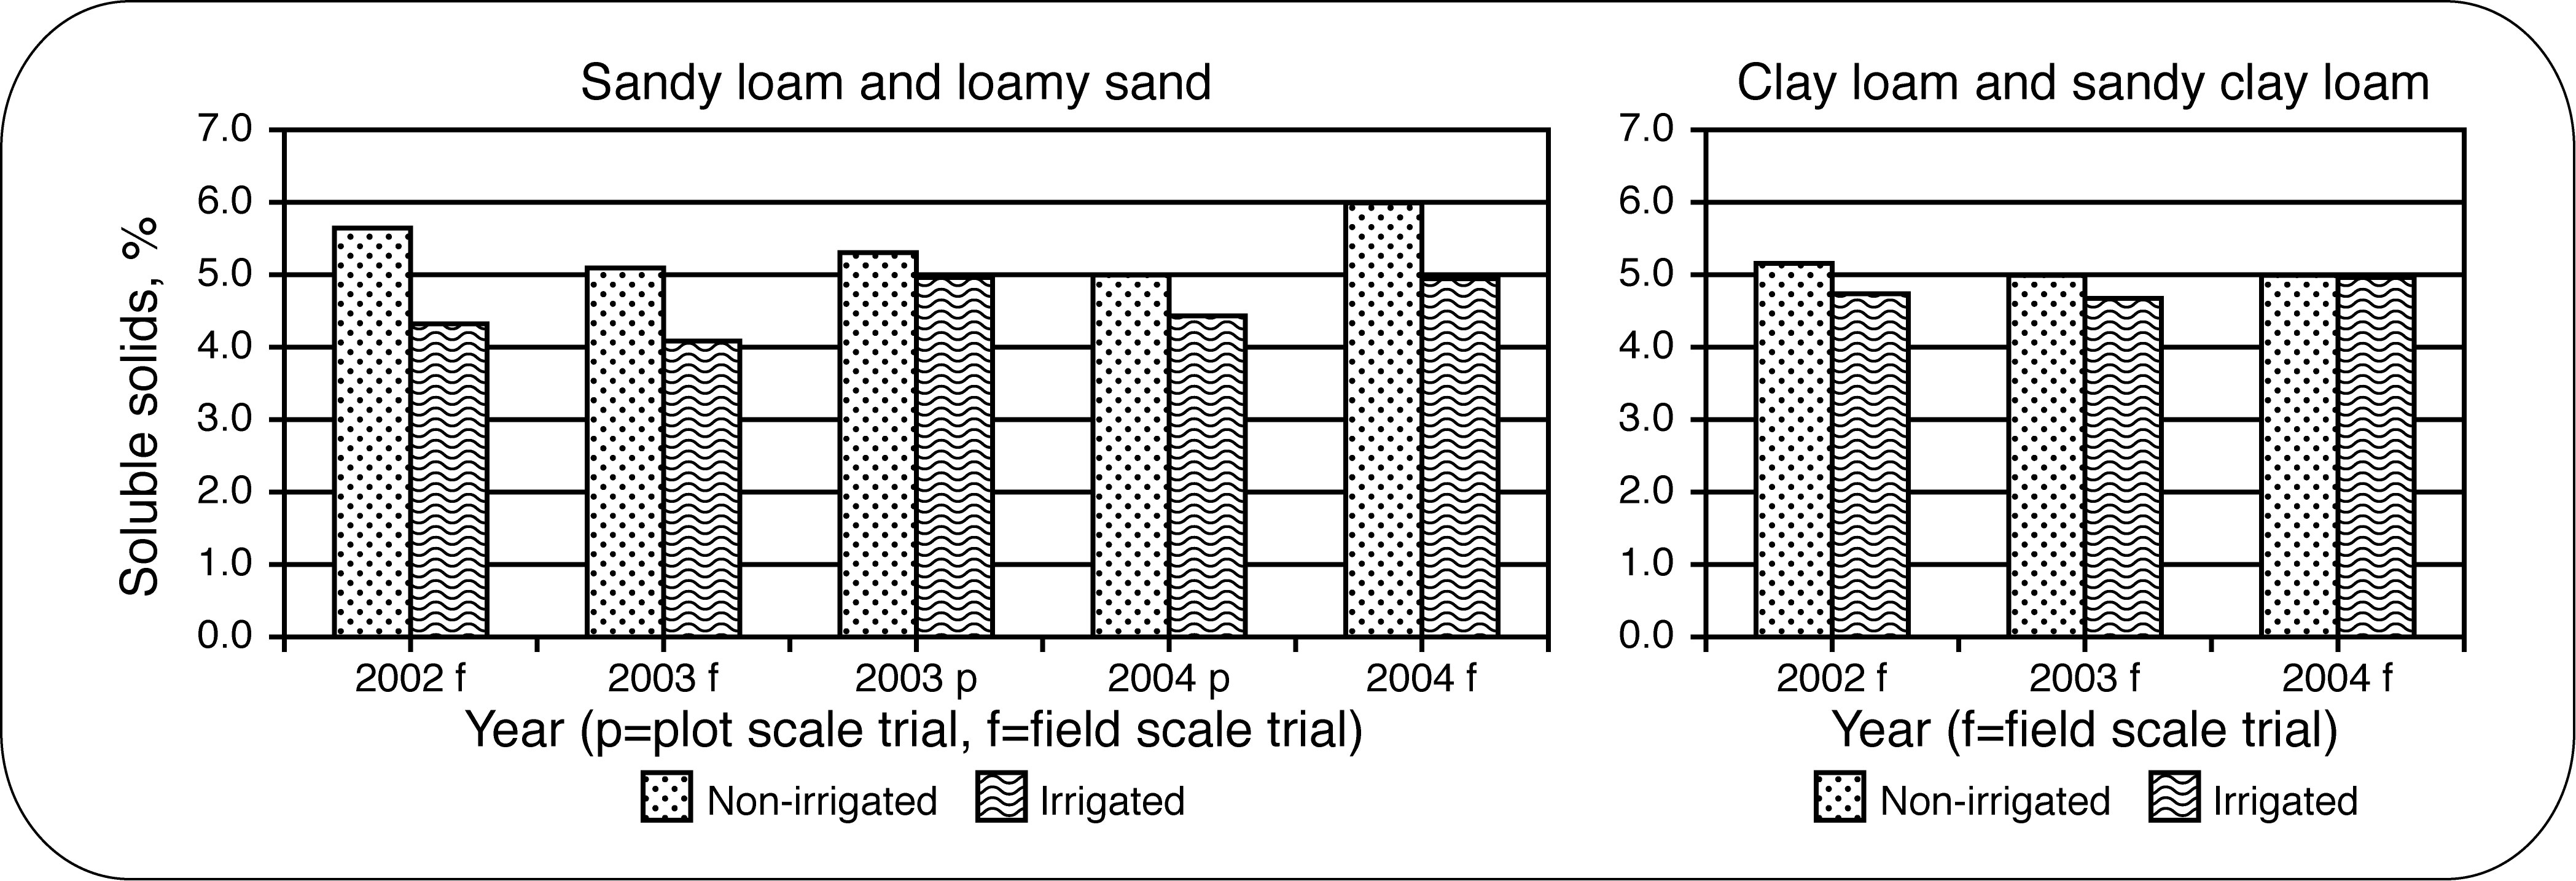
In these trials, irrigation on heavier soils did not reduce solids as much as irrigation on lighter soils. Research into deficit irrigation and early irrigation cut-off dates may result in the development of strategies to maximize fruit solids and water use efficiency under irrigated systems on both heavy and light soils.
The maximum benefit from irrigation is achieved when the proper amount of water is applied at the right time, minimizing moisture stress while avoiding overwatering.
Irrigation systems
Choosing the right irrigation system requires more than grower experience. To be most effective, your irrigation system should be designed by experts.
In Ontario, two primary methods are used for the in-field distribution of irrigation water:
- drip irrigation (also known as trickle or micro-irrigation)
- sprinkler or overhead irrigation (includes boom, centre pivot, lateral move, travelling gun systems)
The appropriate frequency of irrigation and amount of water applied are quite different between these two irrigation methods. These differences must be considered in irrigation scheduling. Each irrigation system also has inherent advantages and disadvantages (Table 1).
| Irrigation Type | Advantages | Disadvantages |
|---|---|---|
| Drip |
|
|
| Overhead systems: Centre pivot/lateral move |
|
|
| Overhead systems: Travelling boom/gun |
|
|
Determining water requirements
Crop
Tomatoes have a branching, fibrous root system, rather than one main tap root. In good soil conditions, roots will penetrate beyond 1 m (39 in.) in depth, but the majority of the active root zone in most Ontario soils is in the top 45 cm (18 in.); the greatest concentration of roots is in the upper 30 cm (12 in.).
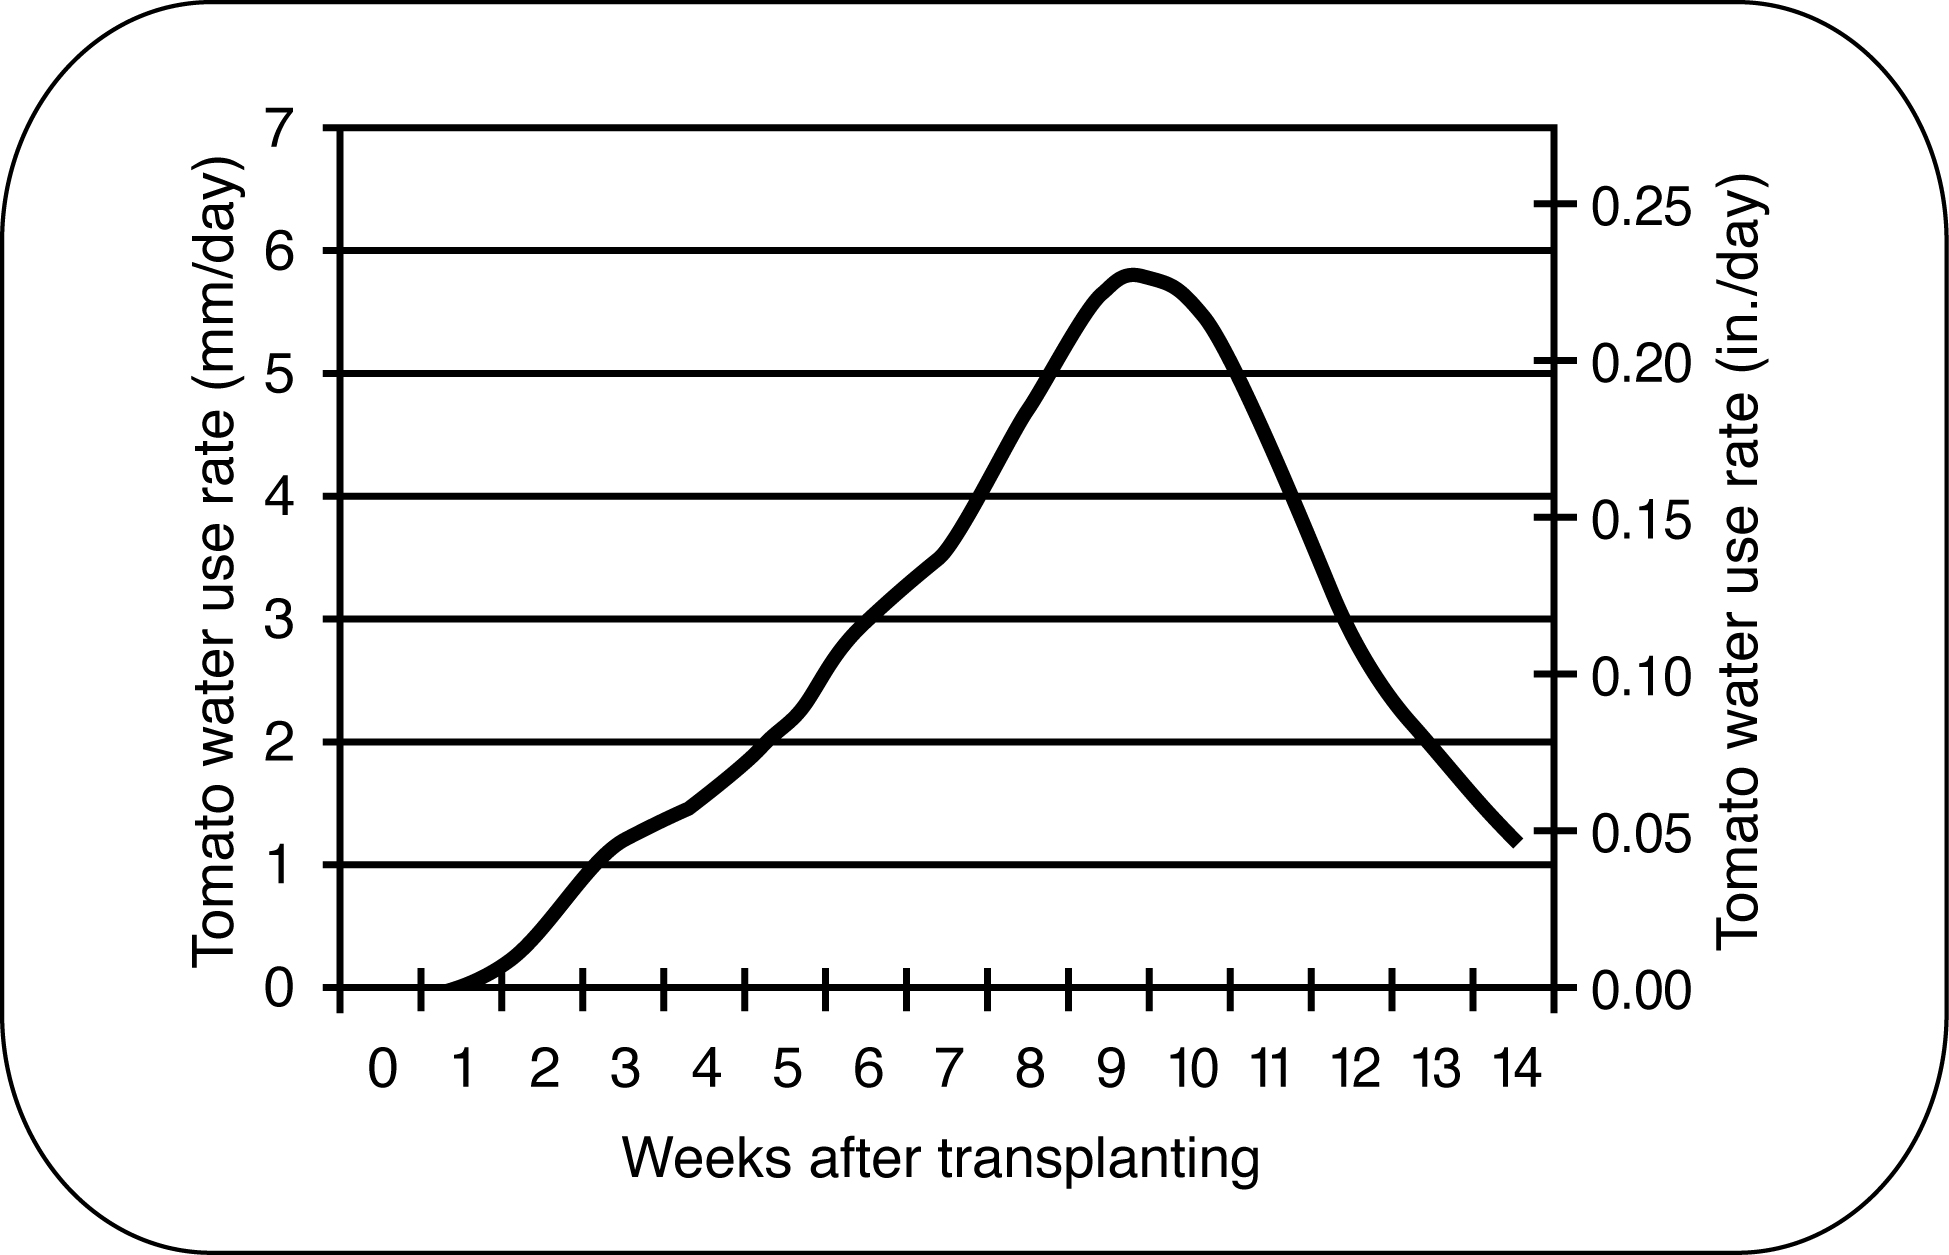
Figure 3 shows typical daily water use by irrigated tomatoes through the growing season. Crop growth stage has a dramatic impact on water uptake. The most critical periods for irrigation are during flowering, fruit set and fruit sizing. Moisture stress or irregular water supply during these growth stages can result in fewer flowers per truss, blossom and fruit drop, reduced fruit set, small fruit, blossom-end rot and fruit cracking.
Use early-season irrigation only as necessary, as it can cool the soil excessively and move fertilizer out of reach of the developing root system. Once plants are established and soil temperatures have warmed up, watering can occur more frequently, based on soil moisture measurements or meteorological data (the water budget approach).
A crop’s water requirement can be expressed as evapotranspiration (ET). This is the amount of water transpired by the plant and evaporated from the soil surface. ET may be expressed as millimetres or inches of water used per day and is affected by temperature, light intensity, wind, humidity, crop cover and crop growth stage. For optimum crop production, the water use (ET) must be replenished by irrigation or rainfall.
Caution
- Ontario research has shown that irrigation often cools the soil by 2°C–5°C, especially when irrigation water is cool or irrigation wets the soil surface (causing evaporative cooling). While this can be a benefit in the heat of the summer, be cautious about irrigating when soil temperatures are low (15°C or lower) early in the season, as it could cool the soil and retard early crop growth.
- Irrigation that results in drainage tile flow is excessive and may carry mobile nutrients such as nitrogen away from crop roots into surface water.
Soil
Soil characteristics play a major role in irrigation scheduling. Coarse-textured soils (such as sands) hold less crop-available water than fine-textured soils, such as clays. Soil texture refers to the proportion of sand, silt and clay in a soil. If the texture of a field is in question, it can best be determined through particle size distribution tests from a soil test laboratory. Hand-texturing can also be a useful technique. For more information, see OMAFRA’s Best Management Practices: Soil Management, BMP06.
Table 2 shows available soil moisture for various soil textures. The lowest moisture level at which plant roots are able to extract moisture from the soil (before they wilt beyond recovery) is called the “permanent wilting point.” The highest moisture level that a soil can hold against gravity (when the excess has drained after saturation) is called “field capacity.” Plant available soil moisture is the water available between the permanent wilting point and field capacity.
| Soil texture | cm of water per 30 cm of soil | inches of water per foot of soil |
|---|---|---|
| Sand | 1.5–2.4 | 0.60–0.96 |
| Loamy sand | 2.1–3.0 | 0.84–1.20 |
| Sandy loam | 2.7–3.6 | 1.08–1.44 |
| Loam | 3.9–5.1 | 1.56–2.04 |
| Silt loam | 4.2–5.1 | 1.68–2.04 |
| Silty clay loam | 4.5–6.0 | 1.80–2.40 |
| Clay loam | 4.5–5.4 | 1.80–2.16 |
| Clay | 4.5–5.1 | 1.80–2.04 |
Irrigation scheduling
Irrigation should provide the crop with the right amount of water, when the crop needs it, at the lowest cost and with least impact on the environment.
Irrigation scheduling is the process of determining and planning:
- when to irrigate
- how much water your crop requires
- how fast to apply water to your crop (application rate)
- how often to irrigate
Irrigation is a significant production expense. The maximum economic response to irrigation can only be achieved with a practical and effective scheduling system.
Scheduling may be done for any type of irrigation system; however, the frequency and amount of water applied will be different, depending on the type of system.
Overhead systems apply larger amounts of water less frequently. Soil moisture is allowed to deplete to a critical point (generally 50% available soil water) between irrigation applications, which allows the plant to experience some stress. When the plant experiences stress, its water use will decrease, as will the yield.
Drip irrigation makes the most effective use of irrigation water. It constantly maintains soil moisture near the optimum level (generally close to field capacity) in some portion of the root zone. Irrigation applications are frequent and small. Soil moisture decreases only slightly before the next application. Plant water use (transpiration) is kept at a maximum. Water is applied directly to the soil surface or just below the soil surface in the crop row. This greatly reduces evaporation losses compared to overhead irrigation, where water can evaporate before it reaches the crop canopy and can also be lost from the plant and soil surfaces.
Properly designed and managed drip systems also generally achieve higher water application uniformity than overhead systems, and once set up are very easy to operate. However, they do require constant maintenance (such as checking for leaks, maintaining filters, flushing). No matter the system, maximum water use efficiency can only be achieved with proper design and good irrigation scheduling.
With any irrigation system, applying too much water to the soil will result in runoff or loss of water below the root zone. Excess water can also damage crops (due to waterlogged soils, ponding), cause loss of soil nutrients (through leaching, denitrification) and increase soil erosion. With drip systems, over-application may be especially easy to overlook.
Soil moisture monitoring
Soil moisture levels can be monitored and used as the primary method of scheduling irrigation or as a periodic verification of the water budgeting method, to increase operator confidence.
The first step is to choose the allowable depletion of soil water in the root zone. For overhead irrigation, the optimal soil moisture range is usually from field capacity (100% available soil moisture) down to 50% of available soil moisture, while for drip irrigation the optimal range is from field capacity down to 90% of available soil moisture in the irrigation zone. As mentioned earlier, the soil moisture available to the crop is dependent upon soil texture. Ontario soils can be highly variable in soil texture both across the field surface and at depth.
The second step is to use a soil moisture monitoring technique to measure how much water has been depleted. There are two basic ways to monitor soil moisture and adjust irrigation frequency: by hand (known as “the feel method”) and through instruments inserted in the soil. There are advantages and disadvantages to each technique.
Table 3 compares four different methods of measuring soil moisture. Methods may be combined to form a robust scheme for soil moisture monitoring.
| Soil moisture monitoring method | Ease of use | Reliability | Soil type | Portability |
|---|---|---|---|---|
| Feel method | Best | Least | All | Very portable |
| Tensiometer | Good | Good | Most except clays | Usually not moved once installed for the season |
| Electrical resistance block | Best | Good | Most except clays | Usually not moved once installed for the season |
| Time domain reflectometer (TDR), Frequency domain reflectometer (FDR), capacitance probe, neutron meter | Least to Best | Best | All | Some models very portable |
Many soil moisture monitoring instruments give readings of soil water tension (kilopascals or centibars). Figure 4 shows the level of available soil moisture based on the soil water tension for a range of soil textures. When the soil moisture in the root zone is approaching the allowable depletion level (50% for overhead, 10% for drip), an irrigation event is triggered.
To determine your available soil moisture, look up your soil texture and soil tension reading on Figure 4.
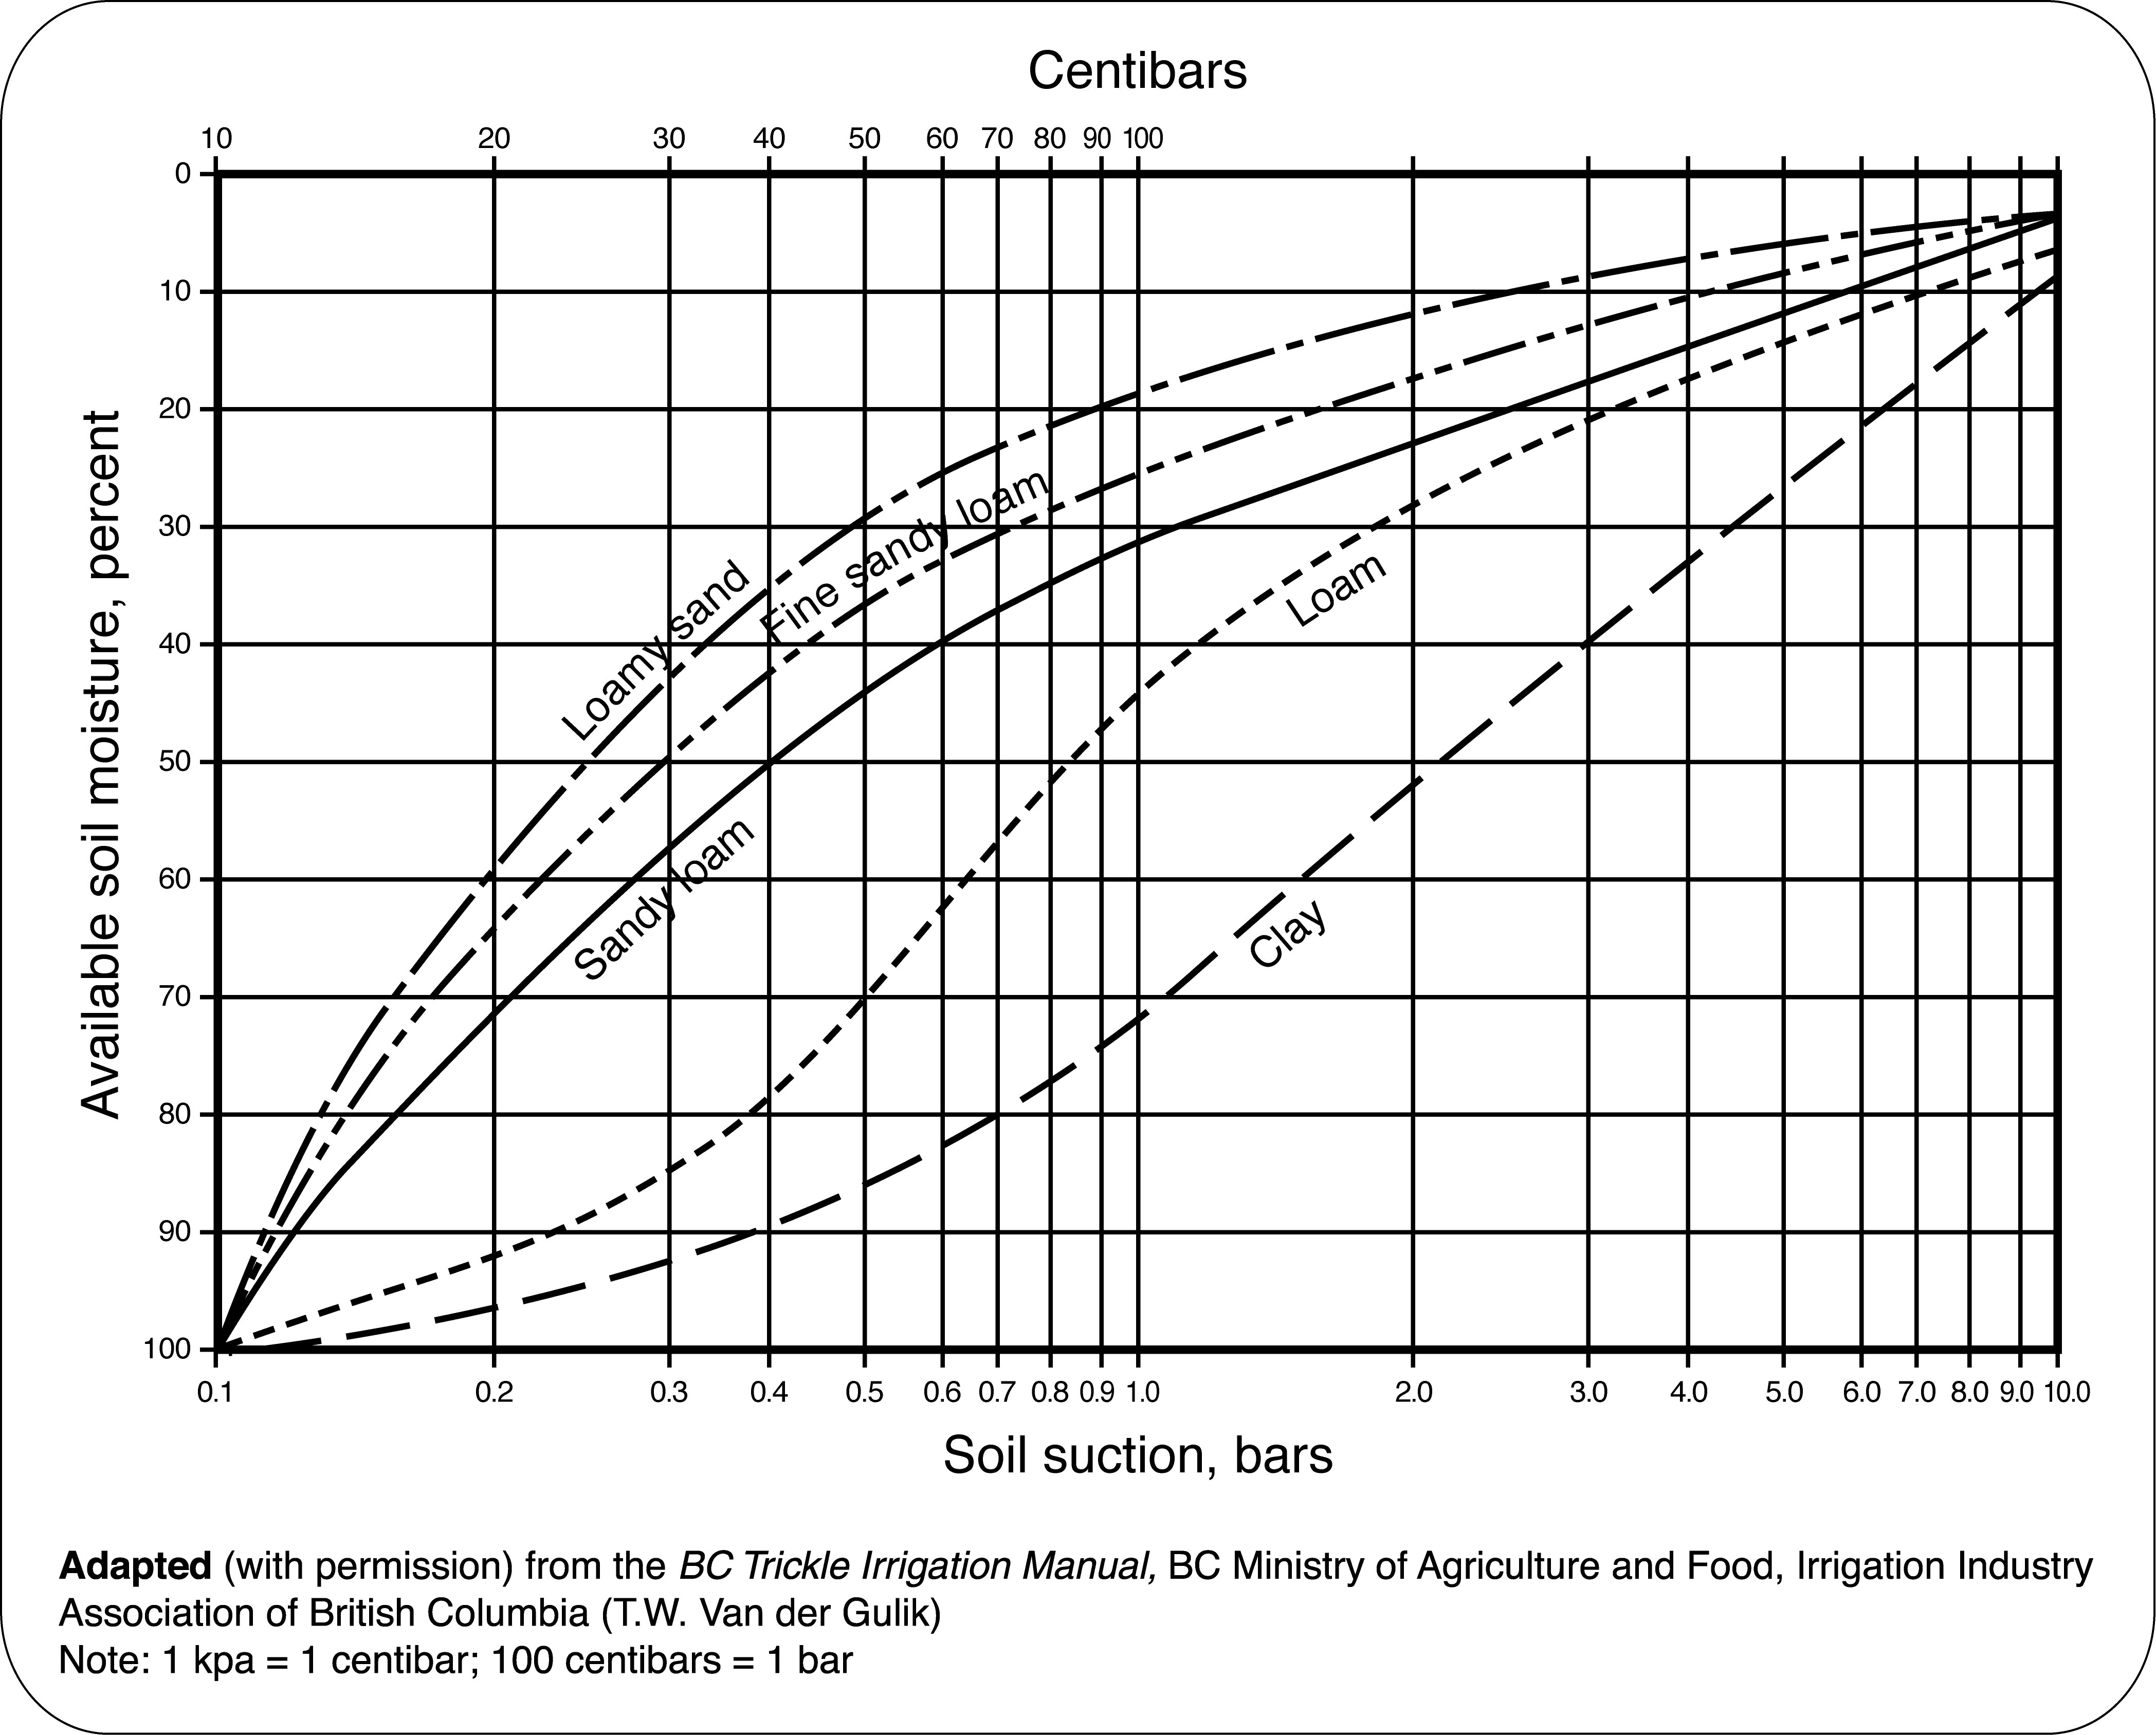
Example: A sandy loam soil would be at 90% available soil moisture at a soil moisture tension of 13 centibars and at 50% available soil moisture at a soil moisture tension of 40 centibars.
For more information on the soil moisture monitoring approach to irrigation scheduling and how to calculate irrigation amount and duration, see OMAFRA’s Best Management Practices: Irrigation Management, BMP08.
Water budget
As the name suggests, a water budget is used to track water entering and leaving the system. In a water budget, the crop root zone is visualized as a reservoir of available water. Two things add to the reservoir: rainfall and irrigation. Water is removed from the reservoir through crop water consumption. The grower manages the water budget like a bank account. Irrigation and rainfall are deposits to the account, and daily crop water use is a withdrawal from the account. Available soil moisture stored in the root zone represents the balance in the account.
Determine your starting points
Water budget calculations are easy to do on a computer spreadsheet or on paper. You will need the following information:
Maximum available soil water: (the “balance” can never be higher than this)
Estimate the maximum amount of available water in the tomato root zone. Table 2 gives available water capacity for a range of soil textures. Multiply the available water capacity (in inches or centimetres) by the rooting depth (in the same units) to get the maximum total available water. A depth of 45 cm (18 in.) is typically used for tomato. This captures most of the active root zone of the crop.
Starting moisture level
Determine the starting moisture level in the root zone. An ideal time to start water budget calculations is after a saturating rainfall, which brings the soil to field capacity. If this is not possible, use the feel method or soil moisture monitoring instrument (described above) to determine the starting moisture level.
Allowable depletion of soil water
When this level is reached, an irrigation is triggered
Choose the allowable depletion of soil water. Again, for overhead irrigation, the optimal soil moisture range is from field capacity down to 50% available soil moisture, and for drip irrigation, the optimal range is from field capacity down to 90% of available soil moisture.
With this information, you can start the water budget.
Subtract daily water use
Each day, measure or calculate how much water is being removed from the soil. The daily water use can be calculated by multiplying the maximum evapotranspiration rate (ET) by a crop coefficient representing the percent crop cover (which reflects the growth stage and growth rate of the crop at that moment). See Table 4 for crop coefficients for tomatoes. ET can be measured with instruments on-site, calculated from climatic data or estimated from a table of historical average ET values (see Table 5).
| From transplanting to early bloom | 0.4 |
|---|---|
| From early bloom to maximum row fill | 0.7 |
| From maximum row fill to harvest | 1.0 |
| Week of: | Windsor | Ridgetown | Simcoe | Toronto | Trenton |
|---|---|---|---|---|---|
| May 7 | 2.1 | 2.2 | 2.8 | 2.3 | 2.1 |
| May 14 | 3.5 | 3.7 | 3.7 | 3.6 | 3.5 |
| May 21 | 3.6 | 3.8 | 4.6 | 3.9 | 3.6 |
| May 28 | 4.1 | 4.0 | 4.9 | 3.8 | 3.3 |
| June 4 | 4.2 | 4.3 | 4.8 | 4.3 | 4.3 |
| June 11 | 4.3 | 4.2 | 5.2 | 4.2 | 4.1 |
| June 18 | 4.2 | 4.3 | 5.4 | 4.4 | 4.0 |
| June 25 | 4.9 | 4.7 | 5.5 | 4.6 | 4.8 |
| July 2 | 4.6 | 4.7 | 5.3 | 4.5 | 4.5 |
| July 9 | 5.4 | 5.2 | 5.5 | 4.9 | 5.1 |
| July 16 | 4.9 | 4.9 | 5.0 | 4.7 | 4.4 |
| July 23 | 4.7 | 4.6 | 5.6 | 4.8 | 4.5 |
| July 30 | 4.8 | 4.2 | 5.1 | 3.9 | 4.2 |
| Aug 6 | 4.8 | 4.7 | 4.6 | 4.5 | 4.1 |
| Aug 13 | 3.6 | 3.8 | 4.5 | 3.6 | 3.3 |
| Aug 20 | 3.4 | 3.0 | 3.5 | 3.2 | 3.4 |
| Aug 27 | 3.5 | 3.3 | 4.3 | 3.4 | 3.0 |
| Sept 3 | 3.5 | 3.2 | 4.5 | 3.3 | 3.2 |
| Sept 10 | 3.3 | 3.4 | 3.9 | 3.0 | 2.6 |
| Sept 17 | 2.4 | 2.4 | 3.0 | 2.7 | 1.7 |
| Sept 24 | 2.3 | 2.4 | 2.9 | 1.6 | 1.7 |
For historical average ET values for a number of other locations in Ontario, see OMAFRA’s Best Management Practices: Irrigation Management, BMP08.
Add daily rainfall
Rainfall measurements should be taken near the irrigated fields, since rainfall is highly variable. Keep in mind that a gentle rainfall over a long duration will soak in and replenish soil moisture, while a heavy rainfall of short duration may run off rather than soak into the soil. Ignore rainfall amounts of less than 0.5 cm (0.2 in.). For heavy rains, multiply the rainfall amount by 0.75 before adding it to the water budget, as the “effective rainfall” (that moves into the soil for the plant to use) is usually less than the total rainfall.
Schedule an irrigation
When the allowable soil water depletion level is reached, schedule an irrigation to bring available soil moisture back to 100%. At this point, the “balance” on the water budget is reset to the maximum available soil moisture.
Weather forecasts must be watched closely so that irrigation can be stopped before an impending storm. Significant rainfall after an irrigation event can result in excess soil moisture and crop damage.
For more detail on the water budget approach to irrigation scheduling and how to calculate irrigation amount and duration, see OMAFRA’s Best Management Practices: Irrigation Management, BMP08.
This fact sheet was authored by Janice LeBoeuf, vegetable crop specialist, OMAFRA, Rebecca Shortt, water quality engineer, OMAFRA, Dr. Chin Tan, researcher, Agriculture & Agri-Food Canada and Anne Verhallen, soil management specialist – horticulture, OMAFRA.
Footnotes
- footnote[1] Back to paragraph Tan, C.S., Zhang, T.Q., Reynolds, W.D., Drury, C.F., and Liptay, A. 2002. Farm-scale processing tomato production using surface and sub-surface drip irrigation and fertigation. Ontario Processing Vegetable Growers 59th Annual Report. OPVG, London, Ontario. pp. 1–22.
- footnote[2] Back to paragraph Tan, C.S., Zhang, T.Q., Reynolds, W.D., Drury, C.F., and Warner, J. 2003. Farm-scale processing tomato production using surface and subsurface drip irrigation and fertigation. Ontario Processing Vegetable Growers 60th Annual Report. OPVG, London, Ontario. pp. 1–21.
- footnote[3] Back to paragraph Warner, J., Tan, C., and Zhang, T. 2003. Drip irrigation water management strategies to enhance processing tomato fruit solids, quality and yield. Ontario Processing Vegetable Growers 60th Annual Report. OPVG, London, Ontario. pp. 27–32.
- footnote[4] Back to paragraph Warner, J., Tan, C., and Zhang, T. 2004. Drip irrigation water management strategies to enhance processing tomato fruit solids, quality and yield. Ontario Processing Vegetable Growers 61st Annual Report. OPVG, London Ontario.
- footnote[5] Back to paragraph Tan, C.S., Zhang, T.Q., Reynolds, W.D., Warner, J., and Drury, C.F. 2004. Farm-scale processing tomato production using surface and subsurface drip irrigation and fertigation. Ontario Processing Vegetable Growers 61st Annual Report. OPVG, London Ontario.
- footnote[6] Back to paragraph Tan, C.S. 1990. Irrigation scheduling for tomatoes: Water budget approach. Ontario Ministry of Agriculture and Food (online).
- footnote[7] Back to paragraph OMAFRA and Agriculture and Agri-Food Canada. 2004. Best management practices: Irrigation management. Order No. BMP 08.
- footnote[8] Back to paragraph Van der Gulik, T. 1999. B.C. Trickle Irrigation Manual. B.C. Ministry of Agriculture and Food.