Managing silage effluent
Learn about two stewardship options to manage silage effluent and prevent it from directly impacting the quality of adjacent surface water. This technical information is for Ontario producers.
ISSN 1198-712X, Published June 2020
Introduction
Using bunker silos to store large volumes of silage has become popular. However, these structures present an environmental risk because their large surface area, impermeable surface and exposure to precipitation result in runoff being produced. The environmental risk can be lessened by incorporating some design features to address runoff volume and the discharge location. This factsheet outlines two stewardship options to manage silage effluent and prevent it from directly impacting the quality of adjacent surface water.
Why you should be concerned about seepage
The main concern is the direct release of this material to surface water such as creeks or municipal drains via ditches, catch basins or through tile drains. Due to its nutrient content and high biological oxygen demand (BOD), this effluent is extremely dangerous to fish. There have been reported fish kills in Ontario caused by the release of silage effluent into surface water. Unfortunately, bunker silo design has given little consideration to effluent management.
What is silage effluent
It is a corrosive, high‑nutrient liquid material that is produced from the ensilage of low-dry-matter plant materials such as corn or forages (Figure 1). Field crops are typically harvested prior to reaching their ideal moisture level so they are prone to leaching excess liquids when compacted in the silo.
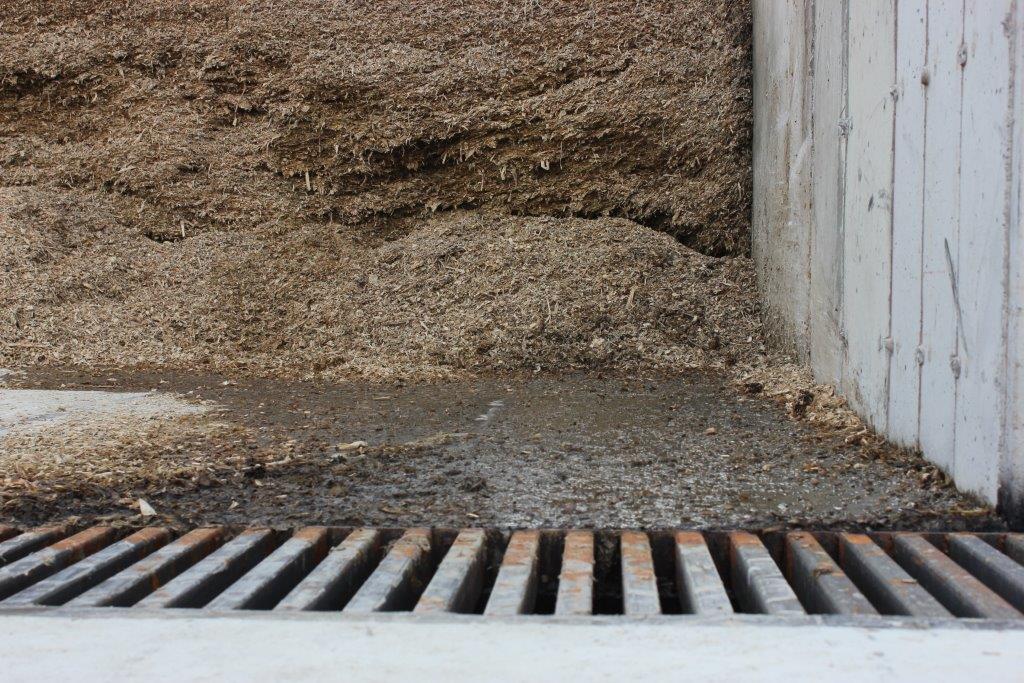
The concentrated effluent is acidic (typical pH of 3.5–5) and it also contains high levels of nitrogen, phosphorous and potassium, like liquid manure (Table 1). There can also be some diluted effluent produced from precipitation mixing with spilled ensiled materials in the silos and on the apron area.
| Constituent | Silage effluent | Liquid dairy manure |
|---|---|---|
| Dry matter | 5% (2%–10%) | 5% |
| Total nitrogen | 1,500–4,400 mg/L | 2,600 mg/L |
| Phosphorus | 300–600 mg/L | 1,100 mg/L |
| Potassium | 3,400–5,200 mg/L | 2,500 mg/L |
| pH | 4.0 (3.6–5.5) | 7.4 |
| Biochemical oxygen demand | 12,000–90,000 mg/L | 5,000–10,000 mg/L |
Source: Ontario Ministry of Agriculture, Food and Rural Affairs (OMAFRA), 2015.
Reducing effluent volumes by re‑directing surface drainage
In many of the sites where silage effluent has been a problem, there are issues with surface drainage of the site due to the location of bunker silo(s) in relation to other buildings and the site topography. Often, the silage effluent flow from the bunkers has been compounded by large volumes of runoff water from roof drainage of the surrounding barns/sheds or from farm laneways that drain through this same area. Unfortunately, many farms have installed catch basins (e.g., Hickenbottom) inlets in these areas to resolve surface water issues. This has provided a direct route for the silage effluent to discharge into surface water.
The first step to resolving silage effluent discharge is to examine the farmstead site and determine if any other surface runoff is flowing in front of the bunker silos. If possible, divert this “clean” water away from the bunker silos before it mixes with silage or silage effluent. Redirecting clean water is done by grading the farm yard or installing eavestroughs on farm buildings. The actual surface material of the farm yard can also factor in the amount of clean water to be managed. Some clean water can penetrate gravel yards. However, water does not infiltrate impervious surfaces such as concrete or pavement.
Next, where does the drainage water from the top of the bunker silos discharge? Most farms cover their silage with plastic tarps after filling to prevent spoilage of the material. Often, the tarp drainage is directed to the back and outside of the bunker silos. If the drainage is discharged towards the front of the bunker, this will contribute additional water to the runoff.
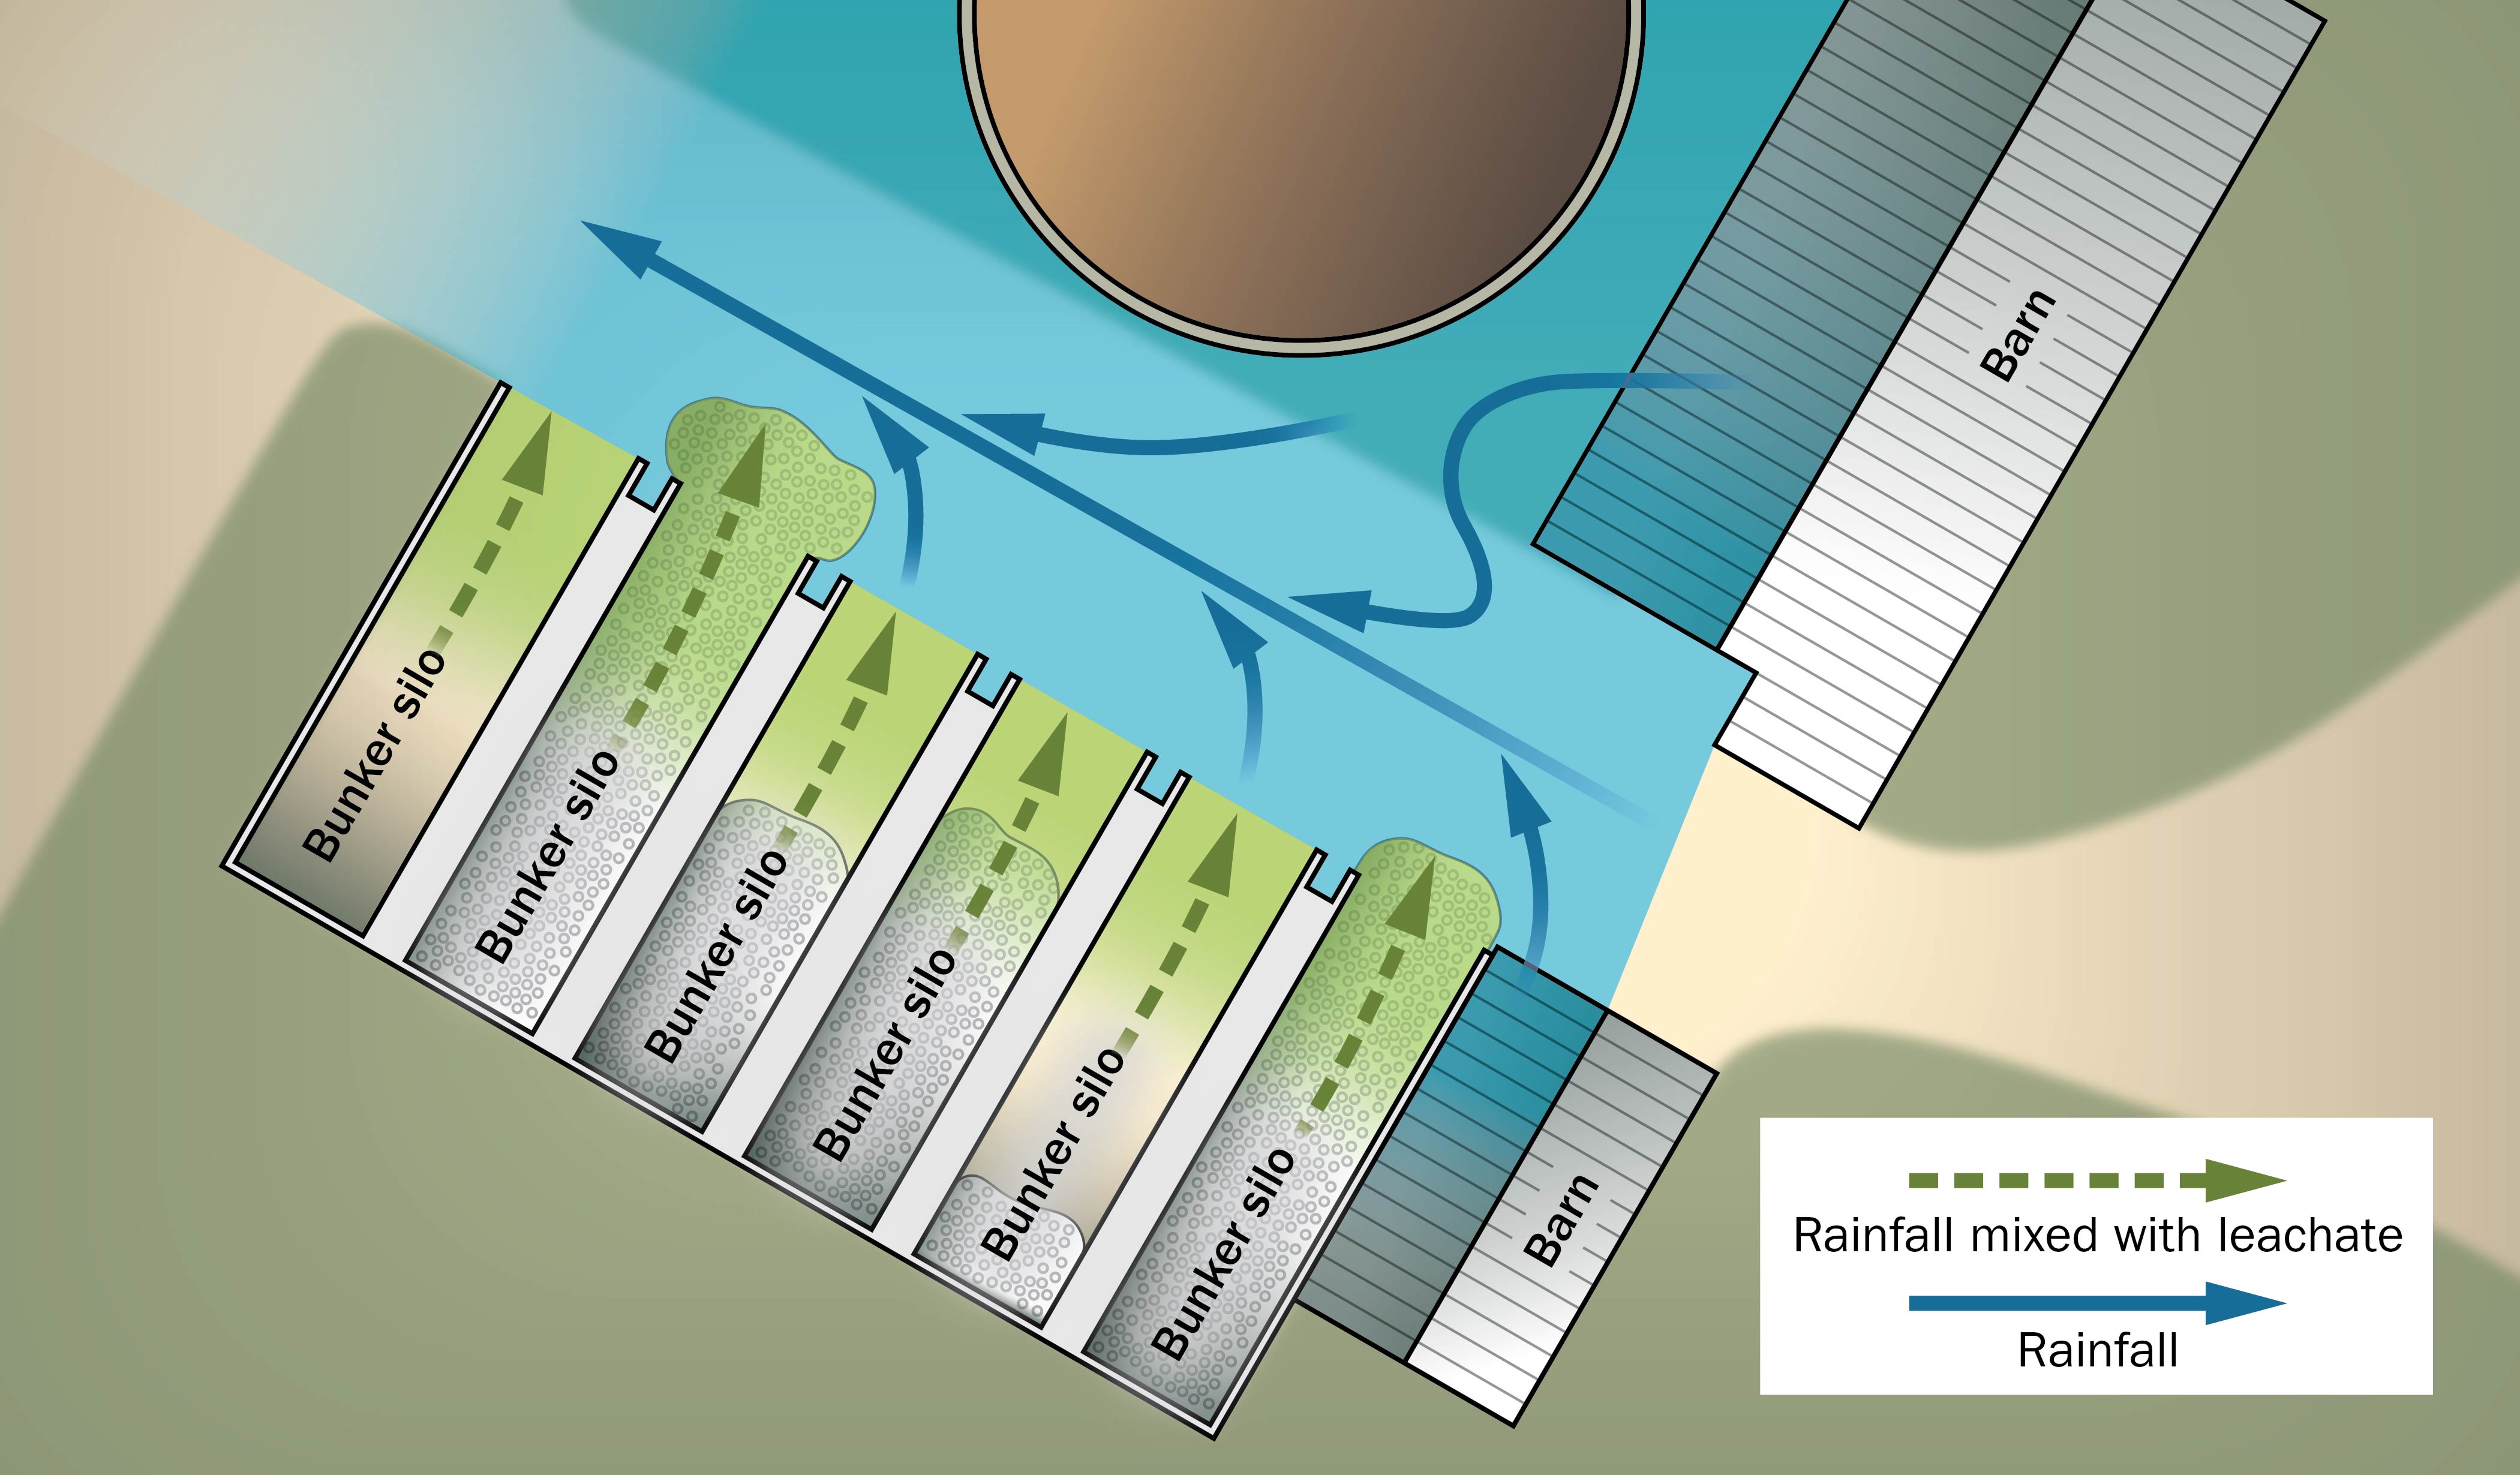
In the example shown in Figure 2, prior to the relocation of the collection sumps to minimize the amount of runoff to store, there was 1,819 m2 (19,554 ft2) of roof area and 2,506 m2 (26,940 ft2) of hard surface laneway/yard that contributed water that had to be managed (area shaded in blue).
After a 2.54-cm (1-in.) rainfall, this capture area could produce an extra 109.85 m3 (24,164 gal) of runoff from this one event on top of the water draining from the actual bunker areas.
Management options
The following are two stewardship options to manage silage effluent:
- Option 1: capture and disperse silage effluent and rainwater through a vegetated area.
- Option 2: capture and store the silage effluent and rainwater in liquid manure storage for land application.
Option 1: capture and disperse through a vegetated area
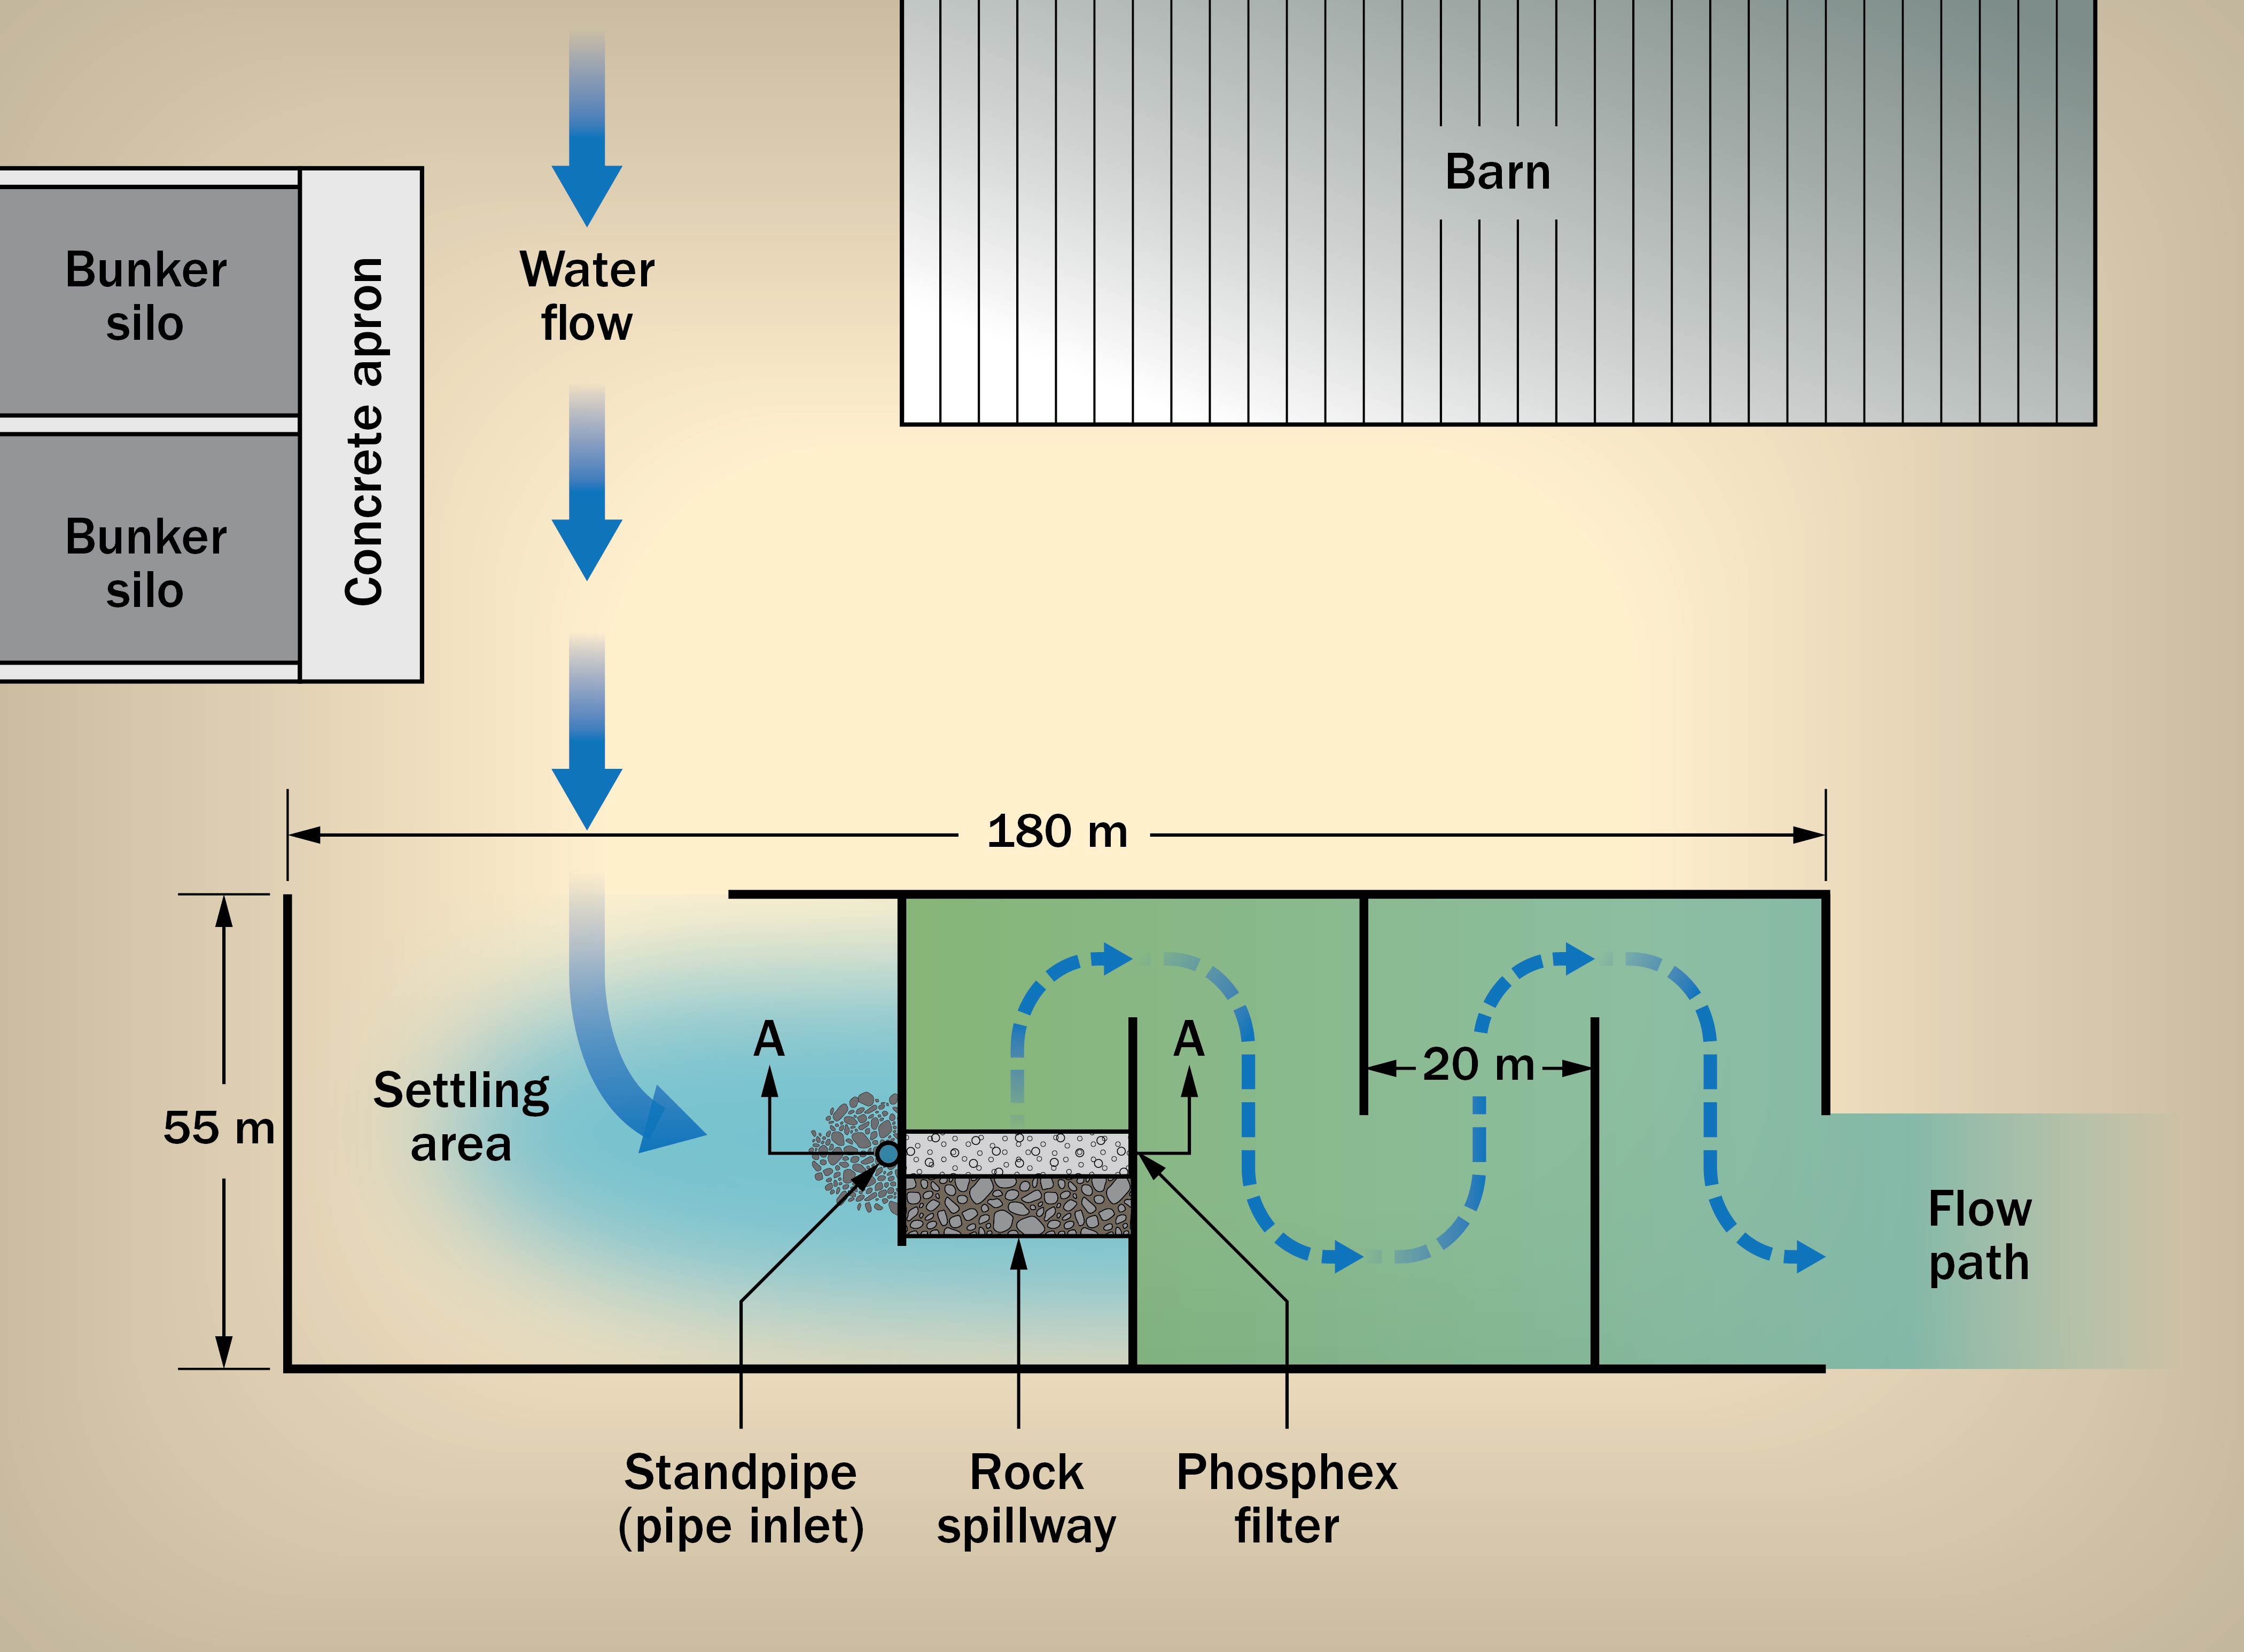
This system has been installed in Ontario and involves the collection of silage effluent and surface runoff from farm yards, which is then directed into a vegetated holding pond. This liquid is slowly released into a serpentine vegetated flow path for absorption of most of the nutrients (Figure 3).
The holding pond acts as a buffer to accept large volumes of water in a short period of time. It is recommended that it be designed to contain a 1-in-25‑year rainfall event from the drainage area (bunker silos, yard area, roof drainage, etc.). In this type of system, the extra water from yards and roofs is welcome, as it dilutes the concentrated nutrients in the silage effluent to prevent damage to vegetation in the treatment area.
| Location | Precipitation depth (25-yr., 24-hr storm) |
|---|---|
| Cornwall | 94.7 mm |
| Kemptville | 96.0 mm |
| Peterborough | 99.7 mm |
| Guelph | 108.0 mm |
| Woodstock | 109.1 mm |
| London | 109.8 mm |
| Ridgetown | 111.7 mm |
The Ontario Ministry of Transportation (MTO) has an online resource available to help determine the expected 25-year, 24-hr storm rainfall depth for any location across Ontario. This tool can be accessed through the MTO website. Examples of rainfall volumes expected from 25-year, 24-hr storms for some select locations in Ontario are also provided in Table 2.
The holding pond area was planted with a mixture of wetland plants (e.g., cattails, sedges, blue vervain, Joe Pye weed, boneset, swamp milkweed, etc.) as they can handle standing water for extended periods.
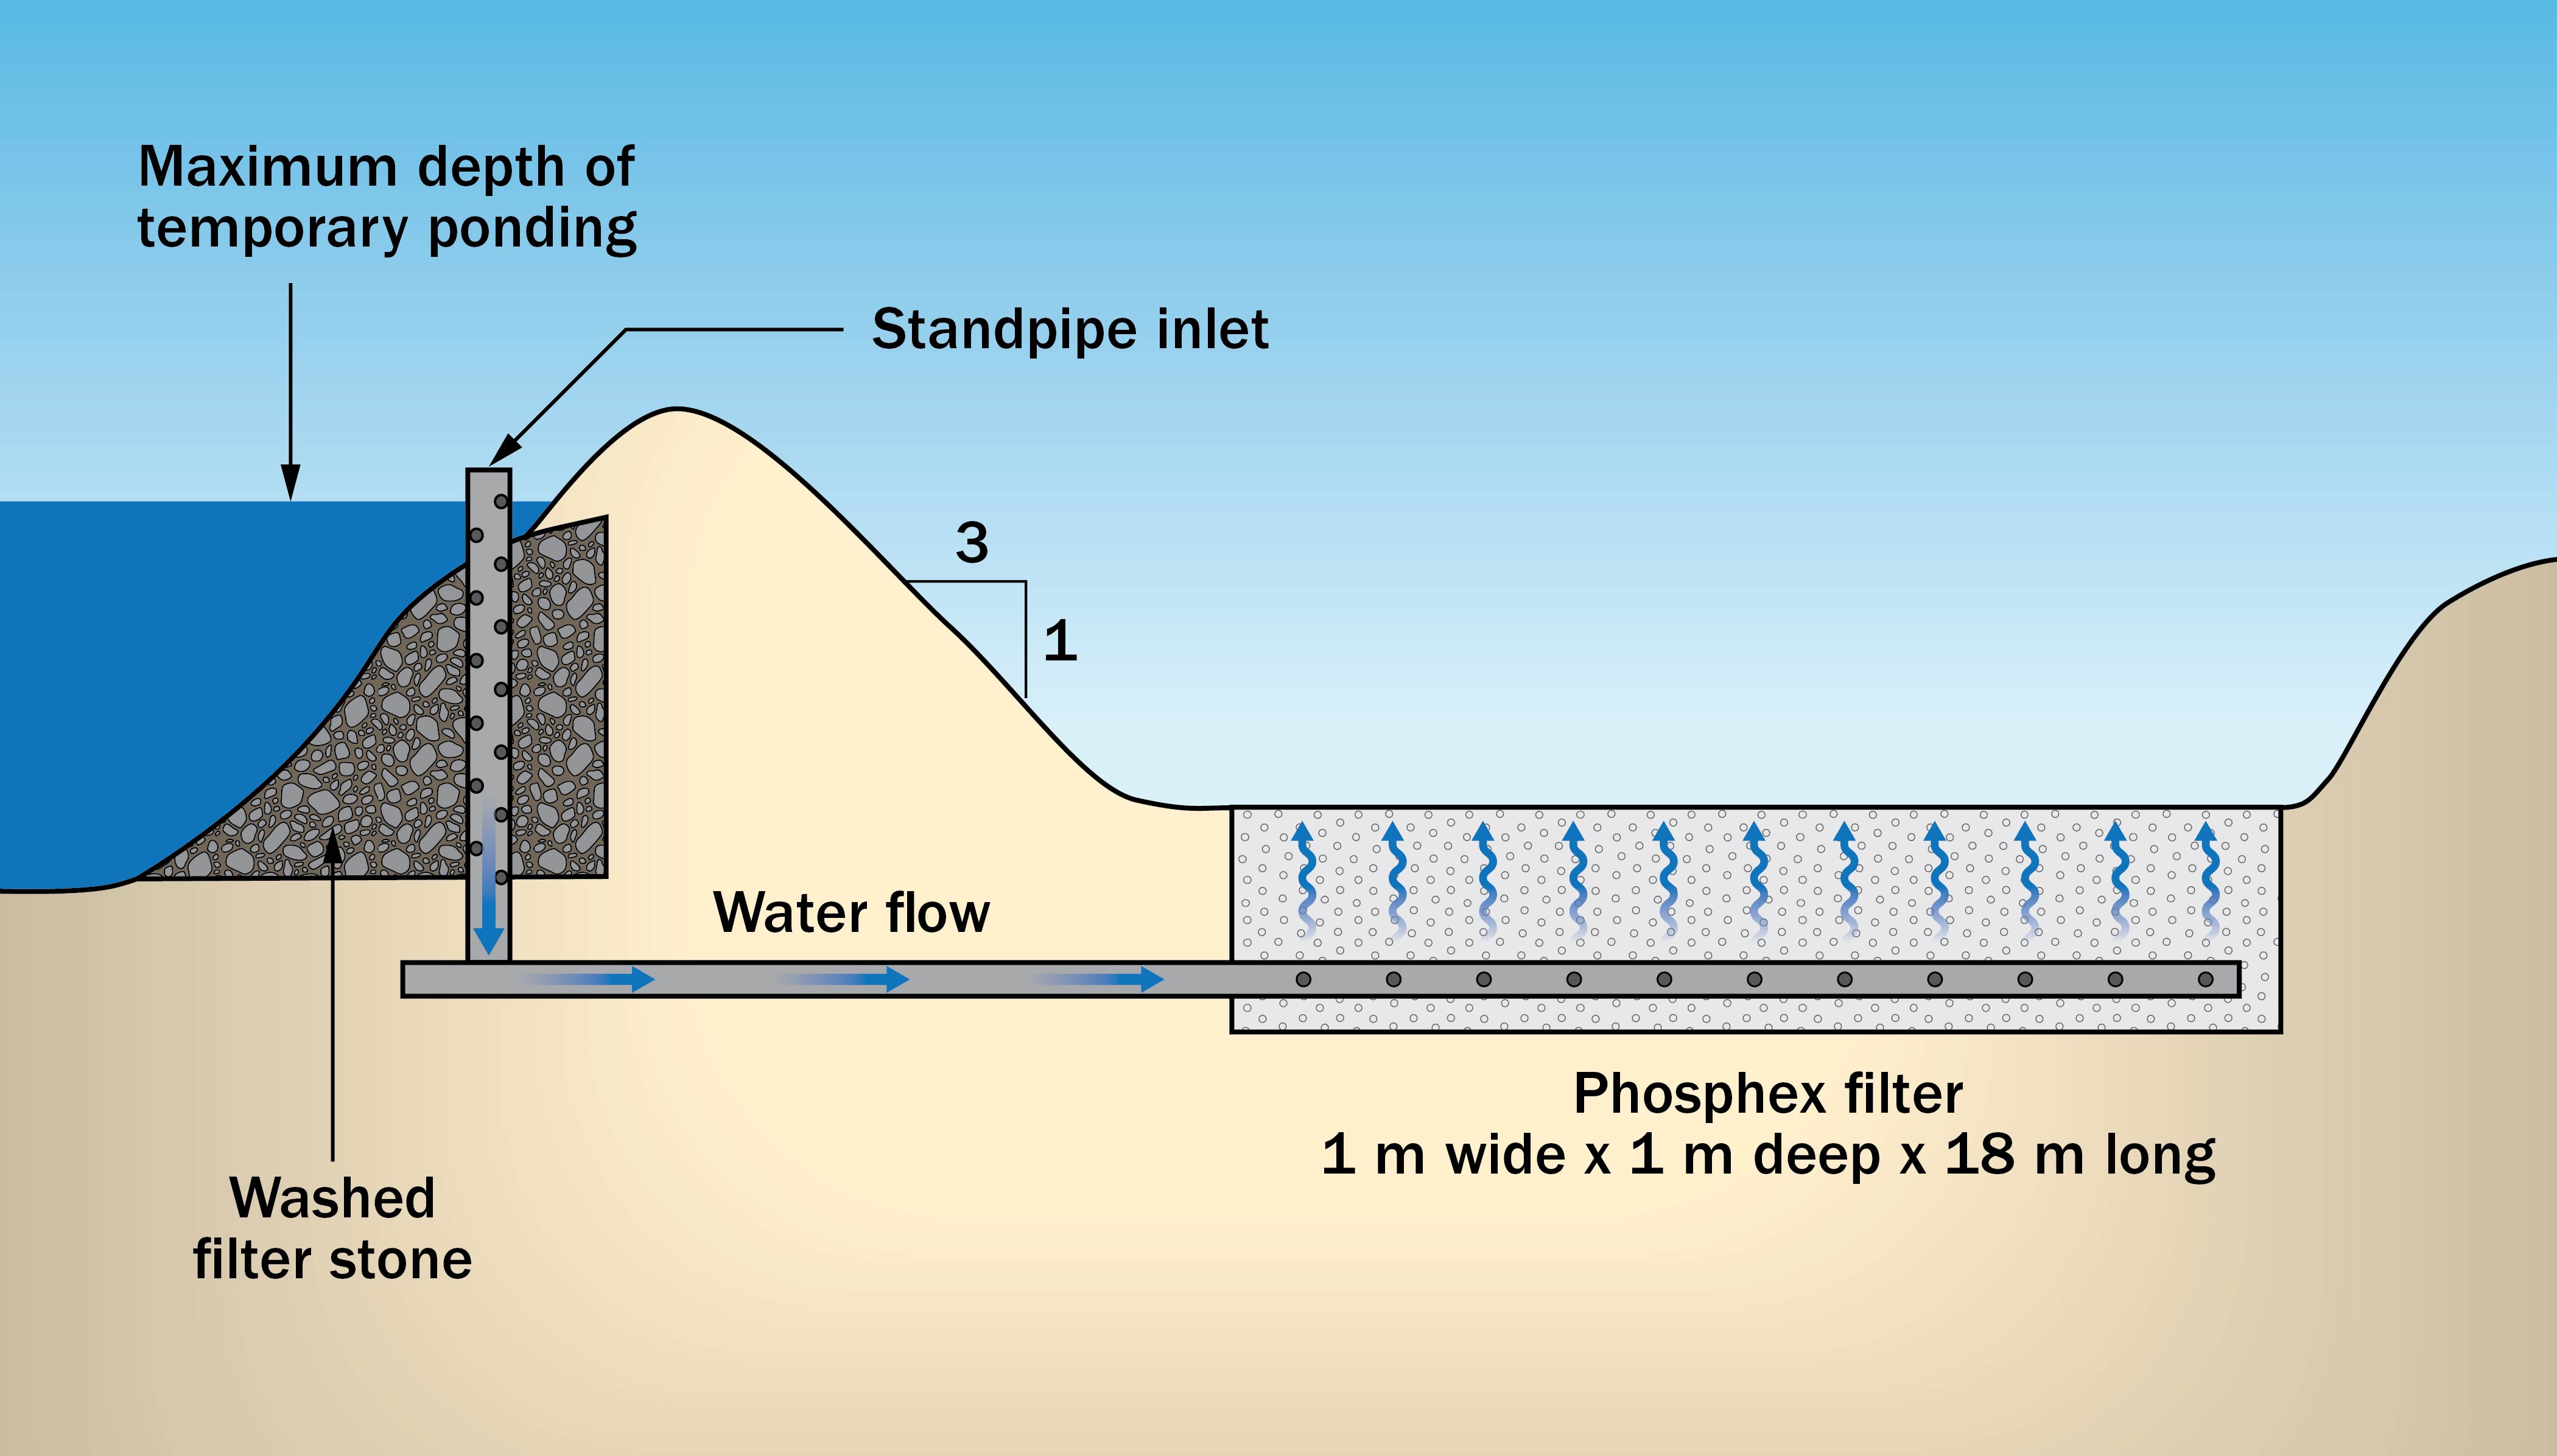
A standpipe inlet structure is used to control the discharge of water from the ponded area into the vegetated flow path. The inlet is sized to discharge the volume of ponded water within 12–24 hr. Pipe flow is discharged below grade into a slag filter, and the water travels upwards through the slag layer to an outlet on the surface of the vegetated channel (Figure 4). The Phosphix filter is designed to tie up some of the phosphorous contained in the water.
| Soil texture class | Typical hydraulic conductivity (m/day) |
|---|---|
| Sand | 5.04 |
| Loamy sand | 1.466 |
| Sandy loam | 0.6216 |
| Loam | 0.3168 |
| Silt loam | 0.1632 |
| Sandy clay loam | 0.1032 |
| Silt | 0.06 |
| Clay loam | 0.0552 |
| Silty clay loam | 0.036 |
| Sandy clay | 0.0288 |
| Silty clay | 0.0216 |
| Clay | 0.0144 |
Source: Vegetated Filter Strip Design Manual, 2006, OMAFRA.
This channel is designed as an infiltration area for the liquid (ideally, with no discharge at the downstream end). Its size (width x length) is directly related to the capacity of in-situ soils in the channel to infiltrate the applied volume. Saturated hydraulic conductivity is a soil characteristic that defines the rate at which water travels through soil (m/day) when the soil is completely saturated. Table 3 contains examples of various soil texture classes and typical hydraulic conductivity under saturated soil conditions. The soil texture will determine if this system can be used to manage the silage effluent at a given site. Depending on soil characteristics, effluent and water volumes, the area required for infiltration may become excessive and unfeasible.
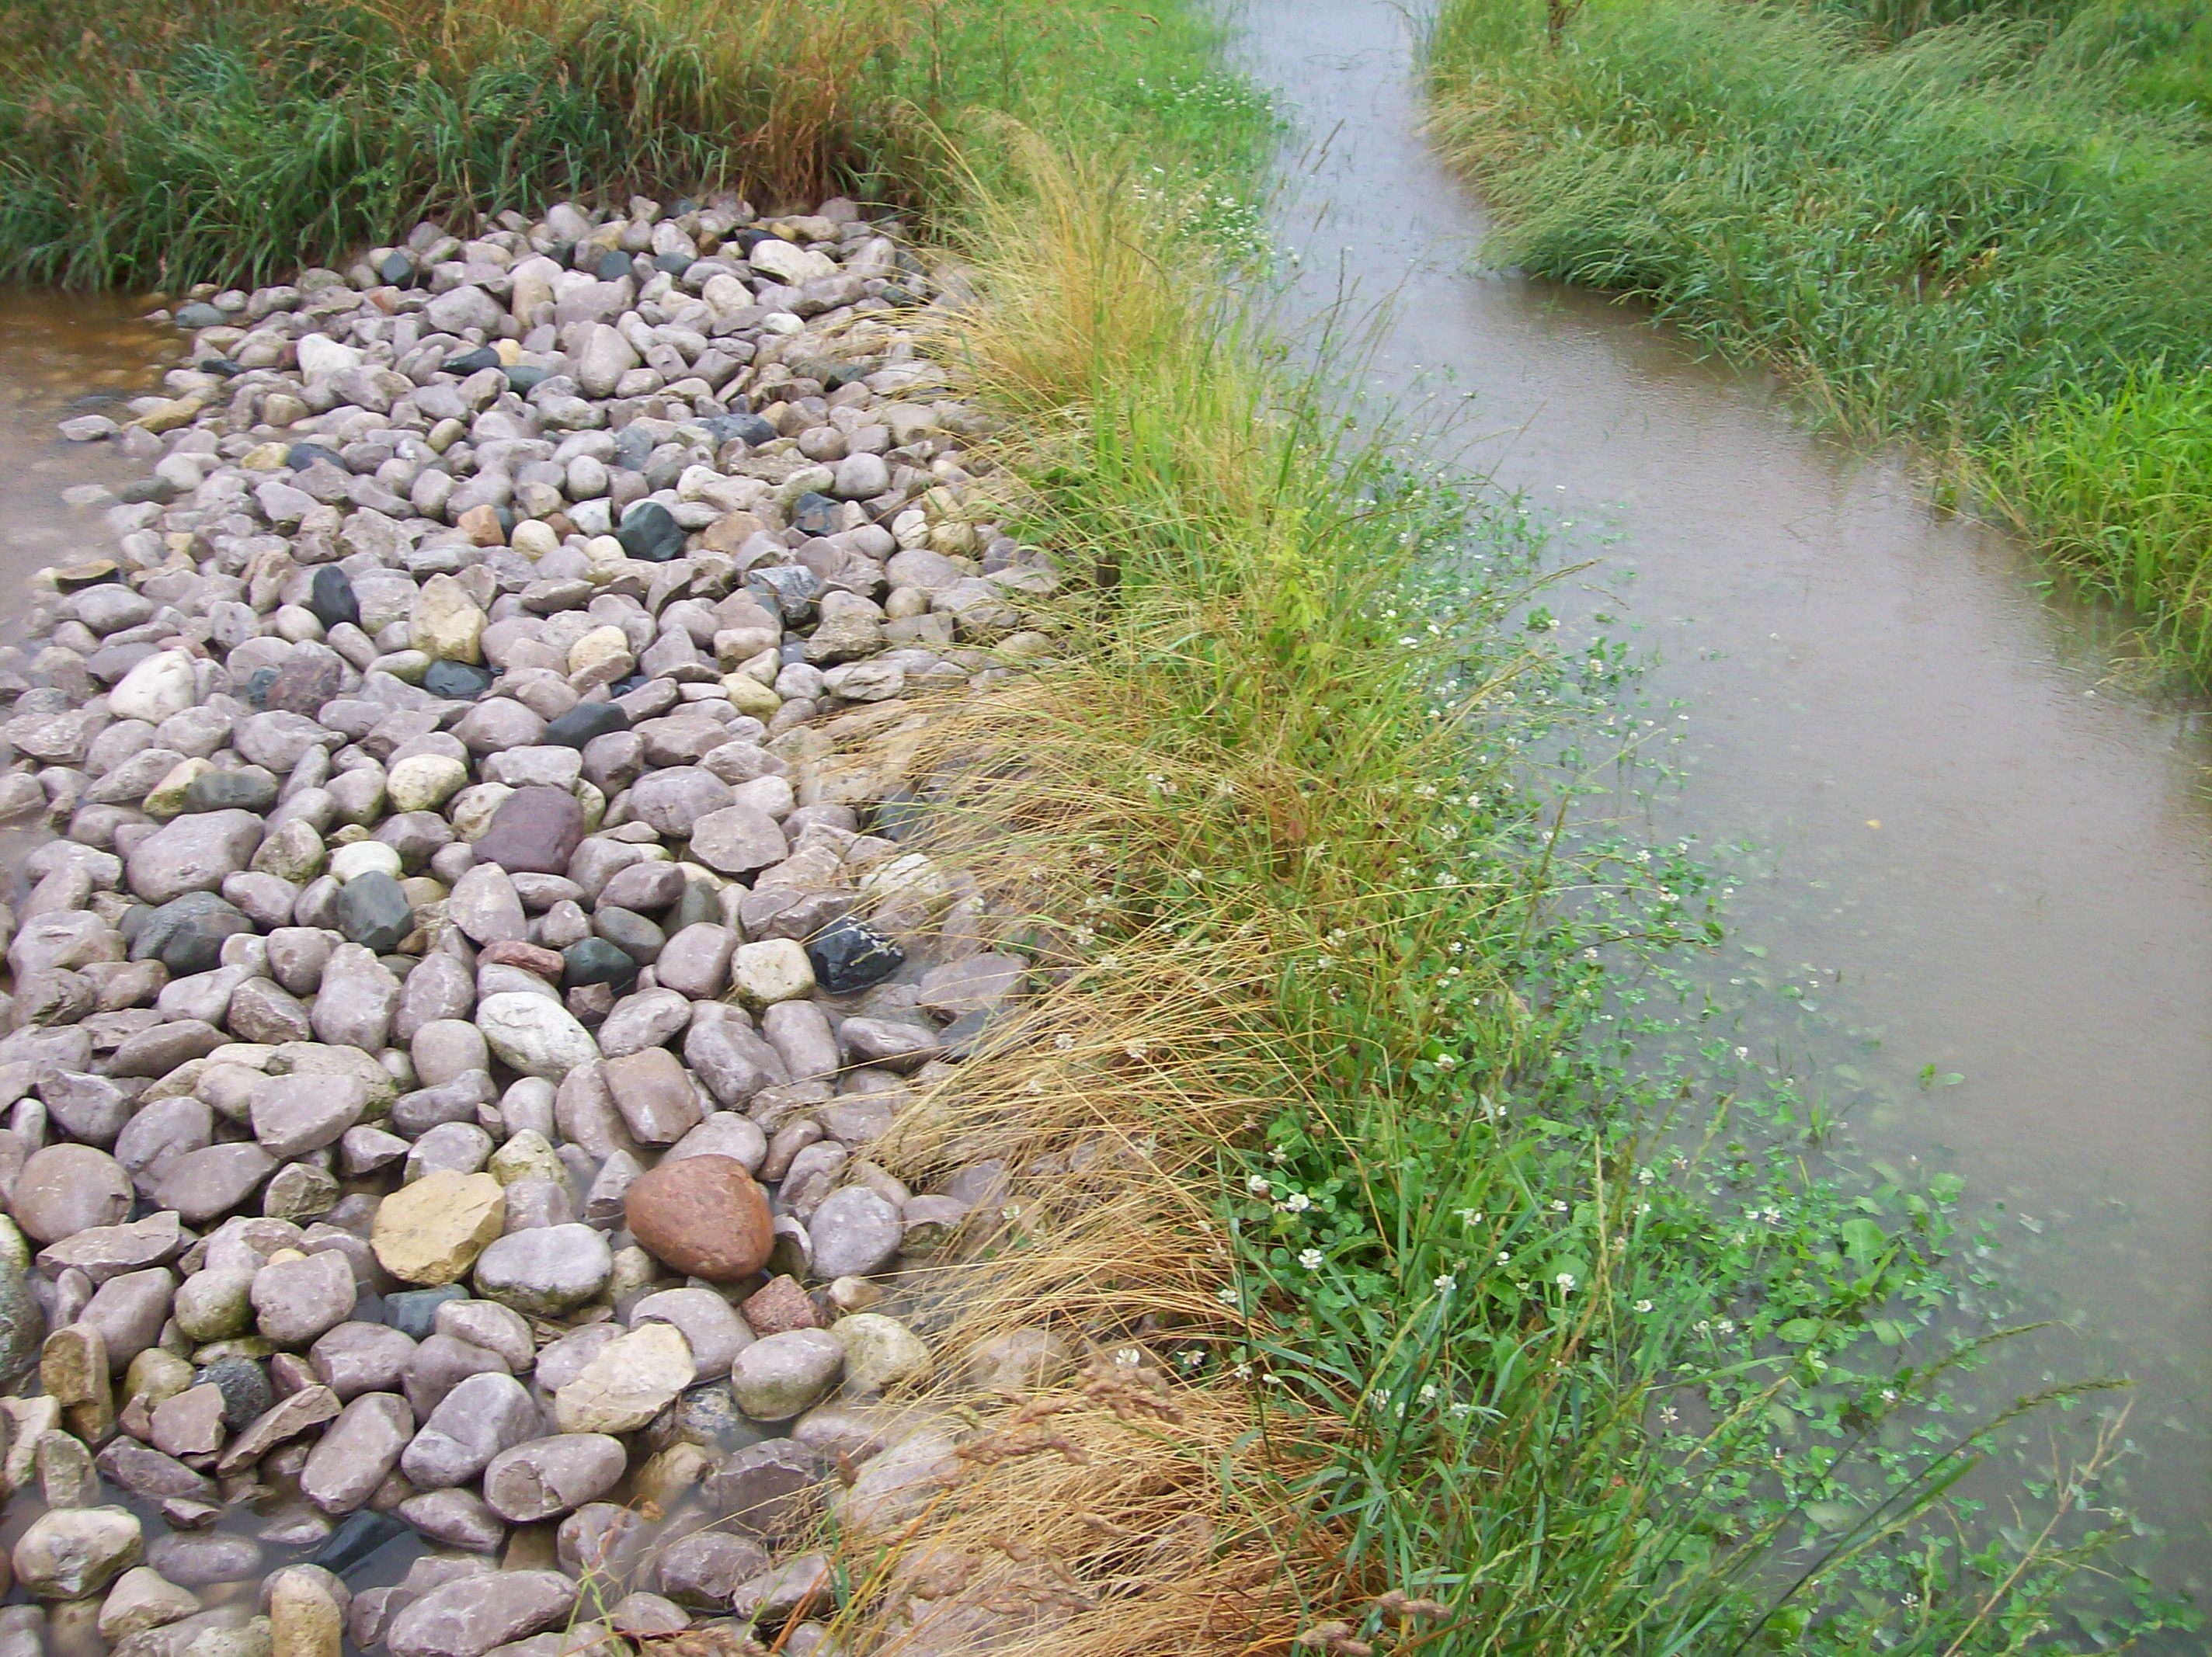
In this example, the soil texture at the site was determined to be a silt loam. The designed channel width was set at 20 m (66 ft) and the total length of the serpentine flow path was determined to be 205 m (675 ft). The flow path had a parabolic cross section, a gradual slope of 0.2% along its length from start to finish and was planted with a mixture of grasses and legume species (e.g., reed canary grass, orchard grass, tall fescue, perennial ryegrass brome grass, trefoil, switchgrass, etc.). There is also a rock emergency spillway (Figure 5) from the holding pond into the vegetated flow path to accommodate extremely high runoff events and protect the berm structure from overtopping.
Advantages
- Low operating cost.
- Passive type treatment.
- No direct discharge into surface water.
Disadvantages
- Requires considerable land area for the treatment system (example farm required 0.99 ha (2.45 acres) to receive seepage plus runoff from 1.02 ha (2.50 acres) drainage area, excluding roof water).
- Routine maintenance involves cutting grass in the flow path several times/year and cleaning of Hickenbottom inlet riser pipe.
- Depending on the site characteristics, it may increase the risk of contributing more nutrients to shallow groundwater in the immediate area.
Option 2: capture and store concentrated effluent in liquid manure storage
This option is designed to collect only the concentrated effluent flow and the precipitation that falls inside the bunker area once the farmer starts feeding the silage. This system minimizes the amount of additional runoff water to store, as the yard and roof water cannot easily drain and mix with the bunker area runoff because of how the area is sloped or graded.
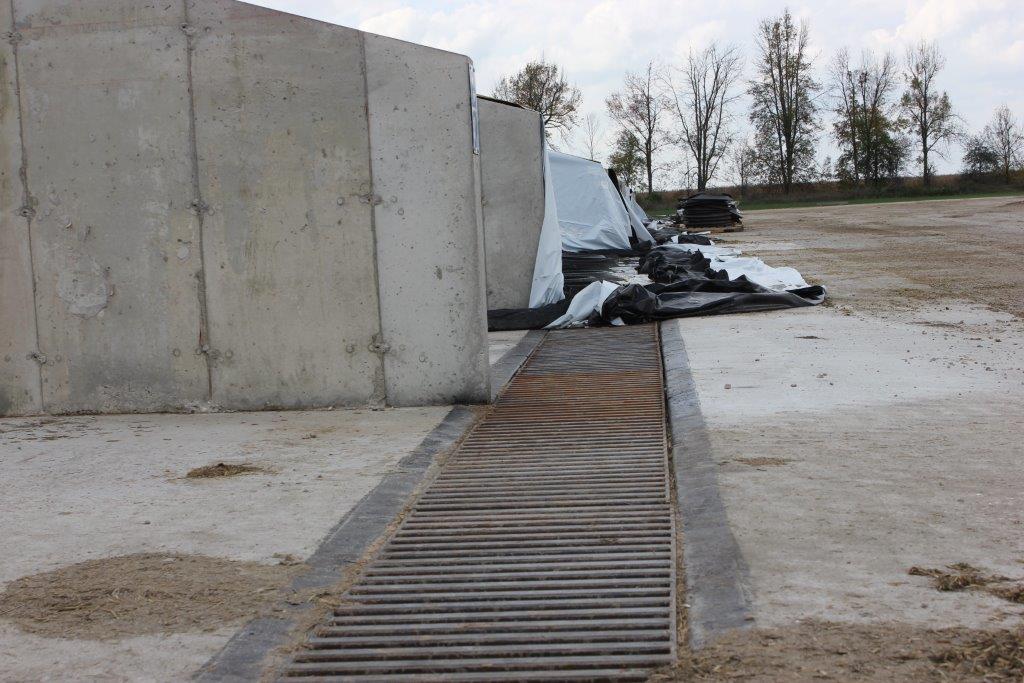
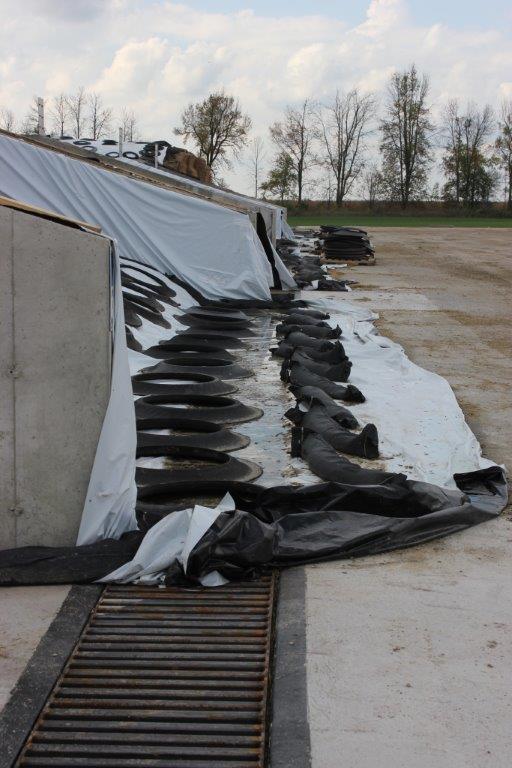
A continuous collection trench is constructed perpendicular to the mouth of all the bunker silos — a grate system is placed over the trench to allow equipment to travel in and out of the bunker (Figures 6 and 7). The grate can be covered with solid plates during silo filling to prevent silage solids from falling into the system. The trench collects and directs all liquids that drain out of the bunker via gravity to a collection sump at one end of the trench where it is pumped into an open-top liquid manure storage. Normally, an electric sewage type pump (that can handle some solids) is used with an automatic float control system that turns it on and off as required to handle the flow. If the site topography allows, the transfer from the collection sump to the manure storage could use gravity, which would eliminate the need for transfer pump maintenance.
AgriSuite software can estimate the amount of silo seepage expected from the bunker silos (see ontario.ca and search for Agrisuite). Consider a site with seven individual bunker silos, each measuring 13 m wide x 49 m long for a total area of 4,459 m2 (51,520 ft2) of bunker silos. AgriSuite estimated the seepage volume to be 381 m3 gal (83,814 gal) of effluent per year, assuming the seepage from each individual bunker silo will occur in the 2‑month period immediately after filling. AgriSuite assumed 3.1 m3 of seepage will be produced from each 100 tonnes of silage. In this case, the software estimates that there are approximately 12,341 tonnes of silage stored when all seven bunker silos are filled.
There are two suggested methods that can be used to calculate the volume of precipitation that will be captured from the exposed bunker floor areas once the farmer starts feeding silage. In both cases, a factor of 0.9 is used to allow for some volume losses due to evaporation:
- Coarse estimate: uses the total annual precipitation for the location multiplied by half of the total bunker area. In the example, the measured annual precipitation for this location is 1,133.2 mm, and the total area of bunker silos is 4,459 m2.
Estimated annual runoff volume = 0.5 (4,459 m2) x 1.1332 m x 0.9 = 2,274 m3 (500,242 gal). - More detailed estimate: this approach uses monthly average precipitation data for a location (e.g., the historical monthly precipitation data available from the nearest Environment Canada monitoring station) multiplied by the estimated area of exposed bunker floor area for each month of the year, given the farm’s feeding practices and silo filling dates (Table 4).
| Month | Precipitation (mm) | Estimated exposed bunker floor Area 1 | Total bunker area (m2) | Runoff factor | Volume (m3) |
|---|---|---|---|---|---|
| January | 80.8 | 53.6% | 4,459 | 0.9 | 173.7 |
| February | 74 | 61.9% | 4,459 | 0.9 | 183.7 |
| March | 69.1 | 70.1% | 4,459 | 0.9 | 194.5 |
| April | 82.9 | 78.6% | 4,459 | 0.9 | 261.3 |
| May | 114.9 | 86.8% | 4,459 | 0.9 | 400.5 |
| June | 85.8 | 80.9% | 4,459 | 0.9 | 278.4 |
| July | 78 | 75.0% | 4,459 | 0.9 | 234.7 |
| August | 113.4 | 69.0% | 4,459 | 0.9 | 314.0 |
| September | 121.9 | 11.8% | 4,459 | 0.9 | 58.0 |
| October | 86.1 | 20.1% | 4,459 | 0.9 | 69.6 |
| November | 121.7 | 36.8% | 4,459 | 0.9 | 180.0 |
| December | 104.6 | 45.3% | 4,459 | 0.9 | 189.9 |
| Year | 1,133.2 | N/A | N/A | N/A | 2,538.5 |
1Estimated exposed bunker floor area for the example farm based on silo filling schedule and feeding practices from the seven bunker silos. This column will vary for each farm.
The total volume of liquid to manage is comprised of the concentrated seepage volume plus the precipitation runoff volume.
Method: Coarse estimate
Total volume = 381 m3 + 2,274 m3 = 2,655 m3 (584,056 gal).
Method: Detailed estimate
Total volume = 381 m3 +2,538.5 m3 = 2,919.5 m3 (642,241 gal).
The concentrated silage effluent is diluted with the liquid manure during agitation and land applied to crop land as a nutrient source.
Advantages
- Fully contained system.
- Less volume of liquids to manage.
- Less land base required than the vegetated runoff management system.
Disadvantages
- More expensive system to build and operate.
- Requires additional liquid manure storage.
- Requires regular maintenance of the trench and pumping system to remove accumulated solids.
- May require a back-up power supply if using electric pumps.
Summary
Silage effluent poses a real threat to water quality and the environment if not properly managed. However, there are design options to deal with this material in a responsible manner. Individual site conditions will dictate the best and most economic approach to managing silage effluent on the farmstead.
This factsheet was written by Daniel Ward, P.Eng., Engineering Specialist, Poultry and Other Livestock Housing and Equipment, OMAFRA, Stratford, and Dave Bray, Environmental Specialist, OMAFRA, Stratford, and reviewed by Rebecca Shortt, P.Eng., Engineering Specialist, Water Quantity, OMAFRA, Simcoe, and Kevin McKague, P.Eng., Engineering Specialist, Water Quality, OMAFRA, Woodstock.