Natural-air grain drying
Learn about natural-air grain drying and the management practices to ensure successful drying under Ontario conditions. This technical information is for Ontario producers.
ISSN 1198-712X, Published June 2020
Introduction
Ontario farmers harvest millions of tonnes of corn, soybeans and wheat every year. Weather conditions at harvest often result in “tough” or damp grain that must be dried to avoid spoiling in storage. Most grain is dried using high-temperature air, which can result in stress cracks, heat damage and quality loss. Grain drying also accounts for over 30% of the total energy used to grow and harvest grain.
Drying grain using natural air will reduce drying costs, preserve grain quality and prevent heat damage. Specialty crops (for example, identity-preserved soybeans and other food-grade crops) are particularly well-suited to this method. Natural‑air drying is energy efficient, and no specialized equipment is required. Drying cost savings combined with higher quality grain can result in more revenue and better profitability.
This factsheet explains natural-air grain drying, highlights key management practices to ensure successful drying and estimates drying time under Ontario conditions. Common drying problems are also discussed.
Imperial and metric units in this fact sheet
Grain storage equipment is primarily manufactured in the U.S., and most equipment information is available in imperial units only. While metric units have been provided for most values in this factsheet, some measurements remain in imperial units only. To convert imperial measurements to metric, use the conversion factors below:
Airflow: 1,000 cubic feet per minute (CFM) = 470 litres per second (L/s)
Grain volume: 1,000 bushels (bu) = 35 cubic metres (m3)
Airflow per volume: 1 cubic foot per minute per bushel (CFM/bu) = 13 litres per second per cubic metre (L/s/m3)
Air pressure: 1 inch of water column (in. w.c.) = 250 Pascals (Pa)
Natural-air drying
Natural-air drying is both possible and practical in Ontario. However, patience is needed as grain often takes several weeks to fully dry. For farms only concerned about dryer throughput, natural air may not be the right solution.
Farms producing specialty crops, farms with enough bins to dry all wet crops at once and/or farms looking for improved quality and better energy efficiency can benefit from this simple process. Even if most grain will be dried conventionally, set up a bin for natural‑air drying to provide additional flexibility.
How natural-air drying works
Grain in a bin dries in a “front,” or layer, approximately 30–60 cm (1–2 ft) thick, starting at the bottom of the bin and moving up slowly. Airflow produced by the bin fan slowly moves the front up the bin. All grain below the front will be dry, while all grain above the front remains wet. Grain at the top of the bin will not dry until all grain below is also dry (Figure 1).
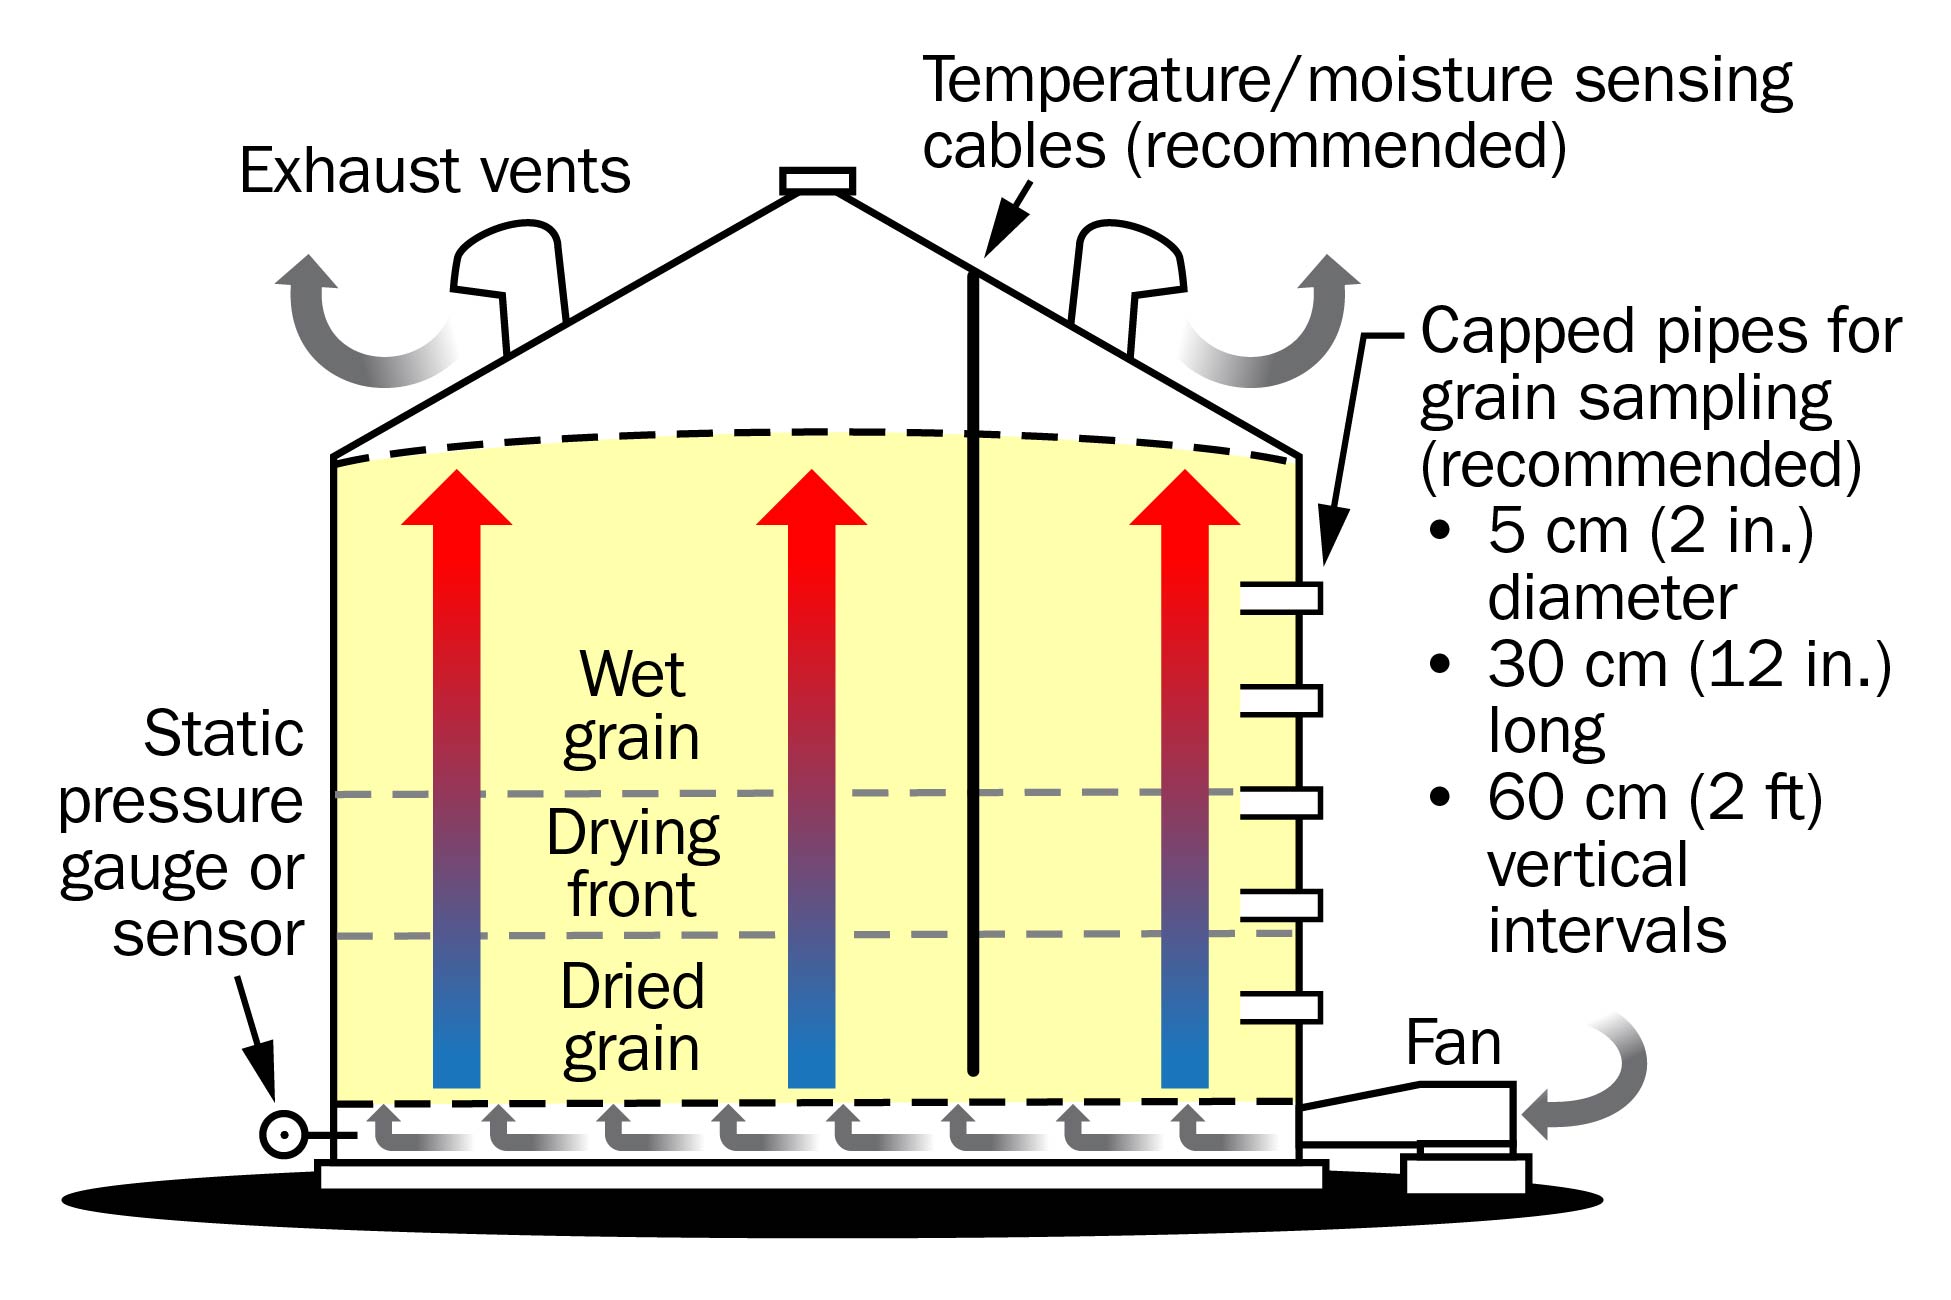
Monitor the drying progress using temperature/moisture-sensing cables, or by installing grain sampling ports at regular intervals up the side of the bin (Figure 1). Install capped steel pipes approximately 5 cm (2 in.) in diameter, extending 30 cm (12 in.) into the bin at 60 cm (2 ft) vertical intervals. Use these pipes to remove grain samples for moisture testing throughout the drying process.
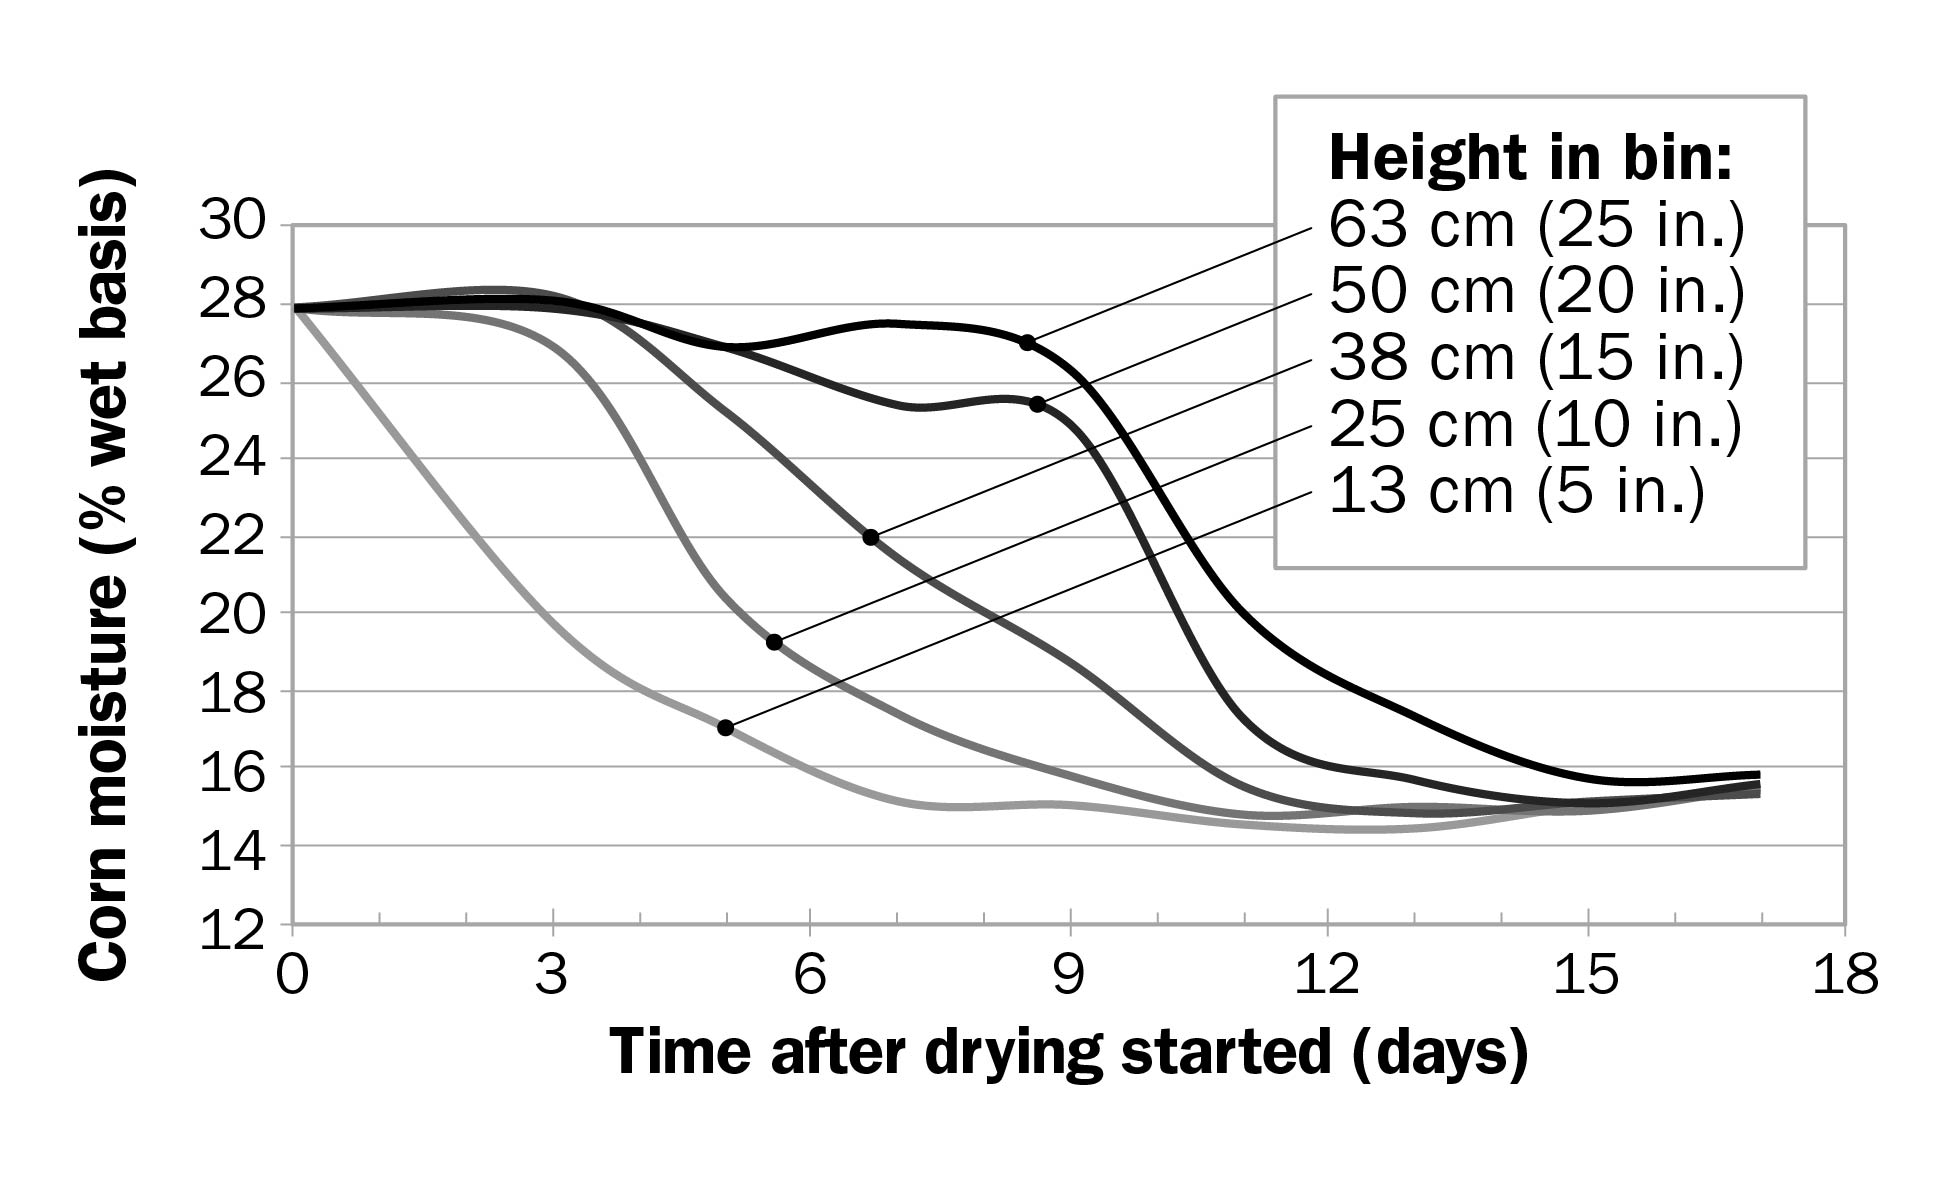
Figure 2 shows the moisture levels during natural‑air drying of 76 cm (30 in.) of corn. Moisture measurements were taken at various heights above the floor in the grain mass. Grain closest to the floor dried first, while grain near the top did not begin to dry for several days, until all the grain below had dried significantly.
How to dry grain successfully with natural air
Successful drying using natural air requires three things:
- good airflow
- grain in good condition
- careful management
Good airflow
Use a fan with 26 L/s of airflow per cubic metre of grain (2 CFM per bushel) in the bin
More airflow means faster drying. In Ontario, 26 litres of air per second per cubic metre of grain (L/s/m3) or 2 CFM per bushel (bu) of grain is recommended. At lower airflow, grain will still dry, but will take more time.
3 things affect fan airflow:
- fan type
- motor size
- static pressure
Fan type refers to the style of fan. Vane-axial (propeller) fans are common and inexpensive. Centrifugal (“squirrel-cage”) fans are more for tall bins. Low-speed centrifugal fans normally provide the highest airflow per motor horsepower.
Motor size refers to kilowatts (kW) or horsepower (HP). Normally, a larger motor produces more airflow.
Static pressure measures how hard the fan is working to push air through the grain (measured in Pascals, or inches of water column). As static pressure increases, airflow decreases.
If the bin already has a fan, look up the fan performance chart (available from the fan manufacturer) to find the airflow. For a new bin, choose a fan that will provide the required airflow. Large bins may need multiple fans. To calculate the total required airflow, multiply the number of bushels in the bin by 2 CFM/bu (for example, 5,000 bu × 2 CFM/bu = 10,000 CFM total airflow).
Table 1 shows examples of fan performance charts. Notice that motor size is the same for these fans, but the airflow varies depending on the type of fan and the static pressure.
| Fan type | 0 in. of water column in CFM | 1 in. of water column in CFM | 2 in. of water column in CFM | 3 in. of water column in CFM | 4 in. of water column in CFM | 5 in. of water column in CFM | 6 in. of water column in CFM | 8 in. of water column in CFM | 10 in. of water column in CFM | 12 in. of water column in CFM |
|---|---|---|---|---|---|---|---|---|---|---|
| Vane-axial, 10 HP | 15,300 | 13,800 | 12,200 | 10,500 | 7,600 | 4,000 | N/A | N/A | N/A | N/A |
| Inline centrifugal, 10 HP | 6,200 | 6,000 | 5,800 | 5,600 | 5,500 | 5,300 | 5,100 | 4,700 | 4,200 | N/A |
| Centrifugal, low-speed 10 HP | 16,100 | 15,000 | 14,200 | 13,300 | 12,400 | 11,400 | 10,000 | 3,400 | N/A | N/A |
| Centrifugal, high-speed 10 HP | 7,300 | 7,100 | 6,900 | 6,600 | 6,300 | 6,100 | 5,800 | 5,500 | 4,900 | 4,300 |
Note: This chart is for reference only. Contact the fan manufacturer for charts specific to their fans.
Fill bins no deeper than 3–4 m (10–13 ft) with grain
Deep grain creates more static pressure, which reduces airflow. To keep static pressure low, fill bins no deeper than 3–4 m (10–13 ft) with grain.
To find the static pressure at a certain grain depth, contact the fan manufacturer and get a copy of the fan performance chart for the fan on the bin (examples in Table 1). Look up the desired airflow and note the static pressure on the fan chart. Use Figure 3 to find the grain depth for that static pressure. Notice that different grains create different static pressures at the same grain depth and airflow rate.
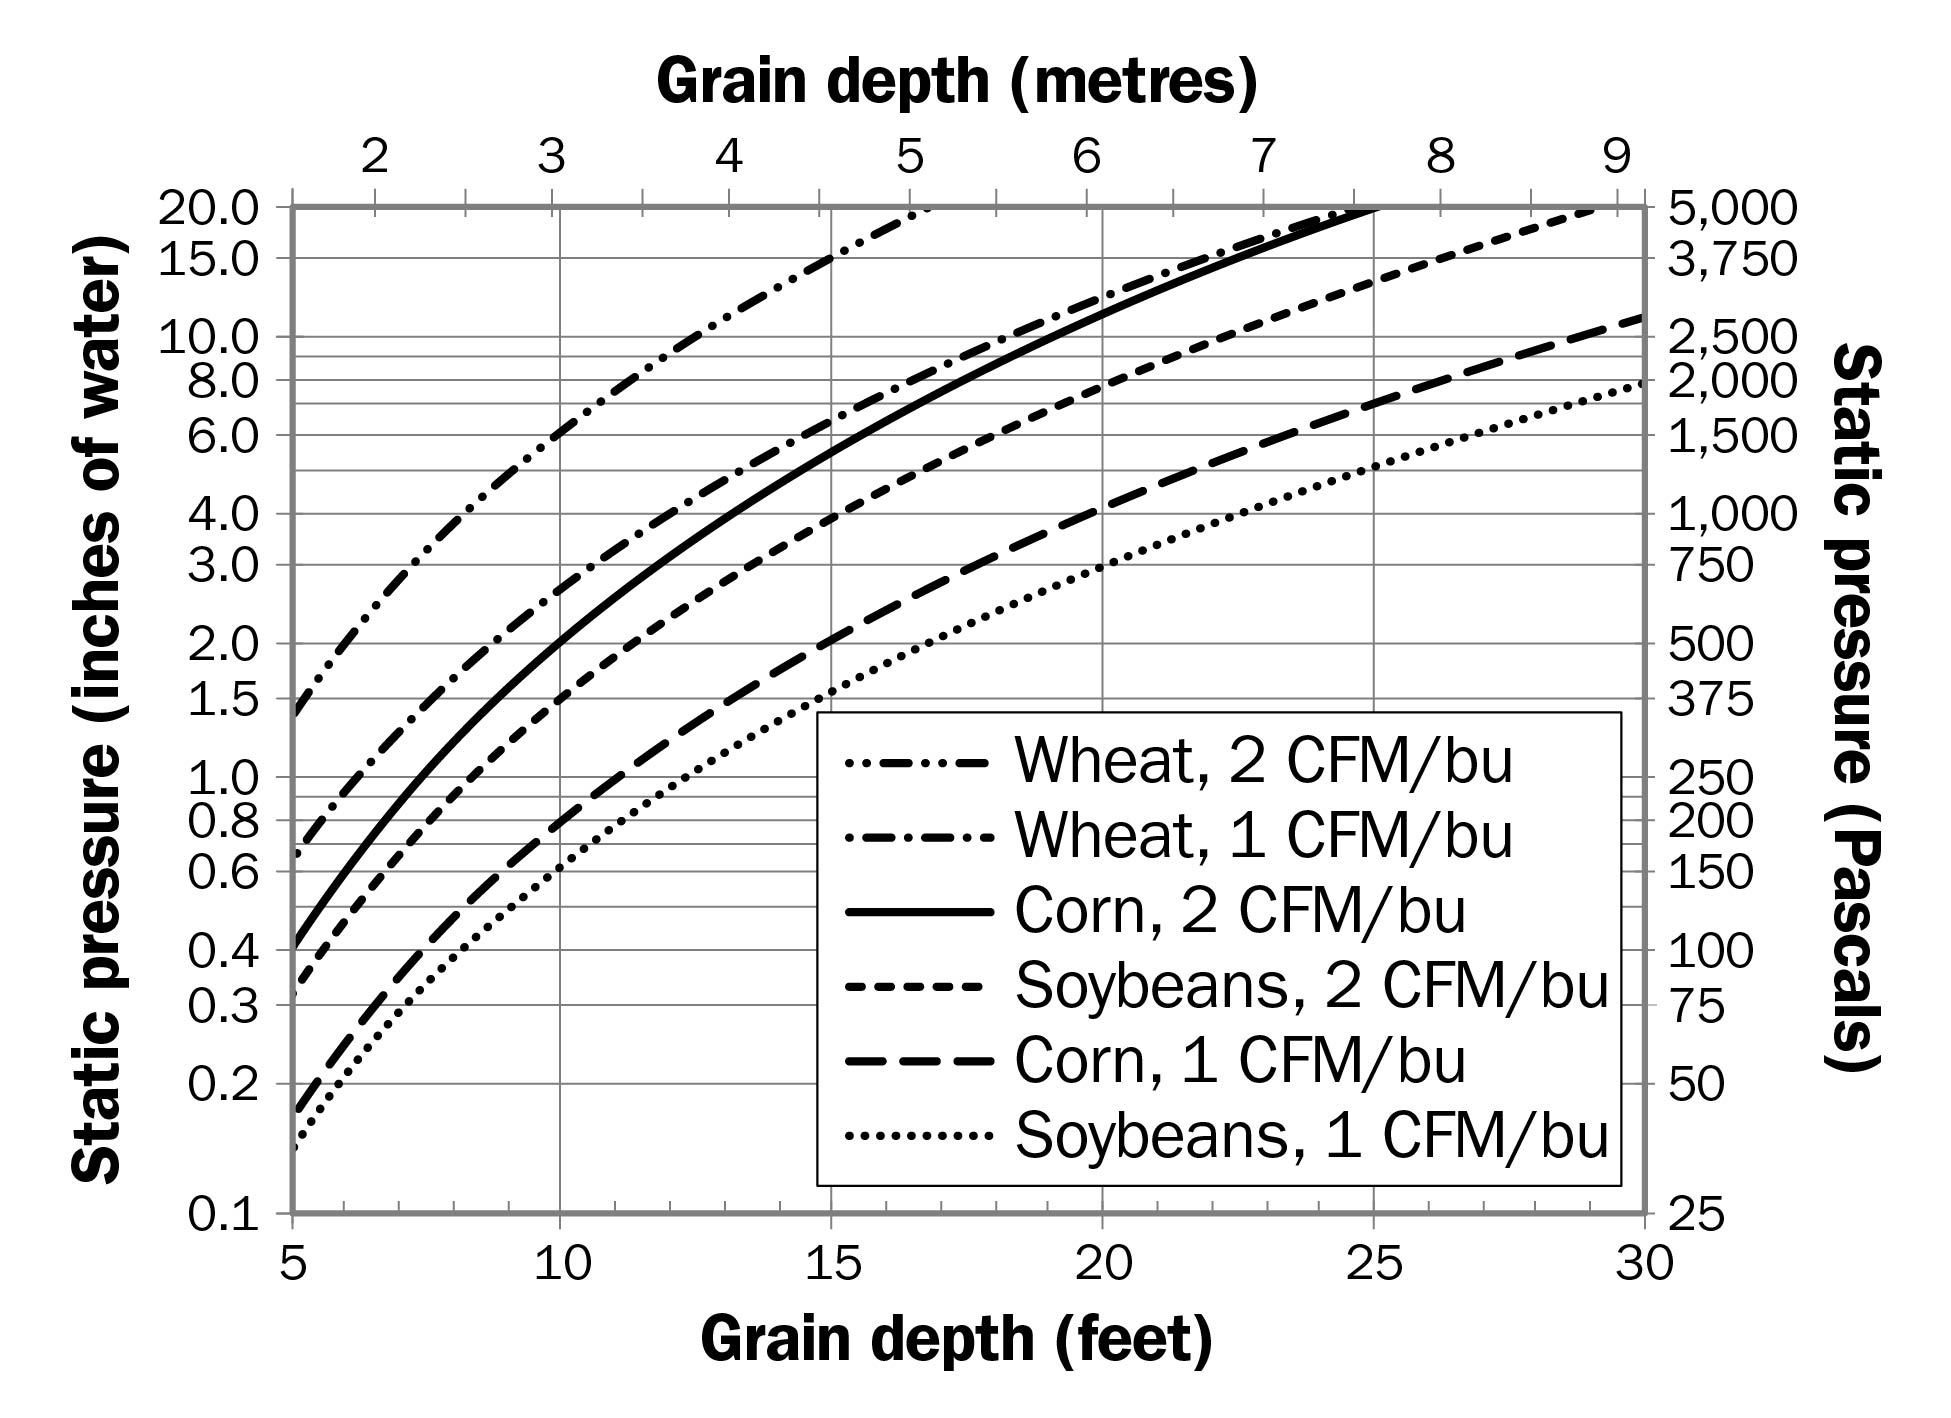
For example, a bin with a 10-HP vane-axial fan is filled with 5,000 bu of corn. At 2 CFM/bu, this bin requires 10,000 CFM total airflow for good drying. From the performance chart (Table 1) this 10‑HP vane-axial fan produces about 10,000 CFM at 750 Pa (3 in. w.c.) of static pressure. From Figure 3, corn at about 3.5 m (12 ft) depth will create 750 Pa (3 in. w.c.) of static pressure at 2 CFM/bu airflow.
Install at least 0.1 m2 (1 ft2) of roof vents per 470 L/s (1,000 CFM) of airflow
Air needs to escape the bin easily to prevent trapping moisture inside. Install at least 0.1–0.15 m2 (1–1.5 ft2) of roof vent area per 470 L/s (1,000 CFM) of fan airflow. Space vents evenly around the roof, as high up the roof as possible. Keep vents back from the bin eave to prevent wind-driven snow from entering the bin. Use multiple rows of vents in large bins (greater than 11 m (36 ft) or in diameter).
For example, a bin with a 4,700 L/s (10,000 CFM) fan will require at least 1–1.5 m2 (10–15 ft2) of total vent area.
Grain in good condition
Moderate grain moisture: not too wet
Only use natural-air drying for grain that can be fully dried without spoiling. Very wet grain can spoil before drying is complete. Spoilage starts at the top of a bin, where grain stay wet the longest (Figure 1). Normally, only corn less than 20%–22% moisture, soybeans less than 16%–18% moisture, and wheat less than 18%–20% moisture can be dried quickly enough to avoid spoiling, using natural air.
Allowable storage time (AST) estimates how long grain can be stored before spoilage becomes significant. The tables in Appendix A list the AST in days for corn, soybeans and wheat at various grain temperatures and moisture levels. AST is based on high-quality clean grain. Significant damage and/or fines can reduce AST by half. AST is also cumulative; it does not reset once grain is dried. If grain is stored wet for 75% of the AST, only 25% of the “dry” AST remains for safe storage.
Core the bin after filling to remove fines
A bin full of grain still has 30%–40% air space between the kernels. Excess fines fill up this air space, increasing static pressure, reducing airflow and lengthening the drying time. Where possible, remove fines using a grain cleaner before filling the bin.
Fines often collect in the centre as the bin is filled. “Core” the bin within a few days of filling to remove the bulk of fines. To core, remove grain using the unload auger until an “inverted cone” is visible on top, approximately one-quarter of the bin diameter. Clean the removed grain and return it to the bin or sell it for feed.
Level the bin after coring
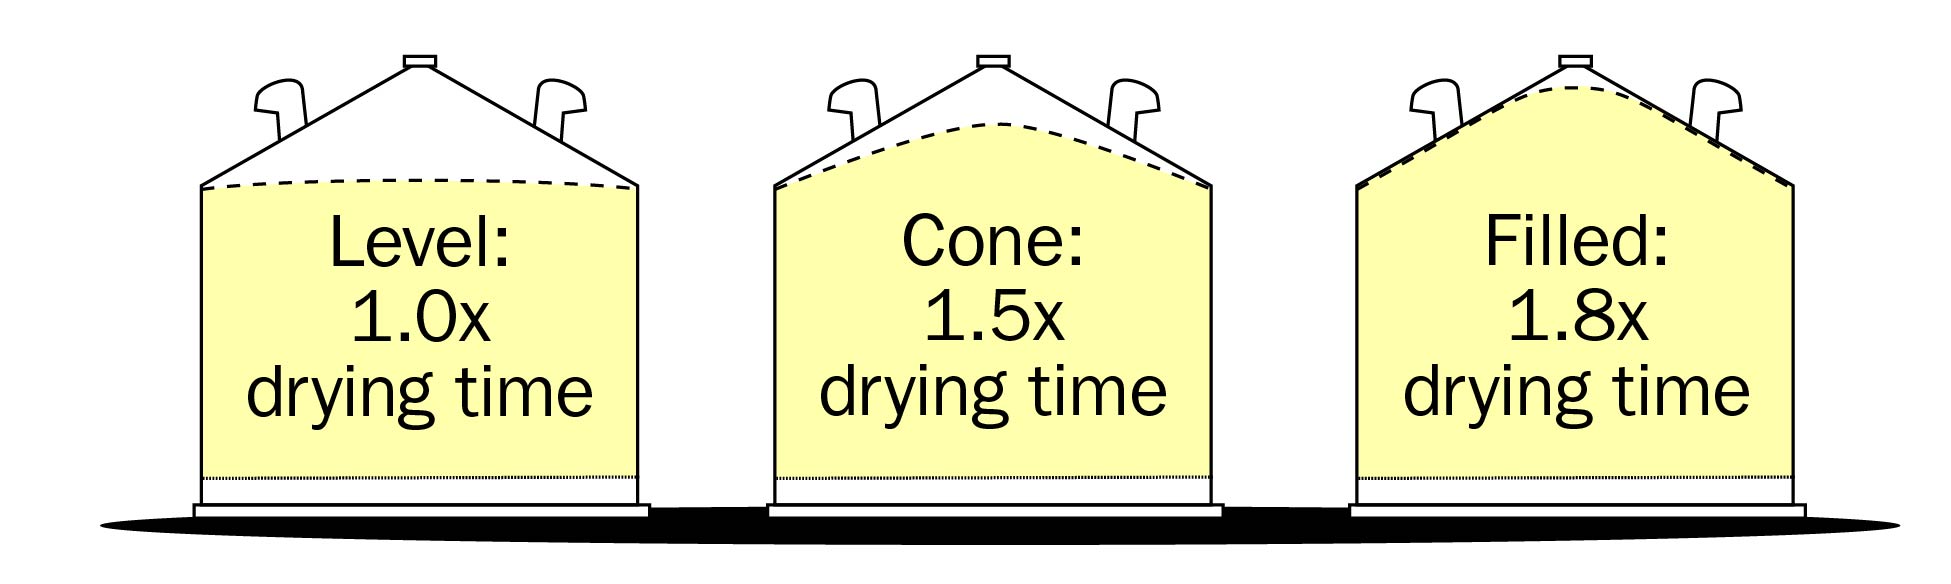
Once the bin is cored, level the grain. When grain depth is uneven, more air passes through low spots, and less air through higher spots. If grain is left in a cone, the central core stays wet much longer (Figure 4).
Careful management
Run the drying fan when the outdoor humidity is between 60% and 65%
The temperature and moisture (humidity) of the outside air determines the final moisture of the grain. This is called the “equilibrium moisture content” (EMC). EMC is different for every grain and it changes as the temperature and humidity of the air change. If fans are run when the predicted EMC is very high, the grain moisture level can actually increase. In most cases, air between 60% and 65% relative humidity will dry most crops to an acceptable moisture level for storage.
Appendix B contains EMC charts for corn, soybeans, soft wheat and hard wheat. Online tools are also available to estimate EMC based on the weather forecast (for example, BinCast).
Do not turn off the fan when drying corn
Always run the fan continuously when drying corn, even during very humid/wet weather or when EMC is very high, until corn at the top of the bin is dry. If the fan is turned off early, the drying front may “stall,” and drying may not continue when the fan is restarted. The risk of the front stalling is much greater than the risk of re-wetting corn in bad weather.
Once the corn at the top of the bin has begun to dry, check the moisture level. Is it still too wet? If so, continue to run the fan intermittently, turning it on only when the relative humidity will achieve good drying (for example, relative humidity below 65%).
Consider installing a humidistat to automatically control the fan based on weather conditions. A temperature and moisture monitoring cable system can also be programmed to control the fan. This can reduce fan run-times to save energy costs during aeration and drying.
Run the fan intermittently when drying beans or wheat
Soybeans and wheat dry more easily than corn and don’t have the same risk of the drying front stalling. Beans and wheat also absorb moisture more easily than corn. Running the fan in damp weather can quickly undo any drying progress. Pay attention to the weather and only run the fan when the EMC charts indicate good drying (for example, relative humidity below 65%). Like corn, control the fan automatically with a humidistat or a cable monitoring system.
Speed up drying by adding supplemental heat
Warming the incoming air will lower its relative humidity, which results in lower EMC for the grain. This increases the opportunity to run the drying fan and speeds up drying. However, be careful. If too much heat is added, the grain EMC will be very low and the grain will be over-dried.
Normally, only a small amount of heat is needed to reach the desired moisture level. Warming the air by 5°C–8°C lowers relative humidity by 20%–30%. Add 1.5–3.0 kW of heat for every 470 L/s (5,000–10,000 BTU/h for every 1,000 CFM) of fan airflow to achieve this temperature gain.
If the fan motor is in the airstream (for example, vane-axial or inline centrifugal fans), air moving over the motor will often warm up by about 1°C. This lowers the relative humidity by 3%–5%, resulting in slightly lower EMC.
Best heating systems
There are several options for supplemental heaters to improve drying speed:
- A low-temperature propane or natural gas heater, available from many bin fan manufacturers.
- Electric heaters in front of the fan.
- A radiator in front of the fan, connected to a nearby heat source (for example, a boiler in a shop).
- Solar heating panels to warm air using solar energy. Temperature increases of 5°C–6°C during the day are possible, although the average over a 24-hr period is normally closer to 0.5°C–1°C.
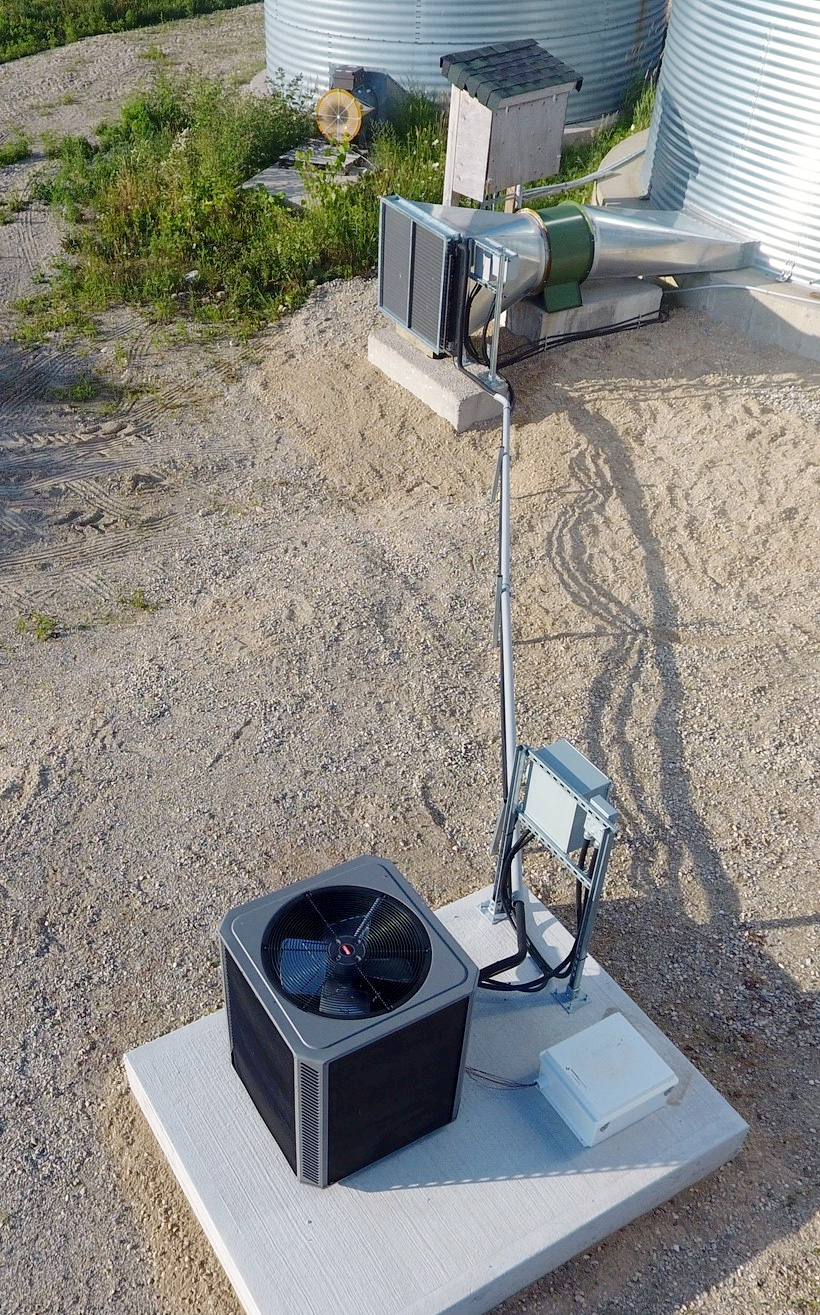
- A heat pump system (Figure 5). A recent test of a heat pump-based grain dryer in Ontario had a coefficient of performance (COP) of 6.93, meaning it “produced” 6.93 units of heat for every 1 unit of energy used to run the heat pump.
Solar and heat pump systems cost more to install than a fuel-fired heater, however they may cost less to operate. For example, a heat pump with 6.93 COP is about 7 times more efficient than a propane heater. Even though the cost of electricity is higher than that of propane, the high efficiency of the heat pump resulted in a 60% lower operating cost for the heat pump compared to a propane-fired heater, and a similar operating cost to a natural gas heater.
Does burning propane add water to the air
Burning propane (or any fuel) produces water vapour. One litre of propane produces about 0.8 L of water. One cubic metre of natural gas produces about 1.6 L of water. However, the airflow and the increased air temperature during grain drying minimizes the impact of this extra water.
If outdoor air conditions are 0°C and 90% relative humidity, and the drying air is heated up by 5°C, relative humidity will drop to 63%. The extra water added by a propane heater will increase the final relative humidity to 66%. In both cases, good drying can still be achieved and the impact of water from fuel combustion is not significant.
Drying Times
It can take several weeks to fully dry grain using natural air. The exact time depends on a complex relationship between grain moisture, weather and fan airflow.
Later in the drying season, drying often takes much longer and the final moisture may not reach the desired storage level. Adding a small amount of heat speeds up drying and results in lower final moisture.
Drying time examples
The following examples give estimated drying times using natural air for various crops, in days, and final moisture content after drying, in percent wet basis. Weather conditions are based on 30-year averages for London, Ontario. All drying conditions assume 2 CFM per bushel of airflow. The heat gains are based on propane and include the impact of extra water vapour.
Crop conditions at harvest (for all months):
- corn: 22% harvest moisture
- soybeans: 18% harvest moisture
- soft wheat: 20% harvest moisture
- hard wheat: 20% harvest moisture
September
Weather conditions without supplemental heat (16°C, 60% relative humidity):
- corn dries in 14 days to 13.3% moisture
- soybeans dry in 13 days to 10.5% moisture
- soft wheat dries in 12 days to 12.7% moisture
- hard wheat dries in 13 days to 13.7% moisture
October
Weather conditions without supplemental heat (9°C, 63% relative humidity):
- corn dries in 20 days to 14.5% moisture
- soybeans dry in 18 days to 11.6% moisture
- soft wheat dries in 16 days to 13.4% moisture
- hard wheat dries in 19 days to 14.7% moisture
November
Weather conditions without supplemental heat (3°C, 72% relative humidity):
- corn dries in 52 days to 17.0% moisture
- soybeans dry in 56 days to 14.2% moisture
- soft wheat dries in 36 days to 15.0% moisture
- hard wheat dries in 51 days to 16.6% moisture
Weather conditions using 1.5 kW (5,000 BTU/h) supplemental heat per 470 L/s (1,000 CFM) (6°C, 62% relative humidity):
- corn dries in 27 days to 14.6% moisture
- soybeans dry in 27 days to 11.4% moisture
- soft wheat dries in 20 days to 13.5% moisture
- hard wheat dries in 20 days to 14.8% moisture
Weather conditions using 3.0 kW (10,000 BTU/h) supplemental heat per 470 L/s (1,000 CFM) (9°C, 53% relative humidity):
- corn dries in 21 days to 12.8% moisture
- soybeans dry in 21 days to 9.4% moisture
- soft wheat dries in 16 days to 12.2% moisture
- hard wheat dries in 16 days to 13.3% moisture
December
Weather conditions without supplemental heat (-3°C, 77% relative humidity):
- corn dries in 88 days to 19.0% moisture
- soybeans dry in 108 days to 16.1% moisture
- soft wheat dries in 50 days to 16.2% moisture
- hard wheat dries in 92 days to 18.2% moisture
Weather conditions using 1.5 kW (5,000 BTU/h) supplemental heat per 470 L/s (1,000 CFM) (0°C, 66% relative humidity):
- corn dries in 35 days to 16.3% moisture
- soybeans dry in 37 days to 12.8% moisture
- soft wheat dries in 25 days to 14.4% moisture
- hard wheat dries in 25 days to 16.0% moisture
Weather conditions using 3.0 kW (10,000 BTU/h) supplemental heat per 470 L/s (1,000 CFM) (3°C, 56% relative humidity):
- corn dries in 35 days to 14.2% moisture
- soybeans dry in 37 days to 10.5% moisture
- soft wheat dries in 25 days to 13.1% moisture
- hard wheat dries in 26 days to 14.3% moisture
Common natural-air drying problems
Drying is taking longer than expected
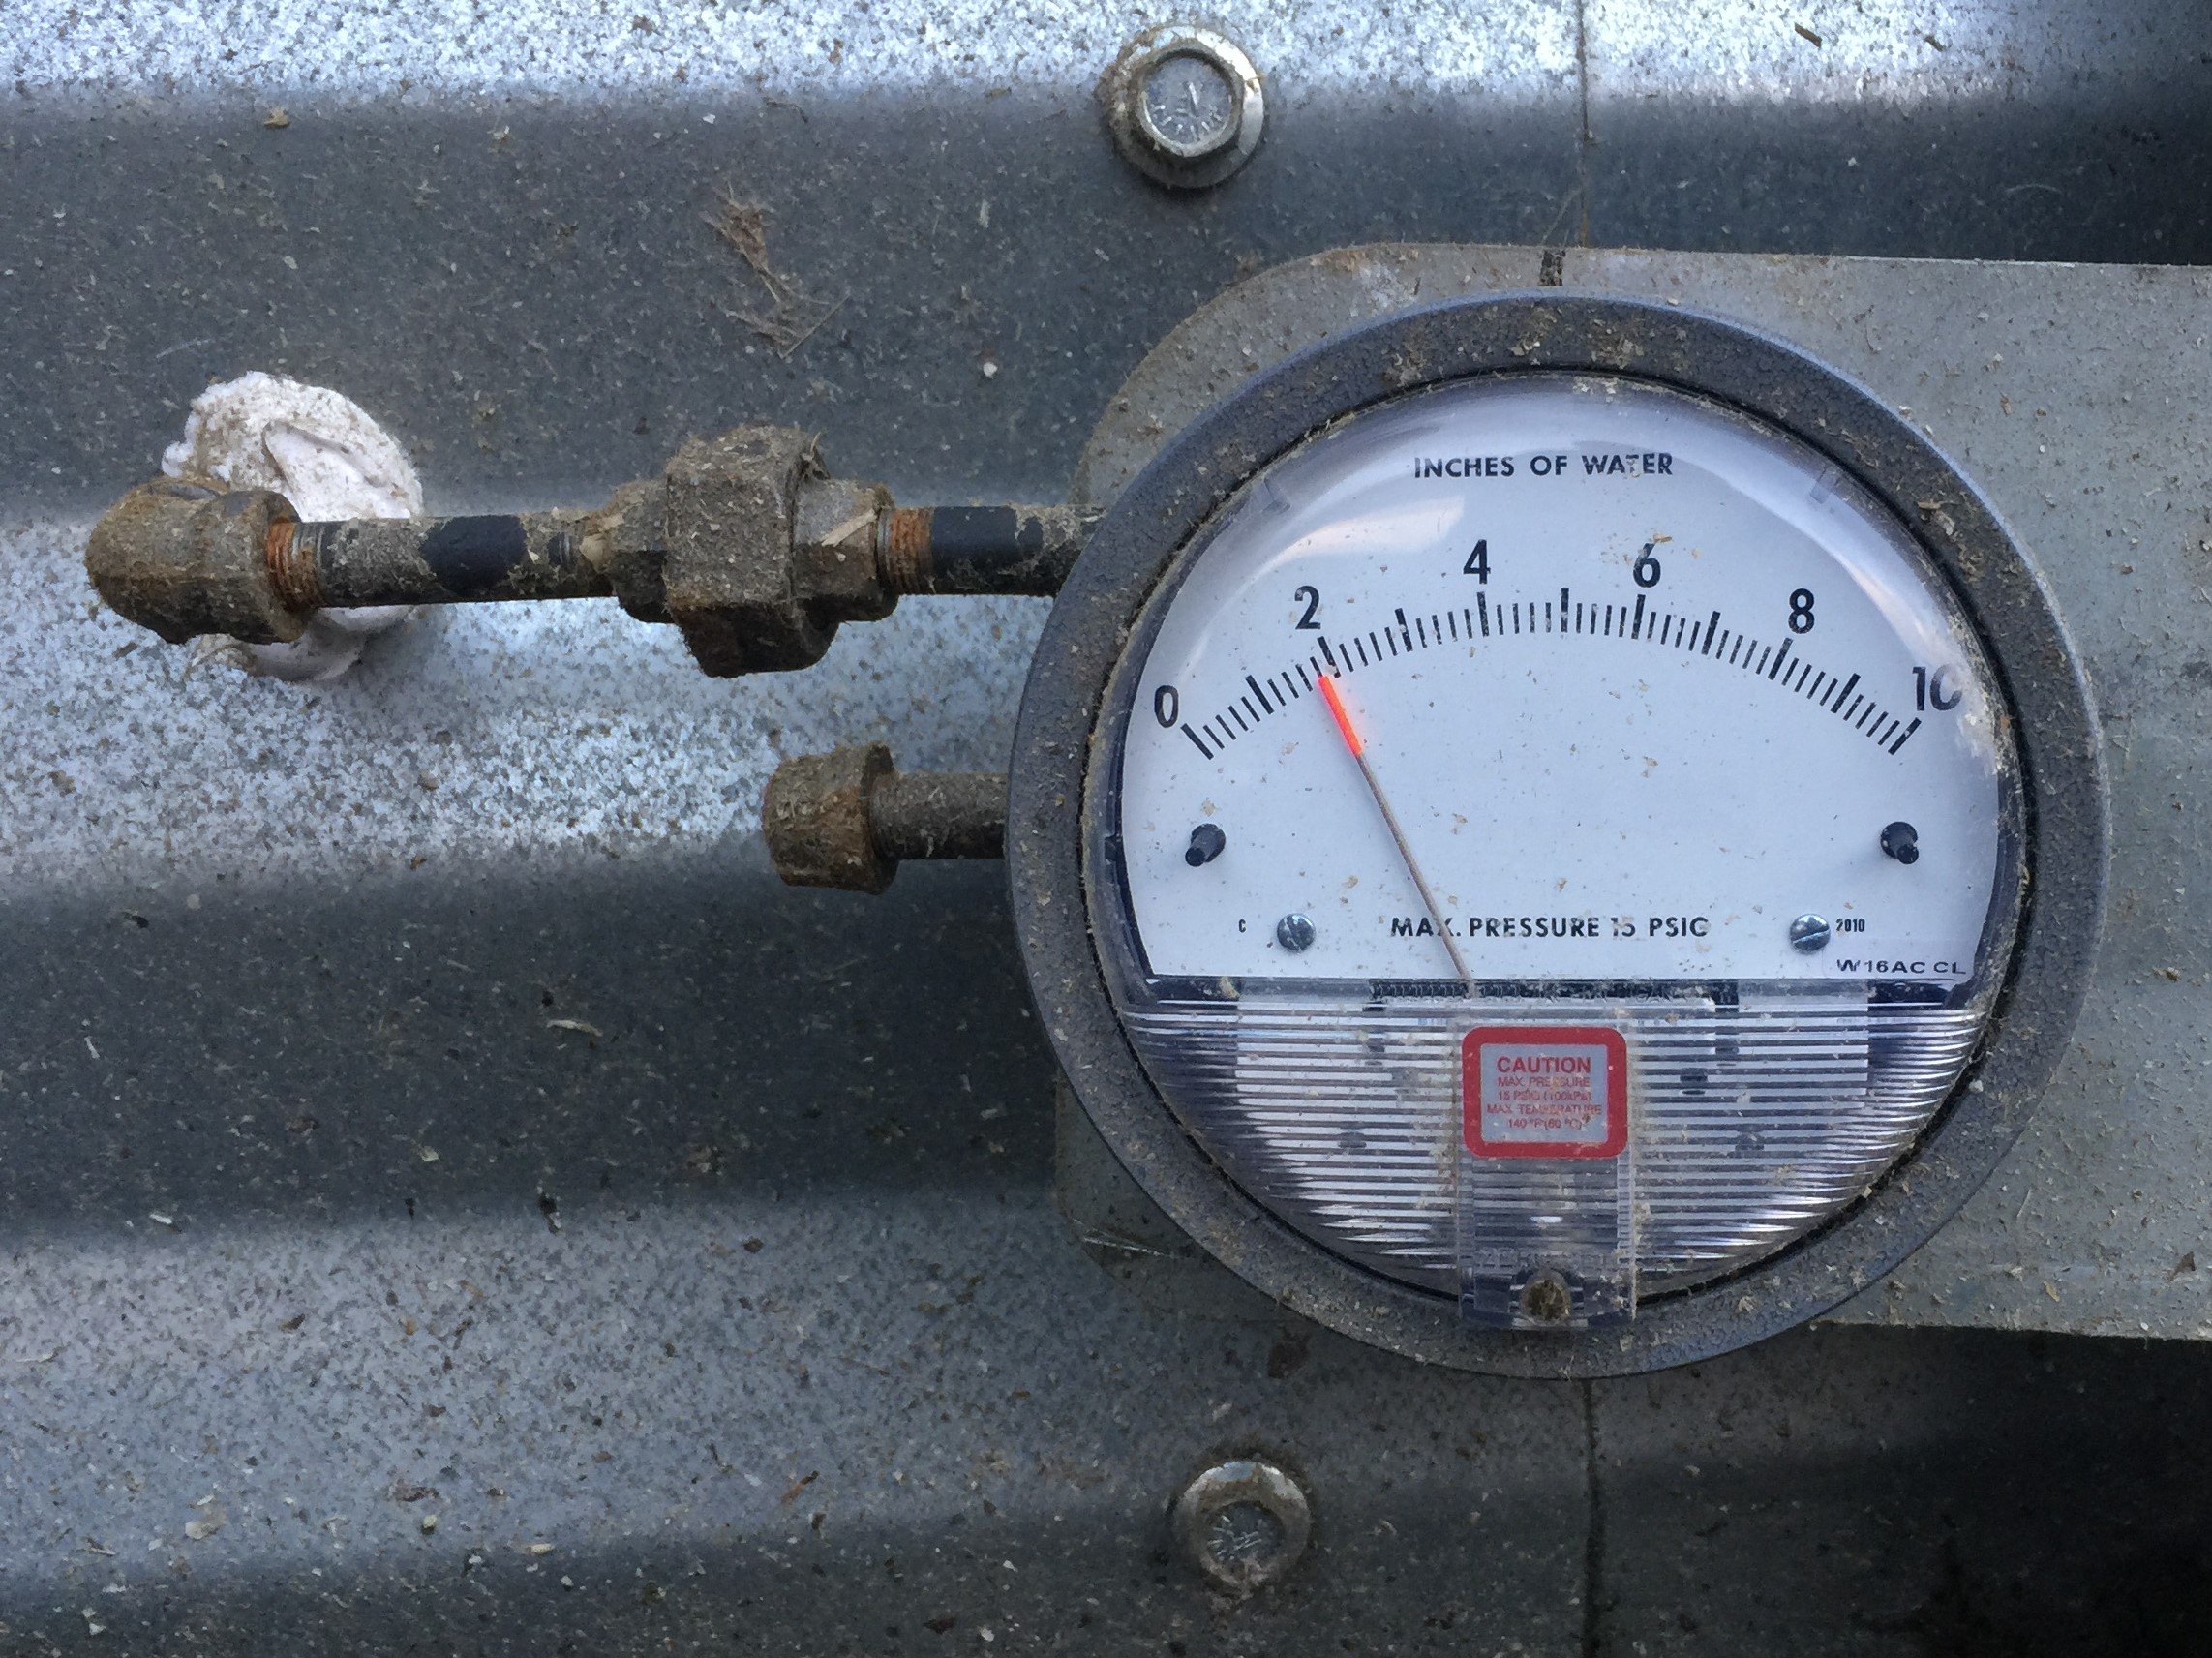
- The static pressure may be higher than expected, resulting in lower airflow. To check the static pressure, drill a small hole in the bin wall, below the floor, opposite from the fan. Insert a tube into the bin and connect it to a pressure gauge that reads in Pascals or inches of water column (Figure 6). When the fan is running, the gauge will show the static pressure in the bin. Look at the fan performance chart (available from the fan manufacturer) to confirm the fan airflow at that static pressure.
- The duct connecting the fan to the bin can create a lot of backpressure, especially at high flow rates. Measure static pressure directly behind the fan using a static pressure measurement tube (Figure 7) connected to a static pressure gauge (Figure 6). Then measure static pressure below the bin floor as described above. If there is a large pressure difference in these two measurements, contact the bin manufacturer to discuss options (for example, adjusting the ductwork or modifying the floor supports for better airflow).
- Measure the static pressure in the attic space below the bin roof. This pressure reading should be zero or nearly zero. Add more vents if necessary to reduce static pressure and allow air to escape more easily.
- Reduce the amount of grain in the bin to increase the effective airflow per bushel, for faster drying.
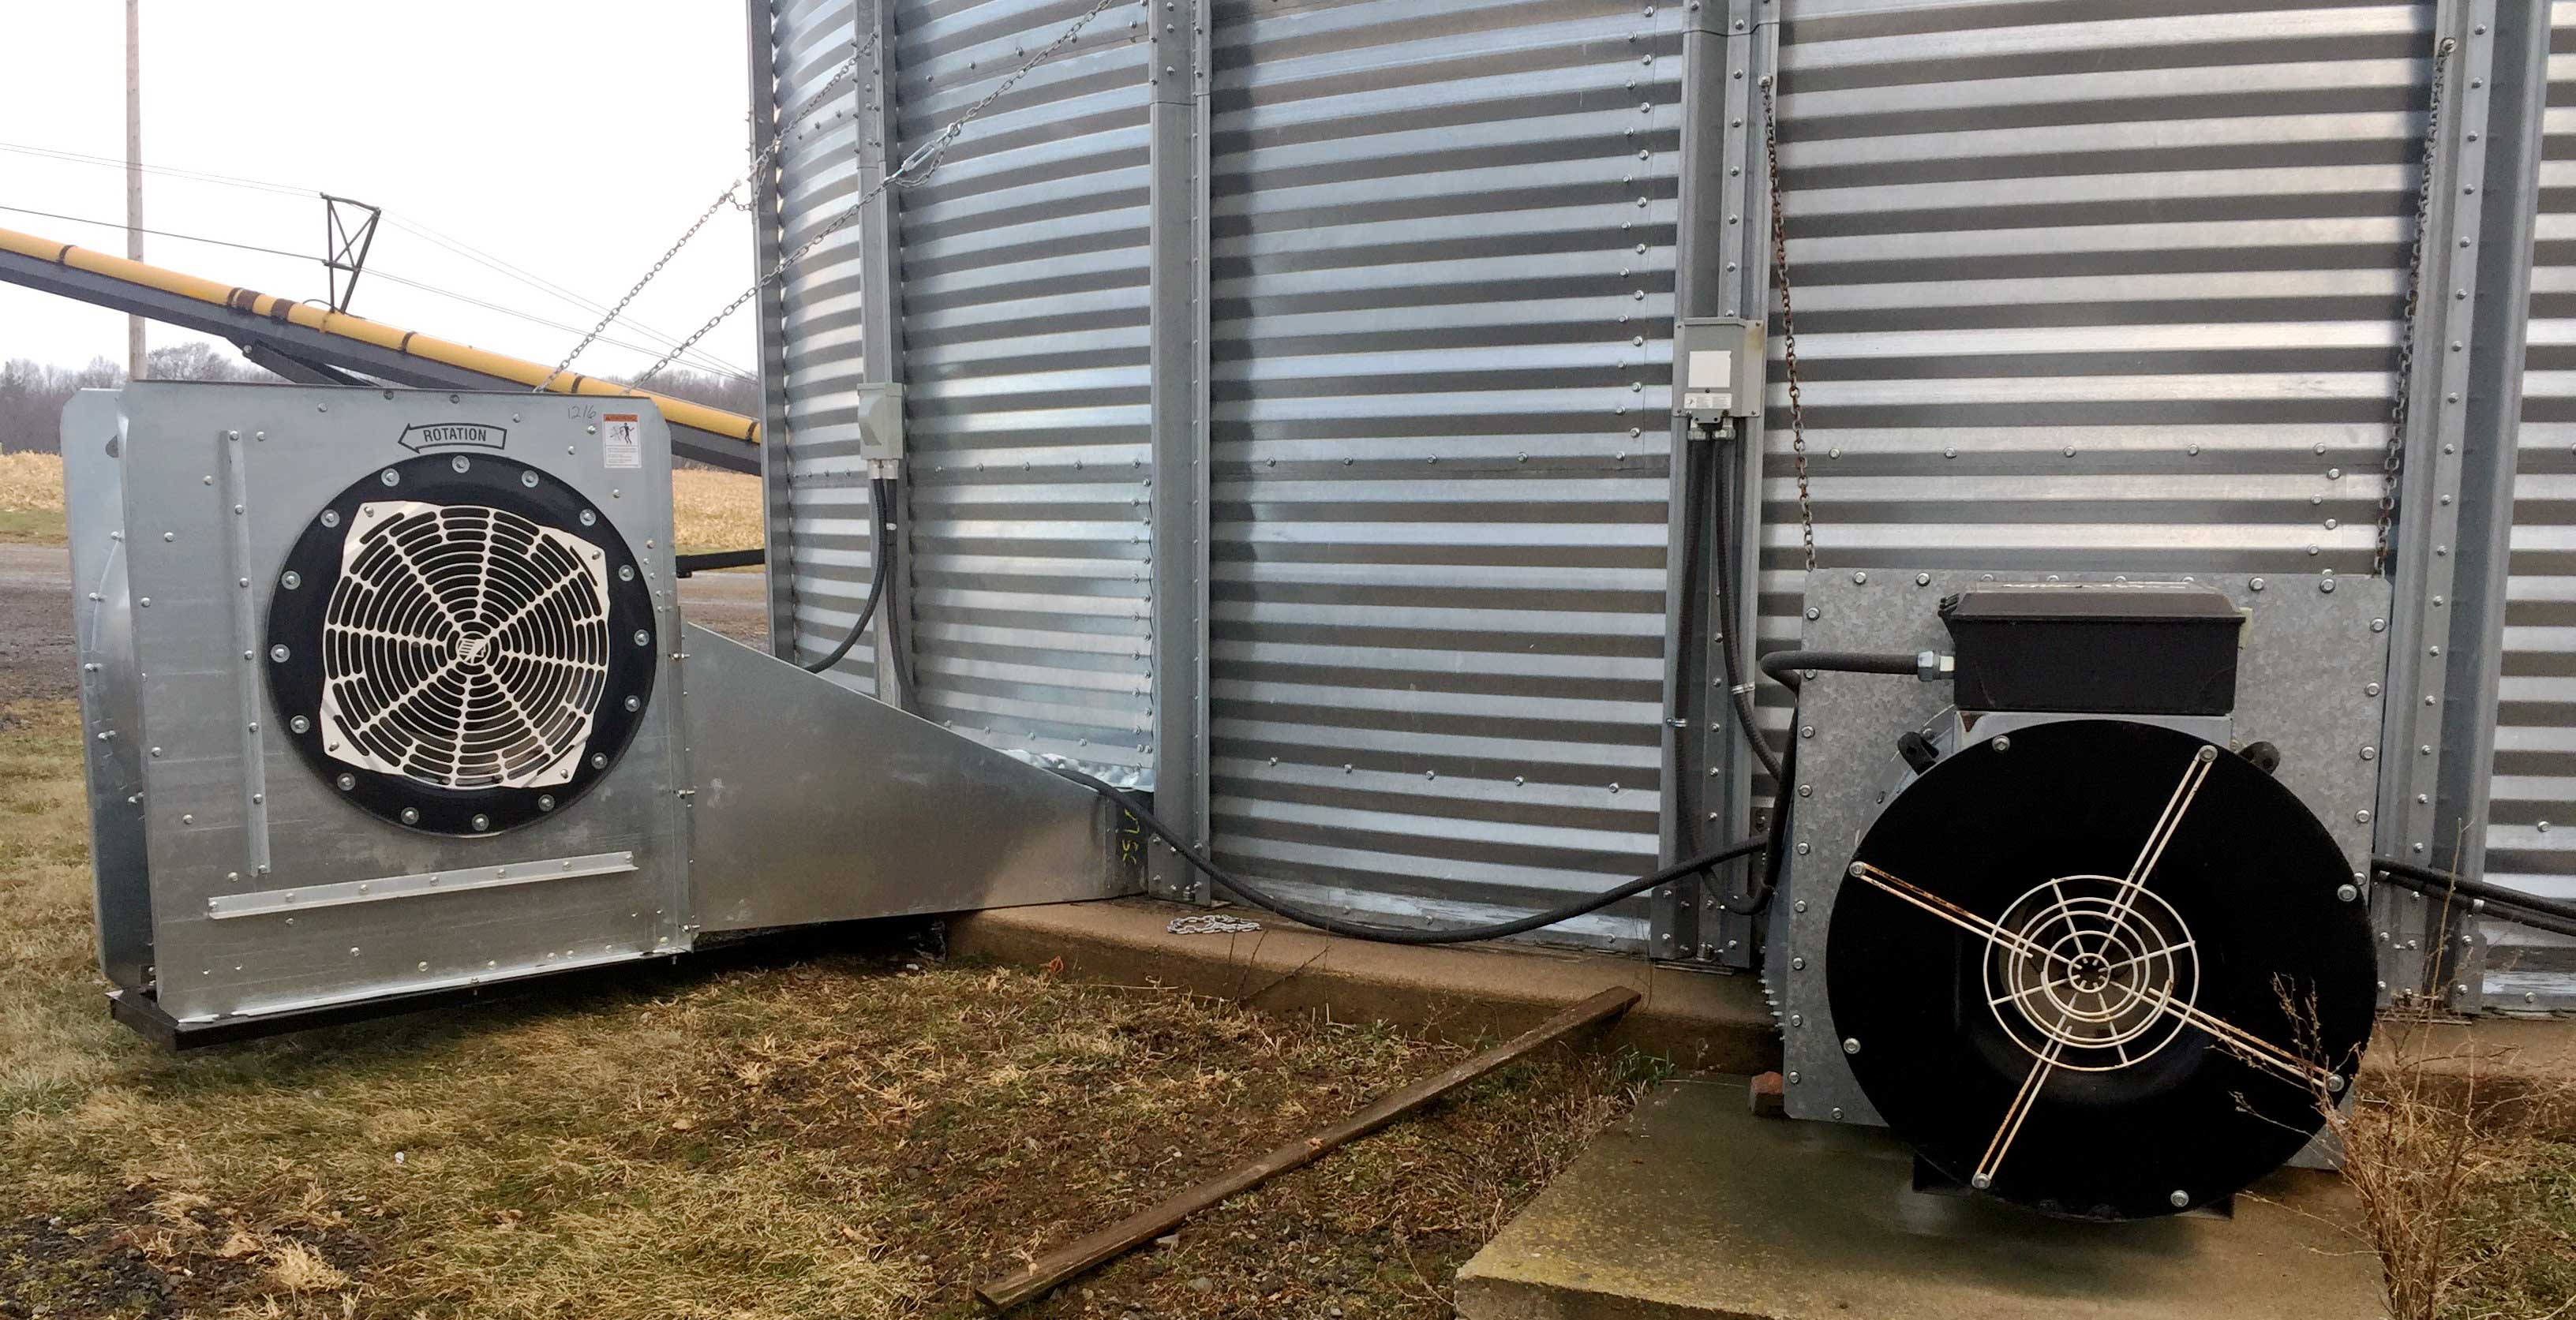
- Add a second fan to increase the total airflow for drying. It is best if fans are identical, but different types can be used together if their performance is similar (Figure 8).

If possible, sample the grain near the bin floor to check whether grain is being over-dried. Use moisture monitoring cables or install sampling ports in the bin wall (Figure 1). If grain is over-dried, consider running the fan during slightly higher humidity conditions. This provides additional fan run time and drying will still progress even as the bottom of the bin re-wets slightly.
Verify local weather conditions. Humidity is difficult to measure, and many lower-cost devices may be inaccurate by several percent in regular operation. Higher-than-expected humidity will result in slower drying.
Verify that the correct moisture chart is being used (Appendix B). Different grains dry to different moistures under the same air conditions.
Add a small amount of supplemental heat to reduce relative humidity, speed up drying and reduce the final moisture level. Be careful not to over-dry and only use supplemental heat when the outdoor humidity is above 70%.
Tough (damp) patches remain at the surface of the grain (often in the centre)
- Use extreme caution and use approved safety harnesses whenever entering a bin and walking on the grain surface.
- Airflow is often slightly lower in the centre of the bin due to fines. Carefully walk on the surface of the grain and/or probe the grain in a grid pattern to estimate what depth and area of grain is still tough. Wet grain is often tighter and can be identified by how easily it supports weight.
- Spread out the remaining tough grain, even if this results in an uneven surface. Continue drying until all remaining tough spots are dry.
- If only a small amount of tough grain remains, it may be practical to blend the wet and dry grain during bin unloading.
Grain is not dry enough
- Weather conditions likely were not suitable to dry the grain completely. Look at the moisture charts (Appendix B) to find the air temperature and humidity needed to reach the desired moisture level. Continue to run the fan intermittently, only when weather conditions are below this level.
- Add a small amount of supplemental heat to reduce relative humidity, speed up drying and reduce the final moisture level. Be careful not to over-dry and only use supplemental heat when the outdoor humidity is above 70%.
- Look for other marketing opportunities or buyers who may be willing to accept grain at slightly higher moisture levels.
The weather has turned cold and grain seems unlikely to dry
- During very cold weather (for example, below 0°C), minimal drying will occur. Look at allowable storage time (AST) charts to check whether spoilage is likely to occur while waiting for better weather (Appendix A). Remember, AST is cumulative. Ensure the grain temperature is at or below freezing, then consider shutting off the fan.
- Monitor the bin frequently, looking for any signs of spoilage or heating (for example, condensation forming underneath the bin roof) and run aeration fans regularly to keep grain cold over winter.
- When milder weather returns, re-start the fan to continue drying the grain. Conditions in early spring are often excellent for drying. Drying can often be completed quickly once warmer weather arrives.
- Look for other marketing opportunities or buyers who may be willing to accept grain at slightly higher moisture levels.
Summary
Natural-air grain drying is both possible and practical in Ontario. This gentle drying process results in higher-quality grain, free of stress cracks and heat damage, and can reduce energy costs. High-quality grain can bring higher prices and more revenue.
Successful drying requires good airflow, grain in good condition and careful management. Natural‑air drying is most effective early in the drying season. For later-season drying (November and beyond), natural air alone will likely not be enough. Add supplemental heat and/or increase airflow for faster drying. If drying cannot be completed before winter, monitor the grain closely and re-start drying in early spring.
Appendix A: Allowable storage time charts
Allowable storage time (AST) for corn is based on the American Society of Agricultural and Biological Engineers (ASABE) Standard D535, Shelled Corn Storage Time for 0.5% Dry Matter Loss. Allowable storage time for soybeans and cereals are based on tables published by North Dakota State University.
| Grain Kernel Temperature | Grain Moisture Content 15% | Grain Moisture Content 18% | Grain Moisture Content 20% | Grain Moisture Content 22% | Grain Moisture Content 24% | Grain Moisture Content 26% | Grain Moisture Content 28% | Grain Moisture Content 30% |
|---|---|---|---|---|---|---|---|---|
| -1°C | > 300 | > 300 | > 300 | 190 | 127 | 94 | 74 | 61 |
| 4°C | > 300 | 288 | 142 | 84 | 56 | 41 | 32 | 27 |
| 10°C | > 300 | 128 | 63 | 37 | 25 | 18 | 14 | 12 |
| 16°C | 225 | 56 | 28 | 17 | 11 | 8 | 7 | 5 |
| 21°C | 125 | 31 | 16 | 9 | 6 | 5 | 4 | 3 |
| 27°C | 87 | 17 | 9 | 5 | 4 | 3 | 2 | 2 |
| Grain Kernel Temperature | Grain Moisture Content 11% | Grain Moisture Content 12% | Grain Moisture Content 13% | Grain Moisture Content 14% | Grain Moisture Content 15% | Grain Moisture Content 16% | Grain Moisture Content 17% | Grain Moisture Content 19% | Grain Moisture Content 21% | Grain Moisture Content 23% |
|---|---|---|---|---|---|---|---|---|---|---|
| -1°C | > 300 | > 300 | > 300 | > 300 | > 300 | > 300 | > 300 | 190 | 130 | 90 |
| 4°C | > 300 | > 300 | > 300 | 280 | 200 | 140 | 90 | 60 | 40 | 35 |
| 10°C | > 300 | > 300 | 230 | 130 | 90 | 70 | 50 | 30 | 15 | 12 |
| 16°C | > 300 | 240 | 120 | 75 | 50 | 35 | 25 | 15 | 10 | 8 |
| 21°C | 200 | 125 | 70 | 45 | 30 | 20 | 14 | 8 | 6 | 5 |
| 27°C | 140 | 70 | 40 | 20 | 15 | 10 | 7 | 3 | 2 | 2 |
| Grain Kernel Temperature | Grain Moisture Content 14% | Grain Moisture Content 15% | Grain Moisture Content 16% | Grain Moisture Content 17% | Grain Moisture Content 18% | Grain Moisture Content 19% | Grain Moisture Content 20% | Grain Moisture Content 22% | Grain Moisture Content 24% | Grain Moisture Content 26% |
|---|---|---|---|---|---|---|---|---|---|---|
| -1°C | > 300 | > 300 | > 300 | > 300 | > 300 | > 300 | > 300 | 190 | 130 | 90 |
| 4°C | > 300 | > 300 | > 300 | 280 | 200 | 140 | 90 | 60 | 40 | 35 |
| 10°C | > 300 | > 300 | 230 | 130 | 90 | 70 | 50 | 30 | 15 | 12 |
| 16°C | > 300 | 240 | 120 | 75 | 50 | 35 | 25 | 15 | 10 | 8 |
| 21°C | 200 | 125 | 70 | 45 | 30 | 20 | 14 | 8 | 6 | 5 |
| 27°C | 140 | 70 | 40 | 20 | 15 | 10 | 7 | 3 | 2 | 2 |
Appendix B: Equilibrium moisture content charts
Equilibrium moisture contents have been calculated using the Modified Chung-Pfost method as described in the American Society of Agricultural and Biological Engineers (ASABE) Standard D245.6, Moisture Relationships of Plant-based Agricultural Products.
| Air Temperature | Relative Humidity 50% | Relative Humidity 60% | Relative Humidity 70% | Relative Humidity 80% | Relative Humidity 90% |
|---|---|---|---|---|---|
| 0°C | 13.7% | 15.1% | 16.6% | 18.4% | 21.3% |
| 5°C | 13.1% | 14.4% | 15.9% | 17.8% | 20.7% |
| 10°C | 12.5% | 13.8% | 15.4% | 17.3% | 20.2% |
| 15°C | 11.9% | 13.3% | 14.9% | 16.8% | 19.8% |
| 20°C | 11.5% | 12.8% | 14.4% | 16.4% | 19.4% |
| 25°C | 11.0% | 12.4% | 14.0% | 16.0% | 19.0% |
| 30°C | 10.6% | 12.0% | 13.6% | 15.6% | 18.7% |
| Air Temperature | Relative Humidity 50% | Relative Humidity 60% | Relative Humidity 70% | Relative Humidity 80% | Relative Humidity 90% |
|---|---|---|---|---|---|
| 0°C | 10.0% | 11.8% | 13.7% | 16.2% | 19.8% |
| 5°C | 9.8% | 11.5% | 13.5% | 15.9% | 19.6% |
| 10°C | 9.5% | 11.2% | 13.2% | 15.7% | 19.4% |
| 15°C | 9.2% | 11.0% | 13.0% | 15.5% | 19.2% |
| 20°C | 9.0% | 10.7% | 12.8% | 15.2% | 19.0% |
| 25°C | 8.7% | 10.5% | 12.5% | 15.0% | 18.8% |
| 30°C | 8.5% | 10.3% | 12.3% | 14.8% | 18.6% |
| Air Temperature | Relative Humidity 50% | Relative Humidity 60% | Relative Humidity 70% | Relative Humidity 80% | Relative Humidity 90% |
|---|---|---|---|---|---|
| 0°C | 12.5% | 13.5% | 14.6% | 16.1% | 18.2% |
| 5°C | 12.1% | 13.1% | 14.2% | 15.7% | 17.9% |
| 10°C | 11.7% | 12.7% | 13.9% | 15.3% | 17.5% |
| 15°C | 11.4% | 12.4% | 13.5% | 15.0% | 17.2% |
| 20°C | 11.1% | 12.1% | 13.2% | 14.7% | 17.0% |
| 25°C | 10.8% | 11.8% | 13.0% | 14.4% | 16.7% |
| 30°C | 10.5% | 11.5% | 12.7% | 14.2% | 16.5% |
| Air Temperature | Relative Humidity 50% | Relative Humidity 60% | Relative Humidity 70% | Relative Humidity 80% | Relative Humidity 90% |
|---|---|---|---|---|---|
| 0°C | 13.3% | 14.6% | 16.1% | 17.9% | 20.7% |
| 5°C | 12.9% | 14.2% | 15.7% | 17.5% | 20.3% |
| 10°C | 12.6% | 13.9% | 15.3% | 17.2% | 20.0% |
| 15°C | 12.2% | 13.5% | 15.0% | 16.9% | 19.7% |
| 20°C | 11.9% | 13.2% | 14.7% | 16.6% | 19.5% |
| 25°C | 11.6% | 12.9% | 14.4% | 16.3% | 19.2% |
| 30°C | 11.3% | 12.6% | 14.2% | 16.1% | 19.0% |
This fact sheet was revised by James Dyck, P.Eng., engineering specialist, crop systems and environment, OMAFRA and reviewed by Steve Clarke, P.Eng., engineering specialist, energy and crop systems, OMAFRA and Greg Dineen, P.Eng., APS Dineen Farms, Kenilworth ON.