Socioeconomic facts and data about rural Ontario
Find historical information about rural Ontario’s population characteristics and key rural economic and labour force indicators.
Overview
Data sources: Most of the data presented are estimates made by Ministry of Agriculture, Food and Agribusiness (OMAFA) staff using relevant publications from Statistics Canada. The covered period depends on the availability of data in the following date ranges:
- Population count data is available from 1966–2021 (by census year). Population age breakdown is available from 1966–2021. All census variables will be updated every 5 years.
- Educational attainment data is available from 1976–2021 census years.
- Immigration data is available from 1971–2021 census years. Immigration data is not available for the 1976 census year.
- Racialized groups data is available from 1996–2021 census years.
- Data on Indigenous peoples (First Nations people, Métis and Inuit in Canada) is available from 1986–2021 census years. Population data for Indigenous peoples is not available for the 2011 census year.
- Household income data is available from 1981–2021 census years.
- Annual labour force characteristics and industry employment data is available from 2006–2024. This data will be updated annually.
- Estimated annual gross domestic product (GDP) for rural Ontario is available from 2001–2023. This data will be updated annually.
- Rural business count data is available for December 2023. This data will be updated annually.
Disclaimer: OMAFA tries to ensure that the following facts are accurate and complete. However, products created, or conclusions drawn from such information are the responsibility of the user.
Defining rural Ontario
There are many ways to define rural Ontario. Across government rural areas are defined differently depending on the objective and focus of the program or policy.
For research and analysis, OMAFA defines rural Ontario as all the municipalities and Indigenous communities (First Nations, Metis or Inuit) that are not part of a census metropolitan area. Consequently, urban Ontario includes all municipalities within Statistics Canada’s census metropolitan areas (CMAs). A CMA is an area which has a total population of 100,000 or more and a core population of 50,000 or more. It also includes all neighbouring census subdivisions (CSDs) where 50% or more of the workforce commutes into the core.
In the 2021 census year, 81% of Ontario’s CSDs (469 total) were classified as rural (non-CMA), whereas 19% of Ontario’s CSDs (108 total) were classified as urban (CMA). Rural Ontario represents 96.2% of Ontario’s land area, or 81% (469) of Ontario’s CSDs were considered as rural (non-CMA).
Figure 1 shows the urban areas and rural areas in Ontario according to the 2021 census boundaries.
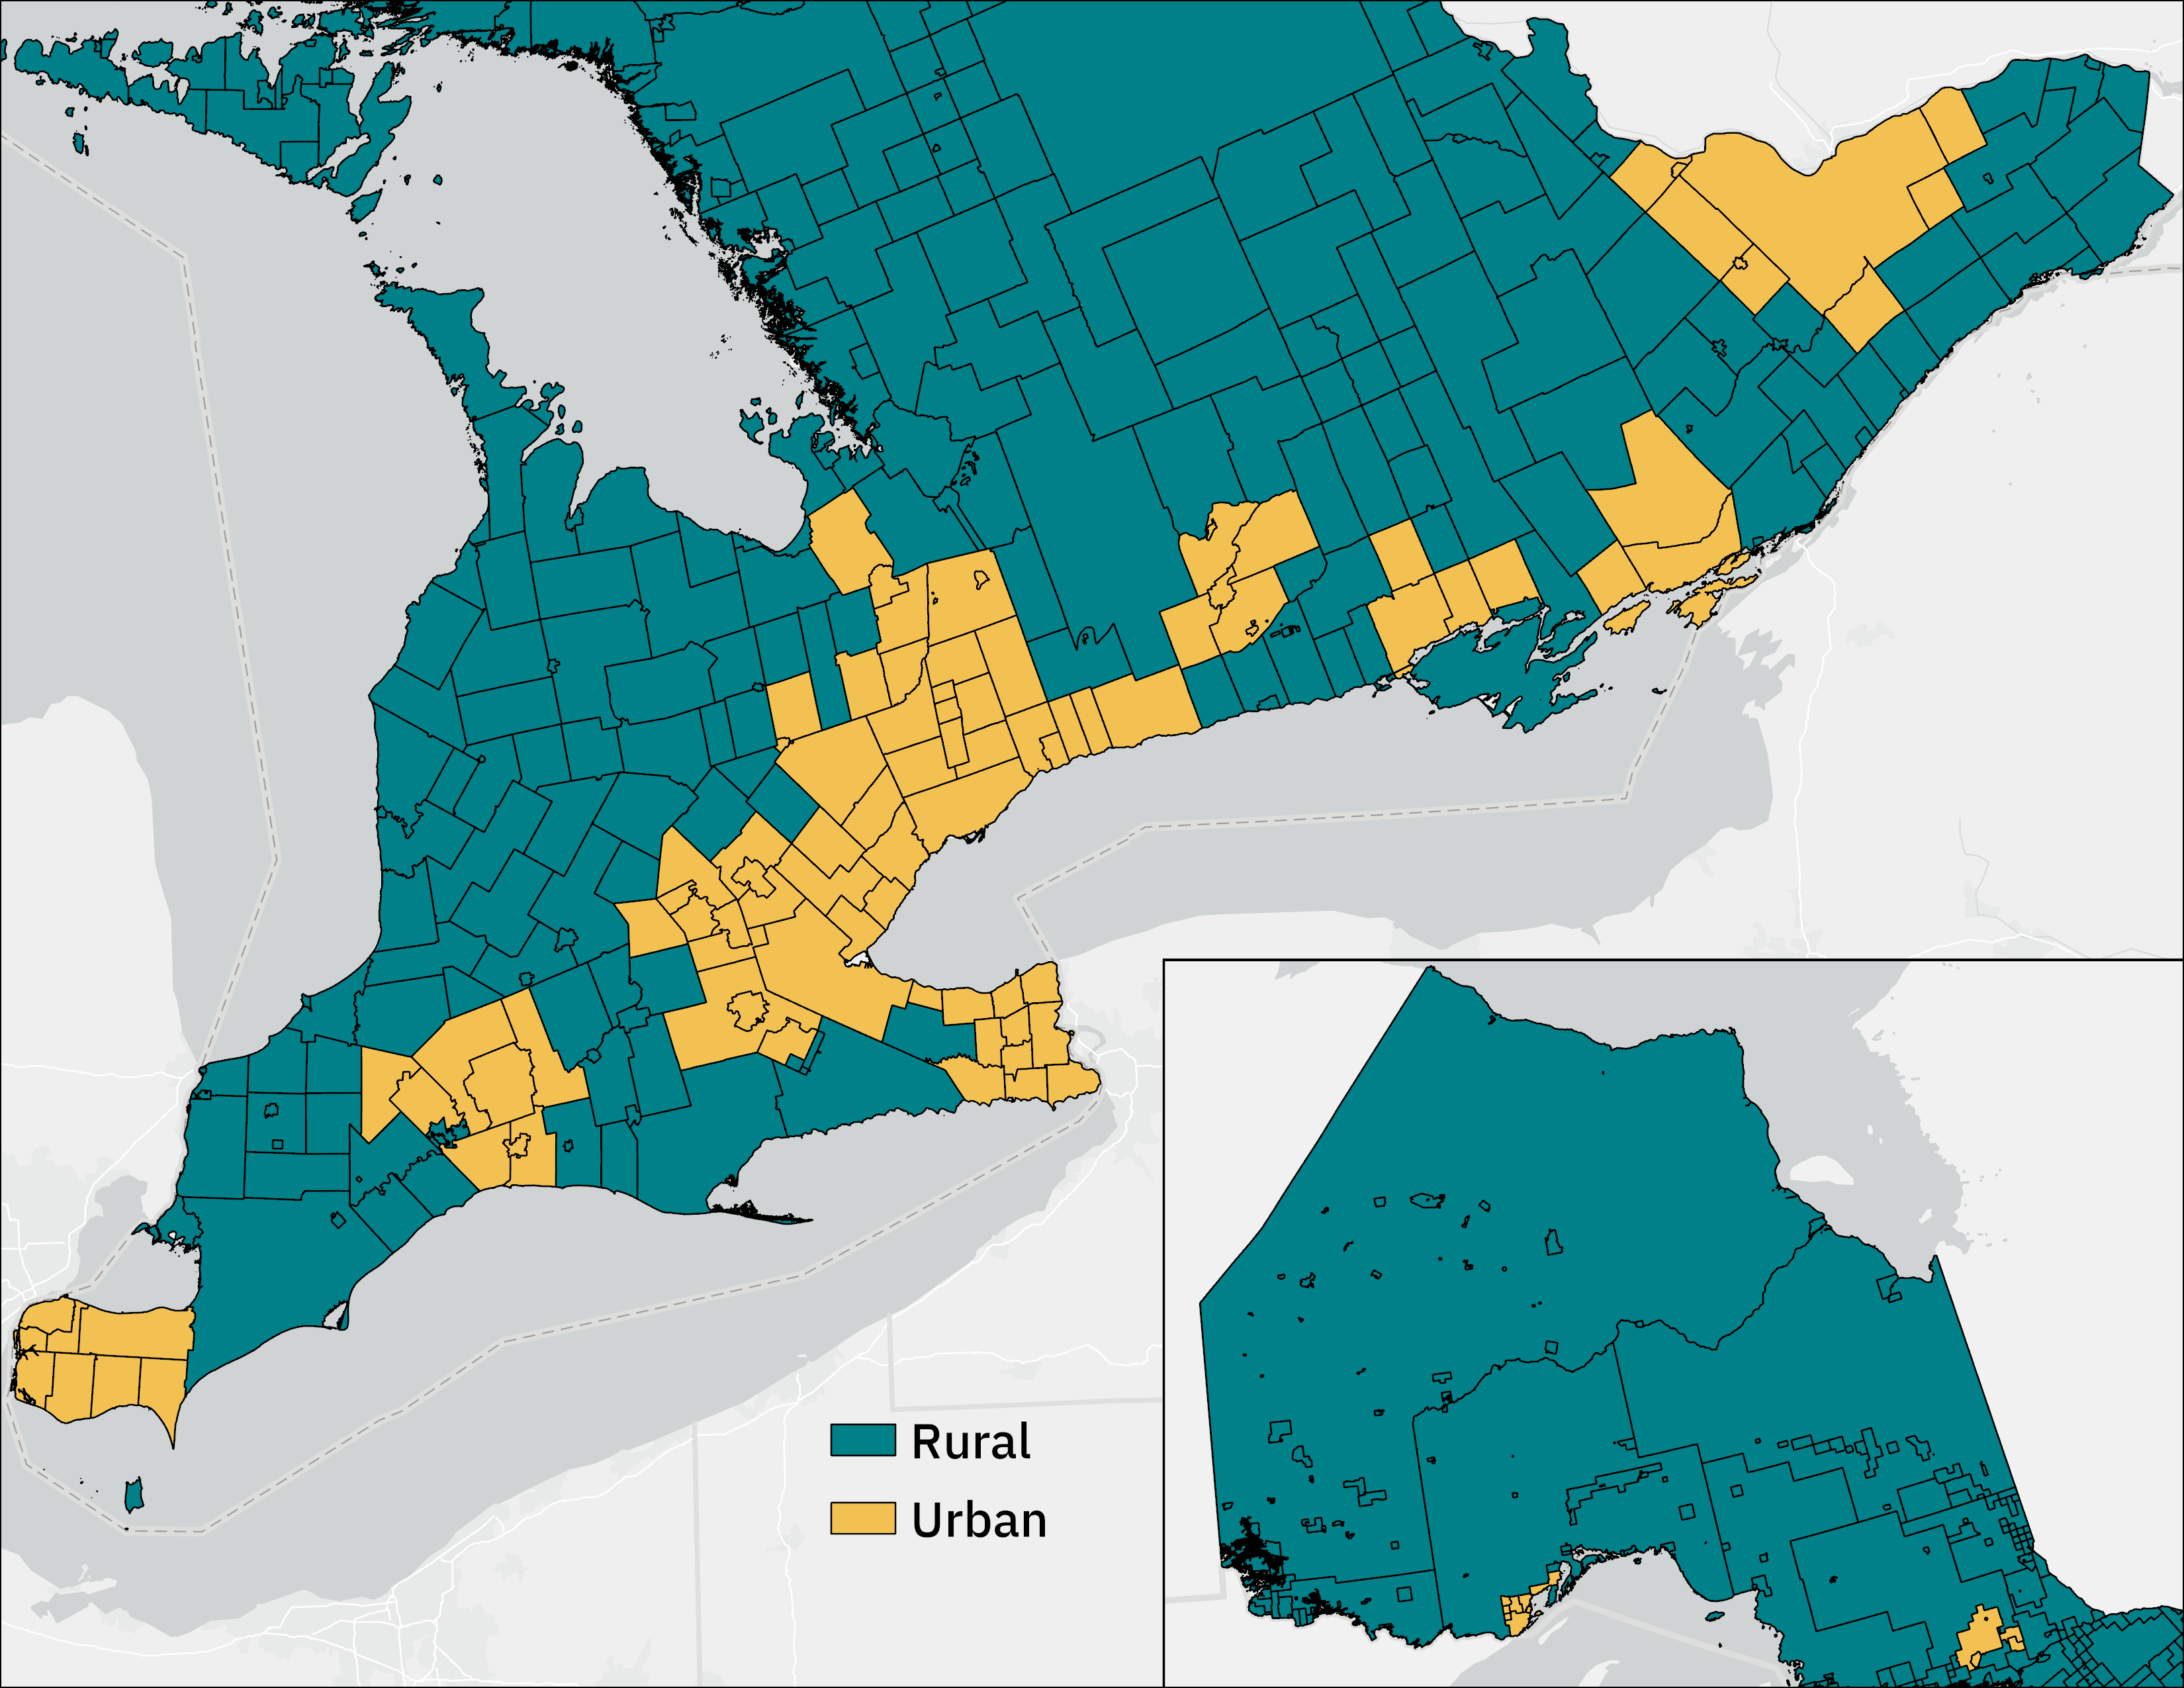
Source: Adapted from Statistics Canada
For additional information about geographical definitions, please visit Statistics Canada’s Dictionary, Census of Population, 2021.
Overview of demographics
Rural Ontario’s population is characterized by having a high proportion of working adults and seniors, a large proportion of population with educational level beyond high school and a diminishing proportion of immigrants and an increasing proportion of Indigenous and racialized population.
Population in most rural communities has been growing, especially during the latest 2 census periods. However, most successful rural CSDs in terms of population growth eventually become urban. Due to the loss of rural CSDs to CMAs, the number of people living in areas classified as rural has remained relatively steady since 1966 with rural population, as a proportion of the total Ontario population, declining over time. For example, in 1966, the proportion of the Ontario population living in rural Ontario was 37% (2.6 million out of 7.0 million people). In 2021, it was 17% (about 2.5 million out of 14.2 million people).
The loss of rural CSDs to urbanization biases down rural population growth over time. As a result, aggregate rural population estimates may not be indicative of actual population pressures in rural communities (refer to Demographics for more details).
Working-age adults (aged 15-64) represented almost 67% of the rural Ontario population in 2021. Seniors (aged 65 and older) and youth (aged 0–14) make up 24.4% and 15.5% of the population respectively.
Educational attainment in rural Ontario has improved overtime. In 1976, almost 67% of Ontario’s rural population had no high school diploma and only 22% had a certificate, diploma or degree from post-secondary education. By 2021, the percentage of people without a high school diploma was 19% and more than half (59%) of the population had a certificate, diploma or degree from post-secondary education.
The proportion of the rural population that are immigrants has been decreasing over time. In 1971, the percentage of immigrant population was 12.8% (336,155 immigrants). In 2021, it was 8.2% (198,090 immigrants).
Diversity among the rural population has been increasing over time. In 1996, 60,490 rural residents (1.9% of the rural population) were racialized population. In 2021, 104,070 rural residents (4.2% of the rural population) were racialized population.
The proportion of rural population that is Indigenous has increased from 1.4% in 1986 to 7.5% in 2021.
Overview of economy
Rural Ontario makes large contributions to provincial employment and the GDP.
In 2024, employment in rural Ontario represented 15.6% (1,255,400 jobs) of all provincial employment.
In 2023, rural Ontario’s GDP was estimated to be $113.3 billion (chained 2017 dollars) or 13.3% of Ontario’s total GDP.
In December 2023, 14.3% of Ontario’s businesses (an estimated 257,741 businesses) were located in rural Ontario.
Demographics
Population estimates
Statistics Canada adjusts its CMA boundaries for a given census year to account for the impacts of ongoing urbanization. When population in a census subdivision crosses some defined thresholds, it can be reclassified as a CMA and lose its rural status. For example, a census subdivision may be reclassified as a CMA if its population grows large enough (more than 10,000 people) or when at least 50% of the employed labour force commutes for work to the core of their neighbouring CMA. Alternatively, a population centre may grow and reach the threshold to be delineated as a new CMA and the complete population of the new CMA is reclassified from rural to urban. The expansion of CMA boundaries (urban areas) over time implies a reduction of non-CMAs (rural areas).
Figure 2 shows the expansion of existing Ontario’s CMA boundaries, as well as the addition of new CMAs, from 2001 to 2021.
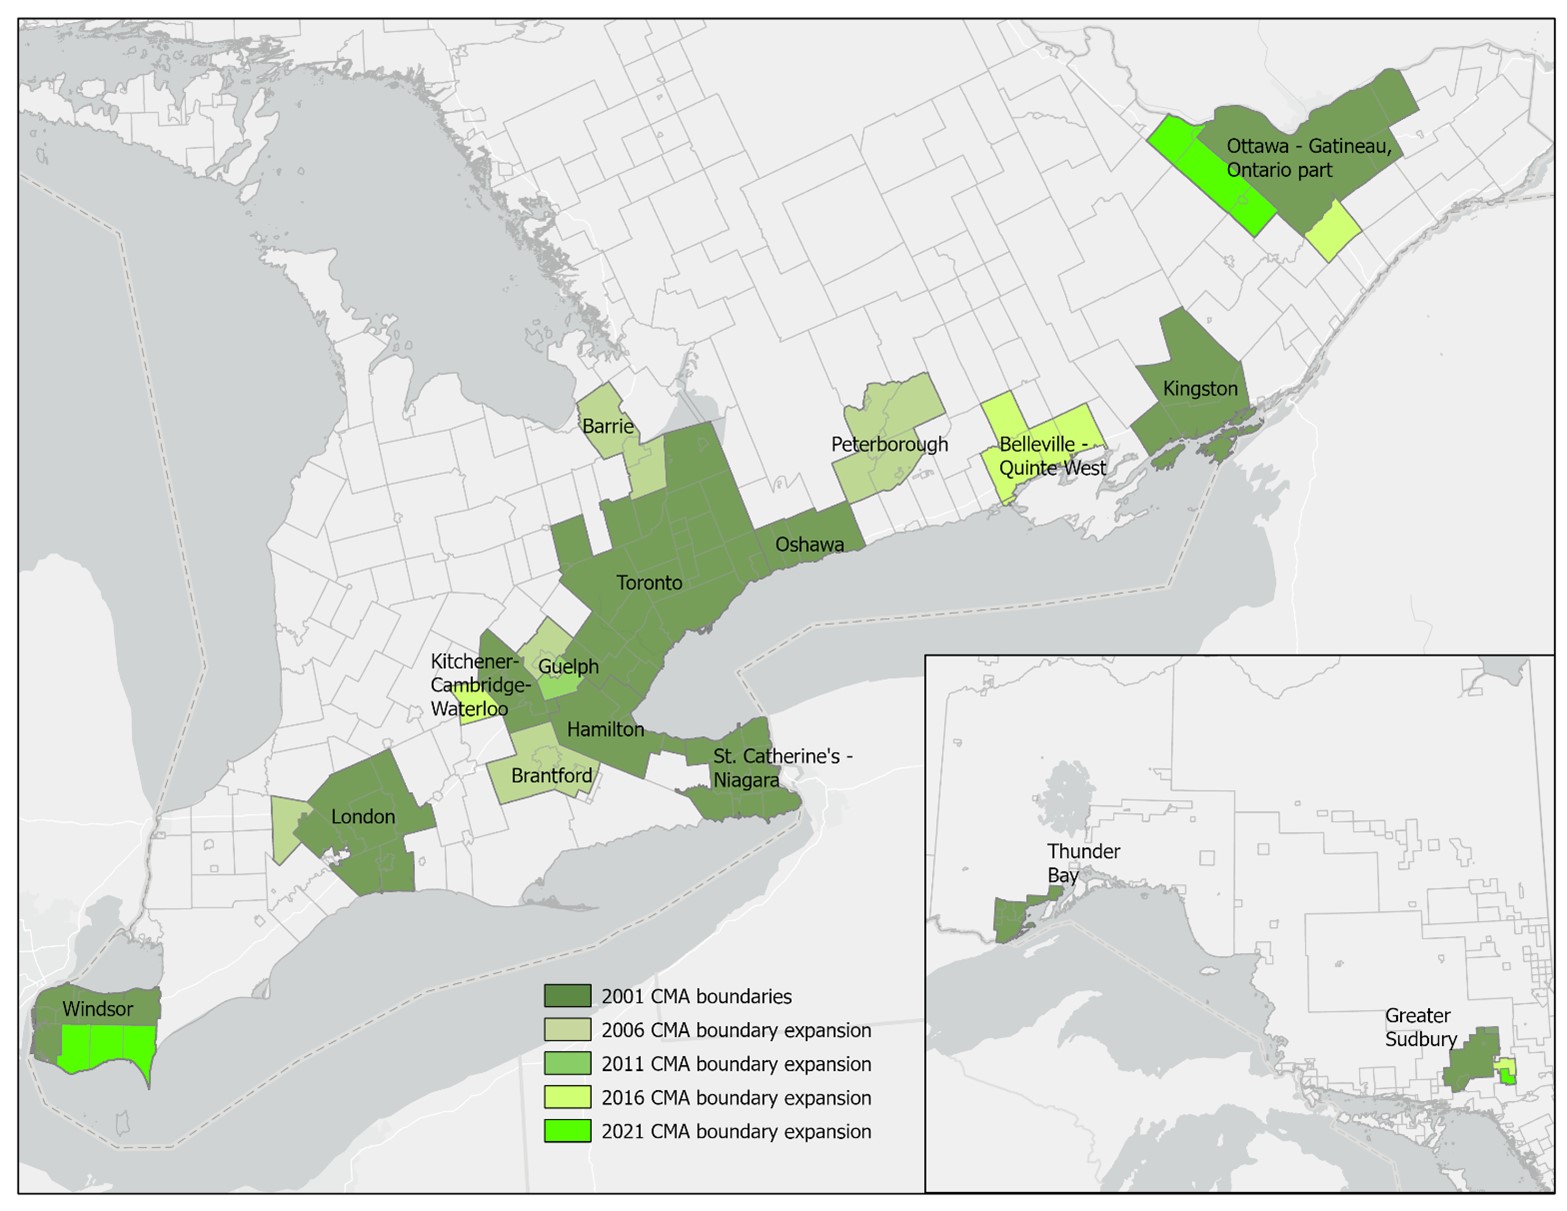
Source: Adapted from Statistics Canada
Population dynamics
The latest census shows more rural CSDs experienced positive population growth in the 5-years leading to 2021 than at any time since 1996, almost doubling the number of rural CSDs growing 10% or more (Table 1). The detailed CSD data provides evidence of a pandemic related shift in rural population growth.
Conditions in rural communities are reversing decades-long established trends, such as:
- evidence of stronger population growth, labour markets, and housing markets
- erosion of housing affordability in Toronto and a progressively larger number of baby boomers retiring starting the shift towards stronger population growth in rural CSDs between 2011 and 2016
- the pandemic causing remote work to become a viable alternative to traditional work arrangements
- Net out-migration from urban areas (notably the Toronto CMA) accounts for almost all of the population growth in rural Ontario. It started to accelerate in 2016 and recently hit a record high, supporting rural population growth. While net out-migration from the Toronto CMA may ease in the post pandemic period, its resilience since 2020 suggests rural communities may want to prepare for a sustained period of robust population growth to be prudent.
| CSD group | 2021 Total | 2021 % total | 2016 Total | 2016 % total | 2011 Total | 2011 % total | 2006 Total | 2006 % total | 2001 Total | 2001 % total |
|---|---|---|---|---|---|---|---|---|---|---|
| Total rural CSDs | 469 | 100% | 474 | 100% | 482 | 100% | 486 | 100% | 502 | 100% |
| CSDs with positive growth | 293 | 62% | 250 | 53% | 226 | 47% | 271 | 56% | 210 | 42% |
| CSDs with growth > 10% | 95 | 20% | 55 | 12% | 60 | 12% | 88 | 18% | 65 | 13% |
| CSDs with growth 0–10% | 198 | 42% | 195 | 41% | 166 | 34% | 183 | 38% | 145 | 29% |
| CSDs with negative growth | 145 | 31% | 184 | 39% | 214 | 44% | 175 | 36% | 207 | 41% |
| CSDs with incomplete information | 31 | 6.6% | 40 | 8.4% | 42 | 8.7% | 40 | 8.2% | 85 | 16.9% |
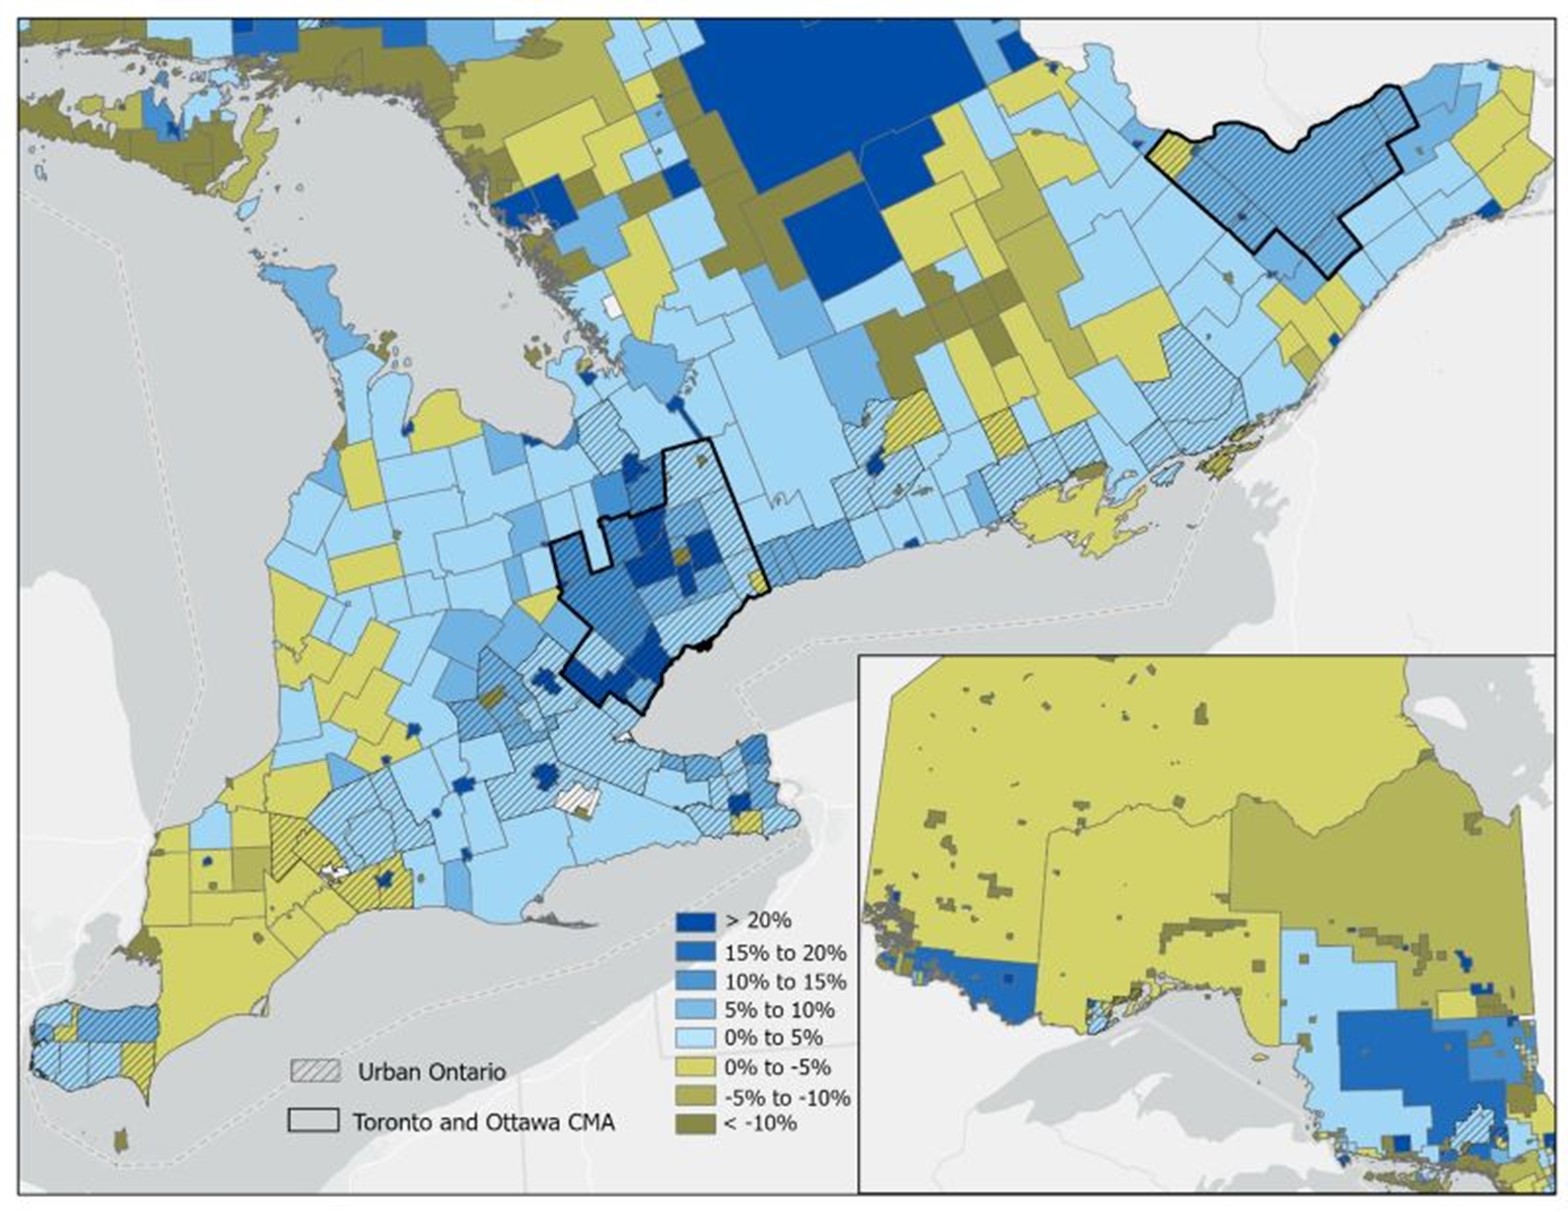
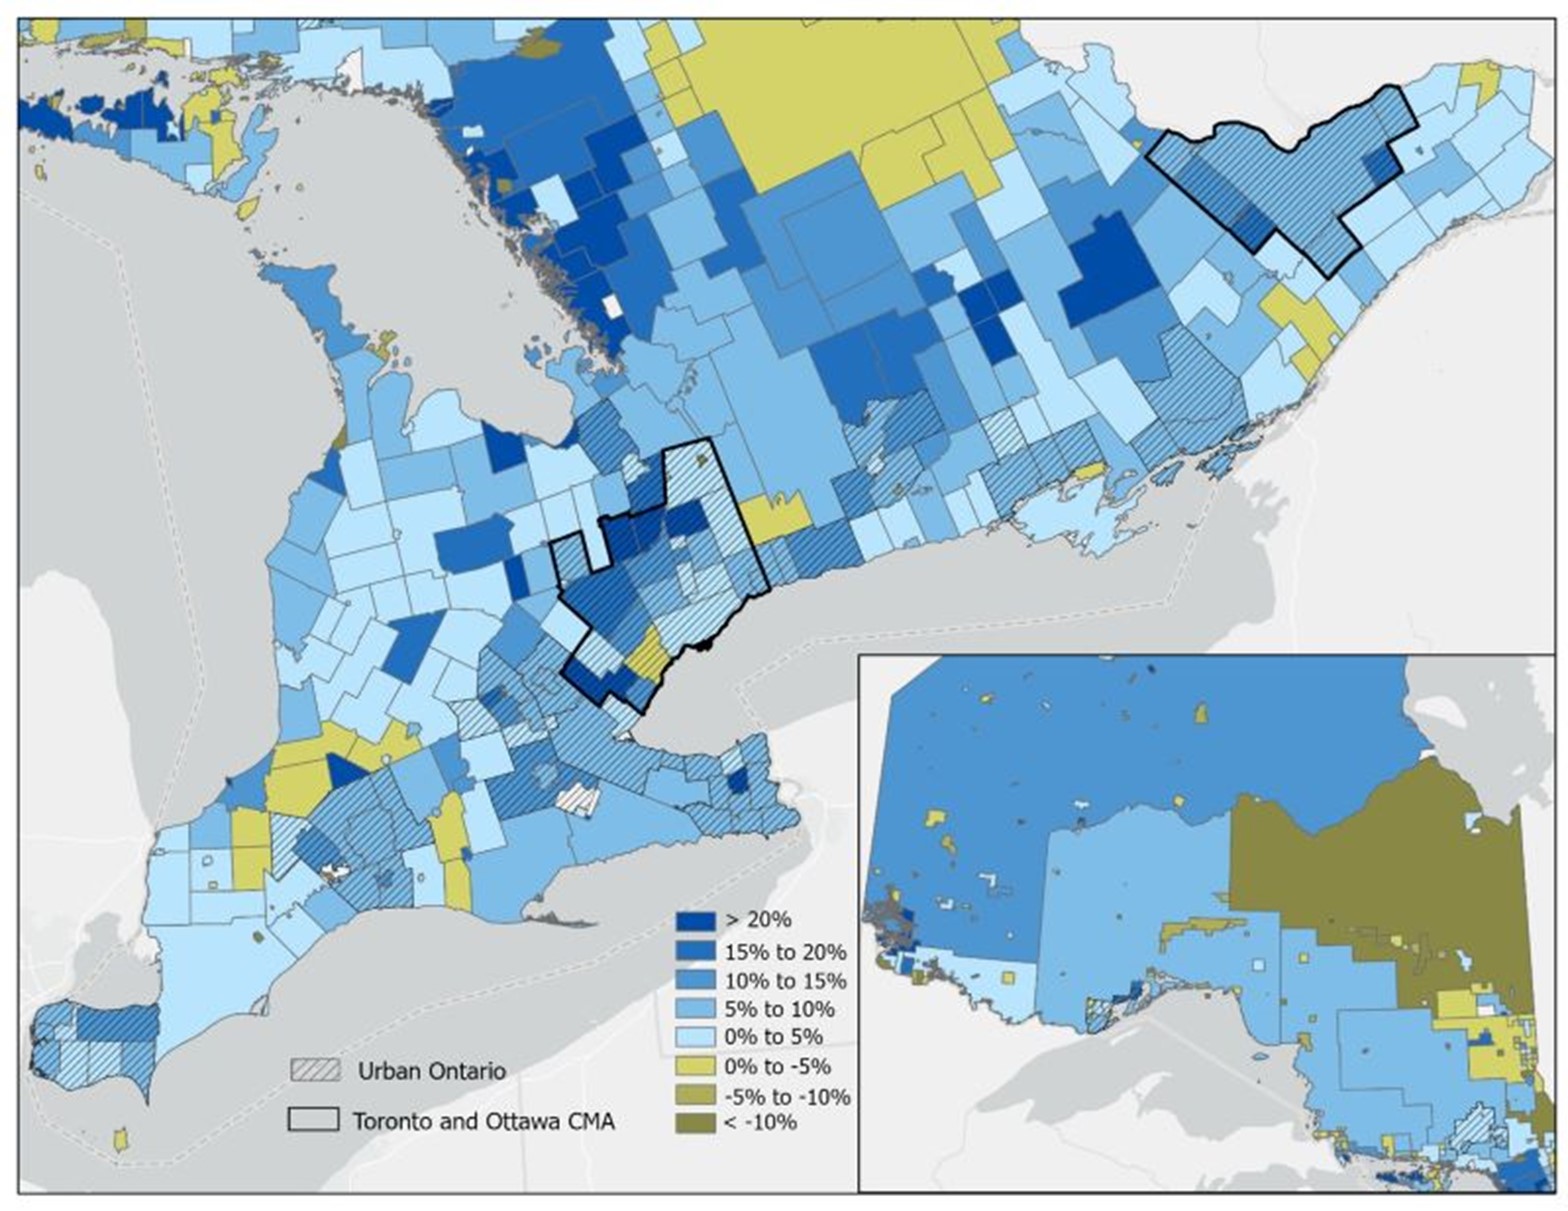
Figures 12 and 13 in the appendix are maps showing changes in population from the census periods 2011–2016 and 2016–2021, respectively. The changes are at the CSD level of geography. CSDs generally correspond to lower-tier municipalities. There is significant variation in population growth among rural CSDs. For instance, all CSDs experiencing zero or negative population growth were located in rural areas, while the fastest growing CSDs were also rural.
Heavily populated areas like the Toronto CMA experienced moderate growth (less than 10%).
Find detailed tables about intercensal population change for rural CSDs.
When looking at rural population from an aggregate perspective the pandemic related shift in population growth is less evident because of the loss of rural CSDs to urbanization. Figure 3 highlights the change in aggregate rural population going back to 1966.
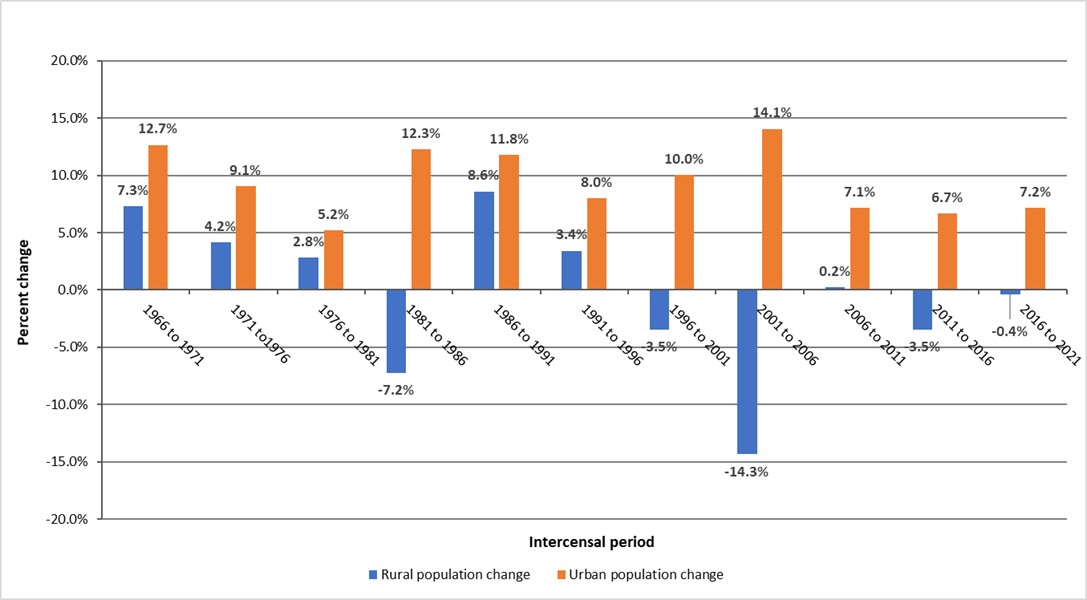
Source: Adapted from Statistics Canada
Each census year calculates the population using the re-adjusted values for the previous census year and the census boundary of the current year. Rural population change is due to population change within a fixed or constant set of delineated boundaries, plus reclassification due to rural areas being reclassified as urban.
Figures 4 and 5 show the population estimates for rural and urban Ontario by census year both, as absolute numbers and as percentage, respectively. In absolute numbers, the rural Ontario population has remained relatively steady with 2.6 million in 1961 and 2.5 million in 2021. However, as a proportion of the total Ontario population, rural Ontario’s population has decreased from 37% in 1966 to 17% in 2021. By comparison, the number of people living in urban Ontario increased by 169.3% or 7,381,966 during the same period.
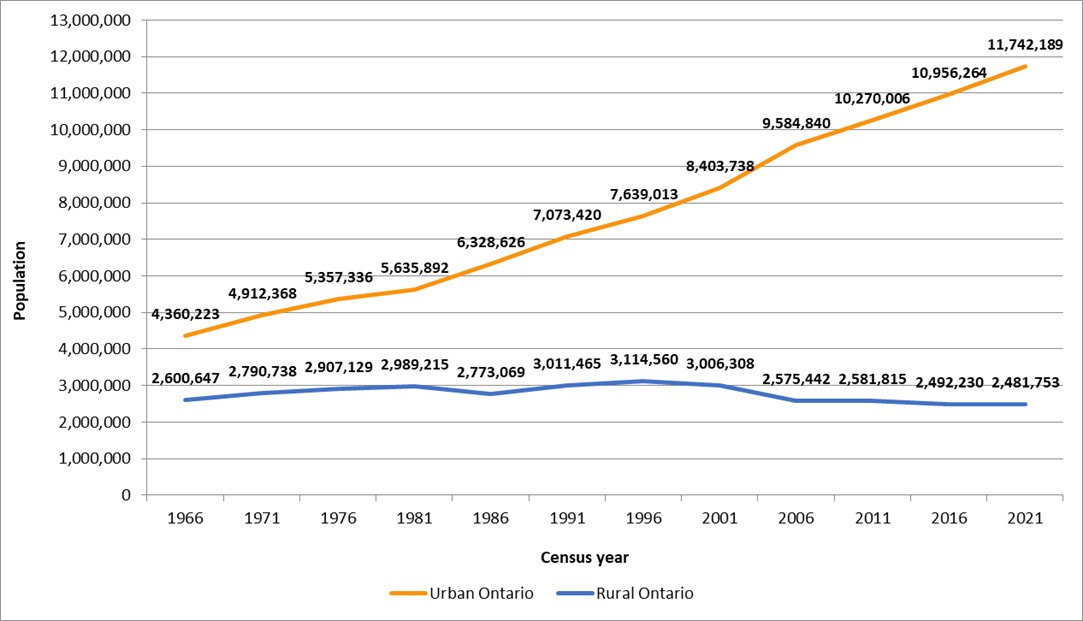
Source: Adapted from Statistics Canada
Each census year calculates the population using the re-adjusted values for the previous census year and the census boundary of the present year.
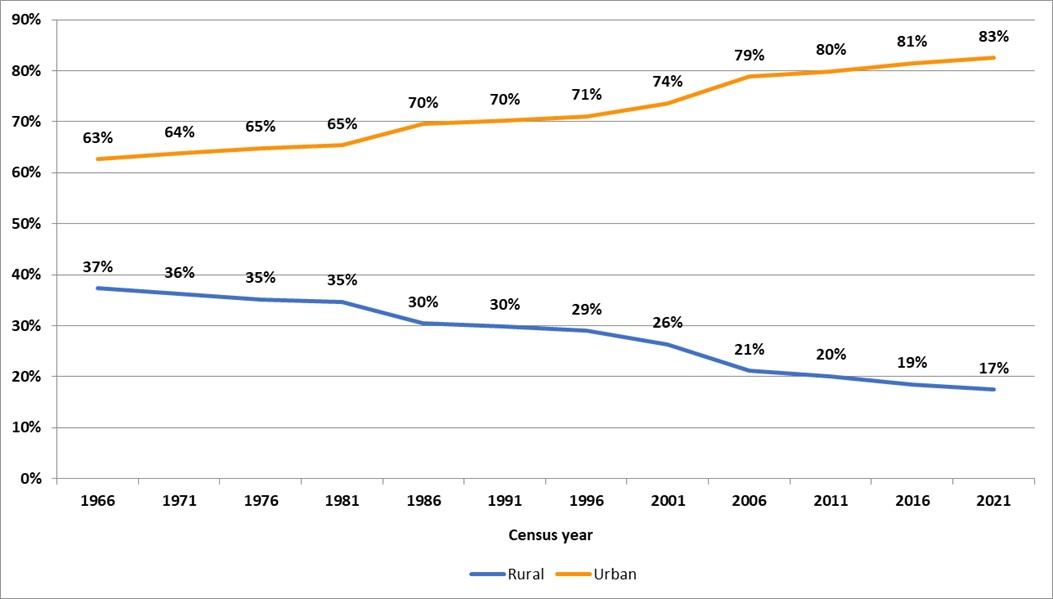
Source: Adapted from Statistics Canada
Each census year calculates the population using the re-adjusted values for the previous census year and the census boundary of the present year.
Population change
The proportion of youth in rural Ontario is decreasing while the older population group is increasing over time. Working age population has remained relatively stable.
Table 2 presents the results from the 2021 Census of Population:
- Youth (aged 0–14) in rural Ontario make up 15.5% of the population compared to 15.9% in urban Ontario.
- Working-age adults (aged 15–64) in rural Ontario make up 60.2% of the population compared to 66.8% in urban Ontario.
- Seniors (aged 65 and older) in rural Ontario make up 24.4% of the population compared to 17.3% of the population in urban Ontario.
- Since 2016, rural Ontario has seen a 1.6% decrease in youth, a 4.5% decrease in working-age adults, and a 12.4% increase in seniors.
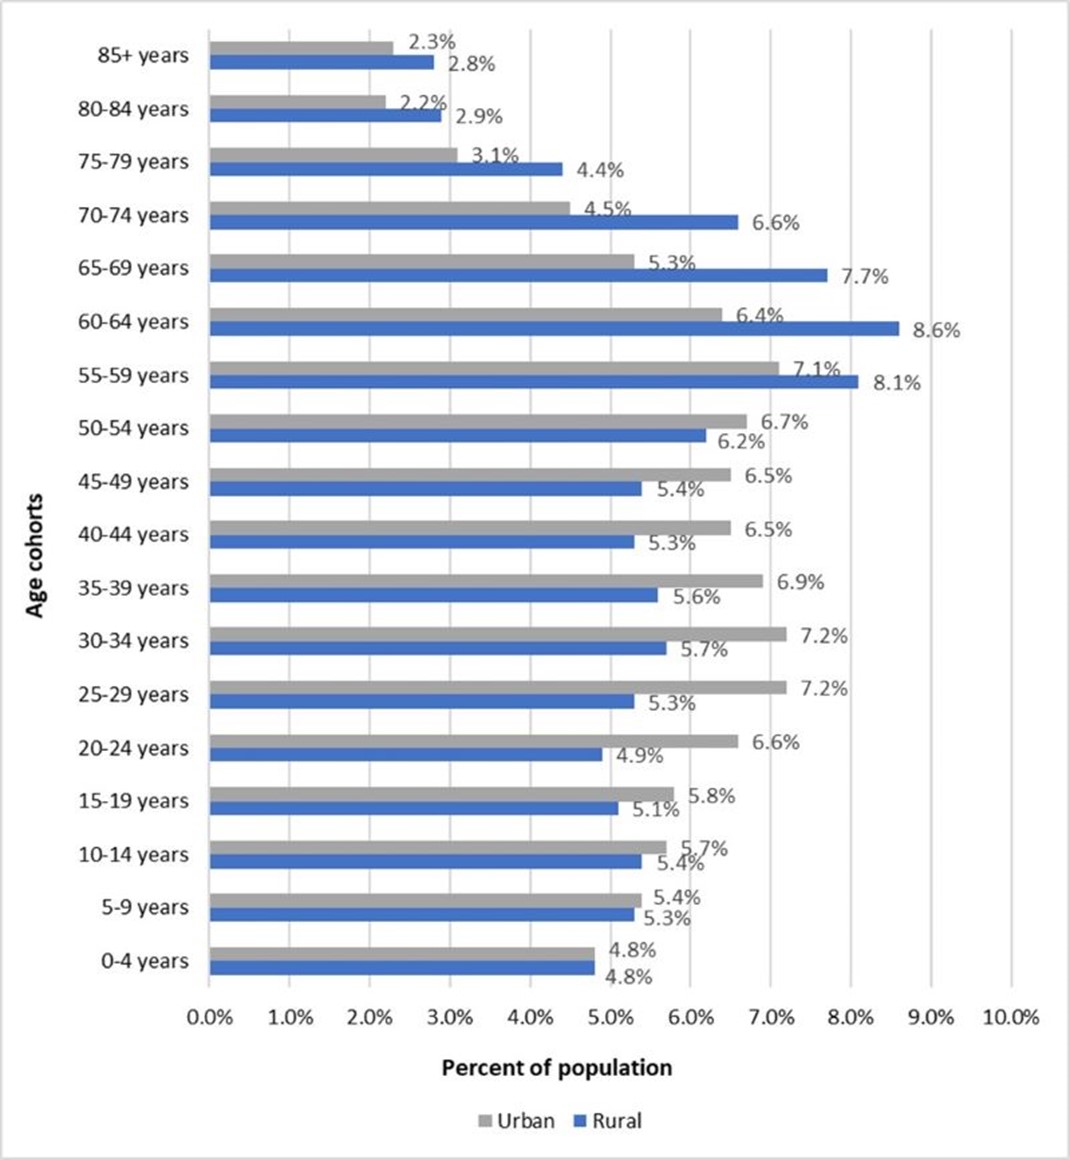
- Rural Ontario has a larger share of seniors and smaller share of youth and working-age adults than urban Ontario. Likewise, there are notable differences among working-age adults in both rural and urban areas. Rural areas have a higher proportion of older working-age adults than urban Ontario.
Figure 14 in the appendix shows a comparison between rural and urban population by age cohorts.
| Age group | Rural population | Overall % of rural population | Urban population | Overall % of urban population |
|---|---|---|---|---|
| Youth (0-14) | 384,320 | 15.5% | 1,867,475 | 15.9% |
| Working-age (15-64) | 1,493,120 | 60.2% | 7,841,320 | 66.8% |
| Seniors (65 and older) | 604,310 | 24.4% | 2,033,395 | 17.3% |
| Total | 2,481,750 | 100% | 11,742,190 | 100% |
Find tables about rural and urban population characteristics by census year.
Educational attainment
Rural Ontario has shown improvement in educational attainment over time.
As shown in Figure 6, in 2021, half of the rural Ontario population had post-secondary education (with or without certificate, diploma or degree) and only 19% did not have a high school diploma. In 1976, almost 67% of rural Ontarians did not have a high school diploma and only 25% of people had post-secondary education. In urban Ontario, the proportion of people with post-secondary education increased from 34% in 1976 to 59% in 2021 and the proportion of people with less than high school decreased from 55% to 14% during the same period.
During the period from 1976–2021, the proportion of people aged 15–64 who have post-secondary education with or without certificate diploma or degree below bachelor level increased from 20% to 35% in rural Ontario and from 25% to 26% in urban Ontario. The proportion of people aged 15–64 with a university education at or above a bachelor level has increased from 5% to 15% in rural Ontario and from 9% to 33% in urban Ontario.
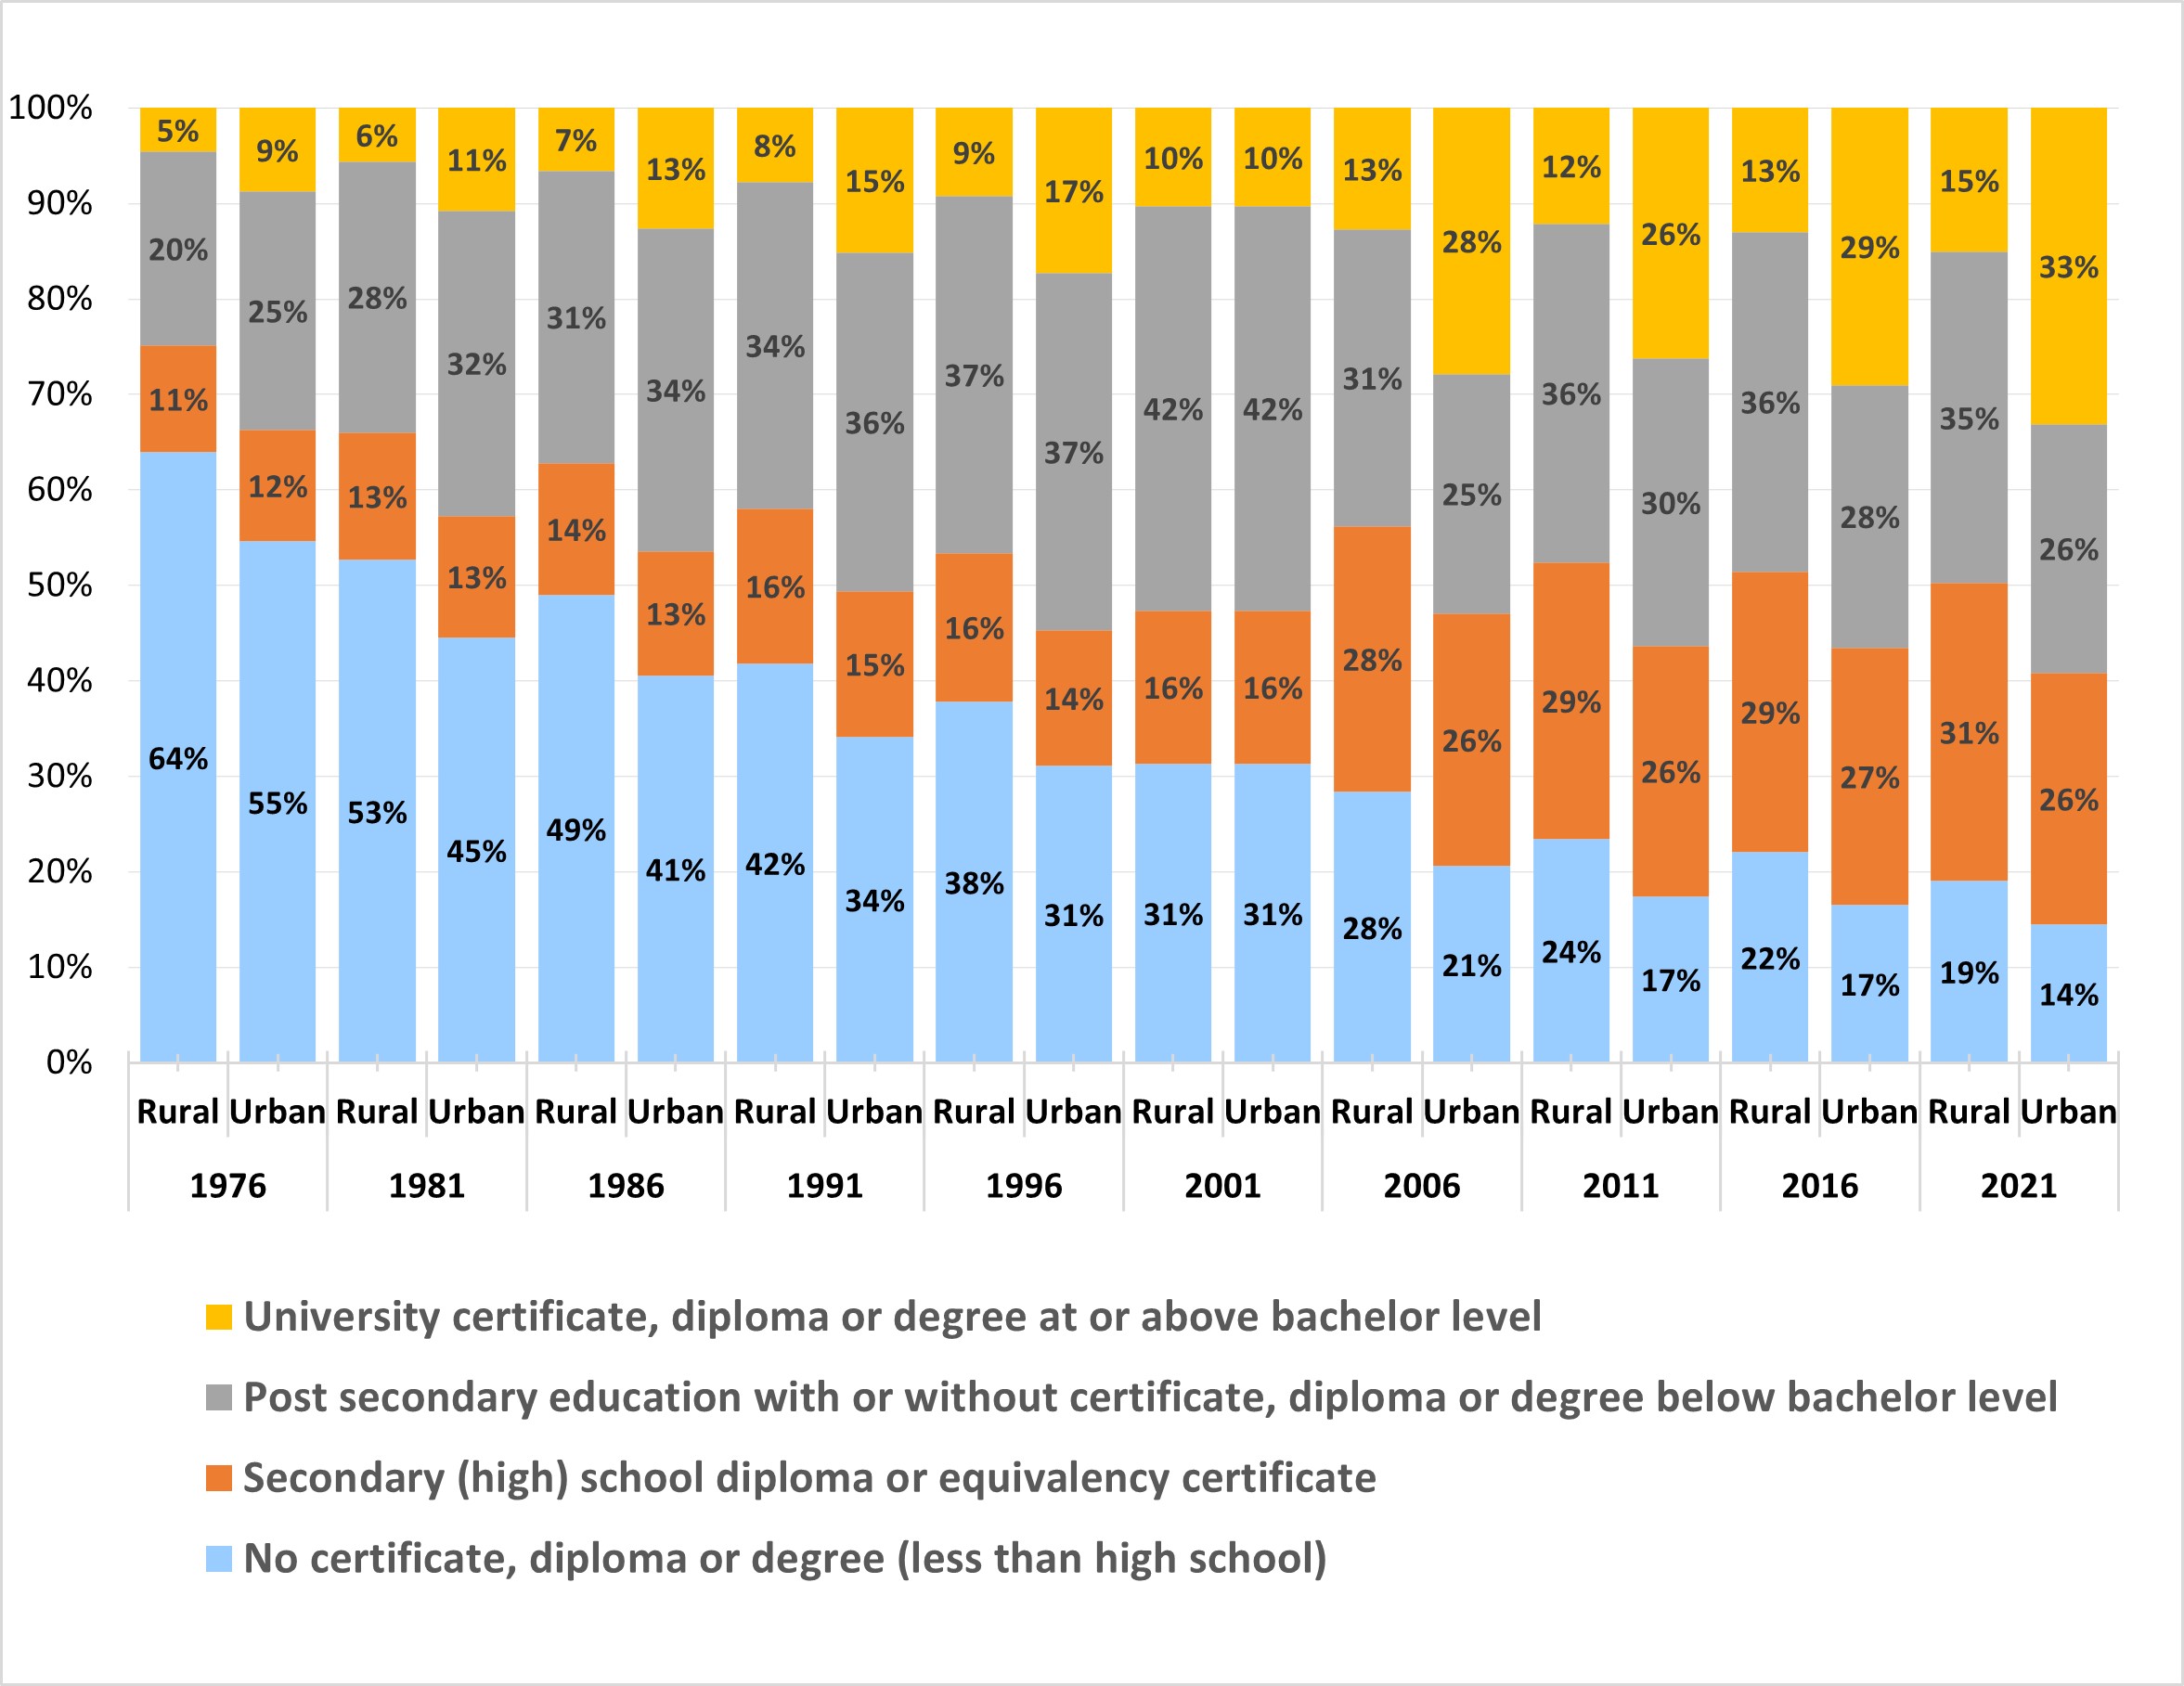
Source: Adapted from Statistics Canada
Find definitions related to educational attainment.
Find tables about rural (non-CMA) to urban (CMA) educational attainment by census year.
Immigrant population
The proportion of the rural population considered as immigrants has decreased over time, from 12.8% in 1971 to 8.2% in 2021. By comparison, 34.6% of Ontario's urban population in 2021 were considered immigrants.
Over time, a smaller proportion of Ontario immigrants are choosing to live in rural areas. The percentage of Ontario immigrants living in rural areas has decreased from 20% in 1971 (336,155) to 5% in 2021 (198,650).
The combination of strong immigration levels and the fact that most immigrants settle in large urban areas largely explains why the population of Ontario’s urban areas is increasing at a faster pace than rural areas.
| Census year | Rural immigrant population | Overall % of total rural population | Urban immigrant population | Overall % of total urban population |
|---|---|---|---|---|
| 1971 | 336,155 | 12.8% | 1,371,240 | 27.0% |
| 1976 | N/A | N/A | N/A | N/A |
| 1981 | 349,745 | 11.7% | 1,659,830 | 29.5% |
| 1986 | 296,300 | 10.7% | 1,784,900 | 28.2% |
| 1991 | 300,175 | 10.0% | 2,069,000 | 29.3% |
| 1996 | 303,430 | 9.7% | 2,421,060 | 31.7% |
| 2001 | 281,500 | 9.4% | 2,748,575 | 32.7% |
| 2006 | 225,830 | 8.8% | 3,172,895 | 33.1% |
| 2011 | 202,330 | 7.8% | 3,409,035 | 33.2% |
| 2016 | 198,085 | 7.9% | 3,654,060 | 33.4% |
| 2021 | 198,650 | 8.2% | 4,007,940 | 34.6% |
Find definitions related to immigrant status.
Find tables about rural (non-CMA) to urban (CMA) immigrant population by census year.
Racialized groups
The racialized population as a proportion of the rural population has increased over time. In 1996, 60,490 rural residents (1.9% of the rural population) were members of a racialized group. This proportion increased to 4.2% in 2021. By comparison, 40.1% of urban Ontario’s population or 4,713,270 people were considered as racialized population (Table 4).
The majority of Ontario’s racialized population lives in urban areas. In 2021, 198,650 people, representing 2% of Ontario’s racialized population, lived in rural areas.
| Census year | Rural Ontario racialized population | Rural racialized population as a proportion of rural Ontario population | Urban Ontario racialized population | Urban racialized population as proportion of Ontario population |
|---|---|---|---|---|
| 1996 | 60,490 | 1.9% | 1,621,555 | 21.2% |
| 2001 | 66,930 | 2.2% | 2,086,115 | 24.8% |
| 2006 | 51,195 | 2.0% | 2,694,010 | 28.1% |
| 2011 | 54,935 | 2.1% | 3,224,630 | 31.4% |
| 2016 | 67,565 | 2.7% | 3,818,020 | 34.8% |
| 2021 | 104,070 | 4.2% | 4,713,285 | 40.1% |
Find definitions related to racialized groups.
Find tables about rural (non-CMA) to urban (CMA) racialized groups by census year.
Indigenous peoples
Indigenous peoples is a collective name for the original peoples of North America and their descendants. Often, Aboriginal peoples is also used (Government of Canada). The Indigenous population in Ontario increased fivefold from 1986–2021. They represented 2.9% of the total Ontario population in 2021. The large growth in Indigenous population during this period was due to a relatively high natural growth and an increase in people voluntarily self-identifying as First Nations, Inuit or Métis.
As shown in Table 5, the Ontario rural Indigenous population has grown by more than 4 times between 1986 and 2021, from 39,855 people in 1986 (1.4% of the rural population) to 184,905 in 2021 (7.5% of the rural population).
The proportion of Ontario’s Indigenous population living in rural areas has decreased from 71.7% in 1986 to 45% in 2021.
| Year | Rural Indigenous population | In proportion of overall rural population | Urban Indigenous population | In proportion of overall urban population |
|---|---|---|---|---|
| 1986 | 39,855 | 1.4% | 15,705 | 0.2% |
| 1991 | 47,905 | 1.6% | 23,100 | 0.3% |
| 1996 | 85,570 | 2.7% | 55,955 | 0.7% |
| 2001 | 95,080 | 3.2% | 75,360 | 0.9% |
| 2006 | 122,895 | 4.8% | 111,780 | 1.2% |
| 2011 | N/A | N/A | N/A | N/A |
| 2016 | 175,680 | 7.0% | 198,250 | 1.8% |
| 2021 | 184,905 | 7.5% | 221,680 | 1.9% |
Find definitions related to Indigenous population.
Find tables about rural (non-CMA) to urban (CMA) Indigenous population by census year.
Average household income
In the context of households, total income refers to receipts from certain sources of all household members before income taxes and deductions during a specified reference period. The monetary receipts included are those that tend to be of a regular and recurring nature.
Figure 7 contrasts the average household income between rural and urban areas from 1981–2021. Average household income in rural areas has increased from $22,522 in 1981 to $98,468 in 2021. In 2021, rural household income was 18% lower than urban income.
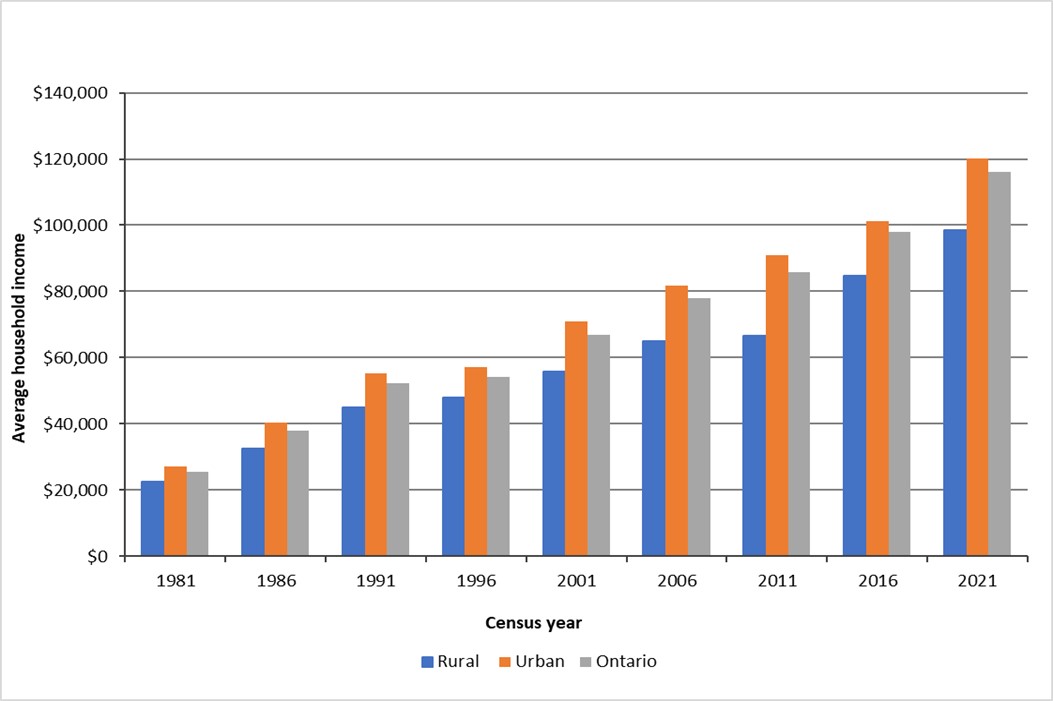
Source: Adapted from Statistics Canada
Find definitions related to household income.
Economy
Employment
Figure 8 shows number of people employed in rural and urban Ontario from 2006–2023.
Since 2006, employment in rural Ontario has remained stable at around 1.22 million jobs (3% increase). In comparison, employment in urban Ontario has increased by 29.5% (1.54 million jobs) during the same period. Slower growth in rural areas is primarily due to urbanization, as more quickly growing rural CSDs become CMAs over time and lose their rural status.
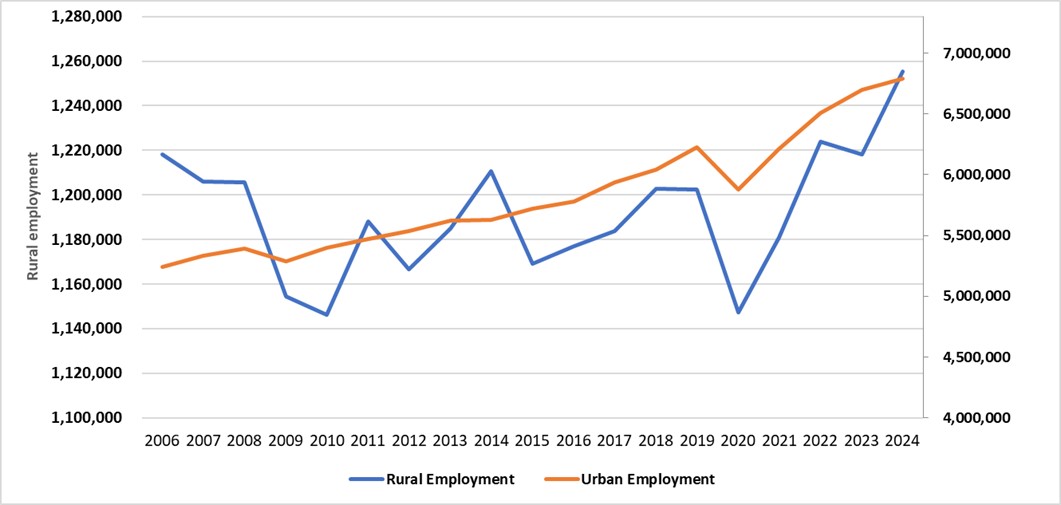
Source: Adapted from Statistics Canada
Employment in services-producing and goods-producing sectors
Employment in rural Ontario’s services-producing sectors have shown faster growth than its goods-producing sectors. As shown in Figure 9, the services-producing sector generates approximately 70% of employment in rural Ontario. The proportion of employment generated by this sector has increased from 67.5% (821,900 jobs) in 2006 to 70.5% (885,200 jobs) in 2024.
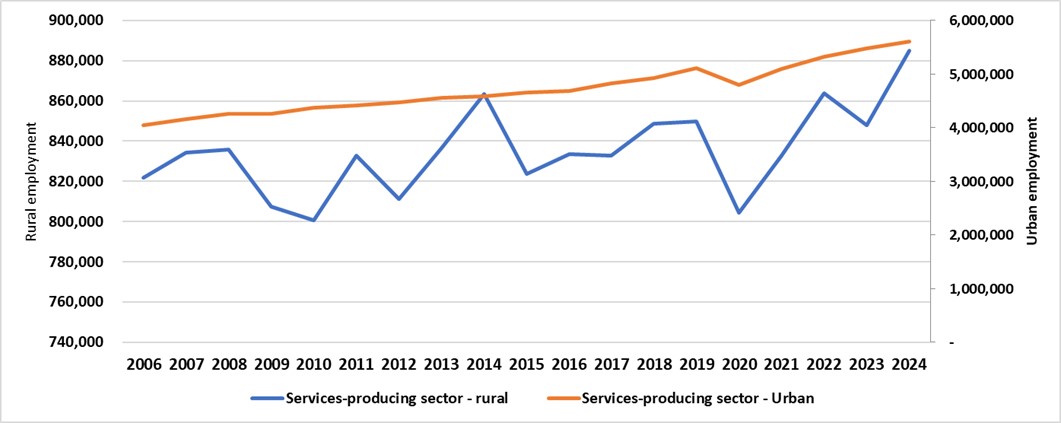
Source: Adapted from Statistics Canada
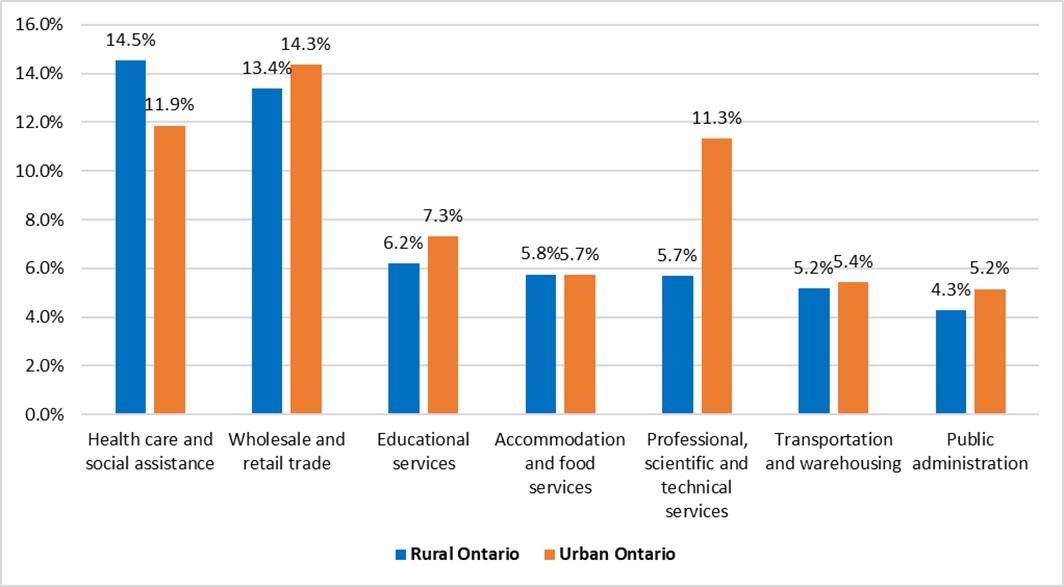
Figure 15 in the appendix shows the top 7 industries:
- health care and social assistance
- wholesale and retail trade
- educational services
- accommodation and food services
- professional, scientific and technical services
- transportation and warehousing
- public administration
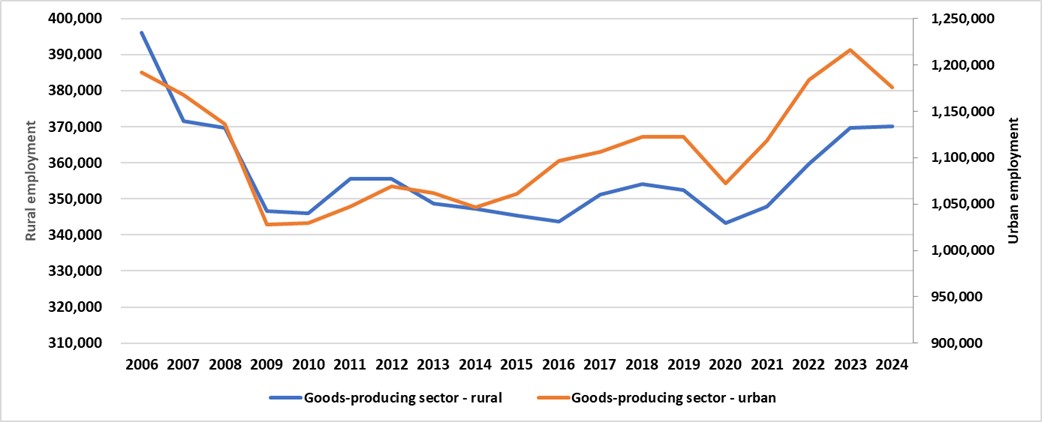
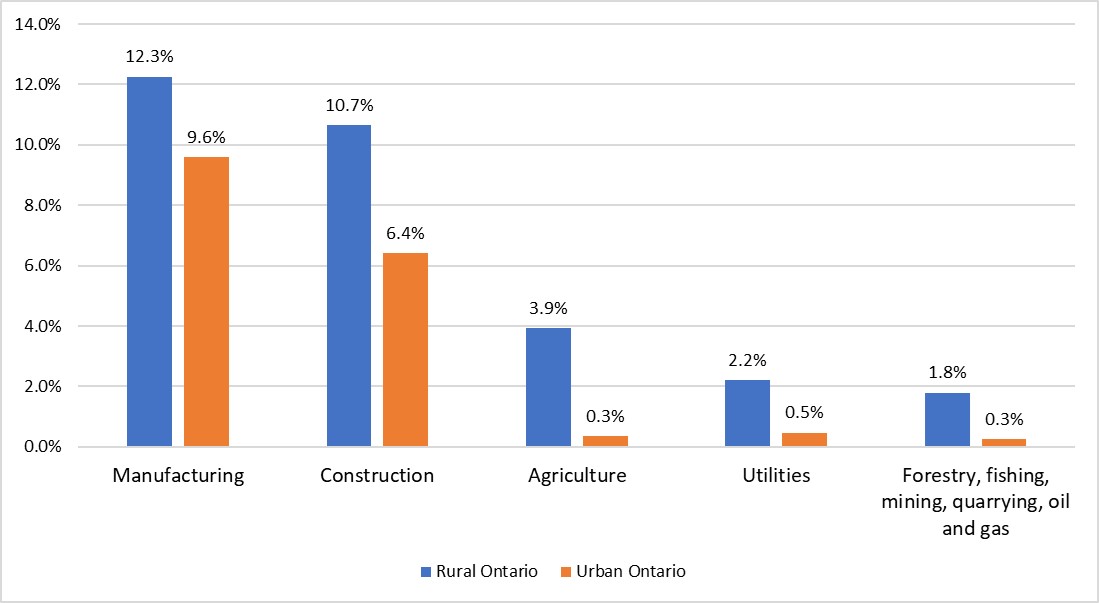
The goods-producing sector represents approximately 30% of rural employment. As shown in figure 10, from 2006 to 2024, the employment generated by this sector has decreased from 396,000 (32.6%) to 370,100 (29.5%).
As shown in figure 16 in the appendix, the manufacturing, construction and agriculture industries generates approximately 25% of total rural employment.
Source: Adapted from Statistics Canada
Find data tables about Ontario rural and urban employment.
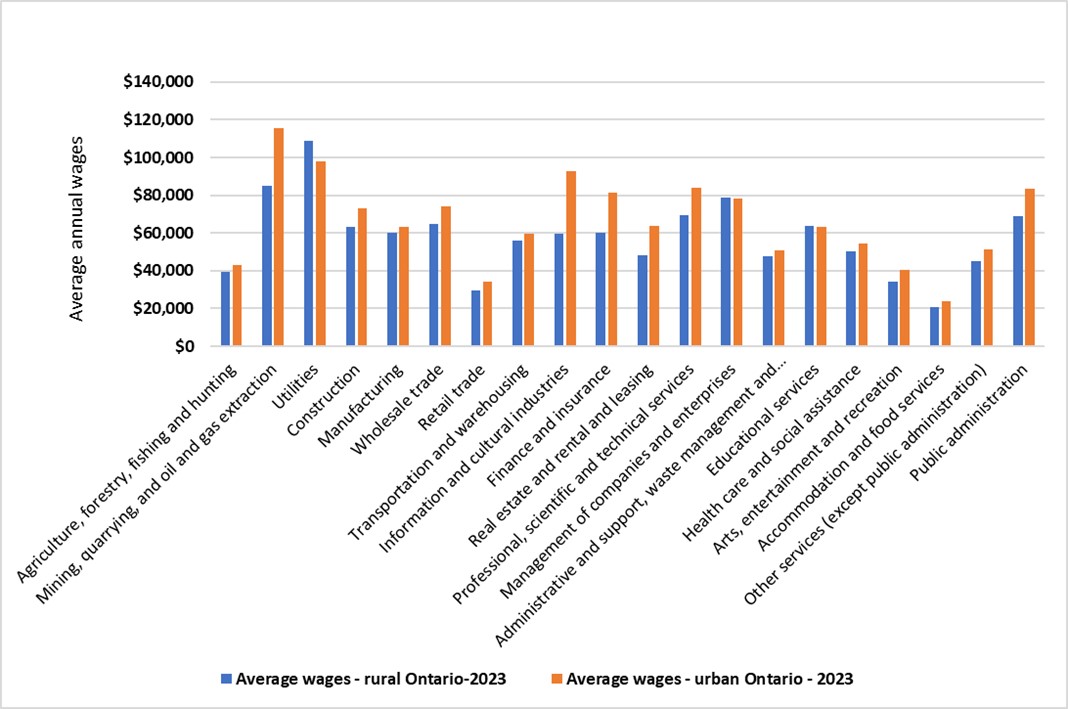
Average annual earnings by industrial sector in rural and urban Ontario
People working in rural Ontario generally earn less than those who work in urban areas.
In 2023, the average annual earnings for rural employees were $52,760. This is 17% less than the $61,755 earned by urban employees (Figure 11).
The only 3 industries where the estimated wages for people working in rural Ontario were higher in 2023 than those working in urban Ontario are:
- management of companies and enterprises
- utilities
- educational services
Source: Lightcast (2023). Input-Output model. It is based on data from Statistics Canada's National Symmetric Input-Output table (2021), National Household Survey commuting flows, Canadian Business Patterns, and several Emsi in-house data sets.
Rural Ontario GDP estimate
The estimated 2023 real GDP for rural Ontario was $113.3 billion or 13.3% of Ontario’s GDP. The 2023 GDP OMAFA’s estimates for rural Ontario are derived from Statistics Canada’s GDP estimates for non-CMA areas which are only available with a lag of 3 years (up to 2020) (Statistic Canada’s Tables: 36-10-0402-01, 36-10-0423-01 and 36-10-0468-01). Rural Ontario’s 2023 GDP was estimated by using the proportion of Ontario’s GDP that rural accounted for in 2020 (13.3%) and applying that percentage against the most current GDP estimate for the provincial GDP (May 2023).
Find data tables about Ontario rural Ontario GDP estimates.
Rural and urban businesses
In December 2023, an estimated 257,741 businesses (14.2% of Ontario businesses) were in rural Ontario. 1,553,317 businesses were in urban Ontario. Table 6 shows the number and proportion of business classified by number of employees in both rural and urban areas respectively.
Non-employers or indeterminate businesses (those without employees) represent more than 67% of all business both in rural and urban Ontario. Micro businesses (1-4 employees) account for 16.3% of rural businesses and 16.5% of urban businesses; small businesses (5-99 employees) account for 13.9% of businesses in rural and 10.4% in urban Ontario. Medium and large businesses combined account for less than 1% of all businesses in rural and urban Ontario, respectively.
| Business size category | Rural business | % of overall rural businesses | Urban business | % of overall urban businesses | Ontario business | % of Ontario businesses |
|---|---|---|---|---|---|---|
| Non-employer or indeterminate | 178,626 | 69.30% | 1,125,800 | 72.48% | 1,304,426 | 73.03% |
| Micro (1-4 employees) | 41,967 | 16.28% | 255,713 | 16.46% | 297,680 | 16.44% |
| Small (5-99 employees) | 35,700 | 13.89% | 162,198 | 10.40% | 197,988 | 10.93% |
| Medium (100-500 employees) | 1,210 | 0.47% | 8,366 | 0.54% | 9,576 | 0.53% |
| Large (500 or more employees) | 148 | 0.06% | 1,240 | 0.08% | 1,388 | 0.08% |
| Total | 257,741 | 14.23% | 1,553,317 | 85.77% | 1,881,058 | 100.0% |
Find data tables about rural (non-CMA) to urban (CMA) business counts for rural Ontario.
Appendix
Source: Adapted from Statistics Canada
Source: Adapted from Statistics Canada
Source: Adapted from Statistics Canada
Source: Adapted from Statistics Canada
Source: Adapted from Statistics Canada