Soil management, fertilizer use, crop nutrition and cover crops for fruit production
Learn how to develop a sound soil fertility program by starting with an assessment of crop nutrient needs.
For a complete guide to soil fertility, consult OMAFRA Publication 611: Soil Fertility Handbook.
Crop nutrition is important for the production of high-yielding, top quality fruit crops. Good soil and water management practices are important for a crop's efficient use of nutrients from organic and inorganic fertilizer. Nutrients must be dissolved in the soil water for root uptake. The development of a sound soil fertility program begins with the assessment of nutrient needs.
Assessing Nutrient Needs
There are three ways to assess soil fertility and crop nutrition:
- soil testing
- plant tissue analysis
- visual deficiency symptoms
For perennial crops, all three methods are needed to assess and monitor the crop's nutritional status.
Soil testing
A soil test using methods suited to the soils of a particular region is the best measure of plant-available nutrients. OMAFRA accredits specific laboratory methods suited to Ontario soils (see Table 1. OMAFRA-Accredited Soil Tests). OMAFRA-accredited laboratories participate in the North American Proficiency Testing Program and must demonstrate their ability to perform these tests accurately.
Soil laboratories may provide additional soil tests not listed in Table 1, as well as analyses for greenhouse media, nutrient solutions and water. Testing for soil organic matter can be useful but is not an accredited test. OMAFRA-accredited soil tests are not available for boron, copper, iron or molybdenum. Tissue analysis of these micronutrients is a better indicator of the nutritional status. For other testing services, contact the accredited soil-testing laboratories in Ontario.
| Nutrient Analyzed | Test |
|---|---|
| phosphorus | sodium bicarbonate extractable |
| potassium and magnesium | ammonium acetate extractable |
| manganese | index of soil pH and phosphoric acid extractable manganese |
| zinc | index of soil pH and DTPA extractable zinc |
| pH | saturate paste extract |
| lime requirement | SMP buffer pH |
| soil nitrate | potassium chloride extraction |
When to sample
Always take soil samples before you plant fruit crops. Where pH adjustments are necessary, sample 2 years before planting so that adjustments can be made prior to planting. After establishment, sample each field once every 2 or 3 years. In sandy soils, check soil potassium levels more frequently.
Late summer or fall sampling is ideal for fields to be planted in the spring. For established plantings, soils may be sampled in the summer or fall. Sampling at the same time each year will help with interpreting and comparing results between soil reports. Regardless of when you sample, allow time to mail the samples, receive your report and determine fertilizer requirements.
Taking a soil sample
A soil test report's accuracy and the recommendations depend on proper collection, preparation and submission of a soil sample. To take a soil sample you will need:
- soil probe or shovel
- clean plastic pail (do not use galvanized metal pails because these will contaminate the sample for micronutrient analysis, particularly zinc)
- sample bags and boxes, usually available from the soil laboratory
- a pen or marker
Sample each field or individually managed unit separately. Separate large fields, or fields with considerable variation, into smaller sections. This applies even if the areas are too small to fertilize separately. Each sample should represent a field or field section with similar soil texture, topography, organic matter and crop history. Avoid sampling recent fertilizer bands, dead furrows, areas adjacent to gravel roads, or where lime, manure, compost or crop residues have been piled.
Sample soils using a probe or shovel. Traverse the sampled area in a zigzag pattern to provide a uniform distribution of sampling sites. Take at least 20 soil cores, 15 cm deep, from any field or area sampled up to 5 ha in size. For fields larger than 5 ha, proportionately more cores should be taken. The more cores taken, the more likely the sample will provide a reliable measure of fertility in the field. One sample should not represent more than 10 ha.
Collect the soil in a clean plastic pail. Break up the lumps and mix the soil well, since only about 2 mL of soil from the sample will be used for each analysis. Fill a clean plastic bag with approximately 500 g of soil, place it into the box and forward it for testing. Be sure to clearly mark the sample box with all of the necessary information (sample number, farm name, date, etc.).
Micronutrient deficiencies most often occur in small patches in fields. Problem areas should be sampled separately. When you sample a problem area, be sure to take a comparison sample from an adjacent area without symptoms.
Samples to assess soil nitrogen should be taken by following the same sampling method, except they are taken to a depth of 30 cm. If not submitted immediately, the samples should be stored below 4°C or frozen.
Interpreting soil test results
The OMAFRA-accredited soil-testing program provides recommendations for nitrogen, phosphate, potash, magnesium, zinc and manganese fertilizer. It also gives recommendations for the amount and type of lime to be applied, if required. These recommendations are specific to the future crop to be grown, specified on the lab submission form. Crop-specific details may be found:
These recommendations can produce the highest economic yields when accompanied by good or above-average crop management.
On a soil test report, each nutrient is reported in parts per million (ppm) or milligrams per litre (mg/L) of soil, a letter rating and a fertilizer recommendation (usually kg/ha or lb/ac). The letter rating of the nutrient (i.e., high (HR), medium (MR), low (LR), rare (RR) or no response (NR) indicates the likelihood of a profitable response to applied nutrient for the specified crop.
Fertilizer application guidelines depend on the crop. Rates for nitrogen, phosphorus and potassium fertilizers should be adjusted if manure or legume cover crops are incorporated. This information is essential for an optimum fertilizer utilization.
Soil tests from other laboratories
OMAFRA-accredited soil tests are used to provide accurate fertilizer application guidelines. Make certain that the service you use is accredited. To be accredited, a laboratory must use OMAFRA-approved testing procedures to demonstrate acceptable analytical precision and accuracy and must also provide the OMAFRA fertilizer guidelines. Ensure that you ask for the OMAFRA fertilizer guidelines. Soil tests for nutrient management plans must be completed at OMAFRA-accredited labs. Soil tests for exchange capacity, aluminum and copper are not accredited by OMAFRA because they have not been found to contribute to improving fertilizer application guidelines.
Plant tissue analysis
Plant tissue analysis measures the nutrient concentration in plant tissue. It is most useful when combined with visual inspection of the crop and soil conditions, knowledge of past field management and a current soil test to provide information about soil nutrient levels and pH.
For perennial crops, tissue analysis is an important addition to soil tests. Tissue analysis results are compared against established normal ranges for the crop and indicate whether the plant is obtaining adequate nutrients for optimum growth. If soil levels are known to be adequate, low tissue analysis results may indicate there are other possible causes for the nutrient deficiencies. Plant analysis is particularly useful for the evaluation of phosphorus, potassium, magnesium and manganese. It is the main tool for assessing the status of boron, copper, iron and molybdenum, as there is no reliable soil test for these micronutrients.
Sampling
To monitor trends, complete a leaf analysis every year. Sampling the same trees at the same time of the year will assist in interpreting leaf analysis reports from year to year.
Timing and stage of growth when a sample is collected affects the results of plant analysis. Concentrations of some nutrients vary considerably with the age of the sampled tissue and the date of sampling. Results are difficult to interpret if samples are taken at times other than what is optimal for the crop. See Table 2. Sampling for Tissue Analysis of Fruit Crops.
- Collect tissue samples into labelled paper bags. Plant tissues will rot if stored in plastic bags.
- Avoid collecting damaged leaves or leaves from plants that appear abnormal.
- Plant tissue should be sampled separately from variable areas large enough to sample soil and fertilize separately.
- Avoid contamination of the sample with soil. Even a small amount of soil will cause the results to be invalid, especially for micronutrients.
- Plants suspected of nutrient deficiency should be sampled as soon as a problem appears. Take tissue samples from a problem area and submit a separate sample from an adjacent, non-affected part of the field. Also collect and submit a soil sample from both affected and non-affected areas to aid diagnosis.
Sample preparation
Fresh plant samples should be delivered directly to the laboratory. If they cannot be delivered immediately, they should be dried to prevent spoilage. Samples may be dried in the sun or in an oven at 65°C or less.
Take precautions to prevent contamination with dust or soil. Avoid contact of samples with brass, copper or galvanized (zinc-coated) metal.
Plant analyses may be obtained from several laboratories in Ontario. Refer to the list of accredited soil-testing laboratories in Ontario. Tissue analysis is not part of the OMAFRA accreditation program. However, OMAFRA-accredited labs have the necessary skills and equipment to perform accurate tissue analysis.
Interpretation
Tissue analysis has limitations and expert help is sometimes needed to interpret the results. Tissue analysis does not indicate how much fertilizer is required to correct a deficiency or even whether a deficiency is related to soil fertility problems. Tissue test results in the deficiency range may also be due to factors such as climate, pest pressure or disease, and therefore should be used in conjunction with a soil-testing program. Table 3. Nutrient Concentration Sufficiency Ranges for Fruit Crops, shows the range of tissue nutrient concentration that should result in optimum productivity for various fruit crops.
| Crop | Stage of Growth/Timing | Plant Part Sampled | Approximate Number to Collect |
|---|---|---|---|
| Apple | Last 2 weeks of July | Mature mid-shoot leaves of current year growth at shoulder height | 10 leaves from 10 representative trees |
| Blueberry, Highbush | Late July-early August | Mature mid-shoot leaves of current year growth | 100 leaves throughout sampling area |
| Cherry, Montmorency | Last 2 weeks of July | Mature mid-shoot leaves of current year growth at shoulder height | 10 leaves from 10 representative trees |
| Grape | Early September | Petioles from mature leaves of fruiting canes - remove from leaf immediately | 75-200 depending on variety size |
| Peach | Last 2 weeks of July | Mature mid-shoot leaves of current year growth at shoulder height | 10 leaves from 10 representative trees |
| Pear | Last 2 weeks of July | Mature mid-shoot leaves of current year growth at shoulder height | 10 leaves from 10 representative trees |
| Raspberry | Late July | Fully expanded leaves from fruiting cane | 100 throughout sampling area |
| Strawberry | Fruiting - June Non fruiting - early August | Fully expanded, recently matured leaf - discard petiole immediately | 50 leaves throughout sampling area |
Table 3. Nutrient Concentration Sufficiency Ranges for Fruit Crops
| Crop | Nitrogen % | Phos-phorus % | Potass-ium % | Cal-cium % | Magne-sium % | Iron (ppm) | Boron (ppm) | Zinc (ppm) | Manga-nese (ppm) |
|---|---|---|---|---|---|---|---|---|---|
| Delicious, Crispin | 2.2-2.7 | 0.15-0.4 | 1.4-2.2 | 0.8-1.5 | 0.25-0.4 | 25-200 | 20-60 | 15-100 | 20-200 |
| Empire, Spy | 2.1-2.6 | 0.15-0.4 | 1.3-2.1 | 0.7-1.5 | 0.25-0.4 | 25-200 | 20-60 | 15-100 | 20-200 |
| McIntosh, Others | 2-2.5 | 0.15-0.4 | 1.2-2 | 0.8-1.5 | 0.25-0.4 | 25-200 | 20-60 | 15-100 | 20-200 |
| Crop | Nitro-gen % | Phosp-horus % | Potass-ium % | Calc-ium % | Magne-sium % | Iron (ppm) | Boron (ppm) | Zinc (ppm) | Manga-nese (ppm) |
|---|---|---|---|---|---|---|---|---|---|
| Blue-berry, Highbush | 1.7-2.3 | 0.15-0.4 | 0.36-0.7 | 0.3-0.8 | 0.12-0.3 | 30-100 | 15-50 | 10-100 | 150-500 |
| Rasp-berry | 2-3.5 | 0.20-0.5 | 1-2 | 0.8-2.5 | 0.25-0.5 | 25-200 | 20-60 | 15-100 | 20-200 |
| Straw-berry | 2-3 | 0.20-0.5 | 1.5-2.5 | 0.5-1.5 | 0.25-0.5 | 25-200 | 20-60 | 15-100 | 20-200 |
| Crop | Nitrogen % | Phosp-horus % | Potass-ium % | Calc-ium % | Magne-sium % | Iron (ppm) | Boron (ppm) | Zinc (ppm) | Manga-nese (ppm) |
|---|---|---|---|---|---|---|---|---|---|
| Vinifera | 0.8-1.4 | 0.15-0.4 | 1.2-2.3 | 1-3 | 0.6-1.5 | 15-100 | 20-60 | 15-100 | 20-200 |
| Fredonia | 0.6-1.2 | 0.15-0.4 | 0.8-1.8 | 1-3 | 0.6-1.5 | 15-100 | 20-60 | 15-100 | 20-200 |
| Other | 0.7-1.3 | 0.15-0.4 | 1-2 | 1-3 | 0.6-1.5 | 15-100 | 20-60 | 15-100 | 20-200 |
| Crop | Nitrogen % | Phosp-horus % | Potass-ium % | Calc-ium % | Magne-sium % | Iron (ppm) | Boron (ppm) | Zinc (ppm) | Manga-nese (ppm) |
|---|---|---|---|---|---|---|---|---|---|
| Peach | 3.4-4.1 | 0.15-0.4 | 2.3-3.5 | 1-2.5 | 0.35-0.6 | 25-200 | 20-60 | 15-100 | 20-200 |
| Pear | 2-2.6 | 0.15-0.4 | 1.2-2 | 1-2 | 0.25-0.5 | 25-200 | 20-60 | 15-100 | 20-200 |
| Plum | 2.4-3.2 | 0.15-0.4 | 1.5-3 | 1-2.5 | 0.35-0.65 | 25-200 | 20-60 | 15-100 | 20-200 |
| Cherry, Montmo-rency | 2.2-3 | 0.15-0.4 | 1.3-2.5 | 1-2.5 | 0.35-0.65 | 25-200 | 20-60 | 15-100 | 20-200 |
1 Leaf nitrogen should be 0.2% higher for apple trees on M.9 or M.26 rootstocks and for all non-bearing trees.
Visual deficiency symptoms
Leaf symptoms can help evaluate some nutrient deficiencies, but have limitations. By the time deficiency symptoms are visible, yield losses may already have incurred. Visual deficiency symptoms are easily confused with other production problems such as pesticide injury, leaf and root diseases, nematodes, insect damage, compaction or air pollution. Suspected visual deficiencies should always be confirmed by tissue analysis. Specific nutrient deficiency symptoms are described in Apple Nutrition, Berry Crop Nutrition, Grape Nutrition, and Tender Fruit Nutrition.
Soil Organic Matter
Soil organic matter helps maintain soil structure, enhances soil moisture-holding capacity, increases the ability of the soil to hold nutrients and improves drainage. Adequate soil organic matter levels can help maintain crop yields and long-term plant health, especially in adverse weather conditions. Many horticultural soils are light-textured and frequently cultivated. The maintenance of organic matter levels in these soils is a challenge but critical to maintain productivity.
To ensure long-term productivity of fruit crops, assess the soil quality of each field before planting and take steps to maintain or improve it. For more information, see OMAFRA Publication 611: Soil Fertility Handbook and Table 4. Optimum Organic Matter Content for Soil Types. See also Cover Crops and Building a Healthy Soil.
| Soil Type | Optimum Organic Matter (%) |
|---|---|
| Sandy | 2-4 + |
| Sandy loam | 3-4 + |
| Loam | 4-5 + |
| Clay loam | 4-5 + |
| Clay | 4-6 + |
Source: The Canada-Ontario Environmental Farm Plan Program Workbook, 3rd ed., 2004.
Soil pH and Liming
The pH scale ranges from 0-14 and is a measure of the hydrogen ion concentration. A pH value of 7.0 is neutral. Values below 7.0 are acidic. Those above 7.0 are alkaline, also called basic. On mineral soils, most fruit crops grow well in a soil pH range from 6.0-7.5. Blueberries require a range of 4.2-5.0. Maintenance of a soil within the appropriate pH range is important. Many crop nutrients, especially micronutrients, become less available at a soil pH above or below the ideal range. At a soil pH less than 5.0, levels of aluminum and manganese may be toxic for sensitive crops.
Raising pH
Soil pH is increased through the broadcast and incorporation of ground limestone into the soil. The amount of lime needed is determined by the soil test results. Table 5. Soil pH and Liming Guidelines for Fruit Crops, shows pH values below which lime is needed, and the target soil pH to which soils should be limed. In Ontario, most crops grow quite well at pH values higher than the target pH. If lime is required, apply it at least one year before planting.
Table 5. Soil pH and Liming Guidelines for Fruit Crops
| Fruit crops | Soil pH below which lime is suggested | Target soil pH |
|---|---|---|
| All fruit crops not listed below | 6.1 | 6.5 |
| Established tree fruits, grapes | 5.6 | 6.0 |
| Blueberry, cranberry | No lime needed | No lime needed |
| Fruit crops | Soil pH below which lime is suggested | Target soil pH |
|---|---|---|
| All fruit crops not listed below | 5.6 | 6.0 |
| Established tree fruits, grapes | 5.1 | 5.5 |
| Blueberry, cranberry | No lime needed | No lime needed |
| Fruit crops | Soil pH below which lime is suggested | Target soil pH |
|---|---|---|
| All fruit crops not listed below | 5.1 | 5.5 |
| Blueberry, cranberry | No lime needed | No lime needed |
Buffer pH
The soil pH measures the amount of acidity in the soil solution, indicating whether liming is necessary for crop production. It does not measure the amount of reserve acidity held on the clay and organic matter particles in the soil, which determines how much lime is needed. Different amounts of reserve acidity will mean that two different soils at the same pH value will need different amounts of lime to raise the pH to the desired level. The reserve acidity is measured in a separate test called the buffer pH. A soil with high reserve acidity will have a low buffer pH and will require considerable lime to raise the pH.
To determine the amount of lime required to reach the target soil pH, use Table 6. Lime Requirements to Correct Soil Acidity.
| Buffer pH | Ground Limestone Required (tonne/ha)* | |||
|---|---|---|---|---|
| Target soil pH = 7.01 | Target soil pH = 6.52 | Target soil pH = 6.03 | Target soil pH = 5.54 | |
7.0 | 2 | 2 | 1 | 1 |
6.9 | 3 | 2 | 1 | 1 |
6.8 | 3 | 2 | 1 | 1 |
6.7 | 4 | 2 | 2 | 1 |
6.6 | 5 | 3 | 2 | 1 |
6.5 | 6 | 3 | 2 | 1 |
6.4 | 7 | 4 | 3 | 2 |
6.3 | 8 | 5 | 3 | 2 |
6.2 | 10 | 6 | 4 | 2 |
6.1 | 11 | 7 | 5 | 2 |
6.0 | 13 | 9 | 6 | 3 |
5.9 | 14 | 10 | 7 | 4 |
5.8 | 16 | 12 | 8 | 4 |
5.7 | 18 | 13 | 9 | 5 |
5.6 | 20 | 15 | 11 | 6 |
5.5 | 20 | 17 | 12 | 8 |
5.4 | 20 | 19 | 14 | 9 |
5.3 | 20 | 20 | 15 | 10 |
5.2 | 20 | 20 | 17 | 11 |
5.1 | 20 | 20 | 19 | 13 |
5.0 | 20 | 20 | 20 | 15 |
4.9 | 20 | 20 | 20 | 16 |
4.8 | 20 | 20 | 20 | 18 |
4.7 | 20 | 20 | 20 | 20 |
4.6 | 20 | 20 | 20 | 20 |
* Based on Agricultural Index of 75.
1 Liming to pH 7.0 is recommended only for club-root control on cole crops.
2 Add lime if soil pH is below 6.1.
3 Add lime if soil pH is below 5.6.
4 Add lime if soil pH is below 5.1.
The lime requirements listed in Table 6 are based on the equations in Table 7. Calculation of Lime Required, and rounded to the nearest tonne/ha. More exact requirements to adjust soil pH to 7.0 may be calculated from the equations in Table 7.
| Target Soil pH | Equation* |
|---|---|
| 7.0 | Lime (tonne/ha) = 334.5 - 90.79 pHB** + 6.19 pHB2 |
| 6.5 | Lime (tonne/ha) = 291.6 - 80.99 pHB + 5.64 pHB2 |
| 6.0 | Lime (tonne/ha) = 255.4 - 73.15 pHB + 5.26 pHB2 |
| 5.5 | Lime (tonne/ha) = 37.7 - 5.75 pHB |
* Based on lime with an Agricultural Index of 75.
** pHB = Buffer pH.
Raising the soil pH with limestone
Either calcitic or dolomitic limestone can be applied to raise soil pH. Calcitic limestone consists largely of calcium carbonate, while dolomitic limestone is a mixture of both calcium and magnesium carbonates. The carbonate in the limestone neutralizes the soil acidity.
Use dolomitic limestone on soils with a magnesium soil test of 100 ppm or less. It is particularly important to use dolomitic limestone when the level of potassium is high because high potassium levels make magnesium deficiency more likely. Either calcitic or dolomitic limestone can be used when magnesium test results are greater than 100 ppm and potassium levels are below 250 ppm.
Limestone varies in its effectiveness for raising soil pH depending on its neutralizing value and its fineness rating.
Neutralizing value is the amount of acid a given quantity of limestone will neutralize when it is totally dissolved. It is expressed as a percentage of the neutralizing value of pure calcium carbonate. Limestone that will neutralize 90% as much acid as pure calcium carbonate is said to have a neutralizing value of 90. In general, the higher the calcium and magnesium content of a limestone, the higher the neutralizing value.
Fineness rating, or particle size, also affects the neutralizing value of limestone. The higher the fineness rating, the more rapidly the limestone raises the soil pH.
The Agricultural Index
The Agricultural Index combines the neutralizing value and the fineness rating of a limestone. It provides a way to compare different limestone sources. Limestone with a high Agricultural Index is applied at a lower rate than limestone with a low index. A limestone's Agricultural Index is determined by the following formula:
Agricultural Index = (neutralizing value × fineness rating)/100
Limestone recommendations from the OMAFRA-accredited soil tests are based on limestone with an Agricultural Index of 75. When you use a limestone source with a different Agricultural Index, a specific rate of application may be calculated with the following equation:
Limestone application rate from soil test x (75/Agricultural Index of the limestone source being used) = Rate of application of the limestone source being used
For example, if a soil test recommends 9 tonnes/ha of limestone and the limestone source has an Agricultural Index of 90, the application rate should be 7.5 tonnes/ha (9 × 75/90 = 7.5 tonnes/ha).
The Agricultural Index does not provide information about magnesium content.
Effect of tillage depth
The lime application rates presented in Table 6. Lime Requirements to Correct Soil Acidity, should raise the pH of the top 15 cm of soil to the listed target pH. If the soil is plowed to a lesser or greater depth than 15 cm, proportionately more or less lime is required to reach the same target pH. Where shallow tillage depths are used, more frequent applications of lower rates are suggested.
Lowering pH
On soils with pH values below 6.5, it is possible to lower the pH (make the soil more acidic) by adding sulphur or ammonium sulphate. This may be desirable for some crops, such as blueberries, but usually will not be suitable for rotation crops. Soil pH cannot be adjusted up or down from year to year. Ammonium sulphate should not be applied at rates of nitrogen higher than those recommended for the current crop. Table 8. Sulphur for Soil Acidification, shows the amount of elemental sulphur required to lower the pH of various soils.
If the soil pH is above 6.5, it is not advisable and also usually quite impractical to lower the soil pH because of the very large amounts of sulphur or ammonium sulphate required. For more information see OMAFRA Publication 611: Soil Fertility Handbook (Soil Acidification, page 94).
| Soil Type | Sulphur Required (kg/ha) | |
|---|---|---|
| For each 1.0 pH unit | For each 0.1 pH unit | |
| Sand | 350 | 35 |
| Sandy loam | 750 | 75 |
| Loam | 1,100 | 110 |
Nitrogen
Nitrogen is an important element for the growth and development of all plants, and is naturally present in all soils. As soil microbes feed on crop residues and soil organic matter, they release nitrogen into the soil. As soil organic matter levels increase, so do the levels of naturally available nitrogen. Management practices which maintain and increase soil organic matter will also help to enhance soil fertility and crop productivity. Legumes, such as alfalfa and red clover, can increase soil nitrogen concentrations by capturing atmospheric nitrogen and releasing it slowly into the soil.
Visual nitrogen deficiency symptoms
Nitrogen deficiencies usually first appear on older leaves. These leaves will turn light green or yellow as nitrogen is relocated from older, less productive leaves to the newest growth. Cool temperatures in early spring often cause plants to develop a temporary nitrogen deficiency. This is usually due to poor growing conditions, and not necessarily a lack of nitrogen in the soil.
Nitrogen and the environment
Nitrogen levels in the soil change constantly. Processes like leaching and denitrification result in the loss of nitrogen from the soil. Denitrification occurs when the soil is waterlogged. Anaerobic microbes convert nitrate and ammonia into nitrous oxide. This gas can contribute to air pollution and is approximately 300 times more potent than carbon dioxide as a greenhouse gas.
The nitrate form of nitrogen, while being readily available to plants, moves easily in water through the soil. As a result, it has the potential to pollute groundwater and surface water.
Applying just enough nitrogen to meet the crop's growth requirements greatly reduces the risk of loss to the environment. The potential for nitrogen loss is highest during the late fall and early spring. Applying nitrogen according to the crop's need reduces residual soil nitrogen at the end of the season and leaves little available for losses.
It is important to account for fertilizer, manure and other sources of nitrogen when you assess a crop's fertility requirements. Other management practices to reduce the risk of nitrate losses include:
- use of cover crops
- timing nitrogen applications close to crop nitrogen uptake
- reduction of total nitrogen applications
Sources of nitrogen
Synthetic fertilizer
The most common nitrogen fertilizer sources are outlined in Table 9. Fertilizer Materials: Primary Nutrients. Generally, all nitrogen sources are effective in providing a crop with nitrogen. Cost, crop management and ease of application will largely determine the selection of one source over another.
If nitrogen is to be applied early in the spring when soils are below 10°C, using urea may prevent leaching losses. Under these conditions, it takes 3-6 weeks for urea to convert to the plant-available ammonium and nitrate forms. As only nitrate-nitrogen is susceptible to leaching losses, early spring rain will not result in leaching where urea is used as the nitrogen source. By the time the nitrate conversion has occurred, the crop is entering its rapid growth phase and minimal downward percolation of water will make leaching less likely.
| Nitrogen Materials | Form | % Nitrogen (N) |
|---|---|---|
| Ammonium nitrate | dry | 34 |
| Ammonium sulphate | dry | 20 |
| Calcium ammonium nitrate | dry | 27 |
| Calcium nitrate | dry | 15.5 |
| Urea | dry | 46 |
| Anhydrous ammonia | liquid1 | 82 |
| Urea ammonium nitrate (UAN) | liquid | 28-32 |
1 Liquid under pressure.
| Phosphate Materials | Form | % Phosphate (P2O5) |
|---|---|---|
| Diammonium phosphate (18-46-0) | dry | 46 |
| Monoammonium phosphate (11-52-0) | dry | 50-52 |
| Single superphosphate | dry | 20 |
| Triple superphosphate | dry | 46 |
| Ammonium polyphosphate (10-34-0) | liquid | 34 |
| Potash Materials | Form | % Potash (K2O) |
|---|---|---|
| Muriate of potash | dry | 60-62 |
| Potassium nitrate (13-0-44) | dry | 44 |
| Sulphate of potash | dry | 50 |
| Sulphate of potash magnesia (11% Mg) | dry | 22 |
Products that modify the release of nitrogen
Slow-release fertilizers have granules that have been coated in sulphur or a polymer to control the release of the nitrogen over an extended period of time. Nitrification inhibitors are added to nitrogen fertilizers to help delay the chemical conversion of urea into the plant-available forms. Depending on the weather conditions, the delayed release of these products may not necessarily coincide with peak nitrogen demand.
Manure nitrogen
In addition to nutrients and micronutrients, manure also supplies valuable organic matter that helps to build and maintain soil structure. Adjust fertilizer rates to account for the nutrients in manure.
During the first growing season after application, 50%-60% of the nitrogen in manure is available to the crop. The remaining organic nitrogen becomes available in small, diminishing quantities in successive years. Up to 10% of the total nitrogen in manure can be available for the following year. Where manure is applied regularly to the same field, there may be a significant amount of residual nitrogen available for a crop.
The quantities of nutrients contained in manure can vary greatly. The type of livestock, ration, bedding, added liquids and storage system all affect the final nutrient analysis. Table 10. Average Fertilizer Replacement Values for Manure provides the approximate amount of crop-available nitrogen in manure. A manure analysis, available from several laboratories in Ontario, provides the most accurate assessment of the nutrients contained in a specific source of manure. Refer to the list of accredited soil-testing laboratories in Ontario providing this service.
Use manure responsibly
- Avoid the spread of manure on frozen or snow-covered ground.
- Avoid application when the potential for runoff (soil is wet, rain is imminent, etc.) is high.
- Tillage prior to the application of liquid manure will help to break up soil cracks and large pores, and prevent the movement of manure into field tiles or shallow groundwater.
- Inject or incorporate the manure to minimize loss of ammonia to the atmosphere.
- When storing manure, follow guidelines in OMAFRA Factsheet, Temporary Field Storage of Solid Manure or Other Agricultural Source Materials.
Manure and food safety
Fruit can become contaminated in the field if it comes into contact with pathogens that cause human illness. These pathogens may come from manure and manure-based composts. Depending on conditions, these pathogens can survive from 1 to more than 300 days after field application of fresh manure. Pathogens can be reduced to acceptable levels when manure is properly composted. Proper composting means that all parts of the manure pile must heat to 55°C for 3 days to reduce pathogen levels. Fresh or uncomposted manure should not be applied to fields where fruit or vegetable crops will be harvested within 120 days.
| Manure | % Average Dry Matter | Available2 Nitrogen (N) | Available3 Phosphate (P205) | Available4 Potash (K2O) |
|---|---|---|---|---|
Liquid Manure | kg/1,000 L (lb/1,000 gal) | |||
Dry Manure | kg/tonne (lb/ton) | |||
| Liquid dairy | 8.6 | 1.8 (18) | 0.8 (8.3) | 2.7 (27) |
| Liquid hog | 3.6 | 2.5 (25) | 1.1 (11) | 2.1 (21) |
| Liquid poultry | 10.0 | 4.7 (47) | 2.6 (26) | 3.2 (32) |
| Solid poultry | 60.6 | 15.9 (32) | 12.1 (24) | 15.7 (31.4) |
| Solid dairy | 25.9 | 2.6 (5.2) | 1.8 (3.7) | 6.6 (13.2) |
| Composted dairy | 38.3 | 2.2 (4.5) | 2.6 (5.2) | 11.1 (23.8) |
| Solid beef | 31.4 | 3.6 (7.3) | 3.0 (6.1) | 7.1 (14.3) |
| Sheep | 32.2 | 2.8 (5.5) | 3.1 (6.3) | 8.2 (16.4) |
| Horse | 37.4 | 0 (0) | 1.4 (2.8) | 4.6 (9.3) |
*Nutrient values are based on average analysis for over 3,000 samples. There are large variations in nutrient content between manures,
so a manure analysis is your best guide to nutrient availability.
1 Data from manure analysis provided from Ontario labs collected between 1992 and 2012.
2 Nitrogen based on spring application, incorporated within 24 hours. Unincorporated manure will have less N due to ammonia losses.
3 Phosphate from manure or biosolids is assumed to be 40% as available in the year of application as that in commercial fertilizer (another 40% of the phosphorus is available the following year).
4 Potassium from manure is assumed to be 90% as available in the year of application as that in commercial fertilizer.
Legumes
Rhizobium bacteria infect the roots of legume crops. These bacteria convert atmospheric nitrogen into inorganic nitrogen. As the legume crop residue decomposes, this nitrogen becomes available for subsequent crops. When fruit crops are planted following alfalfa hay, or a legume cover crop such as red clover, the rate of fertilizer nitrogen should be decreased according to Table 11. Nitrogen Contribution of Plowed-Down Legumes.
| Type of sod | For all crops, deduct from N requirement (kg N/ha) |
|---|---|
| Less than 1/3 legume | 0 |
| 1/3 to 1/2 legume | 55 |
| 1/2 or more legume | 100 |
| Perennial legumes seeded and plowed the same year | 451 |
| Soybean and field bean residue | 0 |
1 Applies where the legume stand is thick and over 40 cm high.
Other organic nutrient sources
Biosolids derived from paper mill fibre have been used in orchards and vineyards to maintain soil organic matter. However, before this material can be applied to land, you must have an Environmental Compliance Approval (ECA) issued by the Ministry of the Environment and Climate Change (MOECC) for the site. Rates depend upon the nitrogen content of the material and can be in the range of 25-30 dry tonnes/ha. However, MOE has final approval of the material and the applied rate. Any application restrictions are included as conditions on the ECA.
Biosolids from sewage treatment plants or paper mill waste can be a useful source of nutrients and organic matter. Guidelines for their use are available from OMAFRA and MOECC. An ECA for land application is required and is available from MOECC. An analysis of nutrients applied should be given by the applicator to the landowner whenever biosolids are applied. Always consult with your processor, packer or broker before applying municipal sewage biosolids on ground intended for vegetables anywhere in the rotation.
Municipal sewage biosolids must not be applied to tree fruits or grapes within three months of harvest. For small fruit (strawberries, raspberries and blueberries), application may not occur within 15 months of harvest.
Avoid fertilizer burn!
Like all inorganic fertilizers, nitrogen and potash fertilizers are salts. If a germinating seedling or young transplant comes into contact with a concentrated fertilizer band, the tender roots may become seriously damaged. For this reason, it is important to ensure that the correct fertilizer and the appropriate rate are selected for each application.
Urea is an effective, economical source of nitrogen for broadcast applications but it has a relatively high salt index. It is not suitable for use in starter fertilizers or banded applications. If low soil moisture conditions exist at the time of planting, urea burn may occur on coarse sandy loam soils and growers should consider switching to a different nitrogen source. Anhydrous ammonia also has a relatively high salt index. It is an effective source for side-dress applications that must be injected into the soil.
Ensure that starter or transplant fertilizers contain only as much nitrogen as necessary to get the crop started. Fertilizers that contain more than half as much nitrogen as phosphate frequently contain urea and may cause crop damage.
Phosphorus
Like nitrogen, phosphorus is important to photosynthesis and the development of enzymes and protein. It also plays a major role in cell division and the synthesis and transport of sugars and starches.
Soil phosphorus levels across Ontario are variable. Because phosphorus, as orthophosphate, tends to bind to soil particles, leaching through the soil profile is minimal. Many coarse sandy loam soils often contain high phosphorus levels. Soils with a history of regular manure applications have high levels of phosphorus, and fruit crop yield will rarely respond to additional phosphorus fertilizer. Too much phosphorus can induce deficiencies of zinc and iron.
Visual phosphorus deficiency symptoms
Phosphorus deficiency symptoms usually develop on the older leaves first. The leaves develop a purplish-red colour that may be more noticeable on the underside of the leaves. Severe deficiencies may also cause the leaf tips to die back. Cool, wet soil conditions often induce phosphorus deficiencies. During establishment of early-planted fruit crops, use a starter fertilizer to deliver the required phosphorus directly to the root zone.
Phosphorus in the environment
Surface runoff is the main route by which phosphorus leaves the field and contaminates the environment. It can be transported in solution with runoff water or through its attachment to eroded soil particles. When this water reaches open surface water, streams can become polluted.
Avoid additional phosphorus applications to soils that are rated Rare Response (RR) or No Response (NR). If phosphorus is required to promote early season growth, use low rates applied in a band close to the roots or as a starter fertilizer.
Farmers who are required to complete a nutrient management plan must establish a permanent vegetative buffer adjacent to any surface water, with a minimum width of 3 m, prior to any nutrient application. This practice is highly recommended even in situations where it is not a requirement. The grass will help reduce erosion and act as a natural filter for runoff entering the watercourse.
Where phosphorus soil tests are greater than 30 ppm, use the Phosphorus Index to determine separation distances from surface water sources. The Phosphorus Index uses factors such as field slope, length of slope, soil drainage class and soil texture to determine an appropriate rate and separation distance for phosphorus application from surface water. For details, see OMAFRA Factsheet, Determining the Phosphorus Index for a Field.
More information on best management practices for reducing phosphorus from agriculutral sources can be found in A Phosphorus Primer available through Service Ontario at Ontario.ca/publications.
Sources of phosphorus
Mineral fertilizers
The most common phosphate fertilizer sources are outlined in Table 9. Fertilizer Materials: Primary Nutrients.
Manure
When properly applied, manure is an excellent, inexpensive phosphorus source. It also supplies the soil with valuable organic matter and micronutrients. Table 10. Average Fertilizer Replacement Values for Manure, provides the approximate amount of crop-available phosphorus contained in manure.
Unlike nitrogen, the phosphorus in manure becomes available to crops over a considerable period of time. Regular manure applications may result in a build-up of soil phosphorus, which should be monitored with a soil-testing program.
Manure can pose a food safety risk on many fruit crops. Ensure at least 120 days between manure application and harvest.
Phosphorus application methods
Phosphorus is relatively immobile in the soil, therefore, broadcasting and incorporating any required phosphorus prior to planting perennial fruit crops is crucial. Some phosphorus is often applied at planting in a band or in transplant solution to ensure good vigour of new plantings. On established perennial crops, it can be broadcast on the surface or banded near the roots. Do not rely on fertigation for phosphorus application.
Phosphorus requirements
Use a soil test from an OMAFRA-accredited lab in conjunction with Table 12. Phosphorus Requirements for Fruit Crops. For crop-specific details see Apple Nutrition, Berry Crop Nutrition, Grape Nutrition, and Tender Fruit Nutrition.
| Soil phosphorus (ppm)* | New plantings of blueberries, strawberries, raspberries, gooseberries, currants, nursery stock | Established blueberries, strawberries, raspberries, gooseberries, currants, nursery stock | New plantings¹ of apples, peaches, pears, plums, cherries, grapes |
|---|---|---|---|
| Phosphate (P205) required (kg/ha)[response rating] | |||
0-3 | 140 [HR] | 100 [HR] | 80 [HR] |
4-5 | 130 [HR] | 90 [HR] | 60 [HR] |
6-7 | 120 [HR] | 80 [HR] | 50 [HR] |
8-9 | 110 [HR] | 70 [HR] | 40 [MR] |
10-12 | 100 [HR] | 70 [HR] | 20 [MR] |
13-15 | 90 [HR] | 60 [HR] | 0 [LR] |
16-20 | 70 [MR] | 50 [MR] | 0 [LR] |
21-25 | 60 [MR] | 40 [MR] | 0 [RR] |
26-30 | 50 [MR] | 30 [MR] | 0 [RR] |
31-40 | 40 [MR] | 20 [MR] | 0 [RR] |
41-50 | 0 [LR] | 0 [RR] | 0 [RR] |
51-60 | 0 [RR] | 0 [RR] | 0 [RR] |
61-80 | 0 [NR] | 0 [NR] | 0 [NR] |
80+ | 0 [NR] | 0 [NR] | 0 [NR] |
HR, MR, LR, RR, and NR denote, respectively: high, medium, low, rare and no probabilities of profitable crop response to applied nutrient.
* 0.5 M sodium bicarbonate extract test method.
¹ For established tree fruits and grapes, plant analysis is used to estimate requirements.
Potassium
Potassium is an important component of plant cells. It also influences the uptake of water by the roots and plays a role in both respiration and photosynthesis. The sugar and starch content of crops like potatoes and tomatoes may be affected by potassium levels. Most crops require equal amounts of potassium and nitrogen.
Visual potassium deficiency symptoms
Potassium deficiency usually appears on the older leaves first. It can cause yellowing or burning of leaf margins.
Sources of potassium
Mineral fertilizers
The most common potassium sources are outlined in Table 9. Fertilizer Materials: Primary Nutrients.
Manure
Manure is an excellent, inexpensive source of potassium. It also supplies the soil with valuable organic matter and micronutrients. Table 10. Average Fertilizer Replacement Values for Manure, provides the approximate amount of crop-available potash contained in manure.
Unlike nitrogen, the potassium found in manure can be held by the soil over a considerable period of time. Regular application of manure over time may result in a build-up of potassium which should be monitored with a soil-testing program.
Manure can pose a food safety risk on many fruit crops. Ensure at least 120 days between manure application and harvest.
Potassium application methods
The mobility of potassium fertilizers is limited and falls between that of nitrogen and phosphorus. It is not prone to leaching losses, with the possible exception of very sandy soils low in organic matter. Potash should be broadcast and incorporated prior to planting. In drip irrigation systems, up to half of the potassium requirement can be applied through fertigation after crop establishment. At least half of the potassium should be applied in the spring as a broadcast, band in the drip-line of the crop, or in the herbicide strip. Potassium can be blended with nitrogen and applied in one application.
Foliar applications can be made in grapes and should be considered in dry years when soil uptake is reduced. Foliar application at veraison may improve yield of grapes.
Potassium requirements
Use a soil test from an OMAFRA-accredited lab in conjunction with Table 13. Potassium Requirements for Fruit Crops . For crop-specific details see Apple Nutrition, Berry Crop Nutrition, Grape Nutrition, and Tender Fruit Nutrition.
Excessive potassium applications reduce a crop's ability to take up magnesium from the soil. Where potassium levels are high, magnesium deficiencies are more likely to occur, particularly if magnesium levels are already low.
Potassium is important for fruit colour, winter hardiness, tree growth and disease resistance in tree fruits. In apples and tender fruits, do not exceed 3 kg of potash per tree even in cases of severe deficiency.
Do not use muriate of potash (0-0-60) in blueberries, currants and gooseberries due to their sensitivity to chloride.
| Soil potassium (ppm)* | New or established blueberries, strawberries, raspberries, gooseberries, currants, nursery stock | New plantings of apples, peaches, pears, plums, cherries1 | New plantings of grapes1,2 |
|---|---|---|---|
| Potash (K20) required (kg/ha)[response rating] | |||
0-15 | 130 [HR] | 180 [HR] | 270 |
16-30 | 120 [HR] | 170 [HR] | 270 |
31-45 | 110 [HR] | 160 [HR] | 270 |
46-60 | 100 [HR] | 140 [HR] | 270 |
61-80 | 90 [HR] | 110 [HR] | 270 |
81-100 | 80 [HR] | 70 [MR] | 270 |
101-120 | 70 [MR] | 40 [MR] | 270 |
121-150 | 60 [MR] | 20 [MR] | 270 |
151-180 | 40 [MR] | 0 [LR] | 270 |
181-210 | 0 [LR] | 0 [LR] | 270 |
211-250 | 0 [RR] | 0 [RR] | 270 |
250+ | 0 [NR] | 0 [NR] | 270 |
* 1 M ammonium acetate extract test method.
¹ For established tree fruits and grapes, plant analysis is used to estimate requirements.
² Apply only every second year.
Calcium
Calcium is a vital component of cell walls and is involved in the metabolism and formation of the cell nucleus. Calcium pectate in the cell walls provides a physical barrier to disease entry. Calcium does not move readily within the plant.
Calcium deficiencies may cause the growing point to die. It may also cause the blossoms and buds to drop prematurely. However, calcium deficiencies rarely occur in fruit crops grown on soils with a pH of 6.0-7.5. On coarse sandy loam soil, with acidic or low pH, additional soil or foliar calcium may be required. Refer to Table 14. Calcium, Magnesium and Micronutrient Sources.
Calcium-related disorders may occur in some crops, for example tip burn in strawberries, gummosis in plums, and bitter pit in some apple varieties. Several management practices will reduce the occurrence of calcium-related disorders. Avoiding over-application of nitrogen will help prevent excessive vegetative growth which can dilute the calcium in the plant. Good soil management practices ensure good root growth, which will promote both water and nutrient uptake. Timely irrigation will help keep calcium moving into the plant.
Foliar applications of calcium can be made to reduce the incidence of bitter pit in apples, gummosis in European plums, stem and bunch breakdown in certain varieties of grapes and various problems in pears. Because of the potential for leaf burn and premature ripening with foliar-applied calcium, only apply if a problem is anticipated. For crop-specific details, see Apple Nutrition, Grape Nutrition, and Tender Fruit Nutrition. Do not concentrate sprays or leaf burn could occur. To avoid adverse effects on fruit quality and storability, do not apply calcium formulations containing nitrogen beyond the end of July unless correcting a nitrogen deficiency. Consult OMAFRA Factsheet, Bitter Pit Control in Apples.
| Nutrient | Source | % Nutrient | Other Nutrients | Application | |
|---|---|---|---|---|---|
| Soil | Foliar | ||||
| Calcium (Ca) | calcitic limestone | 22-40 | - | ? | - |
| calcium chloride | 36 | 64% chloride | ? | ? | |
| calcium nitrate | 19 | 15.5% nitrogen | ? | ? | |
| calcium sulphate (gypsum) | 23 | 19% sulphur | ? | - | |
| dolomitic limestone | 16-22 | 6%-13% magnesium | ? | - | |
| pelletized lime | 16-40 | 0%-13% magnesium | ? | - | |
| Magnesium (Mg) | dolomitic limestone | 6-13 | 16%-22% calcium | ? | - |
| epsom salts | 9 | 13% sulphur | ? | ? | |
| sulphate of potash magnesia | 11 | 22% potash K2O 20% sulphur | ? | - | |
| Boron (B) | sodium borate | 12-21 | - | ? | ? |
| solubor | 20 | - | - | ? | |
| various granular materials | 12-15 | - | ? | - | |
| Copper (Cu) | copper chelates | 5-13 | - | - | ? |
| copper sulphate | 13-25 | 6.5-12.5% sulphur | ? | - | |
| Iron (Fe) | ferrous sulphate | 20 | 11% sulphur | - | ? |
| iron chelates | 3-13 | - | - | ? | |
| Manganese (Mn) | manganese chelates | 5-12 | - | - | ? |
| manganese sulphate | 28-32 | 16%-18% sulphur | - | ? | |
| Molybdenum (Mo) | sodium molybdate | 39 | - | - | ? |
| Zinc (Zn) | zinc chelates | 9-14 | - | - | ? |
| zinc oxysulphate | 8-36 | - | ? | - | |
| zinc sulphate | 36 | 17% sulphur | ? | ? | |
*A number of micronutrients are available as chelates, with various formulations and nutrient contents. Check the product labels for crop-specific recommendations. The effective use rate for chelated products is the same as for other formulations. ? indicates that it can be applied to the soil or as a foliar spray.
Magnesium
Magnesium is an essential part of chlorophyll and aids in the formation of sugars, oils and fats.
Magnesium is mobile within the plant. Deficiencies usually appear on the older leaves first as it is translocated to the younger leaves. The leaf tissue between the veins turns yellow, while the veins remain green. Severe deficiencies will cause the leaf margins to curl. In apples, magnesium deficiency can cause premature fruit drop, especially with McIntosh. A foliar spray will correct magnesium deficiency in the current year only, and should be combined with soil application for a longer term solution.
In conjunction with an OMAFRA-accredited magnesium soil test, consult Table 15. Magnesium Management in Soil for Fruit Crops.
Excessive potassium applications can induce a magnesium deficiency, therefore avoid using high rates of potash on soils with a low magnesium rating.
Micronutrients
Micronutrients include boron, copper, iron, manganese, molybdenum and zinc. Plants use these elements in much smaller amounts than macronutrients (nitrogen, phosphorus, potassium, calcium and magnesium). Because such small quantities are required, routine application is generally an unnecessary expense. However, micronutrients are crucial to growth and deficiencies must be corrected.
Micronutrients are usually found in much lower levels in the soil than macronutrients. Soil pH, organic matter, clay and mineral content can strongly influence micronutrient availability. This makes soil tests for estimating micronutrient availability less reliable than those for the primary nutrients.
Which to choose: soil or foliar fertilizers?
Both soil and foliar fertilizers play a role in fruit crop production. The macronutrients are required in relatively high amounts for crop growth. As a result, soil application is almost always the most efficient and economical method of getting these nutrients into the plant. Foliar uptake occurs through the leaf's cuticle and the stomata. The amount of nutrients that can enter the plant through these means is quite limited. Higher application rates may lead to crop injury.
Since micronutrients are required in much lower quantities, they can often be efficiently delivered through foliar applications, especially when soil conditions limit micronutrient availability. If a micronutrient deficiency is found, foliar application is the quickest way of addressing it. This can be followed with a soil application to prevent a recurrence, depending on the micronutrient and the soil pH.
Do not apply micronutrients to fruit crops unless a deficiency is identified. Apply only the deficient nutrient in sufficient quantities to correct the problem. The range between deficiency and toxicity with micronutrients can be narrow.
Use caution when you apply mixtures of several micronutrients, as crop injury may occur. Always follow the product label. Do not combine micronutrients with insecticides, fungicides or herbicides unless there is information from the manufacturers that indicates the components are compatible. Many chelated micronutrients will consolidate in the spray tank if mixed with pesticides. Use caution when applying micronutrients through fertigation systems. Certain micronutrient blends may plug the emitters.
Foliar-applied nutrient uptake can be improved through the timing of the application and the use of surfactants. Younger leaves generally have a less well-developed cuticle and are able to take up more of the nutrient. Early morning applications may favour foliar uptake, and drought stress that results in a thicker cuticle may hinder uptake. Avoid the application of foliar nutrients during the heat of the day when leaves will dry quickly. Ensure good leaf coverage, particularly on the underside.
If a micronutrient is required, refer to Table 14. Calcium, Magnesium and Micronutrient Sources, and consult the manufacturer's label for information on rates, timing and recommendations to minimize injury.
| Soil Magnesium* (ppm Mg) | Rating | Recommendation |
|---|---|---|
Below 20 | HR | Magnesium (Mg) should be applied for all crops. If pH is below 6.5, apply dolomitic limestone. At higher pH values, apply 30 kg soluble Mg/ha. Potash applications in excess of those recommended by soil test will increase the probability of magnesium deficiency. |
20-39 | MR | Magnesium is not required unless potassium (K) soil test is above 250 ppm. If soil test K is above 250 ppm and pH is below 6.5, apply dolomitic limestone. At higher pH values with K above 250 ppm, apply 30 kg soluble Mg/ha. |
40-100 | LR | If limestone is required, use dolomitic. |
100+ | NR | If limestone is required, either dolomitic or calcitic may be used. |
HR = High response. MR = Medium response. LR = Low response. NR = No response to applied nutrient.
* 1 M ammonium acetate extract.
Boron
Boron plays an important role in the structure of cell walls, fruit set and seed development, as well as protein and carbohydrate metabolism.
Boron deficiency is most likely to be found on alkaline soils or sandy knolls. Symptoms vary widely between crops. Apples may exhibit internal breakdown and premature drop of highly coloured fruit. Boron toxicity may occur when sensitive crops are planted in a rotation where boron has been applied or over-applied.
There is no OMAFRA-accredited boron soil test. Some soil test reports provide a soil boron value, however, soil levels are often less than 1 ppm, making it very difficult to get an accurate measurement. To correct deficiency, fertilizer manufacturers may mix boron sources with other fertilizers to be applied. Boron can also be foliar-applied for faster results.
Some crops are very sensitive to boron deficiencies. A soil pH between 5.0 and 7.0 provides the best conditions for boron uptake. Boron deficiencies are more likely to occur on soils with low organic matter and on exposed or eroded subsoils. Boron availability decreases during periods of drought.
Copper
Copper plays a role in chlorophyll production. It may also have a role in the suppression of some diseases.
Copper deficiency is rare on mineral soils, except perhaps very sandy soils.
Because soil tests for copper are unreliable, there is no OMAFRA-accredited copper soil test. Plant tissue analysis is a more useful tool.
Copper sulphate may injure leaves.
Iron
Iron is needed for chlorophyll formation, plant respiration and the formation of some proteins.
Iron deficiency, also called lime-induced chlorosis, is rare in Ontario. Symptoms appear on the young leaves first. Leaves turn yellow between the veins, but the veins will remain green except in extreme cases. Often symptoms are seen in only one area of the plant. Factors associated with iron deficiency include soils with high lime content (and therefore high pH), and gross imbalances with other micronutrients like molybdenum, copper or manganese.
An iron soil test does not correlate well with plant uptake or fertilizer response in Ontario. Consequently, there is no OMAFRA-accredited iron soil test. Plant analysis is a much more reliable indicator of iron availability. Iron deficiency is easily corrected with the foliar application of iron chelates, whereas soil application is not generally effective.
Manganese
Manganese is involved in photosynthesis and chlorophyll production. It helps activate enzymes involved in the distribution of growth regulators within the plant.
Manganese deficiency causes yellowing between veins of young leaves. Leaves gradually turn pale green with darker green next to the veins. Manganese toxicity can occur on soils with a low pH. It causes brown spots or yellow mottled areas near leaf tips and along the leaf margins and usually develops on older leaves. Brown spots may also develop on veins, petioles and stems.
The OMAFRA-accredited manganese soil test uses a manganese availability index. This index evaluates manganese availability based on soil manganese level and soil pH.
Soil-applied manganese may be useful in acidic, sandy soils. In soils with a pH greater than 6.5, soil-applied manganese will be unavailable to the plant. On alkaline soils, banded applications are often more effective than broadcast. Foliar-applied manganese is generally more effective where a manganese deficiency has been confirmed. If a deficiency is confirmed, apply foliar sprays when the plants are about one-third grown or sooner. Two or more sprays may be necessary at 10-day intervals.
Manganese availability is greatest at a soil pH of 5.0-6.5. It is important not to add more limestone than is needed to correct soil acidity. High organic matter levels decrease manganese availability. Foliar applications may be required for crops grown on muck soils.
Zinc
Zinc is important in early plant growth and in seed formation. It also plays a role in chlorophyll and carbohydrate production.
Zinc is relatively immobile within the plant. Deficiency symptoms appear first on younger leaves. Young leaves become mottled and show interveinal chlorosis, striping or banding. In advanced stages in tree fruits, small, narrow terminal leaves are arranged in whorls. This results in the typical "rosette" and "little leaf" description for zinc deficiency symptoms. Use leaf and soil analysis to test for zinc deficiency.
The OMAFRA-accredited zinc soil test is reported as a zinc index value, which estimates availability based on soil zinc level and soil pH. Zinc deficiency can be prevented by the application of zinc fertilizer to the soil at a rate of 4 kg of zinc/ha. Broadcasting up to 14 kg of zinc/ha will correct a deficiency for three years. No more than 4 kg zinc/ha should be banded. Early in the growing season, foliar sprays can be used to correct a deficiency after the symptoms have appeared.
Zinc deficiencies are most often seen on sandy soils with high pH levels. Heavily eroded knolls may also have deficiency problems. Large applications of phosphorus may aggravate zinc deficiencies. Livestock manure is often an excellent source of zinc.
Cover Crops and Building a Healthy Soil
A healthy fruit crop starts with a healthy soil. The key to success in building a healthy soil is effective management of the soil organic matter. Soil organic matter helps to maintain soil structure, enhances soil moisture-holding capacity, increases the soil's ability to hold nutrients and improves drainage. Maintaining adequate soil organic matter levels can help maintain crop yields, particularly in years of adverse weather.
Soil organic matter is made up of three parts: active, moderately stable and very stable. Growers can have the most influence on the active portion. The organic matter pool continually experiences gains and losses. If the addition of organic material to the soil exceeds the losses, organic matter levels increase. If the losses exceed the gains, organic matter levels will decrease. Increasing soil organic matter is a slow process, since only a small part of the organic matter added to the soil ends up as stable humus. It is therefore important to keep as much organic matter in the soil as possible by reducing soil erosion and eliminating unnecessary tillage passes. Organic matter additions are the most dependable way to increase total soil organic matter. These additions may be in the form of livestock manures, compost, forage crops or cover crops. Crop rotation prior to perennial fruit crop establishment plays a key role in maintaining soil organic matter.
Cover crops play a major role in soil management. They provide ground cover to reduce erosion and they add organic matter to improve or maintain the soil. There is growing interest in the use of cover crops for disease and pest suppression to replace or supplement chemical controls. Cover crops have a wide variety of suitable planting dates. Timely planting of cover crops will ensure the most soil improvement benefits from the cover crop investment. While broadcast application and incorporation of cover crop seed works well to establish cover crops, direct seeding or drilling will ensure faster and more even establishment.
Knowing what you want to achieve with a cover crop will help you select the best one for the job. See Table 16. Selecting a Cover Crop, and Table 17. Characteristics of Cover Crops. Cover crops can be divided into three groups based upon plant types: grasses, legumes and non-legume broadleaves.
Grasses
Grasses have fine, fibrous root systems that are well-suited to holding soil in place and improving soil structure. Grass species suitable for cover crops are fast-growing and relatively easy to kill (chemically, mechanically or by winter temperatures). Grasses do not fix nitrogen from the atmosphere, but they can scavenge large quantities of residual nitrogen left in the field after harvest. Wind strips are usually created from overwintering grass cover crops.
Spring cereals
Spring cereals are well-suited for late summer and early fall plantings. Under good growing conditions, spring cereals, like oats and barley, produce the greatest amount of crop biomass, and provide good ground cover. Once well-established, spring cereals are relatively tolerant of frost. Do not attempt to establish spring cereals later than mid-September, however, as the growth will be limited.
Winter cereals
Winter cereals are highly versatile cover crops. They can be planted in summer and will tiller and thicken due to their need for a cold treatment before flowering. Cereals such as winter wheat and rye can also be planted in fall for soil cover. Winter cereals generally overwinter well, providing winter and spring erosion protection. These grasses can be used to create spring wind barriers or residue mulch, or they can be killed early with herbicide to minimize residue cover at planting.
Warm-season grasses
Warm-season grasses like sorghum and millet are best suited for planting into the warmer soils of late June, July and early August. They are very sensitive to frost. Root growth is extensive and the top growth lush. Be prepared to mow these grasses to keep stalks tender and prevent heading. Do not mow closer than 15 cm to ensure regrowth. Nitrogen may be needed to achieve optimal growth.
Legumes
Legume cover crops can fix nitrogen from the air. They then supply nitrogen to the succeeding crop, protect the soil from erosion and add organic matter. The amount of nitrogen fixed varies depending upon species, stand density and the length of growth. Generally, more top growth indicates that more nitrogen is fixed. Ontario research has suggested that legume cover crops, such as red clover, are also effective at scavenging residual nitrogen from the soil.
Nitrogen release from legumes can be inconsistent. Account for this when calculating crop fertilizer needs. Excess nitrogen release late in the season could lead to excessive vegetative growth in fruit crops.
Some legume species, such as alfalfa or red clover, have aggressive tap roots that can break up subsoil compaction, but this requires more than one season's growth.
Non-legume broadleaves
These broadleaf crops cannot fix nitrogen out of the air but they may absorb large quantities from the soil. Growth will be poor if soil nitrogen levels are low or if compaction is severe. Most of these crops are not winter-hardy, so additional control measures are not normally required. Do not allow these crops to go to seed, as the volunteer seedlings can become a significant weed problem.
Cover crop mixtures
There is growing interest in cover crop mixtures from simple two-species mixes, such as oats and cover crop radish, to more complex mixtures. Mixtures support greater diversity and appear to achieve greater plant growth through synergy.
New and emerging cover crops
Every year new crops are evaluated as cover crops. Often these species are from different parts of the world and may not be well-adapted to Ontario growing conditions. For more information on new and well-known cover crop species, see the soil management section of the OMAFRA website at Ontario.ca/crops or look at the regional pages and the Cover Crop Decision Tool from the Midwest Cover Crop Council.
| Function of the Cover Crop | Best Choice for Cover Crop |
|---|---|
| Nitrogen production | Legumes - red clover, peas or vetch |
| Nitrogen scavenging | Fall uptake - cover crop radish and other brassicas, oats Winter/spring uptake - rye, winter wheat |
| Weed suppression | Cover crop radish and other brassicas Winter rye, sorghum sudan Buckwheat |
| Nematode suppression1 | Mustard - Caliente, Cutlass, Forge Sudans/sorghums - Sordan 79, Trudan 8 Pearl millet - CFPM 101Marigold - Crackerjack, Creole Oilseed radish - Adagio, Colonel |
| Soil structure building | Grasses like oats, barley, rye, wheat, triticale, ryegrass Fibrous root system plants such as red clover Diverse cover crop mixtures |
| Compaction reduction | Strong tap root plants that grow over time - Alfalfa, sweet clover |
| Biomass return to soil | Fall - oats, oilseed radish, diverse cover crop mixtures Summer - millets, sorghum sudan |
| Erosion protection (wind or water) | Winter rye, winter wheat Any well-established cover crop, e.g., ryegrass |
1 Nematode suppression is specific to the variety of cover crop, the species of nematode and the management of the cover crop materials.
Table 17. Characteristics of Cover Crops
| Species | Seeding Rate (kg/ha)1 | Seeding Time | Min. Germination Temp. °C (°F) | Nitrogen Fixed (F) or Scavenged (S)2 | Overwintering Characteristics |
|---|---|---|---|---|---|
| Spring cereals | 50-125 | mid-Aug-Sept | 9 (48) | S | killed by heavy frost |
| Winter wheat | 100-130 | Sept-Oct | 3 (38) | S | overwinters very well |
| Winter rye | 100-125 | Sept-Oct | 1 (34) | S | overwinters very well |
| Sorghum sudan | 30-50 | Jun-Aug | 18 (65) | S | killed by frost |
| Pearl millet | 4-9 | Jun-Aug | 18 (65) | S | killed by frost |
| Ryegrass | 12-18 | Apr-May or Aug-early Sept | 4.5 (40) | S | annual, Italian often survive; perennial overwinters |
| Species | Building Soil Structure | Weed Suppression | Nematode Rating3 Lesion/Rootknot | Growth Rate/Establishment | Root Type |
|---|---|---|---|---|---|
| Spring cereals | good | good | +/- | very fast | fibrous |
| Winter wheat | good | good | +/nh | fast | fibrous |
| Winter rye | very good | very good | +4/nh | very fast | fibrous |
| Sorghum sudan | good | good/fair | nh/- | very fast | coarse fibrous |
| Pearl millet | good | good/fair | nh/nh | fast | coarse fibrous |
| Ryegrass | very good | fair/poor | -/- | slow | dense fibrous |
| Species | Seeding Rate (kg/ha)1 | Seeding Time | Min. Germination Temp. °C (°F) | Nitrogen Fixed (F) or Scavenged (S)2 | Overwintering Characteristics |
|---|---|---|---|---|---|
| Hairy vetch | 20-30 | Aug | 15.6 (60) | F/S | overwinters |
| Red clover | 8-10 | Mar-Apr | 5 (41) | F/S | overwinters |
| Sweet clover | 8-10 | Mar-Apr | 5.5 (42) | F/S | overwinters |
| Field peas | 40-100 | Jul-early Sept | 5 (41) | F/S | killed by heavy frost |
| Species | Building Soil Structure | Weed Suppression | Nematode Rating3 Lesion/Rootknot | Growth Rate/Establishment | Root Type |
|---|---|---|---|---|---|
| Hairy vetch | good | fair/poor | ++/+ | slow | tap with secondary fibrous |
| Red clover | good | fair | ++/+++ | slow | weak tap/ fibrous |
| Sweet clover | good | fair | -/- | slow | strong tap |
| Field peas | poor | good/fair | -/- | fast | weak tap/ fibrous |
| Species | Seeding Rate (kg/ha)1 | Seeding Time | Min. Germination Temp. °C (°F) | Nitrogen Fixed (F) or Scavenged (S)2 | Overwintering Characteristics |
|---|---|---|---|---|---|
| Buckwheat | 50-60 | Jun-Aug | 10 (50) | S | killed by first frost |
| Oilseed radish6 | 6-14 | mid-Aug-early Sept | 7 (45) | S | killed by heavy frost |
| Other Brassicas6, i.e., mustard, forage radish | varies with species | mid-Aug-early Sept | 5-7 (41-45) | S | species dependent, many killed by heavy frost |
| Species | Building Soil Structure | Weed Suppression | Nematode Rating3 Lesion/Rootknot | Growth Rate/Establishment | Root Type |
|---|---|---|---|---|---|
| Buckwheat | poor | very good | +++/nh | fast | weak tap/ fibrous |
| Oilseed radish6 | fair | very good | -/- | fast | moderate tap |
| Other Brassicas6, i.e., mustard, forage radish | fair | very good | -/- | fast | moderate tap |
Nematode Rating Codes: - = Poor; + = Ability to host; nh = Non-hosts.
Cover crop seeding rates can vary greatly depending upon the goals for the cover crop, soil type and need or tolerance for crop residues.
1 100 kg/ha = 90 lb/ac.
2 Oilseed radish, buckwheat and the grasses do not fix nitrogen from the air but are scavengers of nitrogen from soil and manure applications.
3 Varietal differences in cover crop species may affect nematode reaction or lead to higher nematode populations. Proper variety selection is needed to ensure this cover crop is a non-host.
4 Rye whole-season rating would be higher.
5 Some diseases caused by Pythium and Phytophthora can be more severe after legume cover cropping.
6 Oilseed radish and other Brassica cover crops can be used as biofumigants when managed appropriately. The plant residues can be toxic or allelopathic to subsequent crops if the following crop is planted too closely after incorporation of the cover crop. Allow the cover crop residues to break down or desiccate before planting the next crop.
Apple Nutrition
Test the soil two years before planting to see if pH adjustment may be necessary. One year before planting, test the soil again to determine pH, and macro and micronutrients. The best time to thoroughly incorporate organic matter, phosphorus, potassium and lime is before planting. These materials are required to optimize orchard productivity.
Manure for Orchards
Manure can pose a food safety risk on many fruit crops. Ensure at least 120 days between manure application and harvest.
Manure contains beneficial organic matter and many macro and micronutrients. The organic nitrogen in manure is mineralized over time, providing nitrogen in diminishing quantities for several years. Adjust additional organic and inorganic nitrogen applications accordingly.
Apply no more than 7 tonnes per ha of poultry manure (20 m³ liquid), 40 tonnes per ha of cattle manure (100 m³ liquid), or 35 tonnes per ha of hog manure (65 m³ liquid). Since the nutrient content of manure varies greatly, have it tested for nutrients before application. Broadcast manure at moderate rates and work into the soil in late fall or early spring before planting. Do not put manure around newly planted trees because of potential winter injury.
Reduce the rate of nitrogen, phosphorus and potassium fertilizers applied to adjust for the nutrients supplied by manure. Table 10. Average Fertilizer Replacement Values for Manure, shows the average composition of some manures and suggested reduction of fertilizer when manure is used. Excessive nitrogen, particularly in the second half of the growing season, can result in poor fruit colour, reduced storability, excessive growth, and delayed cold-hardening of the woody tissue, which makes trees more susceptible to winter injury.
For more information about food safety and the environmental impacts of manure application, see Manure nitrogen and Use manure responsibly.
pH Requirements
The pH of a soil is a measure of its acidity or alkalinity. It can affect nutrient availability, uptake and crop performance. If the soil test report recommends a lime application to increase soil pH, add lime at suggested rates one year prior to planting. For details regarding rates and suggested types of lime to use, refer to Soil pH and Liming.
In established orchards, sample soil in the tree row every three years to ensure the pH is satisfactory. If the pH is below 5.1 on clay loam soils or 5.6 on sandy soils, apply lime to the sod cover in the fall or before spring cultivation. The pH will not change immediately because lime reacts slowly in the soil.
Leaf Analysis
In established plantings, the best way to determine the nutrient status of the orchard is by leaf analysis. In conjunction with soil analysis, it provides good information for adjusting fertilizer rates. For more information on these tests, see Plant tissue analysis.
Many orchard growing and soil conditions can affect nutrient uptake. Consequently, nutrient levels vary slightly each year depending on the season. To obtain optimum growth and fruit quality, all nutrients must be present in sufficient concentrations, as indicated in Table 18. Foliar Nutrient Sufficiency Range of Apple.
To monitor trends, complete a leaf analysis every year. Sampling the same trees, at the same time of year will assist in interpreting leaf analysis reports from year to year. Use leaf analysis together with soil test results to make adjustments to the fertilizer program. Fertilizer recommendations are adjusted based on this leaf analysis and soil management practices, tree age, rootstock, soil type and previous fertilizer applications. Growth, fruit size, colour and storage quality must also be considered to determine the fertilizer required.
| Variety | Nitrogen1 % | Phosphorus % | Potassium % | Calcium % |
|---|---|---|---|---|
| Delicious, Mutsu/Crispin | 2.2-2.7 | 0.15-0.4 | 1.4-2.2 | 0.8-1.5 |
| Empire, Spy | 2.1-2.6 | 0.15-0.4 | 1.3-2.1 | 0.7-1.5 |
| McIntosh, others | 2-2.5 | 0.15-0.4 | 1.2-2 | 0.8-1.5 |
| Variety | Magnesium % | Iron (ppm) | Boron (ppm) | Zinc (ppm) | Manganese (ppm) |
|---|---|---|---|---|---|
| Delicious, Mutsu/Crispin | 0.25-0.4 | 25-200 | 20-60 | 15-100 | 20-200 |
| Empire, Spy | 0.25-0.4 | 25-200 | 20-60 | 15-100 | 20-200 |
| McIntosh, others | 0.25-0.4 | 25-200 | 20-60 | 15-100 | 20-200 |
* Mid-shoot leaves taken in last 2 weeks of July from mature trees.
1 Leaf nitrogen in non-bearing trees should be 0.2% higher. Leaf nitrogen on M.9 or M.26 rootstocks should be 0.2% higher.
Fertilizer for Apples
Fertilizer for non-bearing apples
The best time to effectively incorporate nutrients such as potassium, phosphorus, boron and lime into the soil is prior to planting the orchard. Adequate soil nutrient levels are 12-20 ppm phosphorus, 120-150 ppm potassium, 100-250 ppm magnesium and 1,000-5,000 ppm calcium. Table 19. Phosphorus and Potassium Soil Requirements Before Planting Apples, provides information on fertilizer rates prior to planting.
In the early years, before new trees bear their first crop, an annual early spring application of nitrogen and potash is usually required. For suggested rates, refer to Table 20. Actual Nitrogen Requirements based on Tree Density and Age, and Table 21. Muriate of Potash (0-0-60) Requirements based on Tree Density and Age.
On young trees, broadcast the fertilizer under the spread of the branches at least 15 cm from the trunk. Applying too close may result in injury. If the soil was prepared properly through deep cultivation and the addition of organic matter, such as manure, there should be an adequate supply of other nutrients to sustain the orchard in its juvenile years.
On coarse-textured, low-nutrient soils, it may help to use a starter solution at planting time, such as 10-52-10 or 20-20-20.
High nitrogen application rates and soil levels can result in excessive growth and delay dormancy. Cover crops are strongly recommended to check late-season growth in cultivated orchards, especially in new plantings. Cover crops such as Italian ryegrass, sown about July 1, take up much of the available nitrogen in the soil and will limit the tree growth.
Fertilizer for bearing apples
Most bearing orchards require an annual application of nitrogen. Use a soil test to determine potassium requirements. These two elements significantly affect growth and productivity.
Table 19. Phosphorus and Potassium Soil Requirements Before Planting Apples*
| Soil test(ppm P)1 | Phosphates (P2O5) required kg/ha[response] |
|---|---|
0-3 | 80 [HR] |
4-5 | 60 [HR] |
6-7 | 50 [HR] |
8-9 | 40 [MR] |
10-12 | 20 [MR] |
13-15 | 0 [LR] |
16-20 | 0 [LR] |
21-25 | 0 [RR] |
26-30 | 0 [RR] |
31-40 | 0 [RR] |
41-50 | 0 [RR] |
51-60 | 0 [RR] |
61-80 | 0 [NR] |
80+ | 0 [NR] |
| Soil test(ppm K)2 | Potash (K2O) required kg/ha[response] |
|---|---|
0-15 | 180 [HR] |
16-30 | 170 [HR] |
31-45 | 160 [HR] |
46-60 | 140 [HR] |
61-80 | 110 [HR] |
81-100 | 70 [MR] |
101-120 | 40 [MR] |
121-150 | 20 [MR] |
151-180 | 0 [LR] |
181-210 | 0 [LR] |
211-250 | 0 [RR] |
250+ | 0 [NR] |
* For established apple trees, use leaf analysis to estimate requirements of nitrogen, phosphorus and potassium.
1 0.5 M sodium bicarbonate extract soil test method (Olsen).
2 1.0 N ammonium acetate soil test method.
HR, MR, LR, RR, and NR denote, respectively: high, medium, low, rare and no probabilities of profitable crop response to applied nutrient.
Nitrogen (N)
Nitrogen is necessary for many tree functions, including growth, fruit bud formation, fruit set and fruit size. Because of the complexity of nitrogen interactions with quality and production, the best guide for nitrogen rates is leaf analysis.
Cultivars differ in nitrogen requirements. A cultivar grown for processing could receive more nitrogen than one for the fresh market. In some situations, if fruit tends to be small, more nitrogen may be needed. Rootstocks, spacing and pruning also influence application rates.
Tree growth, foliage colour, fruit quality such as colour and storability, and nutrient balance in leaves and soil are also important considerations for determining nitrogen rates. Several forms of nitrogen are available, but ammonium nitrate (34-0-0) or calcium ammonium nitrate (27-0-0) are the most economical. If you use blended fertilizers, request ammonium nitrate as the nitrogen source. Do not apply urea (46-0-0) to orchards with sod between the rows because urea must be incorporated to prevent loss of ammonia nitrogen to the air.
Table 20. Actual Nitrogen per tree (g)Requirements based on Tree Density and Age
Reduce nitrogen rate by half if orchard is cultivated without sod between tree rows. Do not exceed 200 kg of actual nitrogen per ha per season regardless of number of trees per ha. These are approximate values. The exact amount of nitrogen to apply is a function of soil nitrogen level, cultivar, rootstock, soil moisture, etc. The best way to determine nitrogen requirements is with regular leaf analysis.
| Tree age (years) | |||||||||||||
|---|---|---|---|---|---|---|---|---|---|---|---|---|---|
| Trees per ha (trees per ac) | 1 | 2 | 3 | 4 | 5 | 6 | 7 | 8 | 9 | 10 | 11 | 12 | 13 or older |
| 600 (240) | 30 | 60 | 90 | 120 | 150 | 180 | 206 | 232 | 258 | 284 | 310 | 336 | * |
| 800 (320 | 30 | 60 | 90 | 120 | 150 | 170 | 190 | 210 | 230 | 250 | * | * | * |
| 1000 (400) | 30 | 60 | 90 | 120 | 150 | 168 | 186 | 204 | * | * | * | * | |
| 1200 (480) | 30 | 60 | * | * | * | * | * | * | * | * | * | * | * |
| 1400 (560) | 30 | 60 | * | * | * | * | * | * | * | * | * | * | * |
| 1600 (640) | 30 | 60 | * | * | * | * | * | * | * | * | * | * | * |
| 1800 (720) | 30 | 60 | * | * | * | * | * | * | * | * | * | * | * |
| 2000 (800) | 30 | 60 | * | * | * | * | * | * | * | * | * | * | * |
| 2200 (880 | 30 | 60 | * | * | * | * | * | * | * | * | * | * | * |
| 2400 (960) | 30 | 60 | * | * | * | * | * | * | * | * | * | * | * |
| 2600 (1040) | 30 | 60 | * | * | * | * | * | * | * | * | * | * | * |
* (shaded areas) = Use leaf analysis to determine nitrogen needs.
Nitrogen rates
Given the variety of orchard systems, rootstocks, cultivars and soil types, the exact amount of nitrogen to apply varies. Use leaf analysis to evaluate the nitrogen needs of specific plantings. Table 20. Actual Nitrogen Requirements based on Tree Density and Age, is an estimate of possible nitrogen requirements. When the tree canopy covers the available space, nitrogen fertilizer requirements do not change greatly from year to year or increase indefinitely with tree age. Orchards grown under clean cultivation require about half the nitrogen required by orchards grown in sod.
- If late winter or early spring pruning is to be severe, reduce or eliminate nitrogen application for that year.
- Do not apply late or excessive amounts of nitrogen, as this will affect fruit colour and quality. Available nitrogen late in the season may affect hardening off and increase the possibility of winter injury.
- In cultivated orchards, use cover crops to help lower the soil nitrogen level in the latter part of the season. Cover crops, such as Italian ryegrass, sown about July 1, take up much of the available nitrogen in the soil and limit tree growth.
- In orchards with herbicide-treated strips under trees, allow some weed growth late in the season. Weeds will take up extra nitrogen, which helps harden off trees and improve fruit quality.
- For all apple cultivars, do not exceed the maximum rates of 200 kg actual nitrogen per ha per year, even in the case of a severe deficiency.
Nitrogen placement and timing
Apply nitrogen fertilizer in early April. In cultivated orchards, broadcast nitrogen under the tree canopy. In orchards with sod between the rows, place the nitrogen in a band in the herbicide strip.
Table 21. Muriate of Potash (0-0-60) Requirements (per 2.5 cm trunk diameter (g)) based on Tree Density and Age
Do not exceed 800 kg of 0-0-60 per ha per season regardless of the number of trees per ha. These are approximate values. The exact amount of muriate of potash to apply is a function of soil potassium level, cultivar, rootstock, soil moisture, etc. The best way to determine potash requirements is by leaf analysis.
| Trees per ha (trees per ac) | Tree age (years) | |||||||||
|---|---|---|---|---|---|---|---|---|---|---|
| 1 | 2 | 3 | 4 | 5 | 6 | 7 | 8 | 9 | 10 | |
| <500 (<200) | 80 | 80 | 80 | 80 | 80 | 80 | 80 | 80 | 80 | 80 |
| 600 (240) | 80 | 80 | 80 | 80 | 80 | 80 | 70 | 70 | 70 | 70 |
| 800 (320 | 80 | 80 | 80 | 80 | 80 | 80 | 63 | 63 | 63 | 63 |
| 1000 (400) | 80 | 80 | 80 | 80 | 80 | 80 | 52 | 52 | 52 | 52 |
| 1200 (480) | 80 | 80 | * | * | * | * | * | * | * | * |
| 1400 (560) | 80 | 80 | * | * | * | * | * | * | * | * |
| 1600 (640) | 80 | 80 | * | * | * | * | * | * | * | * |
| 1800 (720) | 80 | 80 | * | * | * | * | * | * | * | * |
| 2000 (800) | 80 | 80 | * | * | * | * | * | * | * | * |
| 2200 (880 | 80 | 80 | * | * | * | * | * | * | * | * |
| 2400 (960) | 80 | 80 | * | * | * | * | * | * | * | * |
| 2600 (1040) | 80 | 80 | * | * | * | * | * | * | * | * |
* (shaded areas) = Use leaf analysis to determine nitrogen needs.
Foliar application of nitrogen
Foliar applications of urea (46% nitrogen) have been used successfully on apples when weather or crop conditions resulted in the need for additional nitrogen at a critical time.
On apples, use no more than 2.7 kg N per 1,000 L water (6 kg urea) and apply at least 2,000 L per ha starting 7-10 days after petal fall. Make no more than 3 applications, about 10 days apart. Do not apply later than the end of July or fruit quality and winter survival of the tree could be adversely affected.
Phosphorus (P)
Phosphorus is not required in large amounts by apple trees. With a few exceptions, the level of phosphorus in Ontario soils is generally adequate. Phosphorus may be required for sod or cover crop maintenance. A soil test is the best way to determine if this nutrient needs to be added to the sod cover. If indicated, apply phosphorus before planting so it can be thoroughly incorporated in the soil. Phosphorus soil test values between 12 and 20 ppm are considered adequate for tree establishment and fruit production. If a soil test indicates that phosphorus is required, it is best added to the soil before establishing the orchard.
Potassium (K)
Potassium is important for fruit colour, winter hardiness, tree growth and disease resistance. Because an excess of potassium can lead to a deficiency of magnesium (Mg), avoid unnecessary potassium applications. Potassium soil test values between 120 and 150 ppm are considered adequate when planting fruit trees. Muriate of potash (0-0-60) is the most common form of potassium. If leaf analysis data is not available, use the approximate rates in Table 21. Muriate of Potash (0-0-60) Requirements based on Tree Density and Age.
Apply no more than 3 kg of K2O (5 kg of muriate of potash) per mature standard apple tree in a year, regardless of the severity of the potassium deficiency. When fertilizing trees on dwarfing rootstocks, consult Table 21. Muriate of Potash (0-0-60) Requirements based on Tree Density and Age, for approximate rates of muriate of potash to apply. When the tree canopy has covered the space available, potassium fertilizer requirements do not change greatly from year to year or increase indefinitely with tree age. Leaf analysis is the most reliable guide to determining potassium requirements.
Placement and timing
The best time to apply potassium, either separately or combined with nitrogen, is in the spring. While some growers prefer the fall because of time constraints in the spring, leaching over winter may cause potassium loss. For this reason, apply in spring if possible.
In orchards with sod between the rows, apply potash in a band between the trunk and the edge of the herbicide strip.
Calcium (Ca)
A lack of calcium is associated with fruit quality problems such as bitter pit in apples.
Foliar application of calcium to apples reduces the incidence of bitter pit and cork spot. Where these disorders have previously been a problem, apply 4 foliar sprays 2 weeks apart, beginning in mid-July. See Table 22. Calcium Foliar Sprays. Where more calcium is required, make additional applications by either beginning earlier around mid-June or by continuing until harvest.
Calcium advances fruit maturity, so be prepared to adjust the timing of harvest as a result of calcium foliar sprays.
Calcium sprays must contact the fruit for uptake to be effective. Therefore, water volumes capable of wetting the entire tree are required. High concentrations of calcium can cause foliar burn. If applied too close to harvest, some formulations of calcium chloride (CaCl2) have resulted in poor fruit finish.
Do not exceed more than 5 kg CaCl2 (77% flakes) per 1,000 L of water in mid-July and no more than 7 kg per 1,000 L of water for applications at or beyond mid-August. Applying calcium formulations that contain nitrogen after the end of July may reduce fruit quality and storability. For all formulations, consult the label directions for application rates and pesticide compatibility. The product used is not as important as the total amount of actual calcium applied. For example, calcium chloride (77% flakes) contains 28% actual calcium. For acceptable results, up to 12 kg per ha of actual calcium is often required in a total of 4 or more sprays.
Calcium sprays may cause foliage and/or fruit injury if applied when low temperature and wet weather delay drying of the spray. Injury can also occur if calcium is applied in hot (over 25°C) or humid weather.
Recent studies with calcium sprays on McIntosh failed to show an advantage in fruit firmness and storage quality when fruit was stored in regular controlled atmosphere storage for 5½ months. Limit applications of calcium to fruit that has a known deficiency and/or is prone to bitter pit or cork spot. For more information on calcium disorders, consult OMAFRA Factsheet, Bitter Pit Control in Apples.
Magnesium (Mg)
Magnesium soil test values between 100 and 250 ppm are considered adequate when fruit trees are to be planted. Magnesium deficiency has become more evident in orchards, particularly where high rates of potash have been used and can lead to premature fruit drop at harvest, especially with McIntosh. As magnesium is a part of the chlorophyll molecule, magnesium-deficient trees have older leaves that are pale in colour. Leaf analysis is the best way to evaluate magnesium requirements.
Foliar sprays of magnesium effectively correct this deficiency only for the year of application. See Table 23. Magnesium Foliar Sprays.
Fruit or foliage injury is possible from a mixture of pesticides with magnesium sulphate, so apply magnesium sulphate separately. Check manufacturer's label about mixing magnesium chelates with pesticides. Use chelates recommended for foliar spays.
For long-term corrections, soil applications of magnesium are required. However, crop response is not usually immediate. On some soil types a single, early spring application of soil-applied magnesium is not effective. A second or third application the next spring may be needed before the magnesium level in the tree improves. To avoid early fruit drop in this waiting period, apply foliar magnesium sprays for the first two years, in addition to soil applications.
| Timing | Product | Rate | Notes |
|---|---|---|---|
| 4 sprays spaced 2 weeks apart, beginning in mid-July. Additional sprays can be applied up to harvest. | Calcium chloride*(77% flakes) | 5 kg/1,000 L water | Do not use on McIntosh or Idared. Wet tree to point of runoff. For pesticide compatibility, consult labels. |
| Calcium nitrate | 9 kg/1,000 L water | Use only if leaf nitrogen is low. Do not apply later than the end of July. For pesticide compatibility, consult labels. | |
| Other formulations including chelates | - | Consult labels. |
* When using calcium chloride, mix required calcium in a pail of water first to be sure all of product is dissolved before adding slurry to spray tank.
| Timing | Product | Rate | Notes |
|---|---|---|---|
| 3 sprays spaced 2 weeks apart, beginning at calyx | Magnesium sulphate (Epsom salts) | 20 kg/1,000 L water | Wet tree to point of runoff. Do not concentrate beyond 40 kg/1,000 L water. |
| Liquid formulations including chelates* | Consult product label. | May be compatible with some pesticides. Consult product label. |
* Use chelates recommended for foliar sprays.
Use dolomitic limestone to supply magnesium and raise the soil pH of acidic soils.
Where lime is not required, apply sulphate of potash magnesia (0-0-22-11% Mg-22% S) at 5-7 kg per mature standard tree or 3-4 kg per mature dwarf tree. This is a granular fertilizer that contains approximately 22% potash and 11% magnesium. Apply this material in early spring in a band between the trunk and the edge of the herbicide strip. It contains potassium (K) and the rate of application depends on potash needs. Other sources of magnesium also work well as a soil application. If magnesium is blended with the fertilizer, apply at least 80 kg of available magnesium per ha when the fertilizer is spread.
Warning: Apply nutrient sprays according to recommended rates on the product label. Do not spray at temperatures above 25°C.
Micronutrients for Apples
Deficiencies of micronutrients are not widespread in Ontario apple plantings. Boron deficiency is perhaps the most common. Deficiencies of zinc, manganese and iron appear occasionally, particularly in alkaline or high pH soils.
The desirable range for micronutrients is very small. More damage is possible with excess amounts than with deficiencies. Do not apply micronutrients to apples except when deficiency is confirmed by leaf analysis or visible symptoms. Apply only the nutrient that is deficient in sufficient quantities to correct the problem. For more information on micronutrients in apples, see Micronutrients.
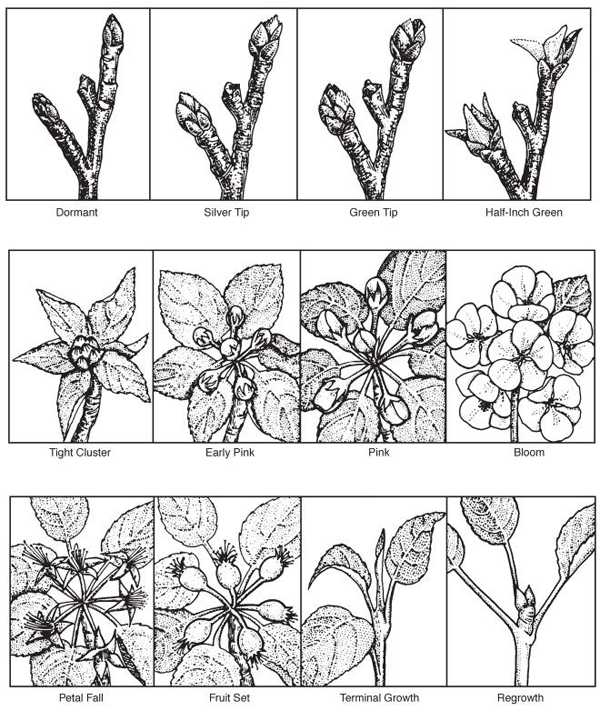
Figure 1. Apple Growth Stages
Berry Crop Nutrition
Blueberries, Highbush
Blueberries perform best on acidic, well-drained soils with high organic matter contents.
- Test the soil two years before planting to see if pH adjustment may be necessary. One year before planting, test the soil again to determine pH, and macro and micronutrients.
- Incorporate acidic peat moss with the soil in the planting hole to significantly improve plant establishment and development. Dry peat moss will draw soil moisture away from plant roots, so be sure it is thoroughly moistened before planting.
pH requirements
Blueberries require a soil pH between 4.2 and 5.0 for optimum growth and production. A soil pH above 6.5 usually cannot be lowered economically through the use of sulphur or peat moss. For this reason, choose the site for blueberry production carefully.
- If the soil pH is between 5.1 and 6.5 acidify through the incorporation of elemental sulphur and/or acidic peat moss prior to planting. See Table 24. Elemental Sulphur Required to Lower Soil pH.
- Incorporate elemental sulphur at least 1 year prior to planting to allow sufficient time for the sulphur to acidify the soil. Sulphate fertilizers will not lower soil pH.
- Check the soil pH annually in the plant row and add elemental sulphur when necessary.
Fertilizer for blueberries
Nitrogen (N)
Highbush blueberries respond best to ammonium forms of nitrogen. Use ammonium sulphate (21% N) if the soil pH is above 5.0 and urea (46% N) if the pH is below 5.0. Avoid using the nitrate nitrogen fertilizers. In the spring after planting, apply a total of 12 g of actual nitrogen per bush in a split application. Apply the nitrogen just prior to bud break, petal fall and early July. Distribute the fertilizer in a circle from 30 cm around the plant to just beyond the spread of the branches. Increase the rate of nitrogen each year until a total of 36-48 g per bush is applied. On older bushes, apply most of the fertilizer under the outer spread of the branches. See Table 25. Nitrogen Requirements for Highbush Blueberries. Avoid fertilizers containing lime filler as they will raise the pH of the soil.
| Soil type | For each 1.0 pH unit | For each 0.1 pH unit |
|---|---|---|
| sand | 350 | 35 |
| sandy loam | 750 | 75 |
| loam | 1,100 | 110 |
Example: The initial pH of a sandy loam soil is 6.2. The desired soil pH for blueberries is 4.8. The soil pH must be lowered by 6.2-4.8 = 1.4 units. Therefore, 1.4 x 750 = 1,050 kg/ha of sulphur is required.
| Plant age | April 1-15 | May 15 | July 1 |
|---|---|---|---|
| Newly planted | 0 | 6 | 6 |
| 1 year | 3 | 6 | 6 |
| 2 year | 6 | 6-12 | 6-12 |
| 3 year | 9 | 6-12 | 6-12 |
| 4 year | 12 | 12-18 | 6-12 |
| 5 year | 15 | 12-18 | 6-12 |
| 6 year or older | 18 | 12-18 | 6-12 |
Phosphorus (P) and Potassium (K)
Apply phosphorus and potassium according to soil tests. Consult Table 26. Phosphorus and Potassium Requirements for Highbush Blueberries, Strawberries, Raspberries, Currants, Gooseberries, for soil test interpretation. A single application of phosphorus at soil preparation time is usually adequate. It is critical to correct phosphorus deficiencies prior to planting.
Apply all of the required potassium early in the spring under the outer branches of the bushes, as described for nitrogen. Potassium can be mixed and applied with the spring nitrogen. Use sulphate of potash magnesia (0-0-22, 11% magnesium) or potassium sulphate (0-0-50, 17% S). Blueberries are sensitive to injury from the chloride contained in muriate of potash (0-0-60).
Table 26. Phosphorus and Potassium Requirements for
Highbush Blueberries, Strawberries, Raspberries, Currants, Gooseberries
| Soil test (ppm P)* | Rating | Phosphate required(kg P2O5 per ha) | |
|---|---|---|---|
| New plantings | Established plantings | ||
0-3 | HR | 140 | 100 |
4-5 | HR | 130 | 90 |
6-7 | HR | 120 | 80 |
8-9 | HR | 110 | 70 |
10-12 | HR | 100 | 70 |
13-15 | HR | 90 | 60 |
16-20 | MR | 70 | 50 |
21-25 | MR | 60 | 40 |
26-30 | MR | 50 | 30 |
31-40 | MR | 40 | 20 |
Above 40 | LR | 0 | 0 |
| Soil test (ppm K)** | Rating | Potash required (kg K2O per ha) |
|---|---|---|
0-15 | HR | 130 |
16-30 | HR | 120 |
31-45 | HR | 110 |
46-60 | HR | 100 |
61-80 | HR | 90 |
81-100 | HR | 80 |
101-120 | MR | 70 |
121-150 | MR | 60 |
151-180 | MR | 40 |
MR | ||
above 180 | LR | 0 |
HR, MR, LR, denote, respectively: high, medium, and low probabilities of profitable crop response to applied nutrient.
* 0.5 M sodium bicarbonate extract soil test method.
** 1.0 N ammonium acetate soil test method.
Other nutrient requirements
Magnesium (Mg) deficiency may occur on blueberries. Soil and/or foliar applications of magnesium are required to correct this deficiency. For soil applications, 80 kg Mg per ha is required where a confirmed deficiency exists. Use magnesium sulphate (Epsom salts, 9.5% Mg) or sulphate of potash magnesia (0-0-22, 11% Mg). Since sulphate of potash magnesia contains potash, adjust application rates to meet potash requirements. For foliar sprays, 1.9 kg Mg per 1,000 L of water (20 kg magnesium sulphate, Epsom salts) with at least 2,000 L/ha should correct the deficiency. Annual foliar sprays may be necessary.
Leaf analysis
Leaf analysis can help to assess the nutrient status of the plants and more accurately determine fertilizer requirements. To monitor trends, complete a leaf analysis every year. Sampling the same plant, at the same time of year will assist in interpreting leaf analysis reports from year to year. Use leaf analysis together with soil test results to make adjustments to the fertilizer program.
In late July, take leaf samples from halfway down the new shoot growth of the current season. Ensure adequate representation by collecting at least 100 leaves throughout the sampling area. Sample areas with different soil types, crop age, and current fertility programs separately. See Table 27. Optimum Nutrient Levels in Highbush Blueberry Leaves.
| Nutrient | Optimum range |
|---|---|
nitrogen (N) | 1.7%-2.3% |
phosphorus (P) | 0.15%-0.4% |
potassium (K) | 0.36%-0.7% |
calcium (Ca) | 0.3%-0.8% |
magnesium (Mg) | 0.12%-0.3% |
manganese (Mn) | 150-500 ppm |
iron (Fe) | 30-100 ppm |
zinc (Zn) | 10-100 ppm |
boron (B) | 15-50 ppm |
See Accredited Soil-Testing Laboratories in Ontario for a list of laboratories that provide leaf analysis.
Currants and Gooseberries
It is essential to apply and incorporate required materials such as phosphorus, potassium, organic matter and lime before you plant currants and gooseberries. Test the soil two years before planting to see if pH adjustments are necessary. One year before planting, test soil again to determine pH, and macro and micronutrients requirements. This will ensure the plants can maintain productivity and grow successfully in the same location for many years.
Currants and gooseberries grow best in cool, well-drained, deep, loamy soils. The soil organic matter should be at least 2%-3% to promote good drainage, aeration and moisture retention.
Apply 45 tonnes/ha or 4.5 kg per m2 of well-composted manure in late summer or fall before planting. Other organic materials such as weed-free straw may be used, but these materials should be well-decomposed by planting time. For more information on organic matter, see The basics of preparing the soil for berry production.
pH requirements
An acceptable soil pH for currants and gooseberries is between 5.5 and 7.0. A slightly acid soil (pH 6.1-6.6) is best. Liming may be required to raise soil pH to 6.1.
If lime is needed, apply at least 6-12 months before planting. For more information on lime, consult Soil pH and Liming. Micronutrients may become limiting if soil pH is outside the recommended range.
Fertilizer before planting
Incorporate phosphorus and potassium fertilizer into the soil in early spring a few days before planting. Incorporate nitrogen before planting or apply in a band around the bush several weeks after planting. Apply fertilizer at least 30 cm away from the base of the bush to avoid burning roots with the nitrogen. If planting takes place in the fall, incorporate required phosphorus before planting but delay application of nitrogen and potassium until the following spring.
Nitrogen (N)
Incorporate or band 5 g of actual nitrogen per bush in the planting year.
Phosphorus (P)
Test the soil before planting and incorporate the required amount of phosphorus according to the soil test results. See Table 26. Phosphorus and Potassium Requirements for Highbush Blueberries, Strawberries, Raspberries, Currants, Gooseberries, for more information. It is difficult to effectively incorporate phosphorus after the crop is planted. Excessive levels of phosphorus can induce deficiencies of other essential nutrients such as zinc.
Potassium (K)
Test the soil before planting and apply the required amount of potassium according to the soil test results. See Table 26. Phosphorus and Potassium Requirements for Highbush Blueberries, Strawberries, Raspberries, Currants, Gooseberries. Currants and gooseberries are sensitive to injury from the chloride contained in muriate of potash (0-0-60). Use potassium sulphate (0-0-50) or sulphate of potash magnesia (0-0-22) instead.
Fertilizer in established plantings
Apply fertilizer early each spring according to soil tests. If phosphorus and potassium are not broadcast over the entire area, reduce rates to the percentage of area that will receive fertilizer. If the fertilizer is banded, band 30 cm from the base of the plant.
Nitrogen (N)
Apply 10 g nitrogen per bush in the year after planting. In subsequent years, apply 20 g per bush.
Potassium (K)
Apply according to soil test results. If a soil test is not available, assume a moderate level and apply as indicated in Table 26. Phosphorus and Potassium Requirements for Highbush Blueberries, Strawberries, Raspberries, Currants, Gooseberries.
Raspberries
Raspberries have a fine, fibrous root system and perform best on a deep, well-drained soil. Raspberry soils need good water retention ability and a high organic matter content of approximately 3%. For more information on organic matter, see The basics of preparing the soil for berry production.
One year before planting raspberries, test the field soil for phosphorus, potassium, magnesium and pH. Adjust soil pH and organic matter if necessary. Plant a weed-smothering cover crop and incorporate it into the soil to build up organic matter. Apply well-composted manure (45 tonnes of cattle manure per ha) and incorporate into the soil the year before planting.
pH requirements
Raspberries grow best at a soil pH of 5.5-6.5, although they can grow well in soils with a higher pH. Liming of soil may be required to raise soil pH to 6.1. If lime is needed, apply at least 12 months before planting. For more information on lime, consult Soil pH and Liming. Micronutrients may become limiting when soil pH falls outside the appropriate range.
Fertilizer for raspberries
Nitrogen (N)
Suggested nitrogen application rates are found in Table 28. Nitrogen Rates for Raspberries. Avoid the application of excessive nitrogen. It can reduce the number of berries per cane and cause excessive vegetative growth. Sources of nitrogen and nitrogen equivalents are presented in Table 9. Fertilizer Materials: Primary Nutrients.
For summer- and fall-bearing raspberries, apply nitrogen in early spring (late March to early April). Late applications may lead to winter injury. For fall-bearing raspberries, winter injury is not a concern because canes are removed each spring. However, ripening may be delayed where nitrogen is applied in excess.
| Year | Nitrogen (kg/ha per season) |
|---|---|
Planting year | 30-40 |
Second year | 40-60 |
Third and following years | 45-75 |
Use the lower rates on non-irrigated crops and heavier soils.
Apply higher rates to irrigated crops and sandier soils.
Phosphorus (P) and Potassium (K)
Use a soil test to determine the need for phosphorus and potassium before planting. Apply the required amount of phosphorus and potassium according to the soil test.
Incorporate phosphorus prior to planting to correct phosphorus deficiencies, as phosphorus does not move readily through the soil. Do not apply more phosphorus than is required. Excessive levels of phosphorus can induce deficiencies of essential nutrients such as zinc.
If the soil test recommends high rates of potash, use potassium sulphate (0-0-50) or sulphate of potash magnesia (0-0-22). Raspberries are sensitive to chlorides. Some root injury has been observed on sandy soils where muriate of potash (potassium chloride, 0-0-60) has been used at a high rate. For sources of phosphorus and potash, refer to Table 9. Fertilizer Materials: Primary Nutrients.
Once plants are established, take soil samples from where plants are rooted, rather than from between the rows. Sample the soil every 2-3 years.
Leaf analysis
Collect fully expanded mature raspberry leaves from fruiting canes in late July. See Table 29. Optimum Nutrient Levels in Raspberry Leaves. These ranges provide a guide for interpretation of results. Variation can occur because of cultivars, soil type and cultural practices.
| Nutrient | Optimum range |
|---|---|
nitrogen (N) | 2%-3.5% |
phosphorus (P) | 0.2%-0.5% |
potassium (K) | 1%-2% |
calcium (Ca) | 0.8%-2.5% |
magnesium (Mg) | 0.25%-0.5% |
manganese (Mn) | 20-200 ppm |
iron (Fe) | 25-200 ppm |
zinc (Zn) | 15-100 ppm |
copper (Cu) | 5-20 ppm |
boron (B) | 20-60 ppm |
1 See Accredited Soil-Testing Laboratories in Ontario, for a list of laboratories that provide leaf analysis.
Strawberries
Strawberries are shallow-rooted, perennial plants. Heavy demands are placed on the root system, especially in the short period when berries develop. Strawberries require well-drained soils with 2% or higher organic matter and high fertility. Provide an optimum environment for strawberry root growth to obtain a profitable, perennial planting.
One year before planting strawberries, adjust soil pH and organic matter. Plant a weed-smothering cover crop and incorporate it into the soil to build up organic matter. Apply well-composted manure (45 tonnes of cattle manure per ha) and incorporate into the soil the year before planting. Test the field soil for phosphorus, potassium, magnesium and pH.
pH requirements
The optimum soil pH for strawberry production is 6.0-6.5. Strawberries will grow at a wider range of soil pH. However, some micronutrients become less available outside this range, particularly when soil pH is above 7.0. A soil pH below 5.6 on clay loam and below 6.1 on sandy loam should be adjusted upwards by applying lime the year before planting. For more information on pH, consult Soil pH and Liming.
Fertilizer for new plantings (the planting year)
Nitrogen (N)
Strawberries require annual applications of nitrogen. The timing of nitrogen application is as important as the rate of nitrogen. Improper timing and/or rates of nitrogen may lead to an increase in winter injury, softer fruit, and higher incidence of disease.
Nitrogen can be applied with phosphorus and potassium or as a side dressing 2-3 weeks after planting. Apply 50 kg of N per ha. See Table 9. Fertilizer Materials: Primary Nutrients, for nitrogen content of fertilizers. Apply an additional 25-35 kg N per ha in mid-August to further invigorate plants as they initiate fruit buds for the next year's crop.
Use whatever form of nitrogen is economical. Brush pelleted forms, such as ammonium nitrate, off the leaves to prevent burning. Do not apply when leaves are wet. The nitrogen in urea (46-0-0) can be lost as ammonia if it is applied to the soil surface and not incorporated. This ammonia can cause strawberry leaves to blacken. Incorporating urea prevents this problem.
Adjust nitrogen rates proportionately if manure was applied. See Table 10. Average Fertilizer Replacement Values For Manure. For more information about food safety and the environmental effect of manure application, please see Use Manure Responsibly and Manure and Food Safety.
Phosphorus (P)
Use soil test results to determine the rate of phosphorus to apply. Table 26. Phosphorus and Potassium Requirements for Highbush Blueberries, Strawberries, Raspberries, Currants, Gooseberries, shows soil test values and fertilizer requirements for new strawberry plantings. Incorporate phosphorus into the soil before you plant. Soils differ in the amount of phosphorus available to plants. Generally, fields cultivated for a long time require less phosphorus than recently developed fields.
Starter solutions
To help the plant establish, particularly if the soil is cold, use a starter fertilizer solution. Plant uptake of soil phosphorus can be reduced when soils are cold. Use a starter solution high in phosphorus such as 10-52-10, 6-24-6 or 10-24-0. Follow the manufacturer's suggested application rate.
Potassium (K)
Use soil test results to determine the best rate of potassium to apply. Incorporate potassium into soil before planting. Side dressing of potassium is not generally recommended.
Fertilizer for established plantings
Nitrogen (N)
Do not apply nitrogen in the spring, particularly on vigorous varieties. Spring applications cause extra vegetative growth and vigour, which results in softer fruit and dense canopies. This increases the potential for botrytis grey mould. Although spring-applied nitrogen may increase berry size, it also delays maturity by 1 or 2 days.
Benefits have been reported from low nitrogen application rates (10-20 kg N per ha) in the spring, after mulch removal, to plants growing in coarse-textured soils. Established fields on sandy soils or fields suspected of having winter injury might benefit from light spring applications of nitrogen. Experiment with spring-applied nitrogen on a small scale.
The best time to apply nitrogen in established fields is at renovation. After you mow the foliage, apply 50 kg N per ha using whatever form of nitrogen is most economical. See Table 30. Nitrogen Rates for Strawberries. Brush pelleted forms such as ammonium nitrate off the leaves to prevent burning. Do not apply nitrogen when leaves are wet. The nitrogen in urea (46-0-0) can be lost as ammonia if it is applied to the soil surface and not incorporated. This ammonia can cause strawberry leaves to blacken. Incorporation of urea prevents this problem. Apply an additional 25-35 kg N per ha in mid-August to assist the development of next year's fruit buds.
Ensure soils are well-irrigated after renovation, throughout the summer and in early fall. Adequate soil moisture is needed to optimize nitrogen uptake.
Phosphorus (P)
If a soil test shows phosphorus is needed, apply at renovation with nitrogen and potassium. Excessive phosphorus levels may cause zinc deficiency, especially on sandy soils.
Potassium (K)
Apply potassium, as determined by a soil test, with nitrogen and phosphorus at renovation. This allows for incorporation. Use soil tests to determine what rate to apply and use leaf analysis to adjust rates. Excessive levels of potassium induce magnesium deficiency, particularly on sandy soils.
| Plant age | Before planting or 2-3 weeks after planting | Renovation(after harvest) | Mid-August |
|---|---|---|---|
| Planting years | 50 | NA | 25-30 |
| Established plantings | NA | 50 | 25-30 |
Leaf analysis
Leaf analysis can help assess the nutrient status of strawberry plants and more accurately determine fertilizer requirements. Take leaf samples by July 1 for fruiting or August 20 for non-fruiting plantings. Collect at least 50 fully expanded, recently matured leaves with petioles removed. Different varieties, soil types and plantings should be sampled separately. See Table 31. Optimum Nutrient Levels in Strawberry Leaves, for interpretation of leaf analysis values.
| Nutrient | Optimum range |
|---|---|
nitrogen (N) | 2%-3% |
phosphorus (P) | 0.2%-0.5% |
potassium (K) | 1.5%-2.5% |
calcium (Ca) | 0.5%-1.5% |
magnesium (Mg) | 0.25%-0.5% |
manganese (Mn) | 20-200 ppm |
iron (Fe) | 25-200 ppm |
zinc (Zn) | 15-100 ppm |
boron (B) | 20-60 ppm |
* Fully expanded, recently matured strawberry leaves with petioles removed, collected before July 1 in fruiting fields and before August 20 in non-fruiting fields.
1 See Accredited Soil-Testing Laboratories in Ontario for laboratories that provide leaf analysis.
Micronutrients for Berry Crops
Deficiencies of micronutrients are not widespread in Ontario fruit plantings. The desirable range for micronutrients is quite narrow. More damage is possible if micronutrients are applied in excess rather than from deficiencies. For this reason, do not apply micronutrients to fruit crops unless leaf analysis or visible symptoms confirm a deficiency. Apply only the deficient nutrient in sufficient quantities to correct the problem. Leaf analysis is more effective than soil analysis to evaluate a crop's micronutrient status. See Micronutrients for additional information.
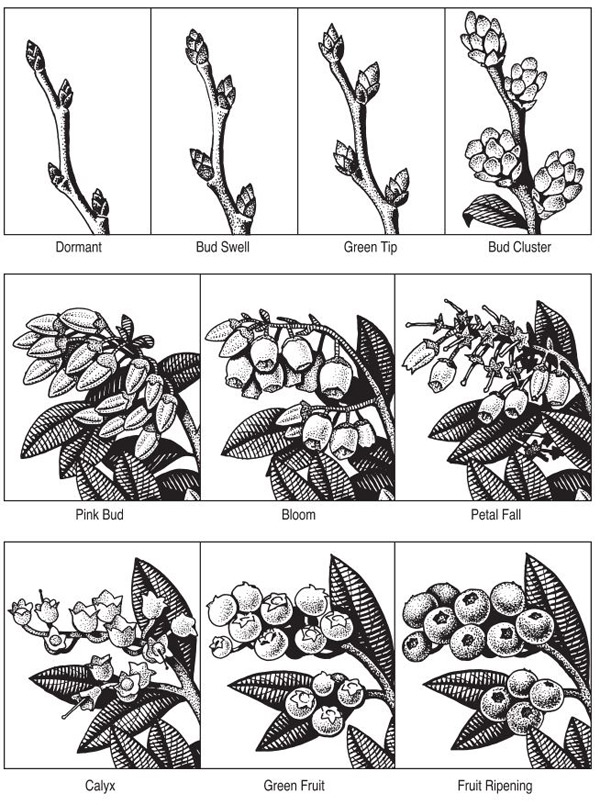
Figure 2. Blueberry Growth Stages
Grape Nutrition
Test the soil two years before planting to see if pH adjustment is needed. One year before planting, test soil again to determine pH, and macro and micronutrients. Some soil amendments, such as organic matter, phosphorus, potassium and lime to adjust soil pH, are needed to optimize vineyard productivity. The only opportunity to thoroughly incorporate these materials is before planting.
Manure for Vineyards
Manure can pose a food safety risk on many fruit crops. Ensure at least 120 days between manure application and harvest.
Manure contains beneficial organic matter and provides many macro- and micronutrients. The organic nitrogen in manure is mineralized over time, providing nitrogen in diminishing quantities for several years after application. When manure is used, adjust applied inorganic nitrogen fertilizers to avoid over-applications. Observe the following guidelines to receive the benefits of manure while minimizing potential problems:
- Apply no more than 7 tonnes/ha of poultry manure (20 m³ liquid), 40 tonnes/ha of cattle manure (100 m³ liquid) or 35 tonnes/ha of hog manure (65 m³ liquid). Since the nutrient content of manure varies considerably, it should be tested before application. See Manure nitrogen.
- Excessive nitrogen, particularly in the second half of the growing season, can result in poor fruit colour, reduced storability, excessive growth and delayed cold-hardening of the woody tissue. These effects make vines more susceptible to winter injury.
- Broadcast manure and work it into the soil in late fall or early spring before planting.
- Do not place manure around newly planted vines as injury may result.
- Adjust the rate of nitrogen, phosphorus and potassium fertilizers applied according to the nutrient content of the manure. See Table 10. Average Fertilizer Replacement Values for Manure.
- For more information about food safety and the environmental impacts of manure application, see Manure nitrogen and Use manure responsibly.
pH Requirements
The pH of a soil is a measure of its acidity or alkalinity. It affects nutrient availability, uptake and crop performance. If the soil test report recommends a lime application to increase soil pH, add lime at the suggested rates at least one year prior to planting. For details regarding rates and suggested types of lime to use, refer to Soil pH and Liming.
In established vineyards, sample soil in the vine row at least once every three years to ensure the pH is satisfactory. If pH is low or acidic, apply lime in the fall to the sod cover or before spring cultivation. The results will not be immediate because lime reacts slowly in the soil. Apply lime to established vineyards when the pH drops below 5.1 on clay loam soils or 5.6 on sandy soils. Lime raises the soil pH and also supplies calcium. For details regarding rates and suggested types of lime to use, refer to Soil pH and Liming.
Petiole Analysis
In established plantings, the best way to determine the nutrient status of the vines is by petiole analysis. In conjunction with soil analysis, it provides good information for adjusting fertilizer rates. For more information on these tests, see Plant tissue analysis.
Nutrient uptake is affected by many vineyard conditions and varies slightly from year to year, depending on the season. To obtain optimum growth and fruit quality, all nutrients must be present in sufficient concentrations. See Table 32. Nutrient Sufficiency Range of Grape Petioles.
| Variety | Nitrogen (N) | Phos-phorus (P) | Potass-ium2 (K) | Cal-cium (Ca) | Magnes-ium (Mg) | Iron (Fe) | Boron (B) | Zinc (Zn) | Man-ganese (Mn) |
|---|---|---|---|---|---|---|---|---|---|
| % | ppm | ||||||||
| Vinifera | 0.8-1.4 | 0.15-0.4 | 1.2-2.3 | 1-3 | 0.6-1.5 | 15-100 | 20-60 | 15-100 | 20-200 |
| Labrusca (Fredonia) | 0.6-1.2 | 0.15-0.4 | 0.8-1.8 | 1-3 | 0.6-1.5 | 15-100 | 20-60 | 15-100 | 20-200 |
| Other | 0.7-1.3 | 0.15-0.4 | 1-2 | 1-3 | 0.6-1.5 | 15-100 | 20-60 | 15-100 | 20-200 |
1 Taken in September from mature vines.
2 Potassium levels may be higher in grapes grown on sandy loam soils.
Fertilizer for Grapes
The best time to effectively incorporate nutrients such as potassium, phosphorus, boron and lime into the soil is prior to planting the vineyard. Nutrient levels in the topsoil adequate for vineyard establishment are 12-20 ppm phosphorus, 120-150 ppm potassium, 100-250 ppm magnesium and 1,000-5,000 ppm calcium. Table 33. Phosphorus and Potassium Soil Requirements for New Plantings of Grapes, provides fertilizer rates prior to planting. Along with incorporation of organic matter such as manure, these fertility levels will sustain the vineyard through the juvenile years.
High nitrogen levels can result in excessive growth and incomplete vine hardening. Use cover crops to reduce late-season nitrogen levels in cultivated vineyards, especially in new plantings. Sow cover crops such as Italian ryegrass about July 1 to take up much of the available nitrogen in the soil.
Nitrogen (N)
Use petiole analysis to determine nitrogen requirements. Use 34 kg of nitrogen per ha only if this information is not available. Broadcast nitrogen before the first cultivation. In vineyards with sod between the rows, apply nitrogen as early as possible in the spring. Where urea (46-0-0) is applied, it must be incorporated to reduce losses by volatilization. Do not use urea in vineyards with sod between the rows because incorporation is not possible. Reduce rates or eliminate nitrogen entirely if manure is used or growth has been excessive. If severe winter temperatures cause fruit bud damage, it may be necessary to split nitrogen applications. Apply the first application in mid-May after bud break has begun, and the second application, if necessary, after bloom in late June. During dry springs, use irrigation to move the fertilizer into the rooting zone just before first bloom or immediately after capfall. Consider foliar applications of nitrogen if vine performance and petiole analysis suggest the need.
Phosphorus (P)
Grapes do not require high levels of soil phosphorus. Use a soil test to determine if phosphorus fertilizer is required. With a few exceptions, the level of phosphorus in Ontario soils is generally adequate for grapes. A phosphorus soil test value between 12-20 ppm is adequate for vineyard establishment and production. When establishing a new planting, apply phosphorus before planting and thoroughly incorporate it into the soil. See Table 33. Phosphorus and Potassium Soil Requirements for New Plantings of Grapes . In established plantings, use petiole analysis along with soil analysis to estimate phosphorus requirements. Additional phosphorus may be needed for sod or cover crop maintenance.
Table 33. Phosphorus and Potassium Soil Requirements for New Plantings of Grapes
| Soil test(ppm P)1 | Phosphate (P2O5) required (kg/ha)[response] |
|---|---|
0-3 | 80 [HR] |
4-5 | 60 [HR] |
6-7 | 50 [HR] |
8-9 | 40 [MR] |
10-12 | 20 [MR] |
13-15 | 0 [LR] |
16-20 | 0 [LR] |
21-25 | 0 [RR] |
26-30 | 0 [RR] |
31-40 | 0 [RR] |
41-50 | 0 [RR] |
51-60 | 0 [RR] |
61-80 | 0 [NR] |
80+ | 0 [NR] |
| Soil test(ppm K)2 | Potash (K2O) required (kg/ha)[response] |
|---|---|
0-15 | 270 [HR] |
16-30 | 270 [HR] |
31-45 | 270 [HR] |
46-60 | 270 [HR] |
61-80 | 270 [HR] |
81-100 | 270 [HR] |
101-120 | 270 [HR] |
121-150 | 270 [MR] |
151-180 | 270 [MR] |
181-210 | 270 [MR] |
211-250 | 270 [LR] |
250+ | 270 [LR] |
* For new plantings, apply only every second year. For established grapes, use plant analysis to estimate requirements of N, P and K.
1 0.5 M sodium bicarbonate extract soil test method (Olsen).
2 1.0 N ammonium acetate soil test methods.
HR, MR, LR, RR, and NR denote, respectively: high, medium, low, rare and no probabilities of profitable crop response to applied nutrient.
Potassium (K)
Grapes require larger amounts of potassium than tree fruits. In established plantings, use petiole analysis along with soil analysis to estimate potassium to determine requirements. Excess potassium can lead to deficiency of magnesium (Mg). Avoid unnecessary potassium applications.
Prior to establishment, incorporate potassium according to Table 33. Phosphorus and Potassium Soil Requirements for New Plantings of Grapes. In established cultivated vineyards, broadcast potassium before the first cultivation in the spring. In established vineyards with sod between the rows, and in vineyards on clay soils, apply potassium in a band to reduce potassium fixation and increase its availability to the vines. Muriate of potash (0-0-60) can injure roots and trunks if applied too closely to the trunk.
Foliar application of potassium for grapes
In dry growing seasons, potassium is not readily available to the plant. When a potassium deficiency occurs, foliar applications of potassium may help. Foliar potassium applied at veraison (when grapes begin to ripen) may improve fruit yield and quality. Apply this material as a foliar application only if deficiency is observed. Excess potassium can lead to juice and must issues for fermentation.
Magnesium (Mg)
Magnesium soil test values between 100-250 ppm are adequate for grapes. Dolomitic limestone can be used on acidic soils to raise the soil pH and to supply magnesium. Magnesium deficiency has become more evident in vineyards, particularly when high rates of potassium are used.
Magnesium deficiency can lead to premature fruit drop. Because magnesium is a part of the chlorophyll molecule, magnesium-deficient vines have older leaves that are pale in colour. Petiole analysis is the best way to evaluate magnesium levels.
Foliar sprays may correct magnesium deficiency for the current year only. For long-term corrections, apply magnesium to the soil in early spring. On some soil types, a single early-spring application of soil-applied magnesium may not be enough. A second or third application the next spring may be required before the magnesium level in the plant improves.
See Table 34. Magnesium Foliar Sprays.
Fruit or foliage injury may occur if pesticides are mixed with magnesium sulphate (Epsom salts). Pesticides should be applied as a separate spray. Check the manufacturer's label about mixtures of magnesium chelates with pesticides. Use only chelates recommended for foliar sprays.
Calcium (Ca)
Calcium deficiency has been associated with rachis (cluster stem) breakdown of Canada Muscat and Himrod grapes. This deficiency is usually associated with water uptake imbalances in the vine during bloom and immediately post fruit set. It is difficult to correct with calcium foliar sprays.
Micronutrients
Deficiencies of micronutrients are not widespread in Ontario plantings. The desirable range for micronutrients is quite narrow. Micronutrients applied in excess can cause more damage than deficiencies. For this reason, do not apply micronutrients unless petiole analysis confirms a deficiency. Apply only the nutrient that is deficient and only in sufficient quantities to correct the problem.
Lime-induced chlorosis is a deficiency in iron or manganese occasionally induced by alkaline soils with high soil bicarbonates or by excessive lime application. For additional information, see Micronutrients.
Apply nutrients according to recommended rates on the product label. Do not spray during temperatures above 25°C.
| Timing | Product | Rate | Notes |
|---|---|---|---|
| 3 sprays spaced 10 days apart beginning in mid-July | Magnesium sulfate (Epsom salts) | 20 kg/1,000 L water | Apply to plant to point of runoff. Do not concentrate beyond 40 kg/1,000 L water. |
| Liquid formulations including chelates* | Consult product label. | May be compatible with some pesticides. Consult product label. |
* Use chelates recommended for foliar sprays.
Tender Fruit Nutrition
Test the soil two years before planting to see if pH adjustment is needed. One year before planting, test soil again to determine pH, and macro and micronutrients. The best time to thoroughly incorporate organic matter, phosphorus, potassium and lime is before planting. These materials are required to optimize orchard productivity.
Manure for Orchards
Manure can pose a food safety risk on many fruit crops. Ensure at least 120 days between manure application and harvest.
Manure contains beneficial organic matter and many macro- and micronutrients. The organic nitrogen in manure is mineralized over time, providing nitrogen in diminishing quantities for years after application. Adjust additional organic and inorganic nitrogen applications accordingly. Observe the following guidelines to receive the benefits of manure while minimizing potential problems:
- Apply no more than 7 tonnes/ha of poultry manure (20 m³ liquid), 40 tonnes/ha of cattle manure (100 m³ liquid) or 35 tonnes/ha of hog manure (65 m³ liquid). Since the nutrient content of manure varies greatly, it should be tested before application. See Manure nitrogen.
- Excessive nitrogen, particularly in the second half of the growing season, can result in poor fruit colour, reduced storability, excessive growth and delayed cold-hardening of the woody tissue, which may make trees more susceptible to winter injury.
- Broadcast manure and work into the soil in late fall or early spring before planting. Do not place manure around newly planted trees in late summer because of potential winter injury.
- Adjust the rate of nitrogen, phosphorus and potassium fertilizers applied according to the nutrient content of the manure. See Table 10. Average Fertilizer Replacement Values for Manure.
- For more information about food safety and the environmental impacts of manure application, see Manure nitrogen, Use manure responsibly, and Manure and food safety.
pH Requirements
The pH of a soil is a measure of its acidity or alkalinity. It affects nutrient availability, uptake and crop performance. If the soil test report recommends a lime application to increase soil pH, add lime one year prior to planting. For details regarding rates and suggested types of lime to use, refer to Soil pH and Liming.
In established orchards, sample soil in the tree row every 3 years to ensure the pH is satisfactory. If the pH drops below 5.6 on sandy soils or below 5.1 on clay loam soils, apply lime to the sod cover in the fall or before spring cultivation. The results will not be immediate because lime reacts slowly in the soil.
Leaf Analysis
In established plantings, the best way to determine the nutrient status of the orchard is by leaf analysis. In conjunction with soil analysis, it provides important information for adjusting fertilizer rates. To gain the most benefit from foliar analysis, sample once every three years. For more information on these tests, see Plant tissue analysis.
Nutrient uptake is affected by many orchard conditions and varies slightly from year to year, depending on the season. For optimum growth and fruit quality, all nutrients must be available in sufficient concentrations. See Table 35. Nutrient Concentration Sufficiency Ranges for Tender Fruits.
To monitor trends, complete a leaf analysis every year. Sampling the same trees at the same time of the year will assist in interpreting leaf analysis reports from year to year. Use leaf analysis together with soil test results to make adjustments to the fertilizer program. Fertilizer requirements are adjusted based on this leaf analysis, soil management practices, tree age, rootstock, soil type and previous fertilizer applications. Growth, fruit size, colour and storage quality must also be considered to determine the fertilizer required.
| Crop | Nitrogen (N)* % | Phos-phorus (P) % | Potass-ium (K) % | Cal-cium (Ca) % | Magnes-ium (Mg) % | Iron (Fe) (ppm) | Boron (B) (ppm) | Zinc (Zn) (ppm) | Man-ganese (Mn) (ppm) |
|---|---|---|---|---|---|---|---|---|---|
| Peach | 3.4-4.1 | 0.15-0.4 | 2.3-3.5 | 1-2.5 | 0.35-0.6 | 25-200 | 20-60 | 15-100 | 20-200 |
| Pear | 2-2.6 | 0.15-0.4 | 1.2-2 | 1-2 | 0.25-0.5 | 25-200 | 20-60 | 15-100 | 20-200 |
| Plum | 2.4-3.2 | 0.15-0.4 | 1.5-3 | 1-2.5 | 0.35-0.65 | 25-200 | 20-60 | 15-100 | 20-200 |
| Cherry (Montmo-rency) | 2.2-3 | 0.15-0.4 | 1.3-2.5 | 1-2.5 | 0.35-0.65 | 25-200 | 20-60 | 15-100 | 20-200 |
* Leaf nitrogen in non-bearing trees should be 0.2% higher.
Fertilizer for Tender Fruit
Fertilizer for non-bearing tender fruit trees
The best time to effectively incorporate nutrients such as phosphorus, potassium, boron and lime is before planting. Adequate nutrient levels in the topsoil for orchard establishment are 12-20 ppm phosphorus, 120-150 ppm potassium, 100-250 ppm magnesium and 1,000-5,000 ppm calcium. See Table 36. Phosphorus and Potassium Soil Requirements Before Planting Peach, Pear, Plum or Cherry Trees, for information on fertilizer rates prior to planting. Along with the incorporation of organic matter, these fertility levels will sustain the tree in the juvenile years. On coarse-textured, infertile soils, use a starter solution at planting time such as 10-52-10 or 20-20-20. High nitrogen levels can result in excessive growth and incomplete tree hardening. Use cover crops to reduce late-season nitrogen levels in cultivated orchards, especially in new plantings. Cover crops such as Italian ryegrass, sown about July 1, take up much of the available nitrogen in the soil and will check tree growth. On young trees, broadcast the fertilizer under the spread of the branches. Keep the fertilizer at least 15 cm from the trunk, since injury can occur if it is placed too close.
Fertilizer for bearing tender fruit trees
Most bearing orchards require annual applications of both nitrogen and potassium fertilizer. These two elements significantly affect growth and productivity.
Nitrogen (N)
Nitrogen is necessary for many tree functions, including growth, fruit bud formation, fruit set and fruit size. Cultivars differ in nitrogen requirements. A cultivar grown for processing could receive more nitrogen than one for the fresh market. In situations where fruit tends to be small, more nitrogen may be needed. Rootstocks, spacing and pruning also affect nitrogen requirements. Tree growth, fruit colour and storability are also important considerations. Because of complex interactions with nitrogen and quality and production, the best guide for nitrogen rates is leaf analysis.
For pear, peach, plum and cherry orchards where leaf analysis is not available, the following rates are considered sufficient. For each year of the tree's age, apply between 30-40 g of nitrogen. For example, a 5-year-old tree in sod culture requires 150-200 g of nitrogen. See Table 37. Actual Nitrogen Rates per Tree in Sod Culture. The rate for cultivated orchards can be reduced by half as competition for nutrients is greatly reduced. Trees on dwarfing rootstock generally require more nitrogen per ha (not per tree) than trees on more vigorous stocks. When the tree canopy has covered the space available, nitrogen fertilizer requirements level out and do not increase with tree age. Again leaf analysis is the most reliable guide.
There are several forms of nitrogen available. Do not apply urea (46-0-0) to orchards with sod between the rows because urea must be incorporated to prevent loss by volatilization. For all tree fruits, do not exceed 200 kg actual nitrogen per ha per year, even in cases of severe deficiency. Late or excessive applications of nitrogen result in poor fruit colour and quality. Available nitrogen late in the season encourages the tree to grow instead of harden off, which potentially leads to winter injury. In cultivated orchards, use cover crops to help lower the nitrogen level in the latter part of the season. Cover crops such as Italian ryegrass, sown about July 1, will take up much of the available nitrogen in the soil and limit tree growth. In orchards with herbicide-treated strips under trees, allow some weed growth late in the season. Weeds take up extra nitrogen, which helps to harden off trees and improve fruit quality. If pruning is to be severe, reduce nitrogen rates or eliminate it for a year. During dry springs, irrigate to move the fertilizer into the rooting zone of the soil just before first bloom or immediately after petal fall. For fire blight-sensitive pear cultivars, use less than the maximum rate of nitrogen suggested.
Table 36. Phosphorus and Potassium Soil Requirements Before Planting Peach, Pear, Plum or Cherry Trees
| Soil test(ppm P)1 | Phosphate (P2O5) required (kg/ha)[response] |
|---|---|
0-3 | 80 [HR] |
4-5 | 60 [HR] |
6-7 | 50 [HR] |
8-9 | 40 [MR] |
10-12 | 20 [MR] |
13-15 | 0 [LR] |
16-20 | 0 [LR] |
21-25 | 0 [RR] |
26-30 | 0 [RR] |
31-40 | 0 [RR] |
41-50 | 0 [RR] |
51-60 | 0 [RR] |
61-80 | 0 [NR] |
80 + | 0 [NR] |
| Soil test(ppm K)2 | Potash (K2O) required (kg/ha)[response] |
|---|---|
0-15 | 180 [HR] |
16-30 | 170 [HR] |
31-45 | 160 [HR] |
46-60 | 140 [HR] |
61-80 | 110 [HR] |
81-100 | 70 [MR] |
101-120 | 40 [MR] |
121-150 | 20 [MR] |
151-180 | 0 [LR] |
181-210 | 0 [LR] |
211-250 | 0 [RR] |
250 + | 0 [NR] |
HR, MR, LR, RR, and NR denote, respectively: high, medium, low, rare and no probabilities of profitable crop response to applied nutrient.
1 0.5 M sodium bicarbonate extract soil test method (Olsen).
2 1.0 N ammonium acetate soil test method.
For established fruit trees, use plant analysis to estimate requirements of nitrogen, phosphorus and potassium.
Nitrogen placement and timing
Apply nitrogen fertilizer in early April. In cultivated orchards, broadcast nitrogen under the tree canopy. In sod orchards, place the nitrogen in a band under the drip line or in the herbicide strip. If there is evidence of fruit bud damage due to severe winter temperatures, it may be necessary to split nitrogen applications. Apply the first application in mid-April and the second, if necessary, after bloom in late May.
Foliar application of nitrogen
When weather or crop conditions create a need for additional nitrogen at a critical time, foliar applications of urea (46-0-0) have been successfully used on fruit trees. Late applications adversely affect fruit quality and winter survival of the tree.
Do not rely on foliar sprays to completely substitute for soil applications if nitrogen is required. Make applications based on tree performance and leaf analysis.
Phosphorus (P)
Phosphorus is not required in large amounts by fruit trees. With a few exceptions, the level of phosphorus in Ontario soils is adequate. Phosphorus may be required for sod or cover crop maintenance. A soil test is the best way to determine if the sod needs this nutrient.
If indicated by a soil test, apply phosphorus before planting an orchard when it can be thoroughly incorporated into the soil. Phosphorus soil test values between 12-20 ppm are considered adequate for tree establishment and fruit production.
| Tree age (years) | Number of trees per ha (trees per ac) | ||
|---|---|---|---|
| 400 (160) | 500 (200) | 600 (240) | |
| Actual nitrogen per tree (grams) | |||
1 | 40 | 40 | 40 |
2 | 80 | 80 | 80 |
3 | 120 | 120 | 120 |
4 | 160 | 160 | 160 |
5 | 200 | 200 | 180 |
6 | 240 | 240 | 240 |
7 | 280 | 280 | 260 |
8 | 320 | 320 | 280 |
9 | 360 | 360 | 300 |
10 | 400 | 400 | 320 |
11 | 440 | 400 | 320 |
12 | 480 | 400 | 320 |
Potassium (K)
Potassium is important for fruit colour, winter hardiness, tree growth and resistance to disease, such as fire blight in pears. Excess potassium can lead to magnesium (Mg) deficiency, so avoid unnecessary potassium applications. Soil test values between 120-150 ppm are adequate when planting fruit trees. Muriate of potash (0-0-60) is the most common form of potassium. If leaf analysis data is not available, the following rates are considered normal.
For trees 1-6 years of age regardless of density, apply 50 g K2O (80 g muriate of potash) per 2.5 cm of trunk cross-section (diameter).
For trees 7 years of age or older, apply no more than 3 kg of K2O (5 kg muriate of potash) per mature standard tree in a year, regardless of how severe the deficiency. When the tree canopy has covered the space available, potassium fertilizer requirements level out and do not increase indefinitely with tree age. Leaf analysis is the most reliable guide.
Potassium placement and timing
In early spring, apply potassium separately or combined with nitrogen. Some growers make fall applications because of time constraints in the spring. Leaching during winter may cause the loss of some potassium. For this reason, apply in spring if possible. In orchards with sod between the rows, apply potash in a band around the drip line or in the herbicide strip.
Foliar application of potassium
In dry growing seasons, potassium is not readily available to the plant. Foliar applications of potassium may be used where potassium deficiency is confirmed by leaf analysis.
Magnesium (Mg)
Magnesium deficiency has become more evident in orchards, particularly when high rates of potassium are used. Magnesium deficiency can lead to premature fruit drop.
As magnesium is a part of the chlorophyll molecule, trees deficient in magnesium have older leaves that are pale in colour. Leaf analysis is the best way to evaluate magnesium needs.
Foliar sprays of magnesium are effective to correct magnesium deficiency for the current year only. For longer term correction, soil applications of magnesium are required. Magnesium soil test values between 100-250 ppm are considered adequate when planting fruit trees. See Table 38. Magnesium Foliar Sprays.
Do not mix pesticides with magnesium sulphate (Epsom salts) as foliar injury may result. Check the manufacturer's label in regard to the mixture of magnesium chelates with pesticides. Use only chelates recommended for foliar sprays. For long-term corrections, apply magnesium to the soil. The response is not immediate. On some soil types, a single early spring application of soil-applied magnesium is not sufficient and a second or third application the following spring may be required before the magnesium level in the tree improves. To be sure that fruit drop is not a problem during this period, apply foliar sprays for the first two years in addition to soil applications. For soil corrections, apply 5-7 kg per mature standard tree and 3-4 kg per mature dwarf tree of sulphate of potash magnesia. This is a granular fertilizer known by several trade names. It contains approximately 21% potash and 11% magnesium. Apply in early spring in a band under the tree drip line. It contains potassium (K) and the rate of application depends on potash needs. No further potash is likely to be required, but apply nitrogen at recommended rates. Other sources of magnesium also work well as a soil application. If magnesium is being blended with the fertilizer, apply at least 80 kg of available magnesium per ha when the fertilizer is spread. Use dolomitic limestone on acidic soils to raise the soil pH and to supply magnesium.
Calcium (Ca)
Lack of calcium is associated with fruit quality problems in pear and gummosis in European plums and prunes. Calcium sprays must contact the fruit for uptake to be effective. Therefore water volumes capable of wetting the entire tree are required. Some formulations of calcium chloride (CaCl2) result in poor fruit finish if applied too close to harvest. Excessive calcium can cause foliar damage. The product used is not as important as the total amount of actual calcium applied.
Use CaCl2 (77% flakes) at 4 kg per 1,000 L of water from early July to mid-August. Apply 3 sprays, 10-12 days apart. For acceptable results, up to 12 kg/ha of actual calcium is often required in a total of 4 or more sprays. Calcium sprays may injure foliage and fruit if applied during low temperatures and wet weather. These conditions delay the drying of the spray. Injury can also occur if calcium is applied in hot (over 25°C) or humid weather. Do not apply calcium formulations containing nitrogen after the end of July or fruit quality and storability may suffer. For all formulations, consult the label for rates and compatibility with pesticides.
Micronutrients for Tender Fruit
Deficiencies of micronutrients or trace elements are not widespread in Ontario fruit plantings. The desirable range for micronutrients is quite narrow. Micronutrients applied in excess can cause more damage than deficiencies. Leaf analysis is more effective than soil analysis to evaluate tree micronutrient status. For more information see Micronutrients.
Do not apply micronutrients to fruit crops unless leaf analysis confirms a deficiency.
Apply only the nutrient that is deficient and only in sufficient quantities to correct the problem.
Apply nutrient sprays according to recommended rates on the product label. Do not spray during temperatures above 25°C.
| Timing | Product | Rate | Notes |
|---|---|---|---|
| 3 sprays spaced 2 weeks apart beginning at petal fall/shuck or shuck split | Magnesium sulphate (Epsom salts) | 20 kg/1,000 L water | Wet tree to point of runoff. Do not concentrate beyond 40 kg/1,000 L water. |
| Liquid formulations including chelates* | Consult product label | May be compatible with some pesticides. Consult product label. |
* Use only chelates recommended for foliar sprays.
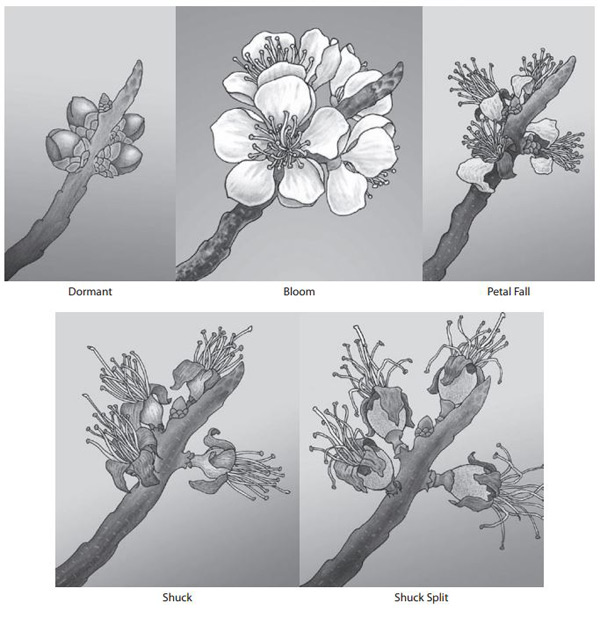
Figure 3. Apricot Growth Stages
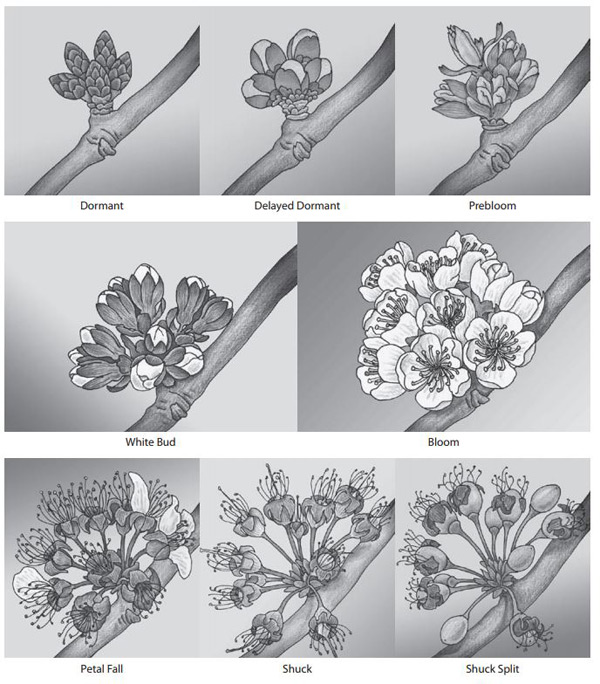
Figure 4. Tart and Sweet Cherry Growth Stages
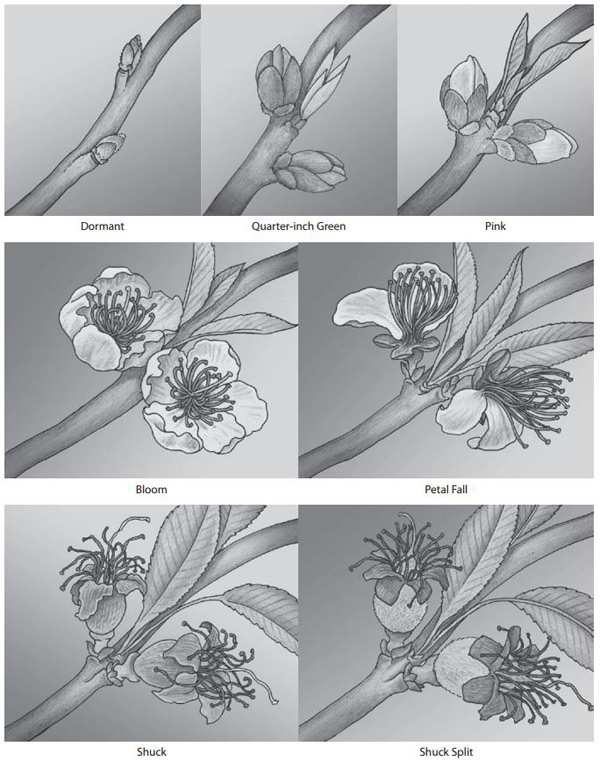
Figure 5. Peach Growth Stages
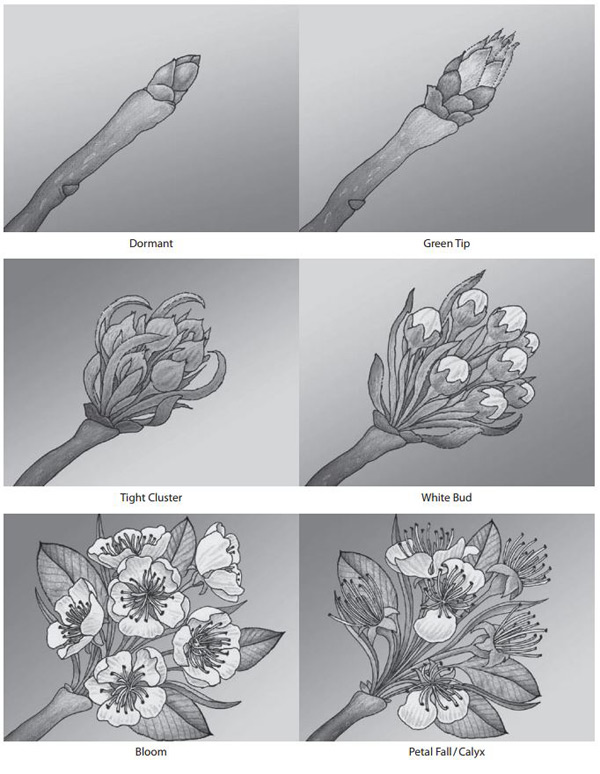
Figure 6. Pear Growth Stages
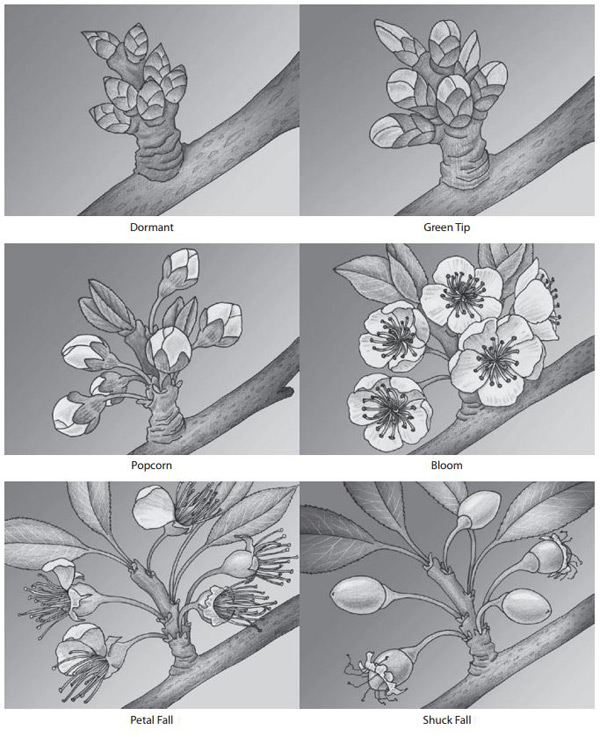
Figure 7. Plum and Prune Growth Stages