This page was published under a previous government and is available for archival and research purposes.
Chapter 2. Ensuring a flexible energy system
Ontario has made significant progress in rebuilding its electricity system. Nearly $70 billion has been invested in Ontario’s electricity system since 2003. Ontario now has an electricity system that is well-positioned to pursue emerging opportunities and meet future challenges, including the fight against climate change.
In 2016, Ontario produced more than 50 per cent of its electricity from nuclear, with renewable resources providing about 30 per cent and emitting generation providing less than 10 per cent. Conservation reduced energy consumption by about nine per cent.
Figure 7: Ontario’s electricity generation and conservation, 2016
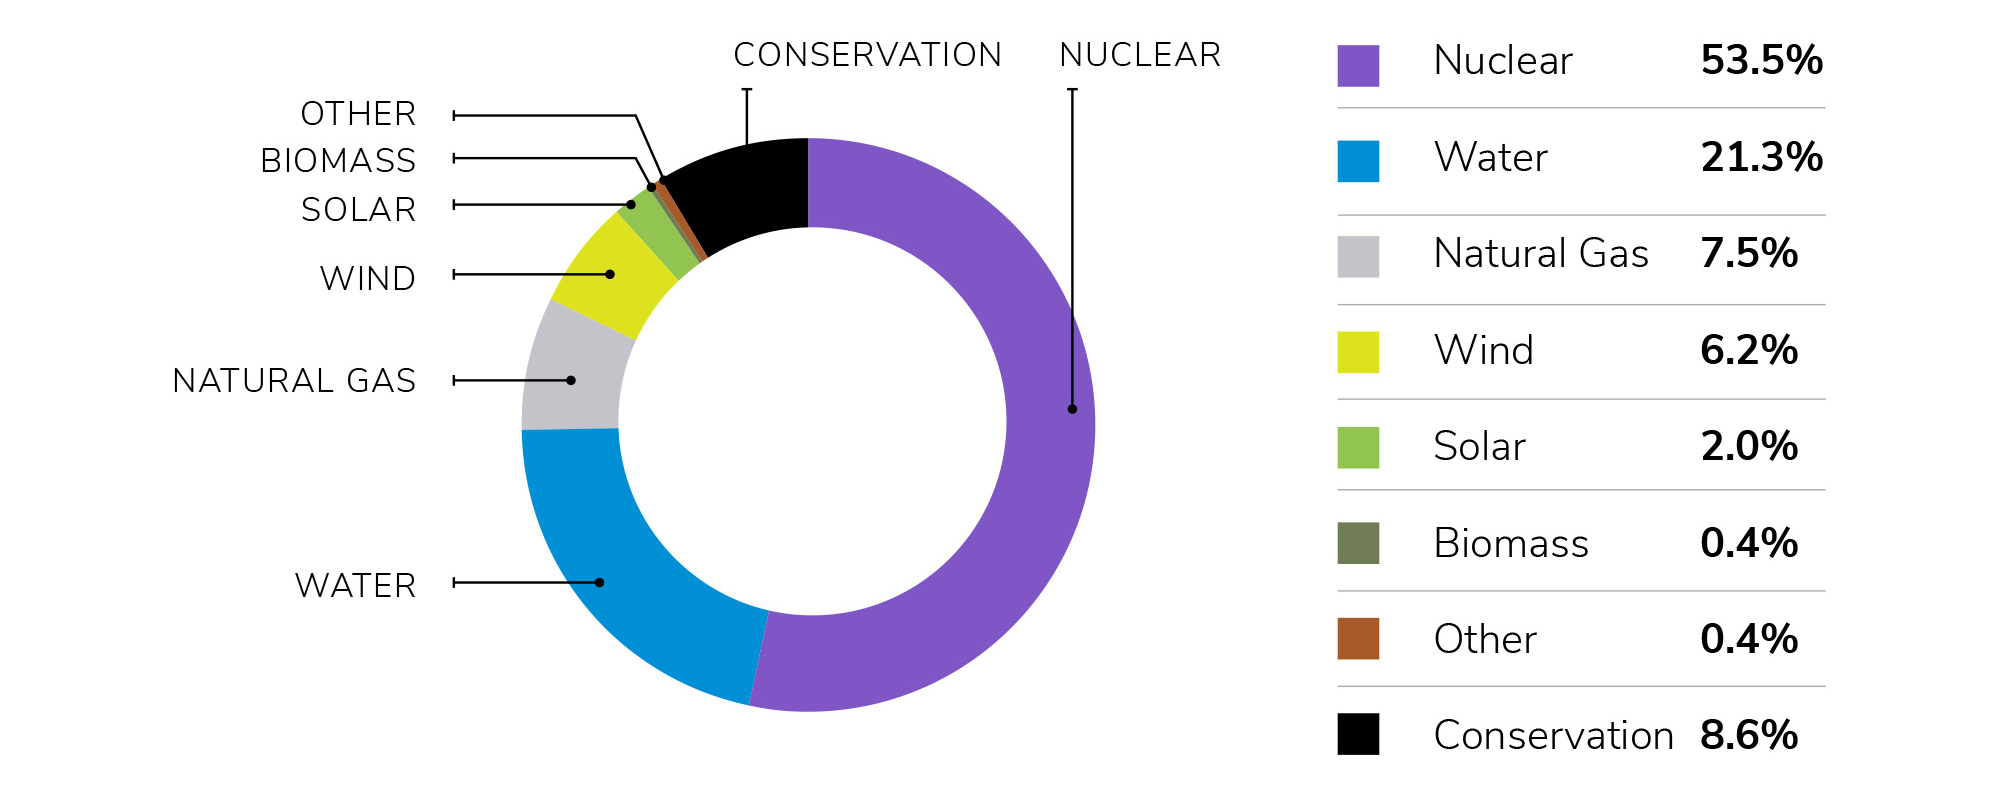
Source: Ministry of Energy
Note: Generation reflects the sum of transmission- and distribution-connected sources. Conservation value represents persistent savings in 2016 from programs and codes and standards since 2006.
Ontario’s electricity system provides the province with a firm base on which to take further steps to fight climate change. Currently, the province’s fuels sector supplies most of the energy needed for our transportation, heating and manufacturing. Ontario’s clean and reliable electricity system provides the province with the energy to increase electrification and reduce greenhouse gas (GHG) emissions. The province’s existing network of pipelines and retail outlets can also be used to deliver future alternative fuels, such as renewable natural gas.
The need for flexibility
Ontario’s current robust supply provides us with the opportunity to explore and efficiently implement new approaches to procuring electricity resources. These approaches will need to be designed to be flexible enough to ensure that Ontario is well positioned to accommodate and benefit from emerging energy technologies, while also ensuring that system needs are met at the lowest cost to ratepayers.
Ontario is moving away from relying on long-term electricity contracts and is enhancing its market-based approach to reduce electricity supply costs and increase flexibility. Electricity system operators in New England, New York and the Pennsylvania-New Jersey-Maryland Interconnection have successfully implemented this type of approach.
The Independent Electricity System Operator (IESO) has begun a Market Renewal initiative to redesign the province’s electricity markets. This undertaking is expected to save up to $5.2 billion between 2021 and 2030 and forms a key component of the government’s plan to bring down the cost of electricity.
The Market Renewal Initiative consists of three work streams: energy, capacity and operability. The IESO will continue its work on the design of mechanisms for these streams in order to maximize the benefits to the system while ensuring reliability and affordability. When new supply needs are identified, the IESO would use competitive mechanisms to procure new supply resources. An example of a market-based mechanism that could be used is an incremental capacity auction.
Generators, demand response providers, importers and emerging new technologies could all participate in the auction, with the most cost-effective resources winning out. Market Renewal will ensure that resources will be able to provide flexibility, reliability and ancillary services. This will help provide transparent revenue streams for the needed services and ensure that all resources can compete on a level playing field.
Market Renewal is expected to result in a more competitive marketplace that more flexibly and efficiently meets system needs and government policy goals. Market Renewal will be aligned with the objectives of Ontario’s Climate Change Action Plan, and will be designed to meet system needs, reduce ratepayer costs and reduce GHG emissions. It can be flexible enough to meet various scenarios from higher demand due to increased electrification of our economy to lower demand scenarios as a result of increased use of distributed energy.
Market Renewal will help Ontario prepare for the future by creating a competitive framework that cost-effectively incorporates clean energy resources and new and emerging clean technologies. This will help meet our climate change and GHG reduction commitments. The IESO, together with its sector partners, has identified the need to ensure that this new framework can properly value environmental attributes and the benefits they provide to the system. At the same time, existing resources will be able to continue to meet system needs in the redesigned electricity markets. Maximizing the use of these assets will allow Ontario to limit future cost increases.
A reformed electricity market would not only help reduce costs, but also increase two-way electricity trade with other jurisdictions. Imports and exports could be scheduled more frequently on the interties, which are the transmission lines going to states and other provinces. This could allow more imports of lower-cost generation, and provide greater revenue and access to export markets for Ontario generators.
The IESO is working closely with partners in the electricity sector to design the significant changes that will become the foundation of Market Renewal and a plan for bringing them into effect. The plan will specify the changes to be implemented and the timelines for completing the work. This will allow the IESO and its partners to address the known challenges of our existing markets and lay a solid foundation for a more competitive and flexible energy market that can meet future needs.
Electricity supply and demand
While there is currently an adequate supply of electricity, a shortfall in capacity is expected beginning in the early-to-mid 2020s as the Pickering Nuclear Generating Station reaches its end of life, and nuclear units at Darlington and Bruce are temporarily removed from service for refurbishment.
Figure 8: Supply and demand outlook (2017-2035)
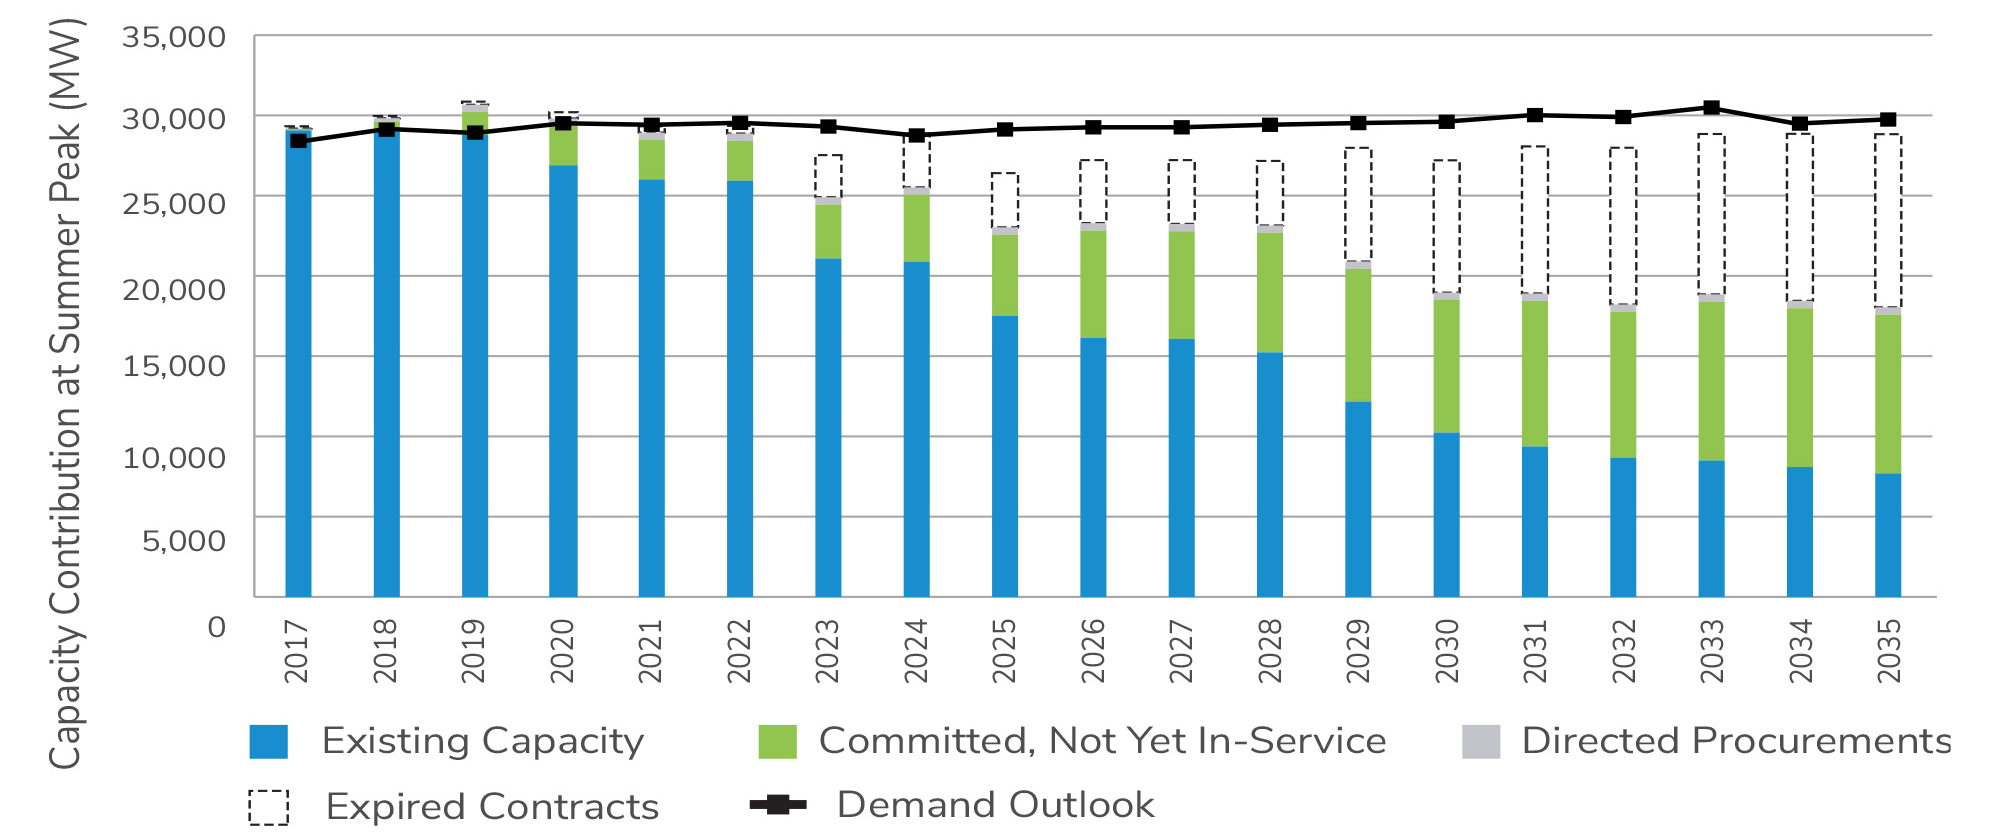
Source: IESO
This need for additional capacity will be met through initiatives under Market Renewal. The auction will allow existing and new clean generation facilities to compete in a robust market with clean imports, demand-side initiatives and new emerging technologies. In addition, the continued growth of distribution-connected wind and solar power is expected to reduce local demand and the need for LDCs to draw electricity from the province’s transmission networks.
The demand for electricity is forecast to be relatively steady over the planning period. In the long-term, the IESO projects an increase in overall demand as electrification of the economy increases. The possibility of electrification exists in nearly every part of the energy system. In particular, there is a great potential in the transportation sector, where electrification would be an economical and clean alternative to fossil-fuel powered engines. The outlook assumes the equivalent of approximately 2.4 million electric vehicles by 2035. The outlook also includes the electrification of the GO rail system, as well as new light rail transit projects in Hamilton, Mississauga, Kitchener, Toronto and Ottawa.
Transmission
The IESO's demand outlook indicates that there will be no need for any major expansion of the province’s transmission system beyond the projects already planned or under development. See figure 9 for some of the major projects planned or underway on the high-voltage transmission system. Regional electricity needs are discussed in Chapter 8.
The government will direct the IESO to establish a formal process for planning the future of the integrated provincewide bulk system, which includes the high voltage system that typically carries 230 and 500 kilovolts (kVs) in Ontario. As part of the process, the IESO will engage with its partners and communities around the province.
Figure 9: Major transmission projects under development across ontario
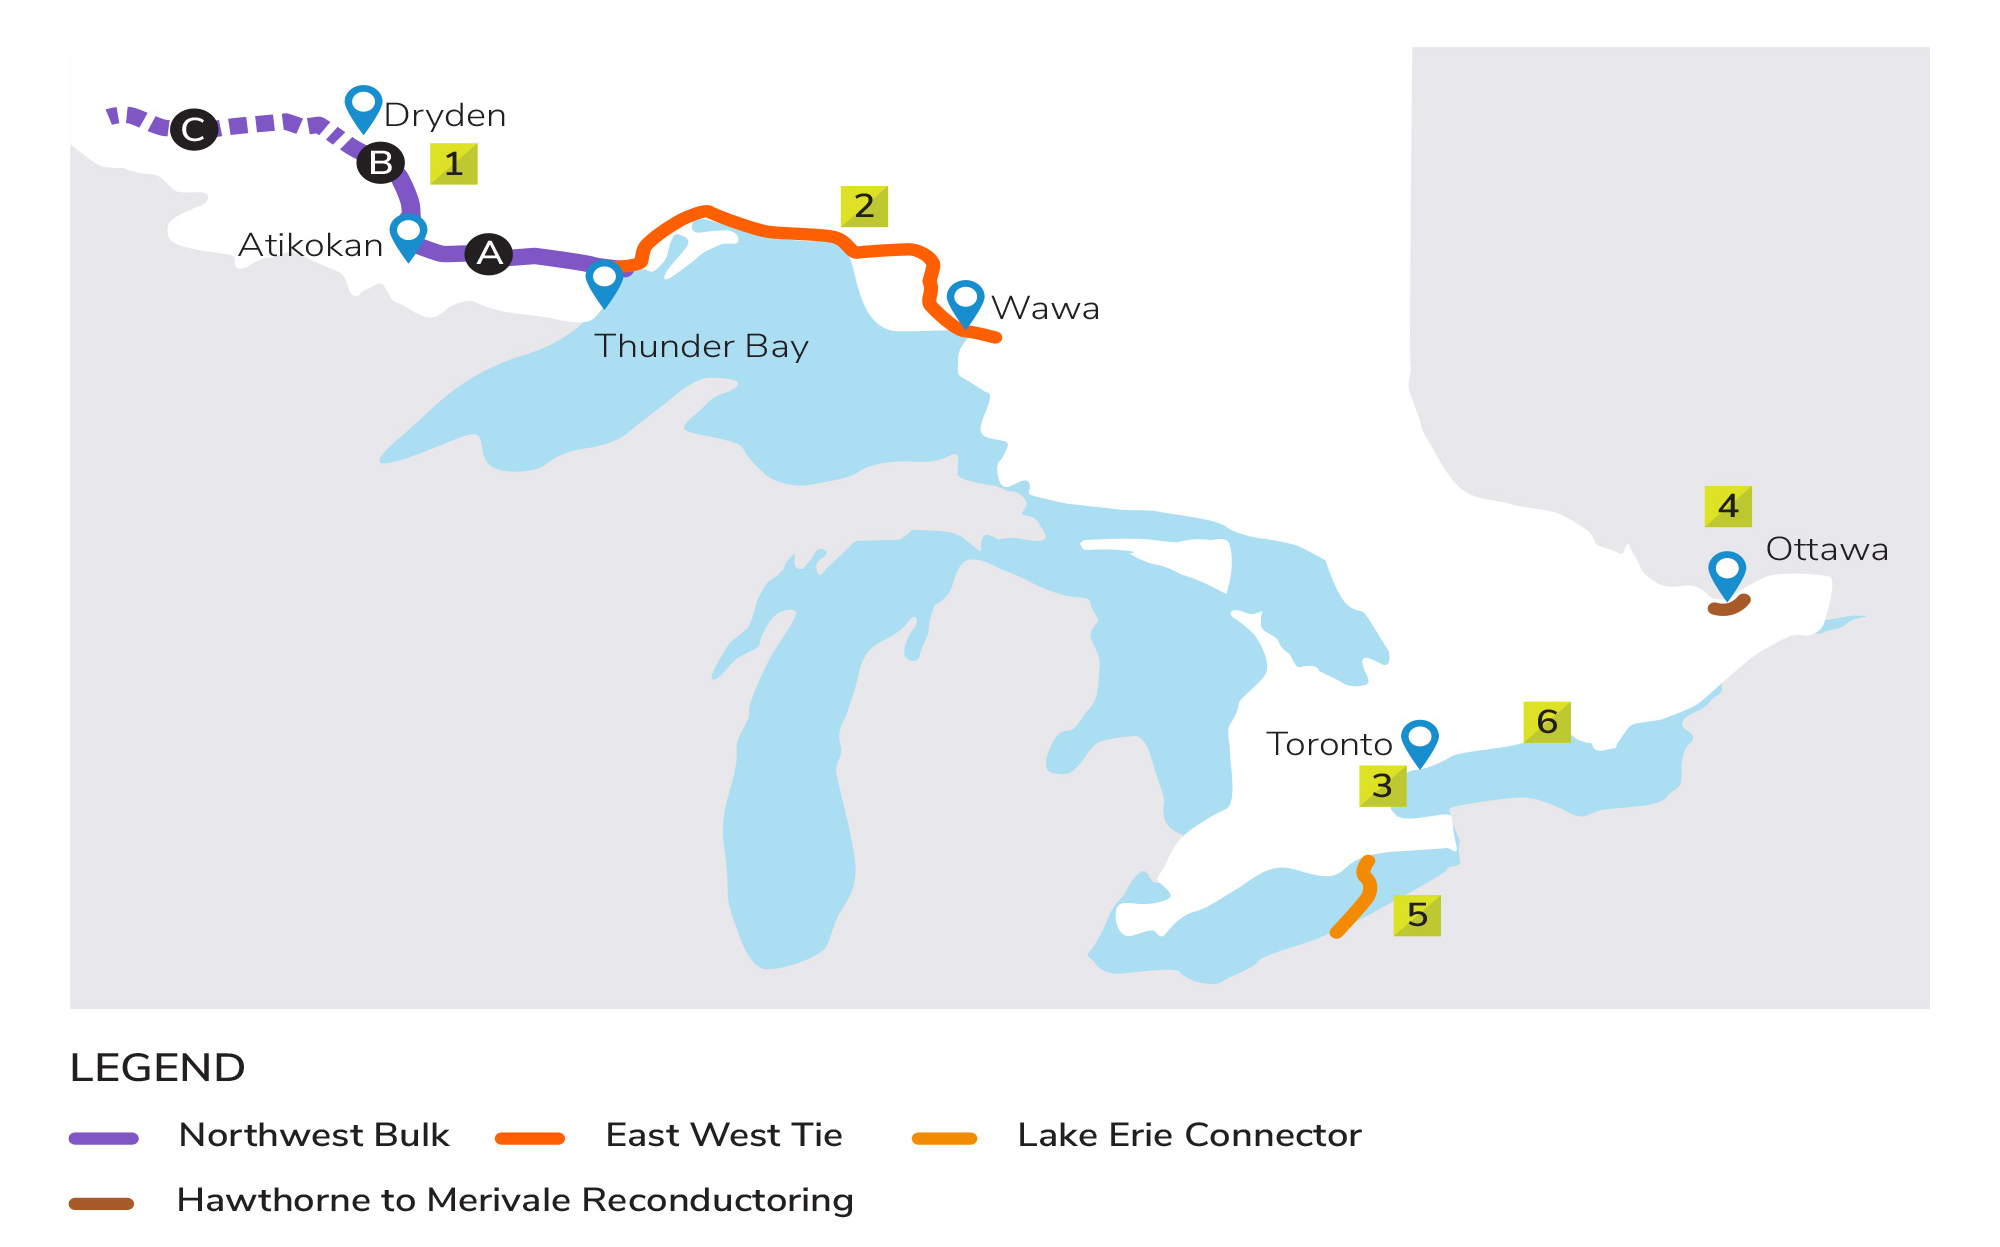
Note: All projects are subject to regulatory approvals.
All projects are subject to regulatory approvals.
- Northwest Bulk transmission line
The Northwest Bulk line is needed to support growth and maintain a reliable electricity supply to areas west of Atikokan and north of Dryden. The project will proceed in phases:
- Phase One, a line from Thunder Bay to Atikokan, should come into service as soon as is practical, and no later than 2024.
- Phase Two, a line from Atikokan to Dryden, should come into service by 2034 unless the IESO's outlook on the demand forecast suggests an earlier date.
- Phase Three, a line from Dryden to the Manitoba border, could be needed after 2035 (or earlier if recommended by the IESO) to enable the better integration of provincial electricity grids.
Development work for Phases One and Two will proceed at the same time.
- East-west tie transmission line
The East-West Tie Line would provide a long-term, reliable supply of electricity to meet the growth in demand and changes to the supply mix in Northwest Ontario. As the project has moved through development, estimates on its total cost have increased. This is a concern, as Ontario is focused on making the electricity system more cost-effective. The government will review all options to protect ratepayers as the project continues to be developed.
- Greater Toronto Area West Bulk reinforcement
Growth in demand, the eventual retirement of the Pickering Nuclear Generating Station and new renewable generation all impact the bulk transmission system in the western section of the Greater Toronto Area (GTA). The IESO is presently studying the need for and timing of reinforcements to the transmission system in the region. Transmission solutions being investigated include building new transmission lines along the existing Parkway Belt West transmission corridor (between Milton Switching Station to Hurontario Switching Station) and expanding station facilities at the existing Milton switching station.
- Hawthorne to Merivale
The 230 kV circuits between the Hawthorne and Merivale transformer stations require upgrades to their capability to serve growth in western Ottawa and optimize the use of its interties with Québec. This project is being developed by Hydro One and is expected to be in service in 2020.
- Lake Erie connector
ITC Lake Erie Connector LLC is proposing to build a 1,000 MW High Voltage Direct Current transmission cable under Lake Erie, running from Nanticoke, Ontario to Erie County, Pennsylvania. The two-way line would provide the first direct link between Ontario electricity markets and markets in 13 states in the Eastern U.S. The generators and electricity traders who would transmit electricity and related products over the line would pay the entire cost of the project. Under this merchant funding model, the costs of the project would not impact the transmission rates paid by Ontario ratepayers.
- Clarington transformer station
To meet the needs of the growing eastern GTA and prepare for the eventual retirement of Pickering Nuclear Generating Station, Hydro One is building the Clarington Transformer Station in the Municipality of Clarington. Hydro One expects to bring the station into service in 2018.
Fuels supply and demand
Fuels are an important component of the province’s economy, and are critical for households, businesses and industry. Ontario’s fuels sector is multi-faceted in its sources and uses. Natural gas and transportation fuels, such as gasoline and diesel, make up the majority of Ontario’s fuels supply. There are also a variety of other fuels such as propane, wood, aviation fuel and biofuels.
Figure 10: Historical fuels energy use
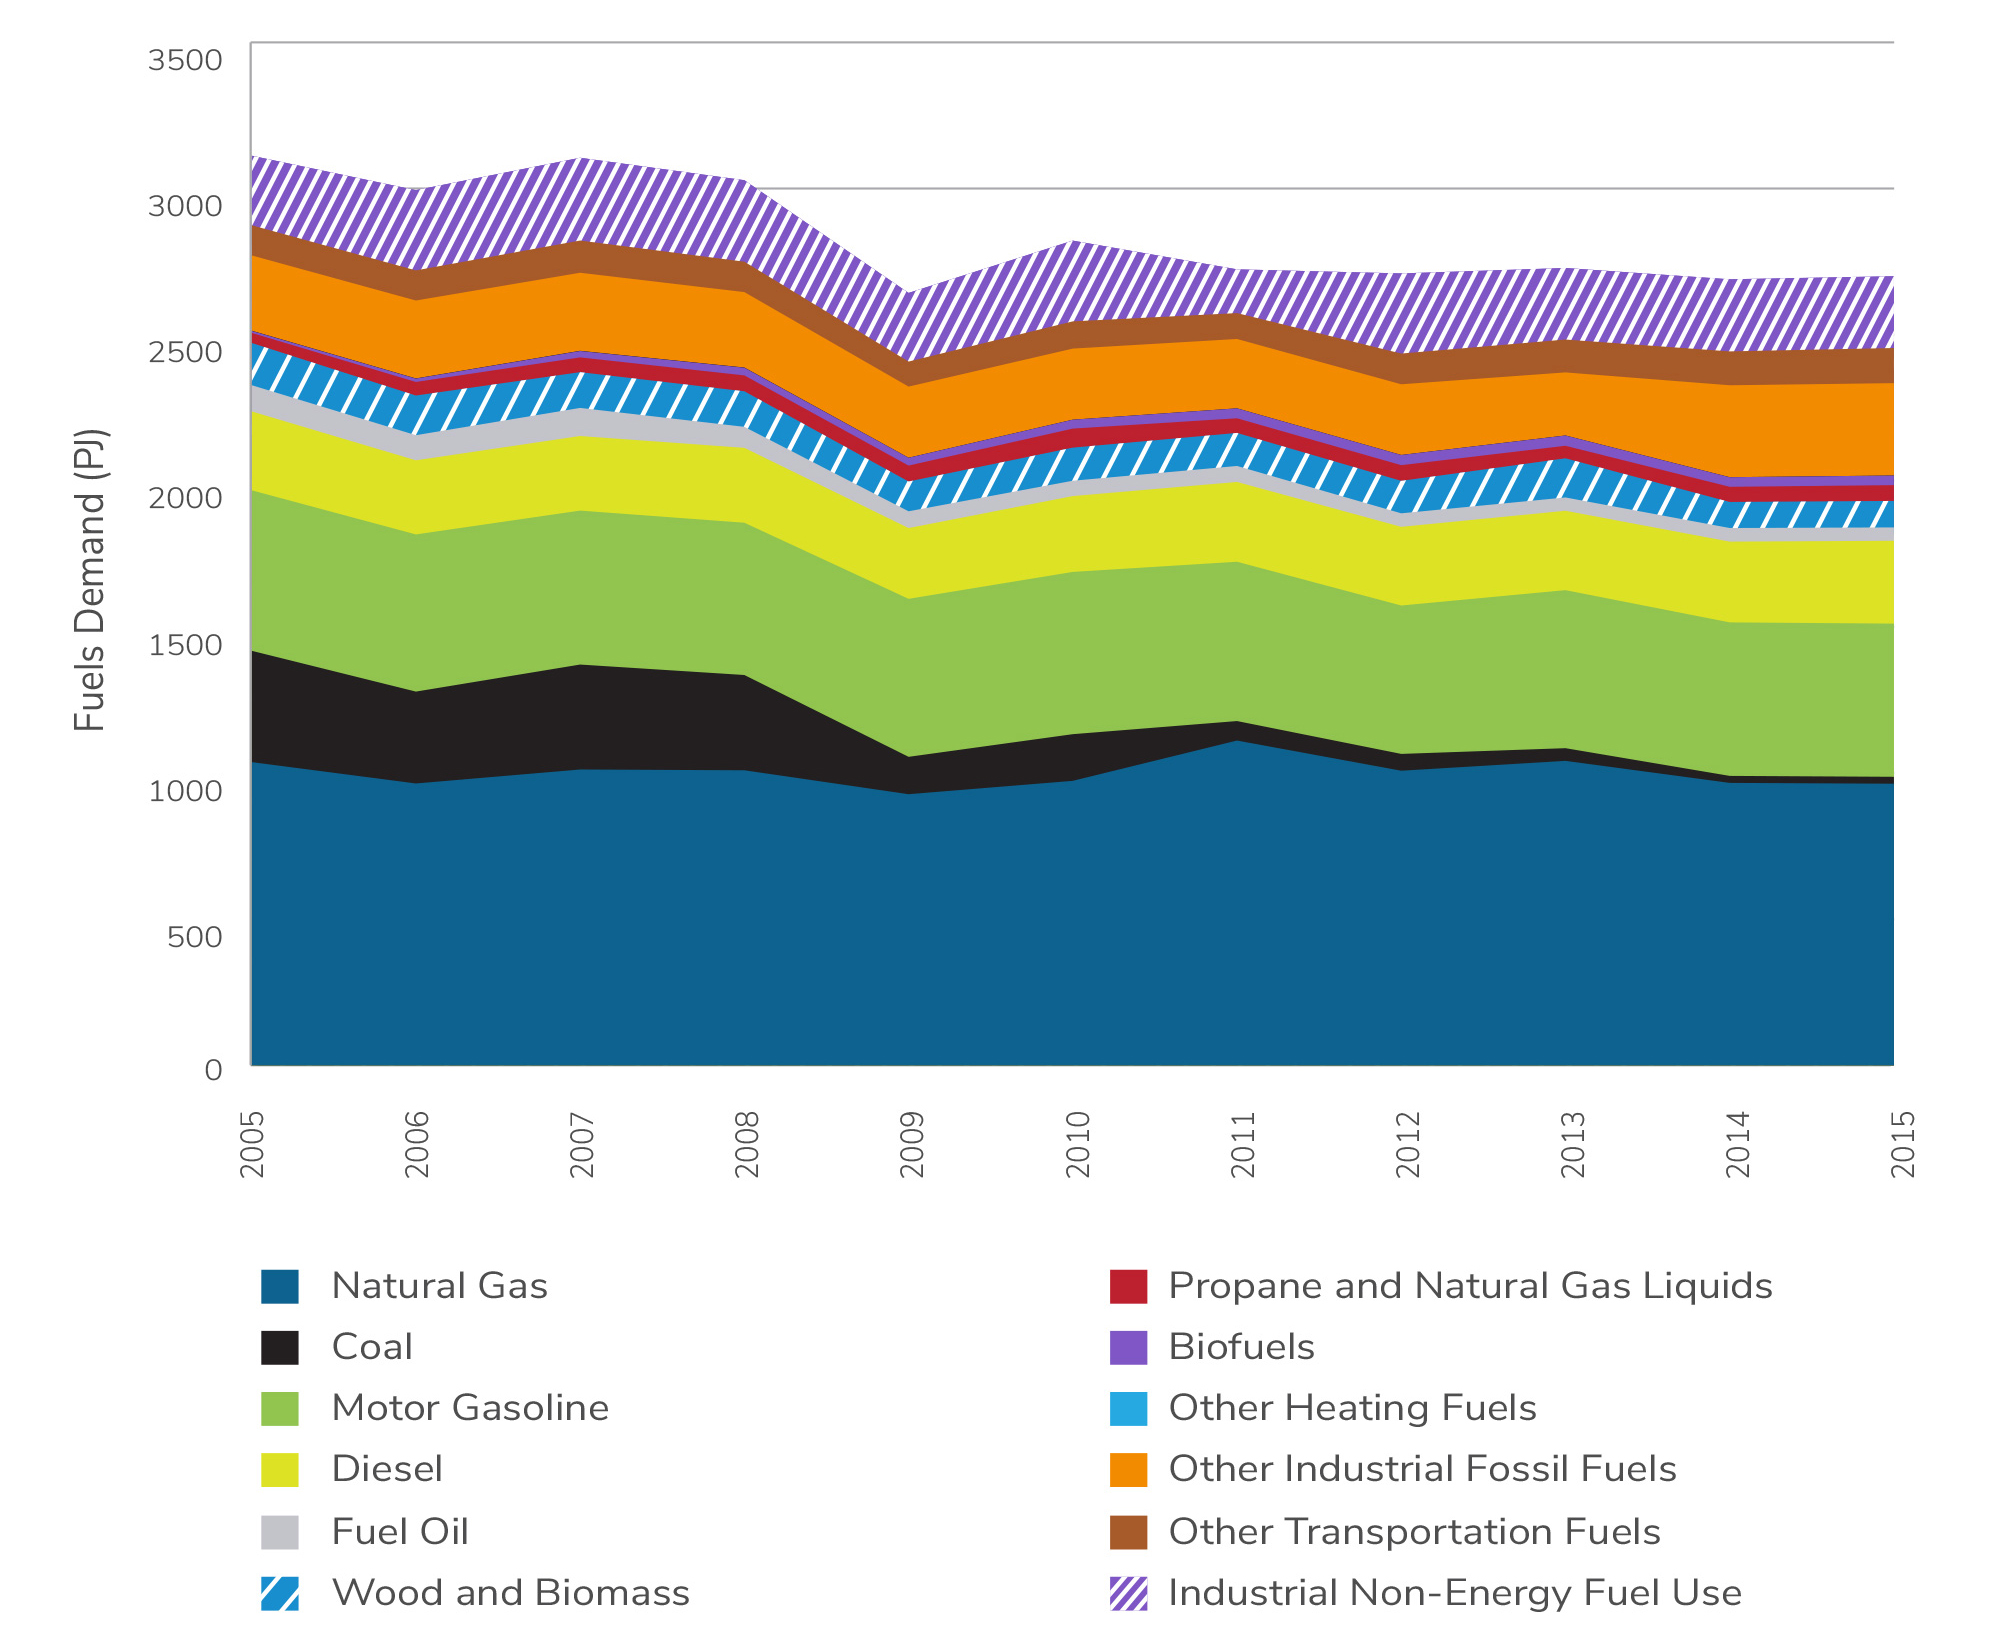
Source: Fuels Technical Report, 2016
Fuels consumption has generally declined between 2005 and 2015, largely due to the retirement of coal-fired generating stations. In the past few years, fuels consumption has been relatively flat with lower use of natural gas being offset by higher use of transportation fuels. About 10 per cent of Ontario’s fuels are used for non-energy uses such as feedstock for manufacturing.
Ontario’s fuel supply is produced and delivered through a variety of means and markets, including supplies of crude oil and natural gas from outside of the province such as our supply of crude oil and natural gas. As such, the government does not have the same policy and planning functions as it does for electricity.
Nonetheless, Ontario’s cap and trade program provides efficient, market-based incentives to transition from conventional fuels to renewable and lower-carbon sources. In addition, programs and initiatives in the Climate Change Action Plan and delivered by the Green Ontario Fund will further support efforts to decarbonize the fuels sector. Over the next 20 years, the electrification of transportation, enhanced conservation and switching to lower-carbon fuels are expected to transform the fuels sector. As a result, both the demand for fuels and the emissions they release are expected to decline.
The outlook for the supply and demand of fuels will depend on policy and program decisions over the next 20 years, as well as on technological innovation and adoption. Given these uncertainties, the government will continue to undertake modelling and analysis to identify opportunities to decarbonize the fuels sector consistent with the provincial target of reducing GHG emissions by 37 per cent from 1990 levels in 2030.
The influence of the carbon market
On January 1, 2017, the Province implemented a cap and trade program. This program is a flexible, market-based program that will be a cornerstone in Ontario’s fight against climate change, and is the most cost-effective way of achieving reductions in GHG emissions. In addition, all proceeds from the cap and trade program will be used to fund actions to reduce GHG emissions, such as supporting Ontarians in shifting away from fossil fuels and investing in emerging clean technologies.
The price of fossil fuels such as natural gas, gasoline, diesel and propane includes a carbon cost as a result of the cap and trade program. The price signal provided by the cap and trade program will help move the province’s energy system to even cleaner sources.
The costs that regulated natural gas utilities incur when they comply with cap and trade, including the cost of acquiring emission allowances, are subject to approval by the OEB. These costs are included in the rates charged to consumers. Natural gas utilities whose rates are not regulated by the OEB and large facilities that must independently comply with cap and trade will decide on their own how to manage their compliance costs. Alternative fuels that do not incur cap and trade charges - like renewable natural gas - could be used to reduce emissions and mitigate cap and trade costs in the natural gas sector.
Suppliers of other fuels in Ontario, such as gasoline, diesel and propane, operate in a competitive market. They are responsible for complying with cap and trade regulations and are expected to pass through their compliance costs to retail consumers. Switching to renewable fuels like ethanol, bio-based diesel and renewable diesel, and to lower-carbon transportation fuels such as natural gas are ways for consumers and obligated parties to reduce emissions and lower their cap and trade costs.
Maximizing existing assets
Delivering Fairness and Choice aims to limit any future cost increases for electricity consumers by maximizing the use of the province’s existing energy assets. This can be achieved because many of the electricity generation facilities built in the last decade-and-a-half will be able to generate power beyond their planned contract life.
Renewable energy
Contracts for over 4,800 MW of wind energy, 2,100 MW of solar energy, and 1,200 MW of hydroelectric generation will expire between 2026 and 2035, with most expiring after 2030. While wind and solar contracts last for 20 years and hydroelectric contracts for 40 years, wind turbines and photovoltaic panels are often able to still generate electricity after their contracts expire, and we know from experience that hydroelectric facilities can operate for as long as a century.
Due to the substantial decline in the cost of wind and solar technologies over the last decade, renewables are increasingly competitive with conventional energy sources and will continue to play a key role in helping Ontario meet its climate change goals.
In many cases, the province’s wind and solar energy facilities can be upgraded with new or more efficient technology so they can continue operating, increase their output and provide additional system benefits.
There is an opportunity to get more from existing waterpower assets, including increasing their operational flexibility. The performance of older hydroelectric projects can be improved by using new, more efficient turbines. With the growing need for flexibility in our electricity system, Ontario’s pumped storage potential could also play an important role in the provision of services that ensure the electricity system operates reliably.
As part of the IESO's ongoing work to find efficiencies and the best value for ratepayers, maximizing value from existing assets is key for Market Renewal, which will provide an open platform for project upgrades to participate in meeting Ontario’s future resource adequacy.
Natural gas
The natural gas generating stations that produce electricity in Ontario can respond quickly to match any changes in demand. The province relies on these generators to meet its needs during the periods of highest demand, including hot summer days and cold winter nights. Natural gas can also be used to ensure the reliability of the power supply when other generators are unavailable or require maintenance.
Most of Ontario’s natural gas generating stations could operate beyond the life of their contracts. This will be important over the coming decade during ongoing nuclear refurbishments and with the retirement of the Pickering Nuclear Generating Station in 2024. In the early-to-mid 2020s, it is forecasted that there will no longer be enough contracted and rate-regulated facilities to meet reliability requirements.
Many of the existing generation contracts will expire over the same time frame. These natural gas facilities could continue to be available during times of peak demand by participating in a capacity auction being considered under Market Renewal, but only if they are more competitive relative to other resources.
Nuclear
Refurbishing nuclear
The most cost-effective option for producing the baseload generation the province needs while releasing no GHG emissions is to refurbish Ontario’s nuclear generating stations. Ontario is moving forward with the plans laid out in the 2013 LTEP to refurbish a total of ten nuclear units between 2016 and 2033 - four units at Darlington and six units at Bruce.
The Darlington Nuclear Generating Station, in the Municipality of Clarington, and the Bruce Nuclear Generating Station, in the Municipality of Kincardine, are two of the world’s best-performing nuclear power plants. Together, Darlington and Bruce provide around 50 per cent of the province’s electricity needs.
Refurbishing these 10 units will lock-in more than 9,800 MW of affordable, reliable and emission-free generation capacity for the long-term benefit of Ontario. It will also support the 180 companies and 60,000 jobs that make up Ontario’s globally-recognized nuclear supply chain.
Ontario Power Generation (OPG) is taking a phased approach to refurbishing the Darlington Nuclear Generating Station. This approach benefits from the lessons learned during previous refurbishment projects, which highlighted the need for in-depth planning and preparation prior to starting the work.
In November 2015, OPG's Board of Directors approved a total estimated cost of $12.8 billion for refurbishing all four Darlington units. This includes all spending to date, interest and inflation, and is $1.2 billion lower than OPG's original estimate in 2009.
In January 2016, the government gave OPG approval to proceed with refurbishing the first of the Darlington units. In April 2017, OPG announced it had successfully completed the first of four major phases in refurbishing Unit 2 and isolated the unit from the rest of the Darlington plant. OPG has now moved on to the next phase of work and is on track to complete the entire project on budget and on schedule.
The refurbishment and continued operation of Darlington is expected to contribute a total of $90 billion to Ontario’s gross domestic product and increase employment by an average of 14,200 jobs annually.
In December 2015, the IESO updated its contract with Bruce Power for the refurbishment of six nuclear units at the Bruce Nuclear Generating Station. Bruce Power plans to invest approximately $13 billion of its own funds in the project. Ontario further adjusted the schedule for refurbishment to get the most value out of the existing nuclear units. The new schedule will see construction start in 2020, instead of the previously-estimated start date of 2016. This updated agreement saved $1.7 billion for electricity customers, compared to the cost forecast in the 2013 LTEP.
Figure 11: Nuclear refurbishment schedule
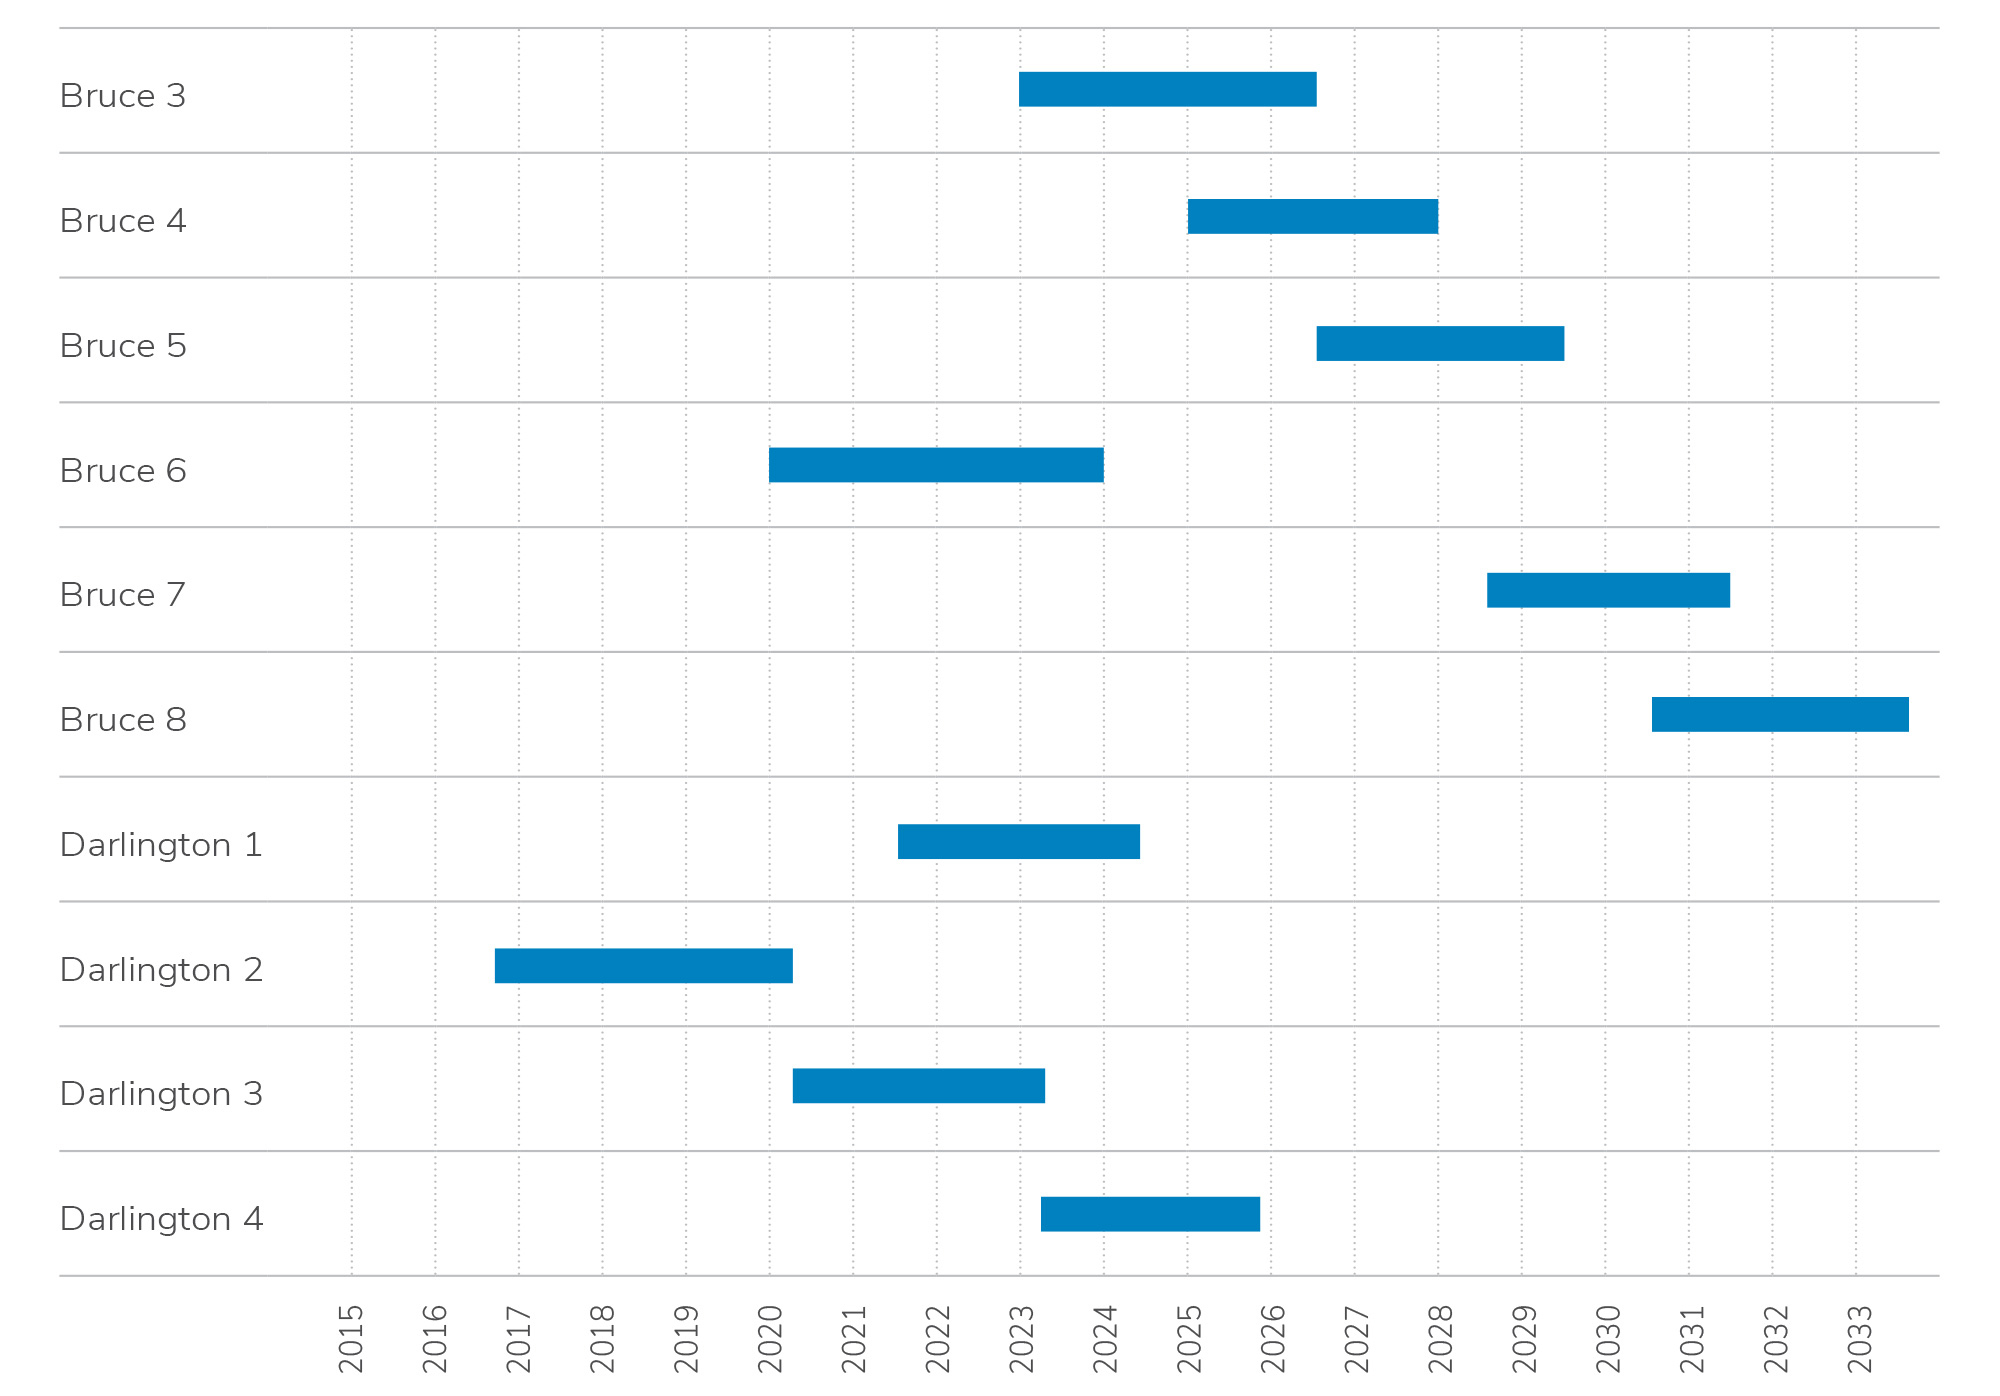
Source: IESO
Bruce Power is currently undertaking a number of activities in support of the Bruce refurbishments and their long-term operation, including:
- Implementing an asset management program to optimize the life of the Bruce units before and after refurbishment;
- Developing a final cost estimate for refurbishing the first unit, Unit 6;
- Executing contracts with suppliers across Ontario, including BWXT Canada and SNC-Lavalin; and
- Developing a regional network of suppliers to benefit local communities in the Bruce region.
The refurbishment and long-term operation of Bruce are expected to generate up to $4 billion in economic benefits annually and increase employment by up to 22,000 jobs.
Managing the risks
One of the principles of the 2013 LTEP was to include potential off-ramps for nuclear refurbishment. Off-ramps ensure that refurbishments only proceed if they continue to deliver value for ratepayers.
The Province has established off-ramps for the Darlington refurbishment that may be used in the event of OPG failing to adhere to the approved costs and schedule. This could result in the Province not proceeding with the remaining units.
Ontario’s contract with the privately-owned Bruce Power also includes strong protection from cost overruns with the refurbishments. For example, Bruce Power is paying for approximately $2 billion in cost overruns that occurred when two of the Bruce units were refurbished and restarted in 2012.
Under its recently updated agreement with the IESO, Bruce Power will be assuming the risk of any cost overruns during the execution of the refurbishment of each of the six remaining Bruce units. Contractual off-ramps allow Ontario to stop work on any Bruce refurbishment if the estimated cost exceeds a pre-defined amount. Refurbishment at Bruce can also be stopped if demand drops or lower-cost resources emerge.
Ontario is protecting ratepayers by strictly controlling the cost and timetable of refurbishments. There is strict oversight of OPG and Bruce Power to ensure that they complete the refurbishments on time and on budget.
In addition to OPG's oversight of the Darlington refurbishment, the government has its own independent advisor to ensure that it has continued and effective oversight. All of OPG's expenditures on nuclear refurbishment will also be reviewed by the OEB as part of its rate-setting process.
The government subjected the updated agreement with Bruce to extensive due diligence, as did the financial and technical advisors who were engaged by the IESO when it negotiated the contract.
The IESO will continue to manage the Bruce contract and closely scrutinize the basis for costs underlying the refurbishment and ongoing operation of the Bruce reactors. It has full-time representatives on-site and will regularly report back to the Province.
Pickering nuclear generating station
OPG is working on plans to continue to operate the Pickering Nuclear Generating Station until 2024. The continued operation of Pickering will ensure Ontario has a reliable source of emission-free baseload electricity to replace the power that will not be available during the Darlington and initial Bruce refurbishments. The continued operation of Pickering would also reduce the use of natural gas to generate electricity, saving up to $600 million for electricity consumers and reducing GHG emissions by at least eight million tonnes.
The Province announced in January 2016 that it had approved OPG's plan to ask the OEB and the Canadian Nuclear Safety Commission (CNSC) to approve the continued operation of Pickering until 2024. The OEB will ensure that the costs of OPG's plan for continued Pickering operation are prudent, while the CNSC will ensure that Pickering operates safely during this period. OPG will still need to get final approval from the government to proceed with the continued operation of Pickering after these regulatory reviews are completed. OPG will also update the government on the safety and operational performance of Pickering as part of its regular reporting and business planning.
Summary
- Market Renewal will transform Ontario’s wholesale electricity markets and ultimately result in a more competitive and flexible marketplace. This Market Renewal process will develop a "made in Ontario" solution, taking lessons learned from other jurisdictions while collaborating with domestic market participants and taking into account the Province’s greenhouse gas emission reduction targets.
- Ontario’s cap and trade program, as well as programs and initiatives in the Climate Change Action Plan will support efforts to decarbonize the fuels sector.
- Delivering Fairness and Choice aims to maximize the use of Ontario’s existing energy assets in order to limit any future cost increases for electricity consumers.
- Cap and trade will increase the price of fossil fuels and affect how often fossil-fueled generators get called on to meet the province’s electricity demand. This will help reduce the province’s greenhouse gas emissions and shift Ontario towards a low-carbon economy.
- The government will direct the Independent Electricity System Operator to establish a formal process for planning the future of the integrated provincewide bulk system.
- Ontario will continue to exercise strict oversight of nuclear refurbishments and ensure they provide value for ratepayers.
Accessible descriptions
Figure 7: Ontario’s electricity generation and conservation, 2016 (TWh)
Figure 7 is a pie chart that reflects how many terawatt hours were generated and avoided due to conservation in 2016.
The pie chart is separated into eight pieces. Seven of the pieces are for generation sources, including nuclear, hydro, natural gas, wind, solar, biomass and other. The eighth piece is for conservation.
Generation reflects the sum of transmission- and distribution-connected resources. The conservation value represents persistent savings in 2016 from programs and codes and standards since 2006.
The pie chart shows that nuclear generation contributed 53.5 per cent of all supply in Ontario in 2016. The next largest contributor was hydro at 21.3 per cent, followed by natural gas at 7.5 per cent. Wind contributed 6.2 per cent, while solar contributed 2 per cent.
Conservation efforts totalled 14.7 terawatt hours in 2016, or 8.6 per cent of the overall generation and conservation mix. Conservation is included in the pie chart for comparative purposes, to show the amount of generation that is expected to be avoided as a result of conservation.
| Source | Electricity generation and conservation (TWh) |
|---|---|
| Nuclear | 91.7 |
| Water | 36.5 |
| Natural gas | 12.8 |
| Wind | 10.7 |
| Solar | 3.5 |
| Biomass | 0.7 |
| Other | 0.7 |
| Conservation | 14.7 |
Figure 8: Supply and demand outlook (2017-2035)
Figure 8 is a combination line and bar chart that plots Ontario’s electricity demand outlook as a line, and plots capacity contribution at summer peak as a stacked column. The vertical axis is labelled “Capacity Contribution at Summer Peak,” and is numbered from 0 to 35,000 in increments of 5,000. The units of measurement for the vertical axis are megawatts. The horizontal axis lists the years for the outlook period, from 2017 to 2035.
The demand line shows that the demand for electricity is forecast to be relatively steady over the planning period. Demand is expected to stay within the range of 28,373 megawatts to around 30,500 megawatts.
The supply of capacity contribution at summer peak is depicted as stacked columns for the outlook period of 2017 to 2035. The supply is a combination of existing capacity, committed but not yet-in service capacity, and directed procurements. Expiring contracts are also stacked on top to indicate how many megawatts of contracts are due to expire in a given year.
There is a need for capacity beginning in the early-to-mid 2020s.
Note: Figure 8 shows capacity contribution at summer peak (supply) relative to total resource requirements (demand).
| Year | Existing capacity | Committed, not yet in-service | Directed procurements | Expired contracts | Demand outlook |
|---|---|---|---|---|---|
| 2017 | 29,059 | 101 | 17 | 143 | 28,373 |
| 2018 | 28,994 | 611 | 218 | 143 | 29,172 |
| 2019 | 28,784 | 1,421 | 459 | 194 | 28,916 |
| 2020 | 26,893 | 2,458 | 459 | 388 | 29,525 |
| 2021 | 26,012 | 2,458 | 459 | 391 | 29,429 |
| 2022 | 25,927 | 2,483 | 459 | 476 | 29,552 |
| 2023 | 21,082 | 3,361 | 459 | 2,621 | 29,320 |
| 2024 | 20,868 | 4,189 | 459 | 3,361 | 28,761 |
| 2025 | 17,500 | 5,069 | 459 | 3,375 | 29,137 |
| 2026 | 16,127 | 6,700 | 459 | 3,926 | 29,272 |
| 2027 | 16,079 | 6,700 | 459 | 3,974 | 29,272 |
| 2028 | 15,234 | 7,450 | 459 | 4,018 | 29,429 |
| 2029 | 12,173 | 8,266 | 459 | 7,082 | 29,535 |
| 2030 | 10,239 | 8,261 | 459 | 8,241 | 29,618 |
| 2031 | 9,369 | 9,078 | 459 | 9,161 | 30,035 |
| 2032 | 8,681 | 9,078 | 459 | 9,767 | 29,915 |
| 2033 | 8,493 | 9,897 | 459 | 9,992 | 30,509 |
| 2034 | 8,091 | 9,896 | 459 | 10,407 | 29,503 |
| 2035 | 7,694 | 9,891 | 459 | 10,784 | 29,758 |
Figure 9: Major transmission projects under development across ontario
Figure 9 is a map of Ontario. Six major transmission projects under development in Ontario are shown. Numbers on the map indicate the location of the project and correspond to the text which provides further information about the project.
Figure 10: Historical fuels energy use
Figure 10 is a stacked bar graph showing fuels use in Ontario for fuels including Natural Gas, Coal, Motor Gasoline, Diesel, Fuel Oil, Wood and Biomass, Propane and Natural Gas Liquids, Biofuels, Other Heating Fuels, Other Industrial Fossil Fuels, Other Transportations Fuels, and Industrial Non-Energy Fuel Use. The vertical axis is labelled Fuels Demand in petajoules and is numbered from 0 to 3500 in increments of 500. The horizontal axis is by year from 2005 to 2015.
Figure 10 illustrates that Ontario’s fuels use has declined from a total of 3,112 petajoules in 2005 to 2,700 petajoules in 2015. The decline is largely due to the retirement of coal-fired generating stations. In the past few years, fuels consumption has been relatively flat with lower use of natural gas being offset by higher use of transportation fuels.
Currently, about one-third of Ontario’s fuel use is from natural gas and one-third from transportation fuels such as gasoline and diesel. About 10 per cent of Ontario’s fuels are used for non-energy uses such as feedstock for manufacturing.
| Year | 2005 | 2006 | 2007 | 2008 | 2009 | 2010 | 2011 | 2012 | 2013 | 2014 | 2015 |
|---|---|---|---|---|---|---|---|---|---|---|---|
| Natural gas | 1,037 | 964 | 1,012 | 1,009 | 927 | 973 | 1,111 | 1,008 | 1,041 | 966 | 963 |
| Coal | 381 | 314 | 359 | 326 | 128 | 160 | 67 | 58 | 43 | 24 | 24 |
| Motor gasoline | 549 | 538 | 527 | 521 | 541 | 555 | 545 | 508 | 541 | 525 | 524 |
| Diesel | 270 | 254 | 255 | 256 | 242 | 260 | 273 | 269 | 272 | 276 | 283 |
| Fuel oil | 90 | 86 | 96 | 72 | 57 | 52 | 55 | 46 | 46 | 47 | 46 |
| Wood and biomass | 144 | 136 | 122 | 122 | 102 | 113 | 113 | 111 | 134 | 89 | 91 |
| Propane and Natural Gas Liquids (NGL) | 34 | 46 | 51 | 54 | 55 | 65 | 50 | 54 | 43 | 52 | 54 |
| Biofuels | 7 | 12 | 22 | 26 | 27 | 31 | 34 | 35 | 35 | 33 | 33 |
| Other heating fuels | 0 | 0 | 1 | 0 | 0 | 0 | 0 | 0 | 0 | 0 | 0 |
| Other industrial fossil fuels | 258 | 267 | 267 | 258 | 243 | 243 | 237 | 242 | 216 | 315 | 316 |
| Other transportation fuels | 103 | 103 | 110 | 104 | 86 | 93 | 89 | 105 | 113 | 116 | 120 |
| Industrial non-energy fuel use | 238 | 275 | 283 | 279 | 235 | 276 | 150 | 274 | 245 | 247 | 246 |
Figure 11: Nuclear refurbishment schedule
Figure 11 is a bar chart. The horizontal axis is labelled years and is numbered from 2015 to 2033. The vertical axis lists ten nuclear reactors, including six Bruce units and four Darlington units, which are expected to undergo refurbishment between 2016 and 2033.
Figure 11 shows a series of blue bars representing the time period during which the respective units are disconnected from the electricity grid for refurbishment. The refurbishments have been staggered to minimize ratepayer impact and maximize project success. Refurbishment activity will peak in the early 2020s with up to four units undergoing refurbishment at the same time.
| Unit | Refurbishment outage start | Refurbishment outage end |
|---|---|---|
| Bruce 3 | Jan-23 | Jun-26 |
| Bruce 4 | Jan-25 | Dec-27 |
| Bruce 5 | Jul-26 | Jun-29 |
| Bruce 6 | Jan-20 | Dec-23 |
| Bruce 7 | Jul-28 | Jun-31 |
| Bruce 8 | Jul-30 | Jun-33 |
| Darlington 1 | Jun-21 | May-24 |
| Darlington 2 | Oct-16 | Feb-20 |
| Darlington 3 | Feb-20 | Feb-23 |
| Darlington 4 | Feb-23 | Dec-25 |