10-year trends and annual results
Concentrations of air contaminants measured at the ministry’s Air Quality Health Index monitoring stations are generally representative of ambient air quality which reflects the contribution of all sources of air contaminants to air. These air monitoring stations are sited to be representative of general population exposure and thus do not necessarily reflect air quality at locations within a community that may be influenced by nearby local sources of air contaminants such as large industrial facilities or major transportation corridors. Concentrations of some air contaminants in neighborhoods located in close proximity to local sources such as an industrial facility may be higher than those measured at the Ministry’s Air Quality Health Index monitoring stations.
This section presents the 10-year trends and annual results for concentrations of key air contaminants listed below including volatile organic compounds such as benzene, toluene, ethylbenzene, xylene (BTEX) and 1,3-butadiene as measured at the Ministry’s Air Quality Health Index air monitoring stations. Emission trends for these key air contaminants from major emissions sources in Ontario such as industry, electricity utilities, transportation, and residential properties are also provided.
Nitrogen dioxide
Highlights
10-year trends
- NO2 concentrations have decreased by 28%
- NOx emissions have decreased by 37%
2021 results
- No exceedances of Ontario’s 1-hour and 24-hour Ambient Air Quality Criteria (AAQC) of 200 ppb and 100 ppb, respectively.
10-year trends
Trend of NO2 annual means across Ontario, 2012-2021
This is a line graph showing the trend of nitrogen dioxide annual means from 2012 to 2021. The nitrogen dioxide annual mean concentrations across Ontario have decreased 28% over this 10-year period. To view the data for a specific location, please select the 'Stations' radio button and use the drop-down menu.
Note:
- The Ontario 10-year trend is based on data from 34 ambient air monitoring stations.
- Ontario does not have an annual AAQC for NO2.
- Air quality in Ontario can vary from year to year due to a variety of factors including pollutant emissions, weather, natural events such as forest fires, and the long-range transport of air pollutants from the United States and elsewhere. Long term trends are thus a better reflection of any improvements or a deterioration in air quality over time versus year over year changes.
The 10-year trend for NO2 at individual AQHI air monitoring stations in Ontario is presented in the Appendix: 10-year trend for nitrogen dioxide (NO2).
Ontario NOx emission trend, 2012-2021
This is a stacked column chart displaying the Ontario NOX emissions trend from 2012 to 2021 indicating a decrease of approximately 37% or 108 kilotonnes, of which 73 kilotonnes was due to the road vehicles. Sixteen kilotonnes was due to other transportation (e.g. air, marine, rail transportation, and non-road vehicles/engines) and 14 kilotonnes was due to the electricity utilities sector. Please note this chart excludes emissions from open and natural sources (Air Pollutant Emission Inventory 1990-2021, 2023). Ontario’s former emissions trading regulations (O. Reg. 397/01 and O. Reg. 194/05) and Drive Clean light duty vehicle program, and the phase-in of more stringent emission and vehicle standards for new vehicles have contributed to the reduction in nitrogen dioxide emissions over time.
2021 results
| Averaging time | Low range | High range | Number of sites with AAQC exceedances |
|---|---|---|---|
| NO2 1-hour max | 17.4 ppb at Grand Bend |
74.2 ppb at Toronto Downtown |
0 |
| NO2 24-hour max | 6.9 ppb at Port Stanley |
40.9 ppb at Hamilton Downtown |
0 |
| NO2 annual mean | 2.2 ppb at Port Stanley |
12.9 ppb at Toronto West |
Not applicable |
The highest NO2 means were recorded in large, urbanized areas which are influenced by significant vehicular traffic, such as the Greater Toronto Area of southern Ontario.
A summary of the 2021 NO2 annual statistics for individual AQHI air monitoring stations is detailed in the Appendix: 2021 nitrogen dioxide (NO2) annual statistics.
Ontario NOx emissions by sector, 2021
Other transportation
Road vehicles
Miscellaneous/Residential
Other industrial sources
Cement and concrete
Smelters/Primary metals
Electricity utilities
This is a chart depicting Ontario’s NOX emissions by sector based on 2021 estimates for point/area/transportation sources. Please note this chart excludes emissions from open and natural sources (Air Pollutant Emission Inventory 1990-2021, 2023).
The transportation sector accounted for approximately 56% of total NOx emissions in 2021.
Fine particulate matter
Highlights
10-year trends
- PM2.5 concentrations have decreased by 18%
- PM2.5 emissions have decreased by 12%
2021 results
- 32 AQHI air monitoring stations measured above the 24-hour PM2.5 Ambient Air Quality Criteria (AAQC) of 27 µg/m3 on at least one occasion.
- 2 AQHI air monitoring stations measured above the annual Ambient Air Quality Criteria (AAQC) of 8.8 µg/m3.
10-year trends
Trend of PM2.5 annual means across Ontario, 2012-2021
This is a line graph showing the trend of fine particulate matter annual means from 2012 to 2021. The fine particulate matter annual mean concentrations across Ontario have decreased 18% over this 10-year period. To view the data for a specific location, please select the 'Stations' radio button and use the drop-down menu.
Note:
- The Ontario 10-year trend is based on data from 38 ambient air monitoring stations.
- A correction factor was applied to PM2.5 concentrations measured by TEOM (2012) to approximate SHARP-like measurements. PM2.5 concentrations measured by SHARP are reflected from 2013 and onward.
- The Ontario annual AAQC for PM2.5 of 8.8 µg/m3 was introduced in 2020.
- Air quality in Ontario can vary from year to year due to a variety of factors including pollutant emissions, weather, natural events such as forest fires, and the long-range transport of air pollutants from the United States and elsewhere. Long term trends are thus a better reflection of any improvements or a deterioration in air quality over time versus year over year changes.
The 10-year trend for PM2.5 at individual AQHI air monitoring stations in Ontario is presented in the Appendix: 10-year trend for fine particulate matter (PM2.5).
Ontario PM2.5 emissions trend, 2012-2021
This is a stacked column chart displaying the Ontario PM2.5 emissions trend from 2012 to 2021 indicating a decrease of approximately 12% or six kilotonnes, of which four kilotonnes was due to the transportation sector (e.g. road vehicles, air, marine, rail transportation, and non-road vehicles/engines) and two kilotonnes was contributed by various industries. Please note this chart excludes emissions from open and natural sources (Air Pollutant Emission Inventory 1990-2021, 2023).
The phase-in of more stringent emission and vehicle standards for new vehicles, Ontario’s closure of coal burning electricity generating utilities, and reduced emissions from industrial processes have contributed to the reduction in PM2.5 emissions in Ontario.
2021 results
| Averaging time | Low range | High range | Number of sites with AAQC exceedances |
|---|---|---|---|
| PM2.5 1-hour max | 41 µg/m3 at Tiverton and Petawawa |
170 µg/m3 at Toronto Downtown |
Not applicable |
| PM2.5 24-hour max | 22.8 µg/m3 at Chatham |
58.7 µg/m3 at Toronto Downtown |
32 |
| PM2.5 annual mean | 4.3 µg/m3 at Petawawa |
9.6 µg/m3 at Windsor West |
2 |
A summary of the 2021 PM2.5 annual statistics for individual AQHI air monitoring stations is detailed in the Appendix: 2021 fine particulate matter (PM2.5) annual statistics.
Wildfire smoke events in Ontario, 2021
Wildfire season typically occurs from early April to late October in Ontario. As wildfires burn through forests and grasslands, they produce dense smoke. It is difficult to predict when the fires will occur, how big they will be, how much smoke they will generate and what direction the smoke will travel. Wildfire smoke may be carried hundreds or thousands of kilometres from the fire zone (Environment and Climate Change Canada, 2023).
In 2021, Ontario experienced several wildfire smoke events, including one particular event that caused widespread, elevated PM2.5 concentrations across the province on July 19, 2021. Smoke from active forest fires burning in eastern Manitoba and northwestern Ontario travelled through southern Ontario and caused deteriorating air quality and reduced visibility as the smoke descended to the ground-level. Hazy skies were obvious in some communities as smoke drifted across regions.
Forest fire smoke event on July 19, 2021
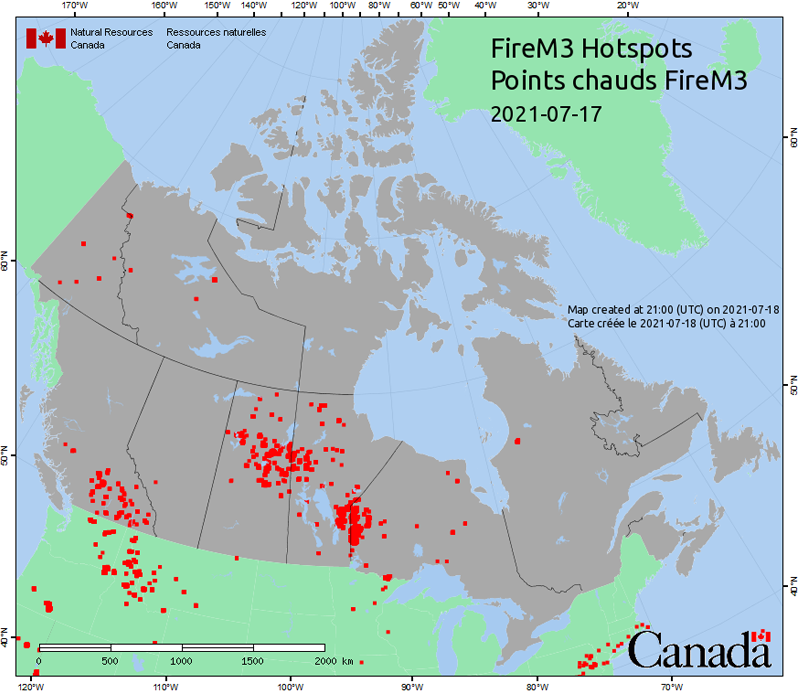
This map dated July 17, 2021, is a satellite image indicating heat sources from vegetation fires (e.g., forest, grass, cropland, or logging debris), across Canada, including the areas of eastern Manitoba and northwestern Ontario (Natural Resources Canada, 2021).
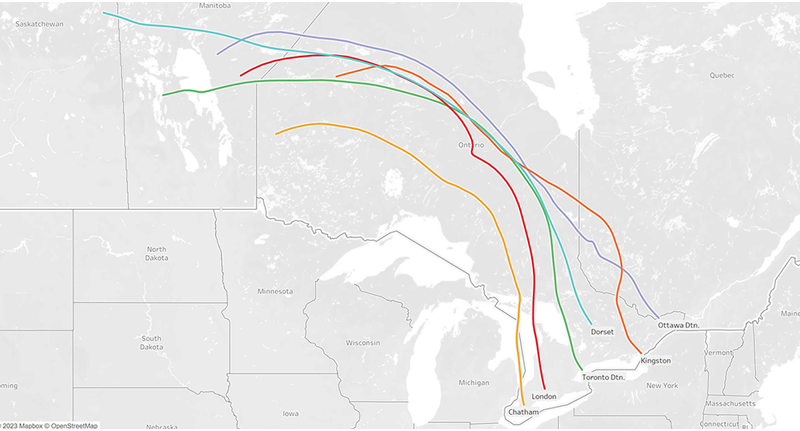
This map is a 72-hour back trajectory analysis at a height of 1000 metres which determines the origin of air masses by modelling the path of an air parcel backward in time (National Oceanic and Atmospheric Administration, 2021). The back trajectories show that air parcels that arrived in southern Ontario on July 19, 2021, originated from areas where forest fires were occurring in eastern Manitoba and northwestern Ontario.
The smoke plumes from the active fires prompted the issuance of a Special Air Quality Statement (SAQS) for most of the province. On July 19, 2021, the Toronto Downtown AQHI air monitoring station reported both the highest 1-hour and 24-hour PM2.5 concentration of 170 µg/m3 and 58.7 µg/m3, respectively. Twenty-four AQHI air monitoring stations, including Toronto Downtown, exceeded the PM2.5 24-hour AAQC of 27 µg/m3 on July 19 due to the forest fire smoke. On July 20, a cold front moved across the province and increased winds allowed for good mixing and dispersion of pollutants, and improved air quality.
Ontario PM2.5 emissions by sector, 2021
Residential
Miscellaneous
Other industrial sources
Smelters/Primary metals
Other transportation
Cement and concrete
Road vehicles
This is a chart depicting Ontario’s PM2.5 emissions by sector based on 2021 estimates for point/area/transportation sources. Please note this chart excludes emissions from open and natural sources, such as forest fires (Air Pollutant Emission Inventory 1990-2021, 2023).
Residential fuel combustion accounted for approximately 37% of the total PM2.5 emissions in 2021. The major contributor to residential emissions is fuel wood combustion in fireplaces and wood stoves.
Ground-level ozone
Highlights
10-year trends
- No significant trends in the ozone maximum concentrations
- No significant trends in the annual and seasonal means
2021 results
- 17 AQHI air monitoring stations measured ozone levels above the 1-hour AAQC of 80 ppb on at least one occasion
10-year trends
Trend of ozone maximums across Ontario, 2012-2021
This is a line graph showing the trend of ozone one-hour maximums from 2012 to 2021. There was no significant trend detected for Ontario over this 10-year period. To view the data for a specific location, please select the 'Stations' radio button and use the drop-down menu.
Note:
- The Ontario 10-year trend is based on data from 38 ambient air monitoring stations.
- The Ontario one-hour AAQC for ozone is 80 ppb.
The 10-year trend of one-hour maximum ozone for individual AQHI air monitoring stations in Ontario is presented in the Appendix: 10-year trend for ozone (O3) maximums.
Trend of ozone means across Ontario, 2012-2021
This is a line graph showing the trend of ozone annual, summer and winter means from 2012 to 2021. There were no significant trends detected for Ontario over this 10-year period. To view the data for a specific location, please select the 'Stations' radio button and use the drop-down menu.
Note:
- The Ontario 10-year trend is based on data from 38 ambient air monitoring stations.
- Summer: May - September; Winter: January - April, October - December.
- Ontario does not have an annual or seasonal AAQC for ozone.
- Air quality in Ontario can vary from year to year due to a variety of factors including pollutant emissions, weather, natural events such as forest fires, and the long-range transport of air pollutants from the United States and elsewhere. Long term trends are thus a better reflection of any improvements or a deterioration in air quality over time versus year over year changes.
There has been no significant trend (increasing or decreasing) in annual and seasonal ozone means over the past 10 years.
Ozone levels continue to exceed Ontario’s 1-hour AAQC for ozone during the warmer months and remain a challenge in some areas of the province, such as southwestern Ontario. However, ozone concentrations during the winter months were well below Ontario’s ozone 1-hour AAQC of 80 ppb in 2021.
The 10-year trend of annual, summer and winter ozone for individual AQHI air monitoring stations in Ontario is presented in the Appendix: 10-year trend for ozone (O3), 10-year trend for ozone (O3) summer means, and 10-year trend for ozone (O3) winter means.
Ozone annual means for urban and rural Ontario, 2012-2021
This is a line graph displaying the ozone annual means for urban and rural Ontario from 2012 to 2021.
Note:
- Urban S. are urban areas in southern Ontario - Windsor, London, Hamilton, Toronto.
- Urban N. are urban areas in northern Ontario - Thunder Bay, Sault Ste. Marie, Sudbury, North Bay.
- Rural areas in Ontario - Port Stanley, Tiverton, Parry Sound, Petawawa.
- Ontario does not have an annual AAQC for ozone.
Ozone annual mean concentrations in urban areas in southern Ontario have been more comparable to those of urban areas in northern Ontario in recent years.
Generally, ozone concentrations are higher in rural, transboundary-influenced sites on the northern shore of Lake Erie and the eastern shore of Lake Huron. Ozone concentrations are lower in urban areas because it is depleted (scavenged) by reacting with NO emitted by vehicles and other local combustion sources.
2021 results
| Averaging time | Low range | High range | Number of sites with AAQC exceedances |
|---|---|---|---|
| Ozone 1-hour max | 56 ppb at Sudbury |
104 ppb at Grand Bend |
17 |
| Ozone 24-hour max | 45.2 ppb at Dorset |
64.5 ppb at Tiverton |
Not applicable |
| Ozone annual mean | 22.8 ppb at Toronto West |
32.4 ppb at Tiverton |
Not applicable |
A summary of the 2021 ozone annual statistics for individual AQHI air monitoring stations is detailed in the Appendix: 2021 ozone (O3) annual statistics.
Sulphur dioxide
Highlights
10-year trends
- SO2 concentrations have decreased by 54%
- SO2 emissions have decreased by 62%
2021 results
- Four AQHI air monitoring stations measured sulphur dioxide levels above the 10-minute AAQC of 67 ppb on at least one occasion
- Five AQHI air monitoring stations measured sulphur dioxide levels above the 1-hour AAQC of 40 ppb on at least one occasion
- No exceedances of Ontario’s annual AAQC.
10-year trends
Trend of SO2 annual means across Ontario, 2012-2021
This is a line graph showing the trend of sulphur dioxide annual means from 2012 to 2021. The sulphur dioxide annual mean concentrations across Ontario have decreased 54% over this 10-year period. To view the data for a specific location, please select the 'Stations' radio button and use the drop-down menu.
Note:
- The Ontario 10-year trend is based on data from 10 ambient air monitoring stations.
- The Ontario annual AAQC for SO2 of 4 ppb was introduced in 2018.
- Air quality in Ontario can vary from year to year due to a variety of factors including pollutant emissions, weather, natural events such as forest fires, and the long-range transport of air pollutants from the United States and elsewhere. Long term trends are thus a better reflection of any improvements or a deterioration in air quality over time versus year over year changes.
The 10-year trend for SO2 at individual AQHI air monitoring stations in Ontario is presented in the Appendix: 10-year trend for sulphur dioxide (SO2).
Ontario SO2 emission trend, 2012-2021
This is a stacked column chart displaying the Ontario SO2 emissions trend from 2012 to 2021 indicating a decrease of approximately 62% or 157 kilotonnes, of which 129 kilotonnes was due to the smelter sector and 10 kilotonnes was due to the electricity utilities sector. Please note this chart excludes emissions from open and natural sources (Air Pollutant Emission Inventory 1990-2021, 2023).
Emissions reductions at Ontario smelters through the implementation of site-specific standards under O. Reg. 419/05, Ontario’s closure of coal burning electricity generating utilities, Ontario’s former emissions trading regulations (O. Reg. 397/01 and O. Reg. 194/05), and low sulphur content in transportation fuels have contributed to the reduction in SO2 emissions in Ontario.
2021 results
| Averaging time | Low range | High range | Number of sites with AAQC exceedances |
|---|---|---|---|
| SO2 10-minutes max | 15.4 ppb at Toronto North | 208.6 ppb at Sudbury | 4 |
| SO2 1-hour max | 4.6 ppb at Ottawa Downtown | 117.6 ppb at Hamilton Mountain | 5 |
| SO2 24-hour max | 0.7 ppb at Ottawa Downtown | 33.6 ppb at Hamilton Mountain | Not applicable |
| SO2 annual mean | 0.16 ppb at Ottawa Downtown | 3.82 ppb at Hamilton Downtown | 0 |
Concentrations of sulphur dioxide in neighborhoods that are located in close proximity to local sources such as an industrial facility may be higher than those measured at the ministry’s Air Quality Health Index monitoring stations which are sited to be representative of general population exposure.
A summary of the 2021 SO2 annual statistics for individual AQHI air monitoring stations is detailed in the Appendix: 2021 sulphur dioxide (SO2) annual statistics.
There are local air quality monitoring networks operated by industrial associations in the communities of Hamilton (Hamilton Air Monitoring Network), Sarnia (Clean Air Sarnia and Area) and Sudbury (Greater Sudbury Air Quality) that provide additional air quality information for these communities. These data have not been integrated into this ministry report; however, they are being addressed with regulations which aim to decrease local concentrations of SO2.
Ontario SO2 emissions by sector, 2021
Smelters
Petroleum refineries
Other industrial sources
Iron and steel
Cement and concrete
Miscellaneous/Residential
Transportation
This is a chart depicting Ontario’s sulphur dioxide emissions by sector based on 2021 estimates for point/area/transportation sources. Please note this chart excludes emissions from open and natural sources (Air Pollutant Emission Inventory 1990-2021, 2023).
Smelters in northern Ontario are the major sources of SO2 emissions in Ontario, accounting for approximately 37% of the provincial SO2 emissions
Volatile organic compounds
Volatile organic compounds (VOC) are measured at select ambient air monitoring stations across Ontario as part of a co-operative federal-provincial program under the National Air Pollution Surveillance program.
Note: VOC samples were limited in 2021 as Environment and Climate Change Canada’s laboratories had restrictions due to COVID-19 measures put in place following Public Health guidelines. As a result, only three of six AQHI air monitoring stations were operational for VOC monitoring in 2021.
Highlights
10-year trends
- Benzene concentrations have decreased by 36%
- Toluene concentrations have decreased by 53%
- Ethylbenzene have decreased by 39%
- m- and p-xylene have decreased by 39%
- o-xylene have decreased by 33%
- 1,3-butadiene have decreased by 53%
2021 results
10-year trends
VOCs are measured at six AQHI air monitoring stations (Windsor West, Sarnia, London, Kitchener, Hamilton Downtown, and Newmarket), however only three (Windsor West, Sarnia and Hamilton Downtown) were operational for VOC monitoring in 2021 due to COVID-19 measures put in place following Public Health guidelines.
In 2021, 107 VOCs were analyzed and reported for each sample at each site. For the purposes of this report, commonly detected VOCs (benzene, toluene, ethylbenzene, xylene, and 1,3-butadiene) between 2012 and 2021 are included in this discussion.
Trend of benzene annual means across Ontario, 2012-2021
This is a line graph showing the trend of benzene annual means from 2012 to 2021. The benzene annual mean concentrations across Ontario have decreased 36% over this 10-year period. To view the data for a specific location, please select the 'Stations' radio button and use the drop-down menu.
Note:
- The Ontario 10-year trend is based on data from 6 ambient air monitoring stations.
- The 2021 average is based on 3 ambient air monitoring stations.
- VOC samples were not collected in 2020 as Environment and Climate Change Canada’s laboratories were shut down due to COVID-19 measures put in place following Public Health guidelines.
- The Ontario annual AAQC for benzene of 0.45 µg/m3 was introduced in 2016.
- Air quality in Ontario can vary from year to year due to a variety of factors including pollutant emissions, weather, natural events such as forest fires, and the long-range transport of air pollutants from the United States and elsewhere. Long term trends are thus a better reflection of any improvements or a deterioration in air quality over time versus year over year changes.
Trend of toluene annual means across Ontario, 2012-2021
This is a line graph showing the trend of toluene annual means from 2012 to 2021. The toluene annual mean concentrations across Ontario have decreased 53% over this 10-year period. To view the data for a specific location, please select the 'Stations' radio button and use the drop-down menu.
Note:
- The Ontario 10-year trend is based on data from 6 ambient air monitoring stations.
- The 2021 average is based on 3 ambient air monitoring stations.
- VOC samples were not collected in 2020 as Environment and Climate Change Canada’s laboratories were shut down due to COVID-19 measures put in place following Public Health guidelines.
- Ontario does not have an annual AAQC for toluene.
- Air quality in Ontario can vary from year to year due to a variety of factors including pollutant emissions, weather, natural events such as forest fires, and the long-range transport of air pollutants from the United States and elsewhere. Long term trends are thus a better reflection of any improvements or a deterioration in air quality over time versus year over year changes.
Trend of ethylbenzene annual means across Ontario, 2012-2021
This is a line graph showing the trend of ethylbenzene annual means from 2012 to 2021. The ethylbenzene annual mean concentrations across Ontario have decreased 39% over this 10-year period. To view the data for a specific location, please select the 'Stations' radio button and use the drop-down menu.
Note:
- The Ontario 10-year trend is based on data from 6 ambient air monitoring stations.
- The 2021 average is based on 3 ambient air monitoring stations.
- VOC samples were not collected in 2020 as Environment and Climate Change Canada’s laboratories were shut down due to COVID-19 measures put in place following Public Health guidelines.
- Ontario does not have an annual AAQC for ethylbenzene.
- Air quality in Ontario can vary from year to year due to a variety of factors including pollutant emissions, weather, natural events such as forest fires, and the long-range transport of air pollutants from the United States and elsewhere. Long term trends are thus a better reflection of any improvements or a deterioration in air quality over time versus year over year changes.
Trend of xylene annual means across Ontario, 2012-2021
This is a line graph showing the trend of xylene annual means from 2012 to 2021. The m- and p-xylene and o-xylene annual mean concentrations across Ontario have decreased 39% and 33%, respectively, over this 10-year period. To view the data for a specific location, please select the 'Stations' radio button and use the drop-down menu.
Note:
- The Ontario 10-year trend is based on data from 6 ambient air monitoring stations.
- The 2021 average is based on 3 ambient air monitoring stations.
- VOC samples were not collected in 2020 as Environment and Climate Change Canada’s laboratories were shut down due to COVID-19 measures put in place following Public Health guidelines.
- Ontario does not have an annual AAQC for xylene.
- Air quality in Ontario can vary from year to year due to a variety of factors including pollutant emissions, weather, natural events such as forest fires, and the long-range transport of air pollutants from the United States and elsewhere. Long term trends are thus a better reflection of any improvements or a deterioration in air quality over time versus year over year changes.
Trend of 1,3-butadiene annual means across Ontario, 2012-2021
This is a line graph showing the trend of 1,3-butadiene annual means from 2012 to 2021. The 1,3-butadiene annual mean concentrations across Ontario have decreased 53% over this 10-year period. To view the data for a specific location, please select the 'Stations' radio button and use the drop-down menu.
Note:
- The Ontario 10-year trend is based on data from 6 ambient air monitoring stations.
- The 2021 average is based on 3 ambient air monitoring stations.
- VOC samples were not collected in 2020 as Environment and Climate Change Canada’s laboratories were shut down due to COVID-19 measures put in place following Public Health guidelines.
- The Ontario annual AAQC for 1,3-butadiene is 2.0 µg/m3.
- Air quality in Ontario can vary from year to year due to a variety of factors including pollutant emissions, weather, natural events such as forest fires, and the long-range transport of air pollutants from the United States and elsewhere. Long term trends are thus a better reflection of any improvements or a deterioration in air quality over time versus year over year changes.
The 10-year trend for VOCs at individual AQHI air monitoring stations in Ontario is presented in the Appendix: 10-year trend for benzene, 10-year trend for toluene, 10-year trend for ethylbenzene, 10-year trend for m- and p-xylene, 10-year trend for o-xylene, and 10-year trend for 1,3-butadiene.
Ontario VOC emission trend, 2012-2021
This is a stacked column chart displaying the Ontario VOC emissions trend from 2012 to 2021 indicating a decrease of approximately 25% or 87 kilotonnes, of which 47 kilotonnes was due to the transportation sector and 36 kilotonnes was due to the solvent use, surface coating and printing sectors. Please note this chart excludes emissions from open and natural sources (Air Pollutant Emission Inventory 1990-2021, 2023).
The introduction of more stringent vehicle and engine emission standards for new vehicles, the former Drive Clean light duty vehicle program and various regulations, Canadian Council of Ministers of the Environment VOC emissions guidelines and codes of practice for VOC emitting products and materials have contributed to the reduction in VOC emissions in Ontario.
2021 results
| Averaging time | Low range | High range | Number of sites with AAQC exceedances |
|---|---|---|---|
| Benzene 24-hour max | 1.966 µg/m3 at Sarnia |
3.122 µg/m3 at Hamilton Downtown |
1 |
| Benzene annual mean | 0.527 µg/m3 at Windsor West |
0.613 µg/m3 at Hamilton Downtown |
3 |
| Toluene 24-hour max | 2.854 µg/m3 at Windsor West |
18.517 µg/m3 at Hamilton Downtown |
0 |
| Toluene annual mean | 1.053 µg/m3 at Sarnia |
1.314 µg/m3 at Hamilton Downtown |
Not applicable |
| Ethylbenzene 24-hour max | 1.743 µg/m3 at Sarnia |
3.299 µg/m3 at Windsor West |
0 |
| Ethylbenzene annual mean | 0.172 µg/m3 at Hamilton Downtown |
0.328 µg/m3 at Windsor West |
Not applicable |
| m- and p-xylene 24-hour max | 1.377 µg/m3 at Sarnia |
4.793 µg/m3 at Hamilton Downtown |
Not applicable |
| m- and p-xylene annual mean | 0.319 µg/m3 at Sarnia |
0.619 µg/m3 at Windsor West |
Not applicable |
| o-xylene 24-hour max | 0.431 µg/m3 at Sarnia |
2.136 µg/m3 at Hamilton Downtown |
Not applicable |
| o-xylene annual mean | 0.122 µg/m3 at Sarnia |
0.246 µg/m3 at Windsor West |
Not applicable |
| 1,3-butadiene 24-hour max | 0.087 µg/m3 at Hamilton Downtown |
0.641 µg/m3 at Sarnia |
0 |
| 1,3-butadiene annual mean | 0.036 µg/m3 at Hamilton Downtown |
0.071 µg/m3 at Sarnia |
0 |
Concentrations of some VOCs in neighborhoods that are located in close proximity to local sources such as an industrial facility may be higher than those measured at the ministry’s Air Quality Health Index monitoring stations which are sited to be representative of general population exposure.
A summary of the 2021 VOCs annual statistics for individual AQHI air monitoring stations is detailed in the Appendix: 2021 benzene annual statistics, 2021 toluene annual statistics, 2021 ethylbenzene annual statistics, 2021 m- and p-xylene annual statistics, 2021 o-xylene annual statistics, and 2021 1,3-butadiene annual statistics.
Ontario VOC emissions by sector, 2021
General solvent use
Industrial
Other transportation
Printing/Surface coating
Residential
Miscellaneous
Road vehicles
This is a chart depicting Ontario’s VOC emissions by sector based on 2021 estimates for point/area/transportation sources. Please note this chart excludes emissions from open and natural sources (Air Pollutant Emission Inventory 1990-2021, 2023).
General solvent use (e.g., degreasing, adhesives and sealants, consumer and commercial products) accounted for 27% of VOC emissions in 2021; and transportation sector accounted for 23% (Air Pollutant Emission Inventory 1990-2021, 2023).
Ontario Ambient Air Quality Criteria
Ambient air quality refers to general air quality resulting from all sources of contaminants to air. Ambient Air Quality Criteria (AAQC) are a concentration of a contaminant in air that is protective against adverse effects on health and/or the environment.
AAQC are not regulatory values but are used to assess general (ambient) air quality resulting from all sources (i.e., industrial and non-industrial sources) of a contaminant to air. AAQC are most commonly used in environmental assessments, special studies using ambient air monitoring data, assessment of general air quality in a community and annual reporting on air quality across the province.
| Contaminant | 10 minutes AAQC Assesses protection against acute effects |
1-hour AAQC Assesses protection against acute effects |
8-hour AAQC Assesses protection against acute effects |
24-hour AAQC Assesses protection against chronic effects |
Annual AAQC Assesses protection against chronic effects |
|---|---|---|---|---|---|
| NO2 | N/A | 200 ppb | N/A | 100 ppb | N/A |
| PM2.5 | N/A | N/A | N/A | 27 μg/m3 |
8.8 μg/m3 |
| O3 | N/A | 80 ppb | N/A | N/A | N/A |
| SO2 | 67 ppb | 40 ppb | N/A | N/A | 4 ppb |
| CO | N/A | 30 ppm | 13 ppm | N/A | N/A |
| Benzene | N/A | N/A | N/A | 2.3 μg/m3 | 0.45 μg/m3 |
| Toluene | N/A | N/A | N/A | 2,000 μg/m3 |
N/A |
| Ethylbenzene | 1,900 μg/m3 | N/A | N/A | 1,000 μg/m3 | N/A |
| 1,3-Butadiene | N/A | N/A | N/A | 10 μg/m3 | 2 μg/m3 |
| Manganese in PM2.5 | N/A | N/A | N/A | 100 ng/m3 | N/A |
Notes:
- ppb – parts (of contaminant) per billion (parts of air) – by volume.
- μg/m3 – micrograms (of contaminant) per cubic metre (of air) – by weight.
- ppm – parts (of contaminant) per million (parts of air) – by volume.
- ng/m3 - nanograms (of contaminant) per cubic metre (of air) – by weight.
Footnotes
- footnote[1] Back to paragraph Ontario has adopted the 24-hour PM2.5 CAAQS used “as is” for comparison to the 24-hour measurement of air quality data.
- footnote[2] Back to paragraph Ontario has adopted the annual PM2.5 CAAQS used “as is” for comparison to a single annual average of air quality data.
- footnote[3] Back to paragraph Based on odour.