Chapter 3: Implications of Demographic and Economic Trends for the Public Sector and Fiscal Policy 2020
Introduction
This chapter describes the potential impact of demographic and economic trends on the public sector and Ontario’s fiscal policy. Based on the demographic and economic projections presented in the previous chapters, there are three key implications for the future:
- Rising demand for certain public services due to demographic and economic factors
- Lower revenue growth than in the past arising from slower than historical economic growth; and
- Ongoing measures will be required to support sustainability of the province’s finances
The near-term fiscal outlook has been heavily impacted by COVID‑19. The government’s immediate priority is to ensure that the health care system has the resources required to respond to this pandemic, and that actions are taken to protect people and jobs and supporting economic recovery. The purpose of this report is to focus on long-term economic and demographic trends following the recovery from the COVID‑19 pandemic. A discussion of the potential implications of COVID‑19 for Ontario public services and fiscal policy over the long term is included later in this chapter.
Past Trends in Ontario Government Services and Finances
Historical revenue and spending developments provide context and have implications for future trends in the province’s public finances. This section discusses historical trends in:
- Demand for public services
- Government revenues
- Government deficits
- Government debt; and
- Debt financing costs
Demand for Public Services
The key drivers of demand for public services are demographic factors such as population growth and its age composition. Utilization rates, the introduction of new programs and changes to the cost of delivering services have also played a role historically.
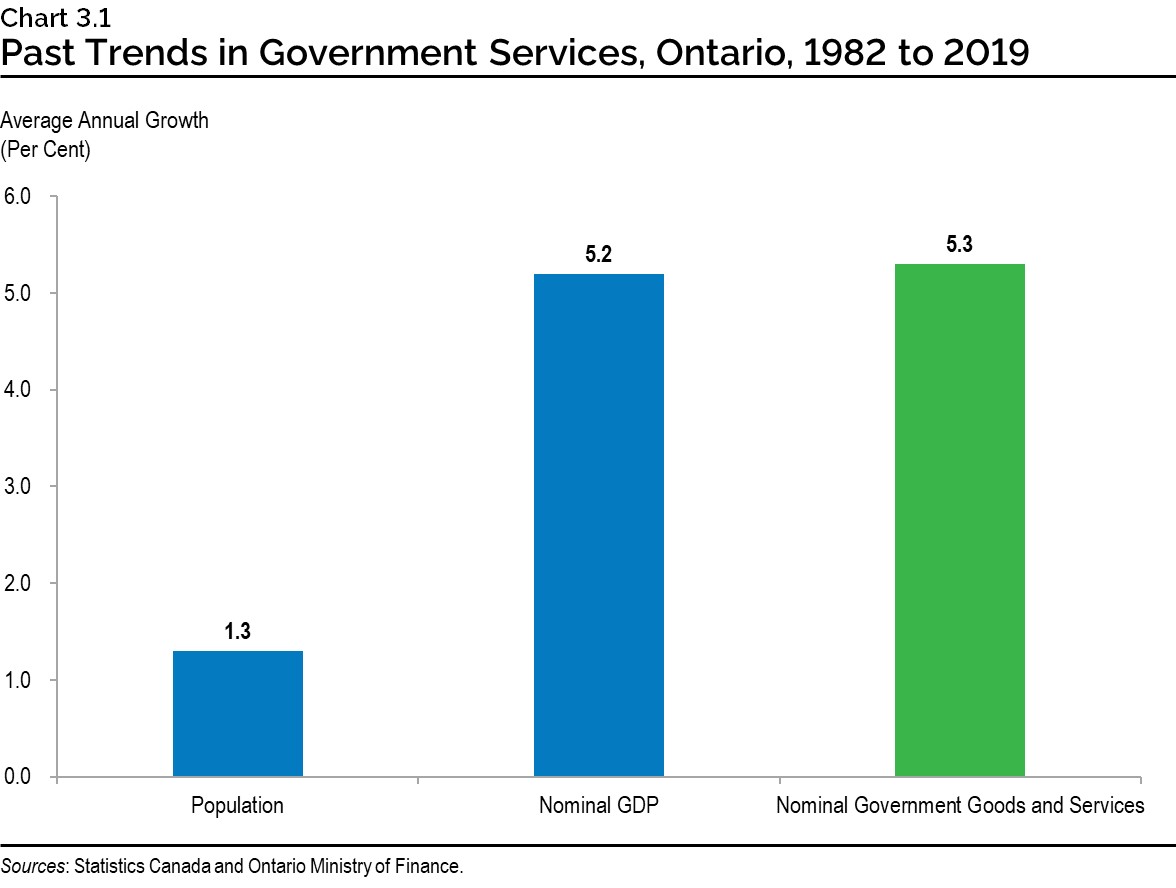
Spending by all levels of government in the province has grown at an average annual rate of 5.3 per cent over the past nearly four decades. This is a faster pace than the province’s population growth and modestly faster than overall average annual nominal economic growth during this period. This is due to a broad range of factors including an aging population, demand for services rising with public expectations and increasing service delivery costs.
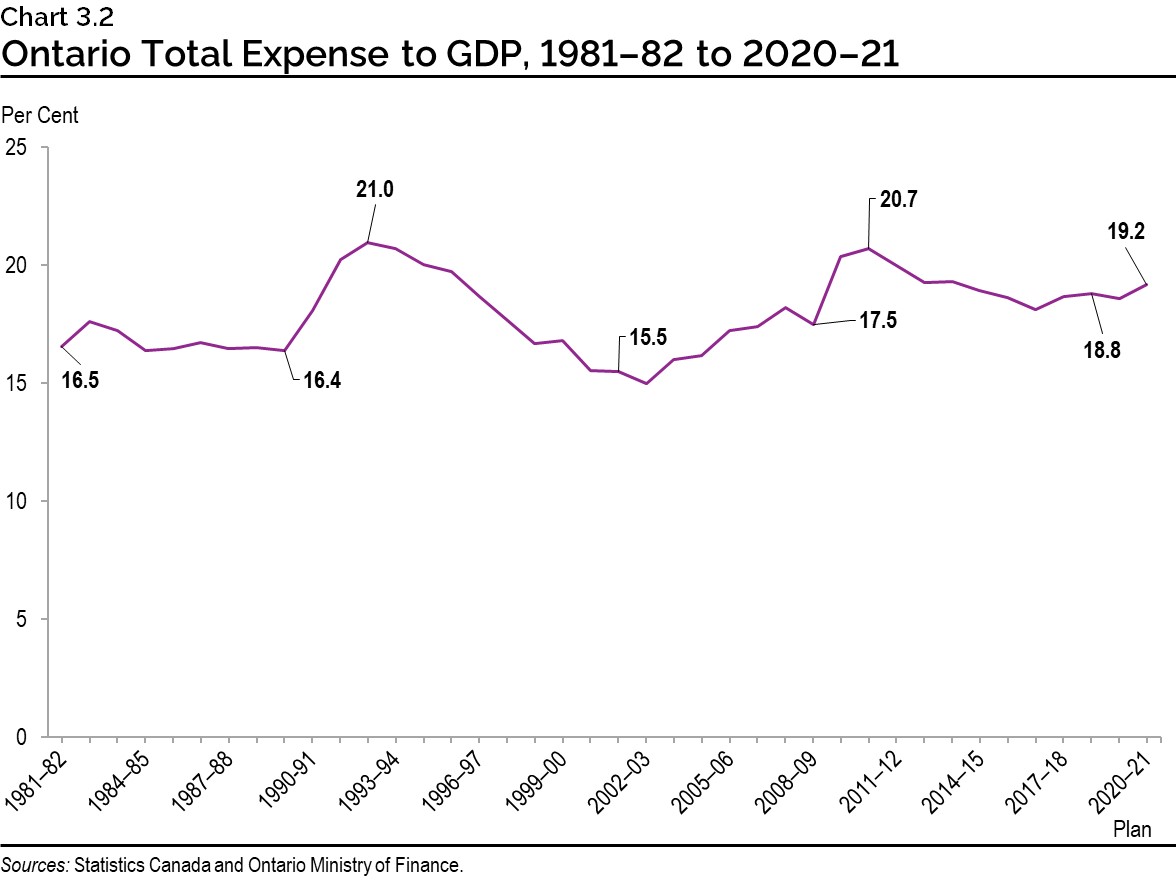
Over time, total expenses have risen as a share of the economy, rising from 16.5 per cent of GDP in 1981–82 to a projected 19.2 per cent of GDP in 2020–21.
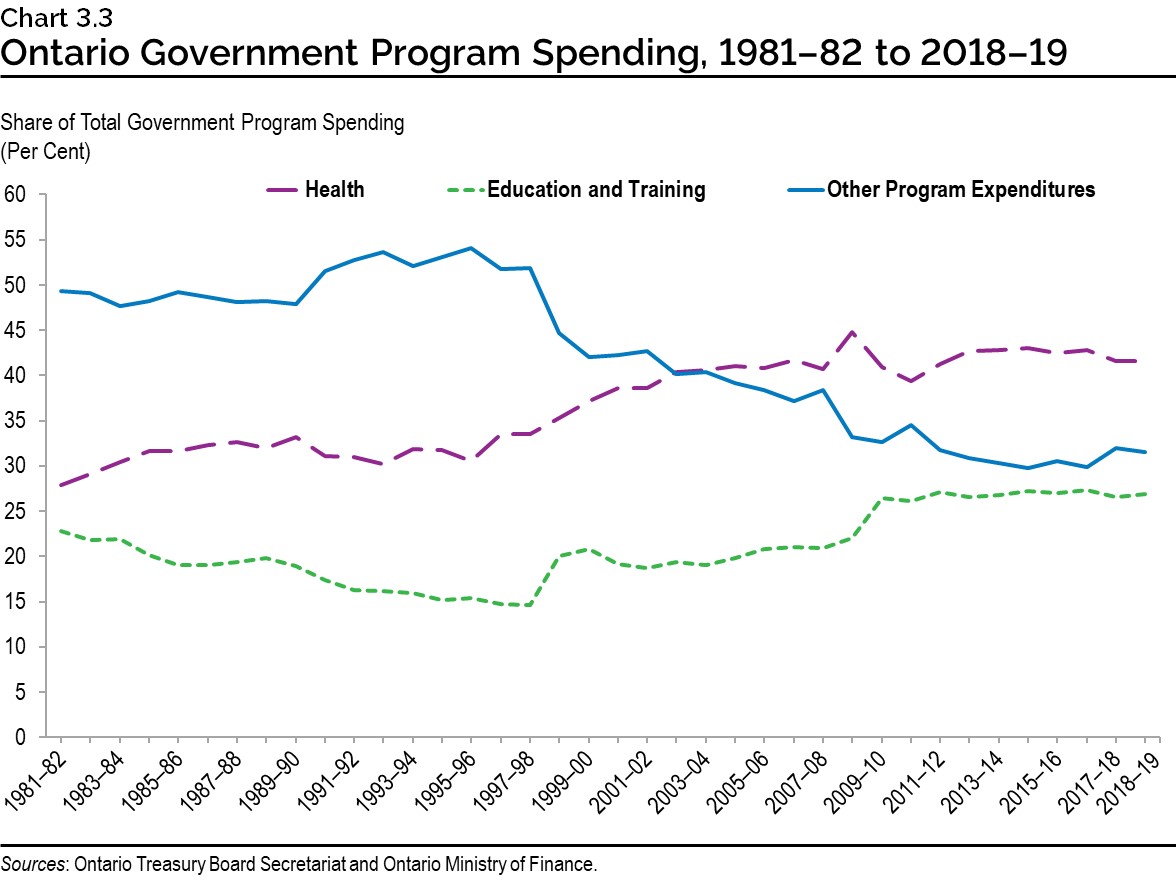
In 2018-19, the health care sector constituted the largest share of total program spending (42 per cent), followed by education and training (27 per cent). Over the past two decades the combined share of health and education, in total government expenditures, has been increasing while that of other program expenditures has declined.
Government Revenues
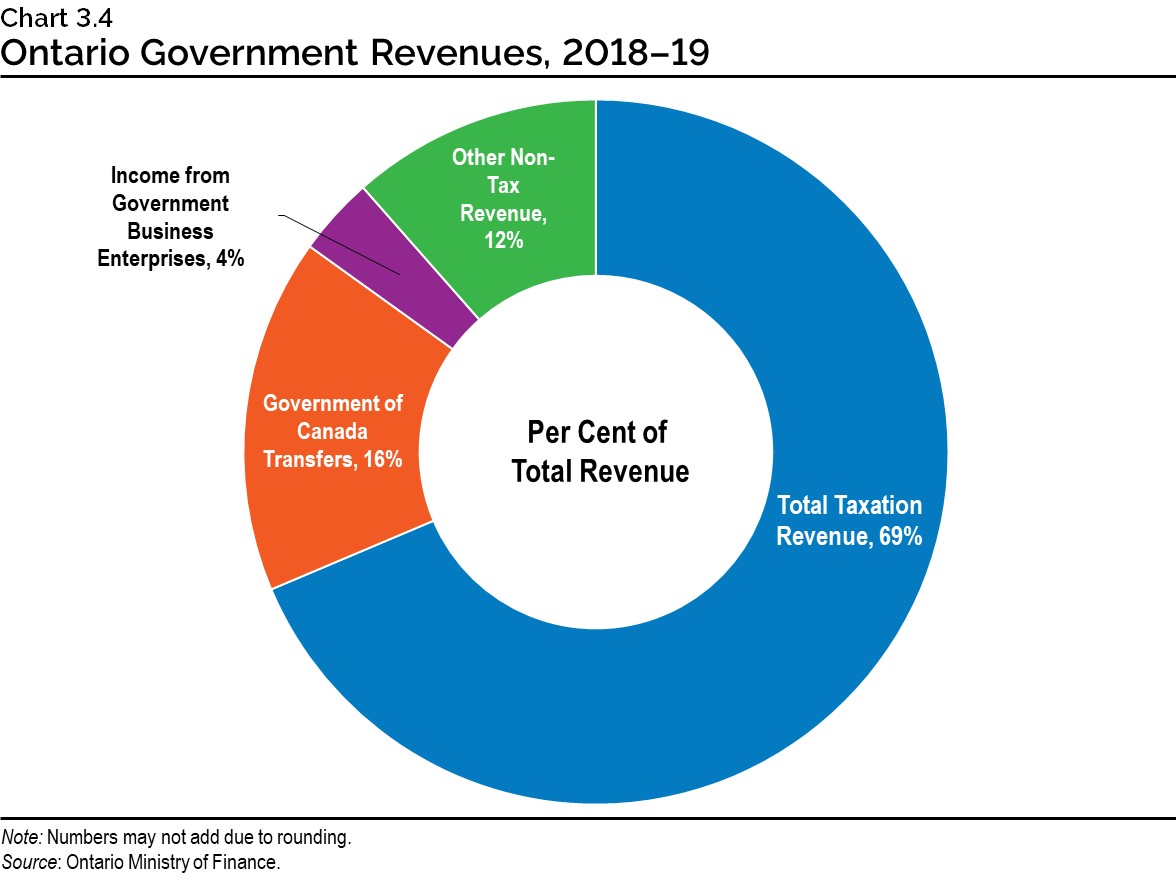
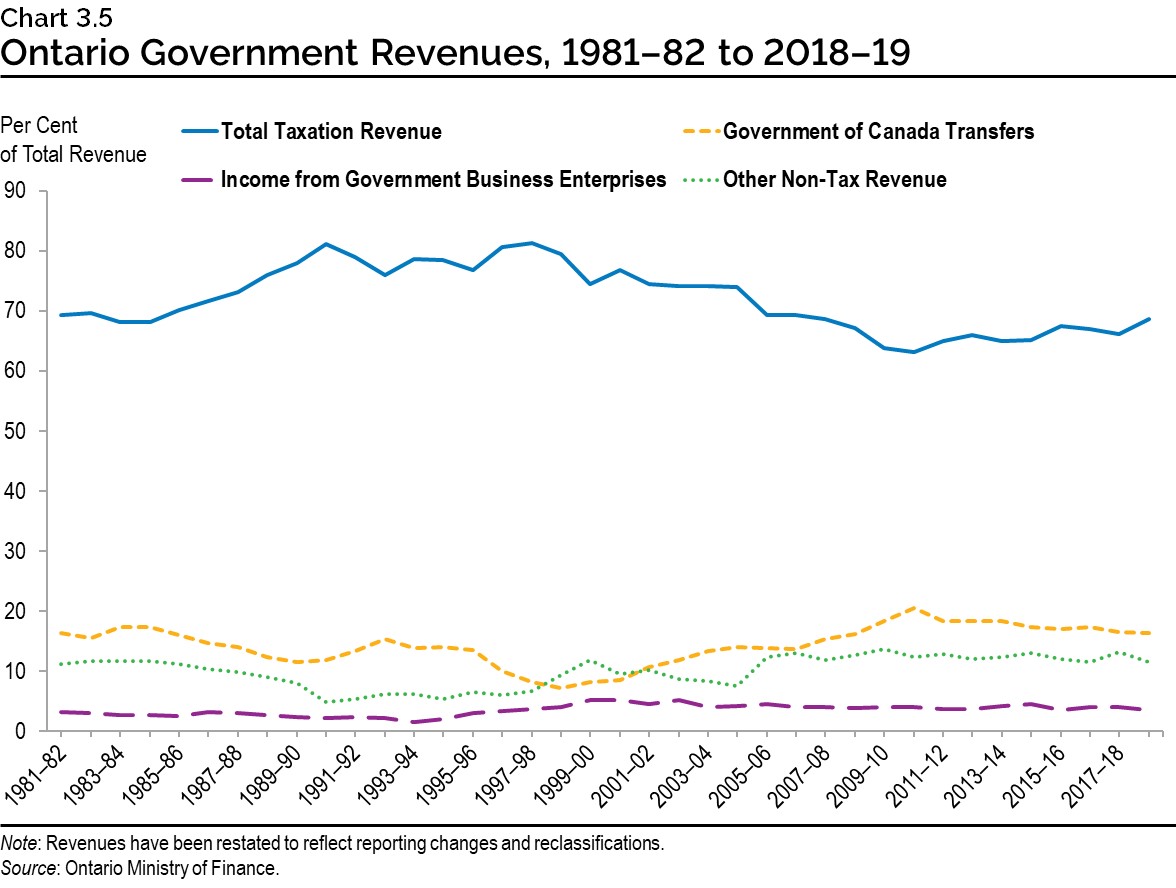
Taxation revenues represented 69 per cent of Ontario government revenues in 2018–19, followed by federal transfers to Ontario at 16 per cent. Federal transfers include major Government of Canada transfers, such as the Canada Health Transfer and the Canada Social Transfer, along with funding for infrastructure projects and labour market programs. Net income from government business enterprises (GBEs) comprised about 4 per cent of total provincial revenues in 2018–19. Other non-tax revenues which cover a large variety of revenue sources such as vehicle and driver registration fees, licences and permits, and royalties for the use of Crown resources, comprised about 12 per cent of total provincial revenues in 2018–19.
Since the early 1990s, total taxation revenues have declined as a share of total government revenues. Over the same period, non-tax revenues as a share of total government revenues have trended higher. Since 2010–11, federal transfers to Ontario have not kept pace with overall economic and revenue growth.
Government Deficits
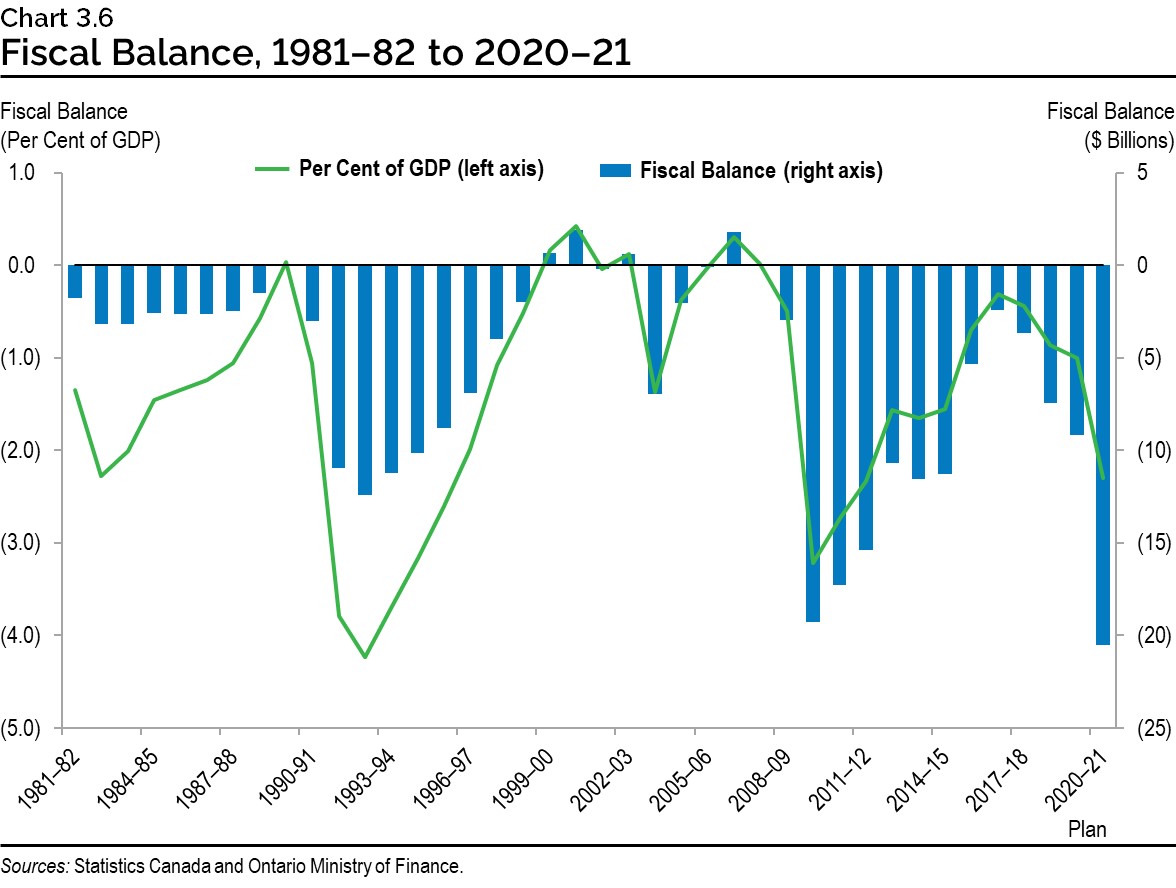
Between 1981–82 and 2018–19, the province’s finances have been in deficit in 32 out of the 38 years. There has been a tendency for large deficits as a consequence of economic downturns, such as in 1992–93 and 2009–10, with a movement towards balanced budgets over the subsequent growth period. As a result of the response to the COVID‐19 outbreak, the government is planning for a deficit of $20.5 billion in 2020–21 as presented in the March 2020 Economic and Fiscal Update. Achieving long-term fiscal balance is an important goal to ensure the province is positioned to respond to crises such as COVID‑19, and as a foundation on which to build long-term growth and prosperity.
Government Debt
One of the key implications of persistent provincial government deficits has been growth in Ontario’s net debt. Rising debt levels have been a trend among governments globally, notably in the aftermath of the global 2008–09 recession. Ontario’s net debt has doubled in the past decade alone and is projected to grow to $379 billion in 2020–21. Unfortunately, Ontario continues to have the largest subnational debt in the world.
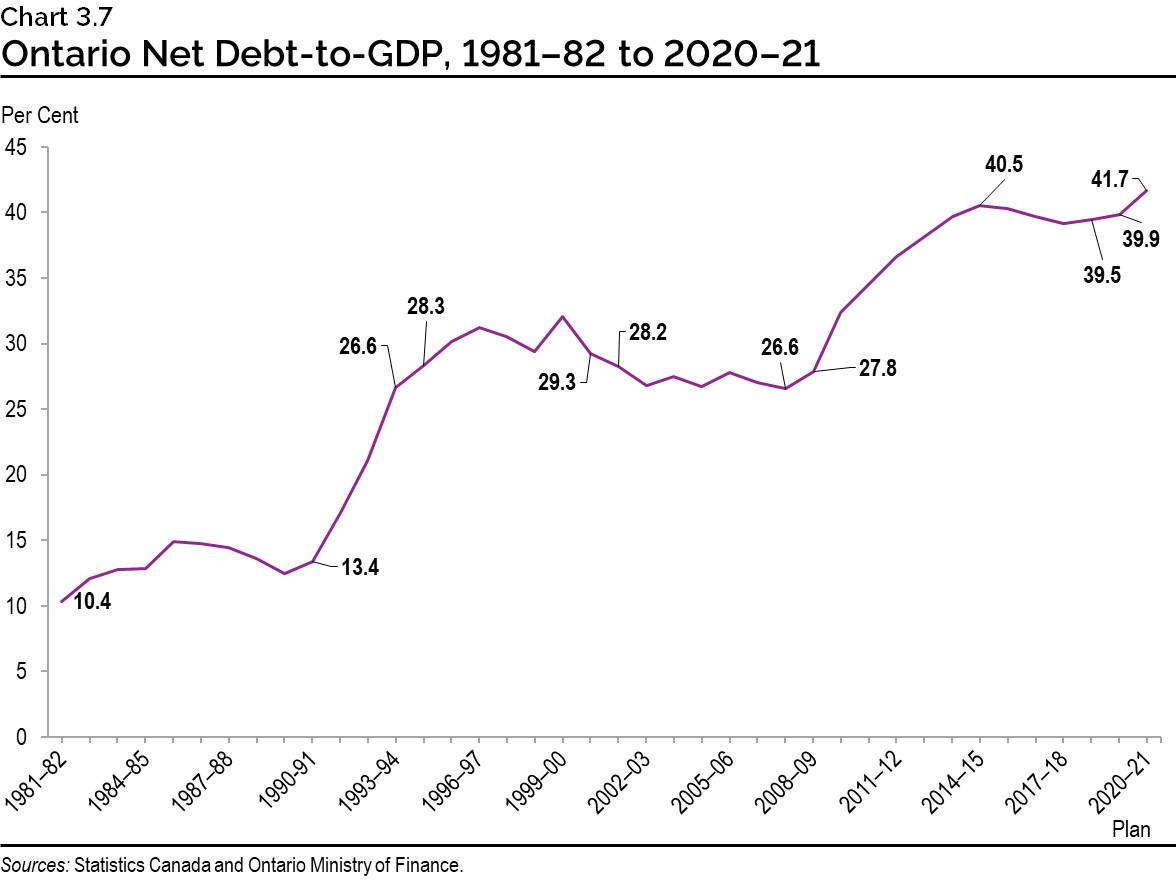
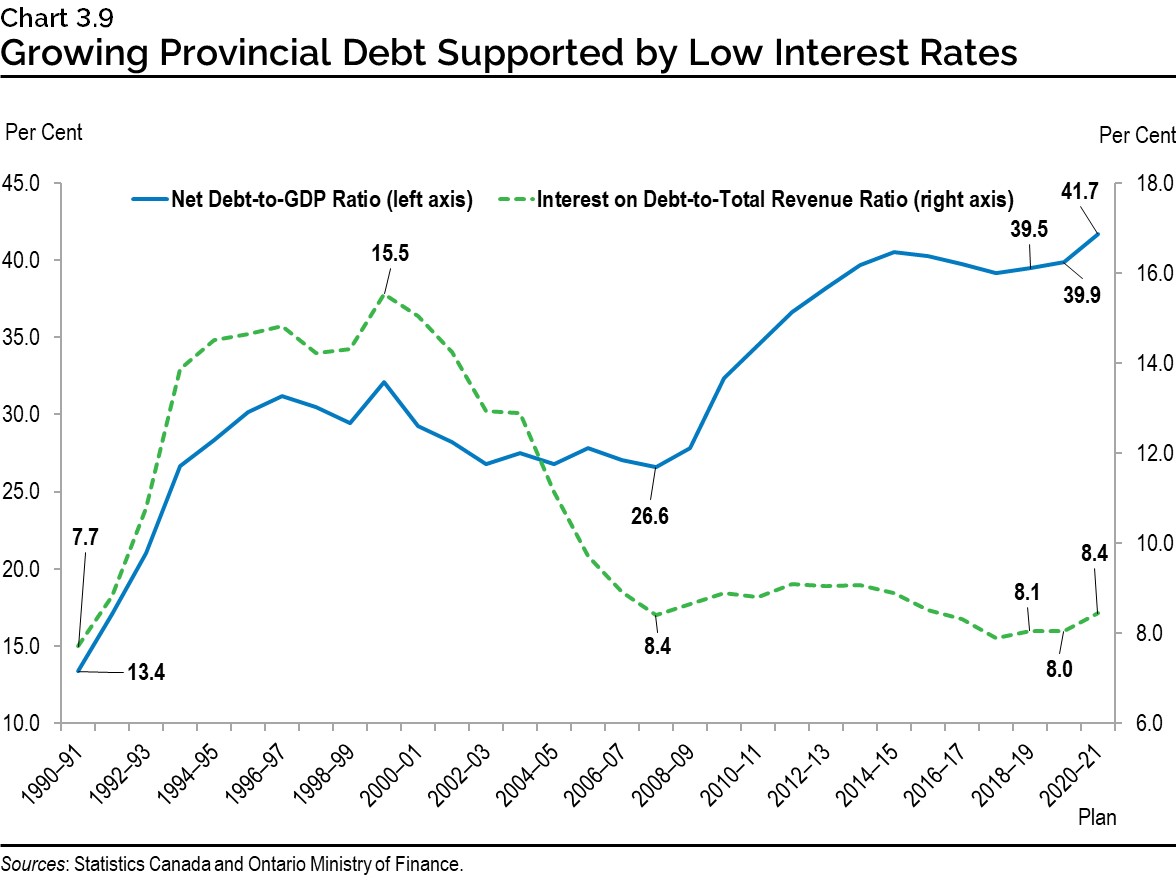
There has also been a trend in Ontario over the last 30 years for net debt measured as a ratio of the size of the provincial economy to rise substantially as a result of every major recession, edging down slightly afterwards and never returning to pre‑recessionary levels. Ontario’s net debt-to-GDP rose from 10.4 per cent in 1981–82 to a peak of 40.5 per cent in 2014–15, before declining slightly to 39.5 per cent in 2018–19. It is projected to rise to 41.7 per cent in 2020–21.
Provincial Net Debt-to-GDP Comparisons
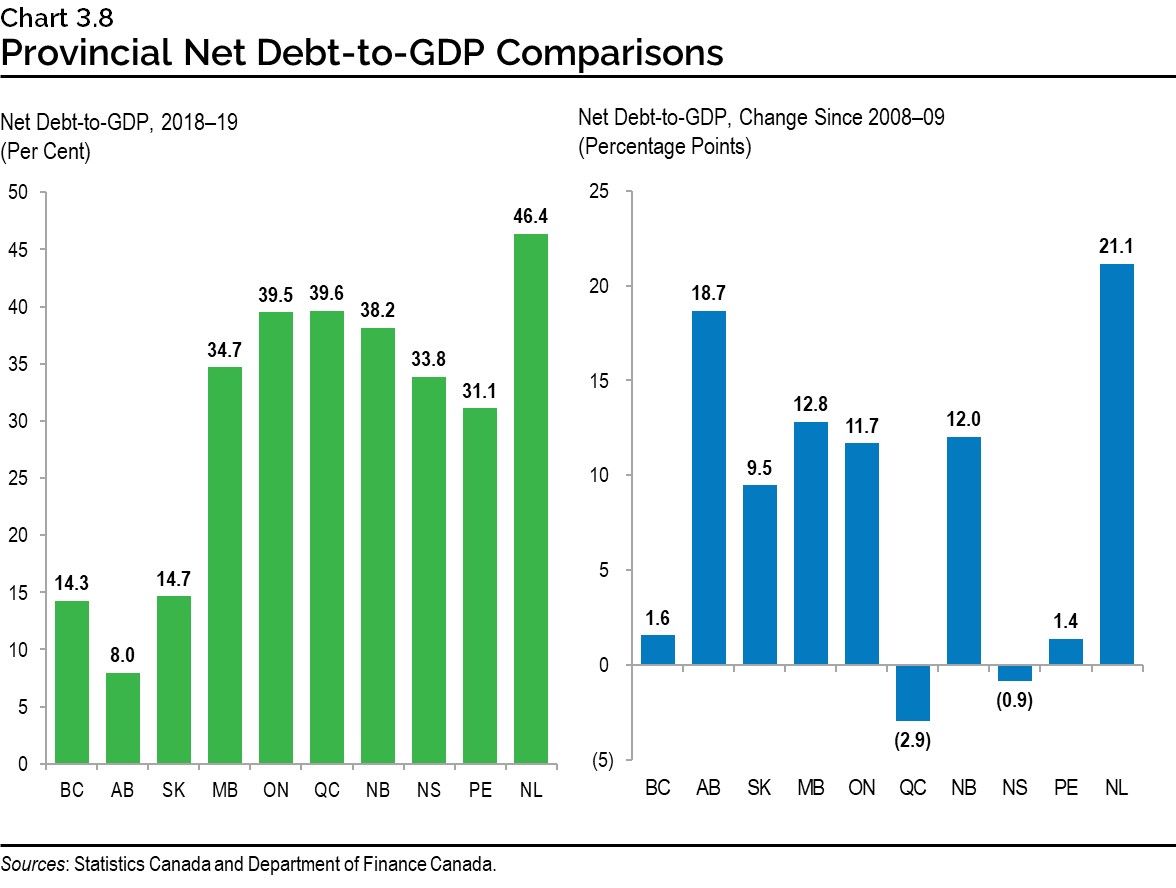
As shown on the left chart below, Ontario’s net debt-to-GDP ratio in 2018–19, at 39.5 per cent, was one of the highest among Canadian provinces. Newfoundland and Labrador had the highest ratio at 46.4 per cent and Alberta the lowest at 8.0 per cent.
The right chart shows the change in percentage points for Canadian provinces net debt‑to-GDP ratios since the 2008–09 recession. The net debt-to-GDP ratio rose significantly across most provinces. Ontario experienced an increase of 11.7 percentage points with Newfoundland and Labrador rising the most among all the provinces by 21.1 percentage points. Quebec experienced the largest decline of 2.9 percentage points, only one of two provinces to see the ratio decrease during this period.
Debt Financing Costs
Interest rates since the 2008–09 global recession have been historically low. As a result, relative debt service costs have also remained low with very little change in the interest on debt-to-total revenue ratio, despite substantial growth in Ontario’s net debt in both absolute terms as well as relative to GDP. Ontario is forecast to pay $13.2 billion in interest costs in 2020–21, as presented in the March 2020 Economic and Fiscal Update. This is up from $8.9 billion in 2008–09 and makes interest payments on debt Ontario’s fourth largest line item after health care, education and social services. Every dollar spent on interest servicing the province’s debt is a dollar not returned to people through investments in health care, infrastructure or lower taxes.
1. Implications of Demographic and Economic Trends for Public Services
This section examines how projected demographic and economic trends would influence the future demand for public services, and the corresponding implications for provincial government finances.
Demand for Public Services
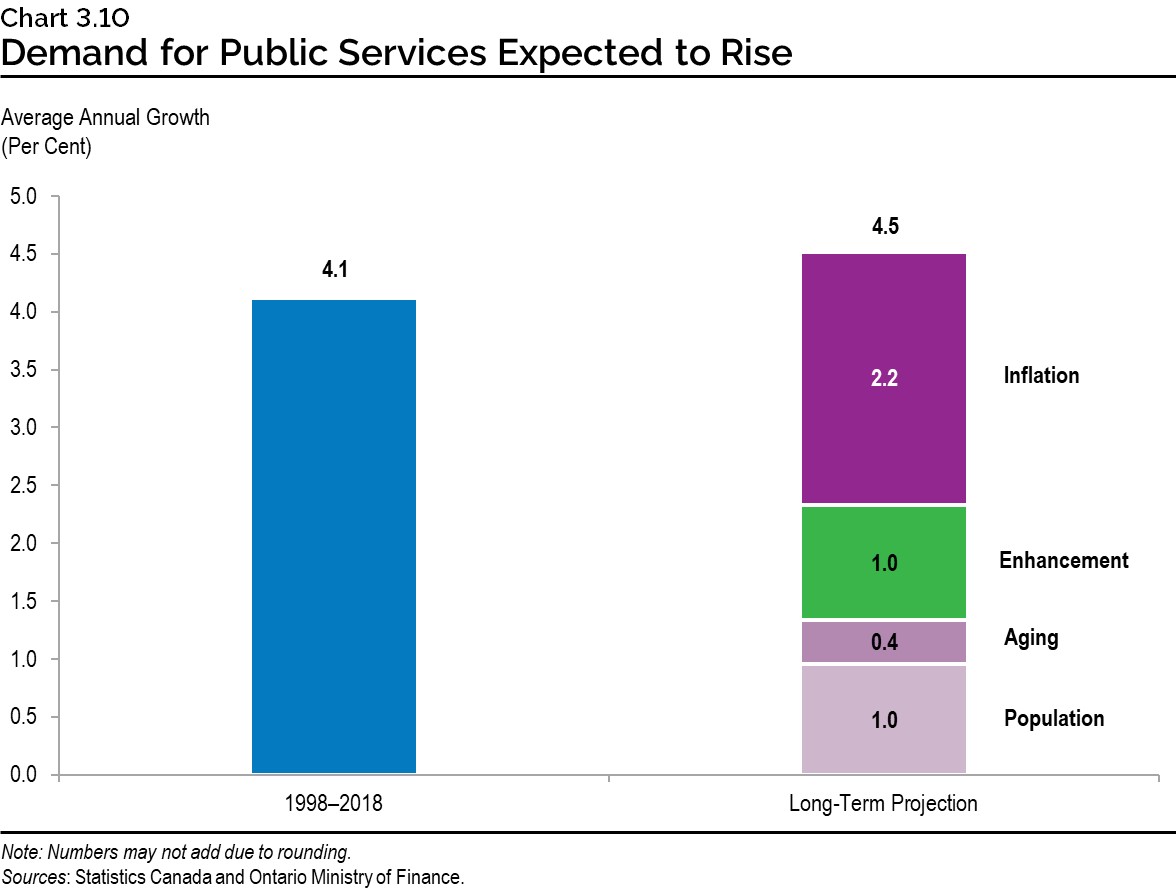
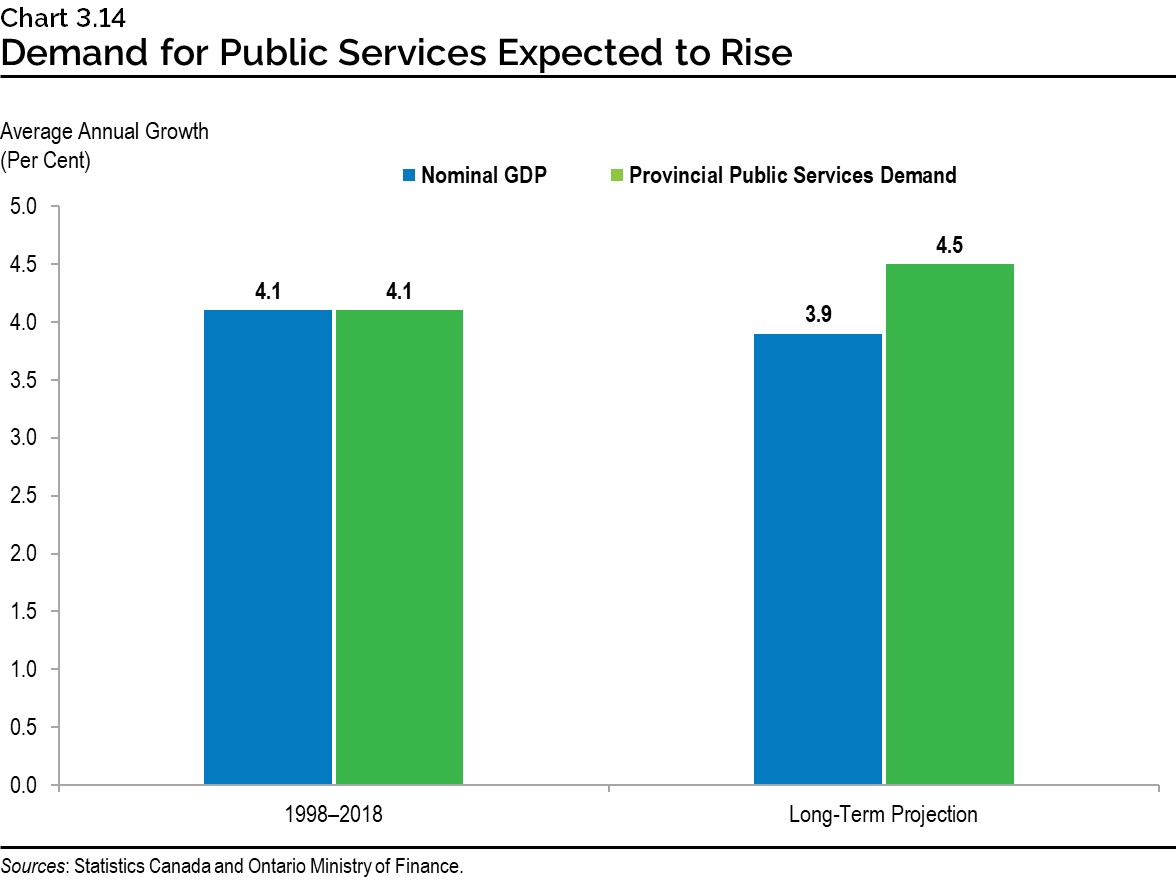
Total demand for government services is projected to advance at an average annual pace of 4.5 per cent over the long term. This total demand projection is based on four main components: underlying demographic demand; additional demands related to an older population; a continuation of past trends to enhance programs; and cost inflation. This compares to an average annual pace of growth of 4.1 per cent between 1998 and 2018.
Population
Chapter 1: Demographic Trends and Projections described how Ontario’s population is expected to continue rising over the next quarter century. Population growth is expected to be driven largely by immigration while growth in the core working-age population is expected to be relatively slower. Over the longer term, population growth in Ontario is expected to average 1.0 per cent annually.
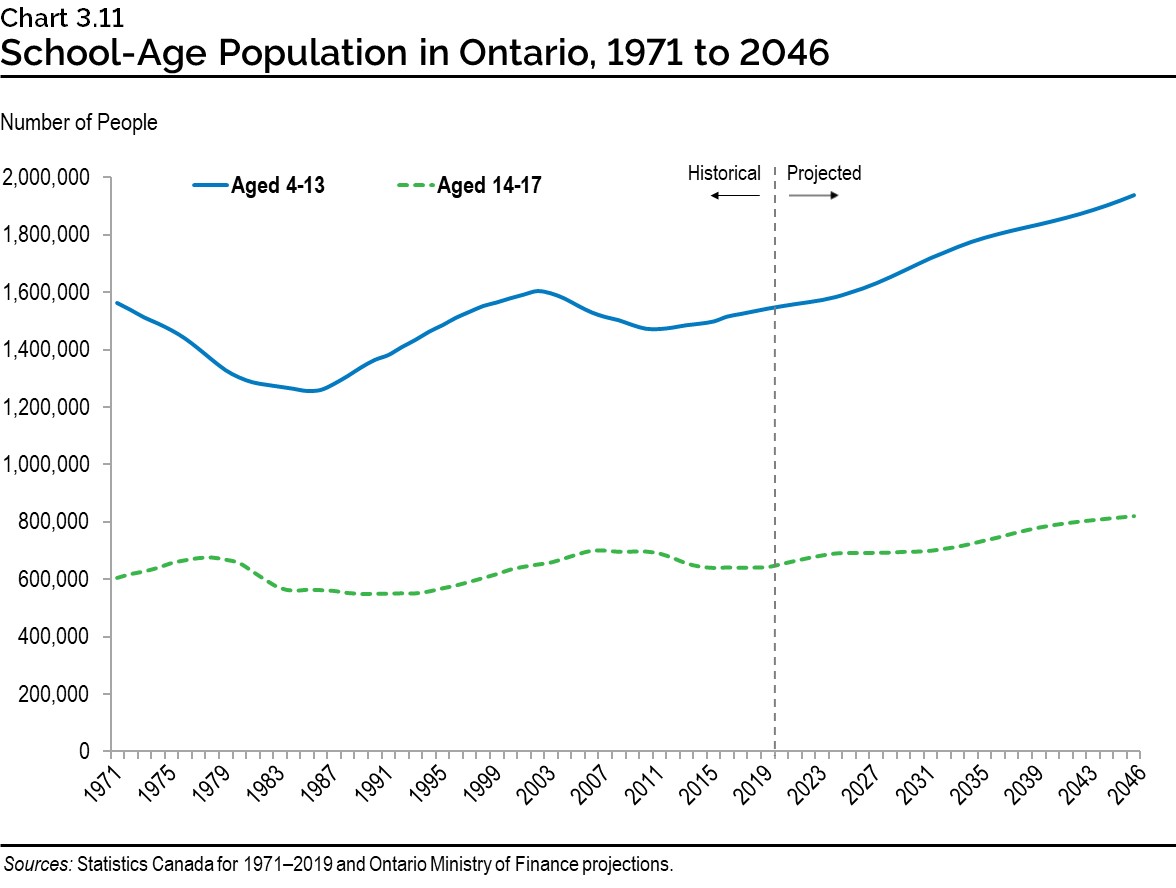
The population growth of specific age groups will influence demand for sector-specific public services. For example, from 2019 to 2046, the number of elementary school-age children is projected to rise by about 0.9 per cent annually, on average. The 4 to 13 age group is projected to grow by 25.7 per cent from 1.54 million in 2019 to 1.94 million in 2046 — significantly greater than the 1.4 per cent, or 22,000 decline seen over the past 20 years.
The secondary school-age group (aged 14 to 17 years) is projected to continue growing in the short term, and to reach 821,000 by 2046 — 27.9 per cent higher than today’s level of 642,000. Due to regional variations in the growth of the children’s population, school enrolment will rise in some regions and fall in others.
Aging
Ontario’s population is projected to experience an overall aging due to low fertility rates, aging of large cohorts of baby boomers and rising life expectancy. This is outlined in more detail in Chapter 1: Demographic Trends and Projections. One of the key implications of this is increasing demand for health care services.
Spending per person on health care for seniors is significantly higher than the remaining population. In Ontario, government health spending per person on seniors (65 years and above) was $10,964 per person in 2017 relative to the average amount of $4,133 per person for the entire population.
| Age Group | Spending per Person, 2017 ($) | Share of Population, 2017 (per cent) | Share of Population, 2046 (per cent) |
|---|---|---|---|
| <1 | 12,374 | 1.0 | 1.0 |
| 1-4 | 1,801 | 4.1 | 3.9 |
| 5-14 | 1,536 | 10.9 | 9.8 |
| 15-44 | 2,299 | 39.5 | 37.9 |
| 45-64 | 3,712 | 27.9 | 24.0 |
| 65-84 | 9,098 | 14.4 | 17.9 |
| 85+ | 23,025 | 2.2 | 5.5 |
| Total | 4,133 | 100.0 | 100.0 |
Sources: Canadian Institute for Health Information and Ontario Ministry of Finance
Some partial offset to rising program expenses from aging-related health care demand is projected to come from slower demographic demand growth in some other sectors such as elementary and secondary education, which is expected to grow at a slightly slower pace than the overall population. Regardless, the aging population will be a factor increasing the demand for certain public services over the projection period.
Service Enhancement
Historically, demand for public services has risen faster than overall population growth. Over the projection period, enhanced demand for public services is projected to rise in line with growth in overall real GDP per capita.
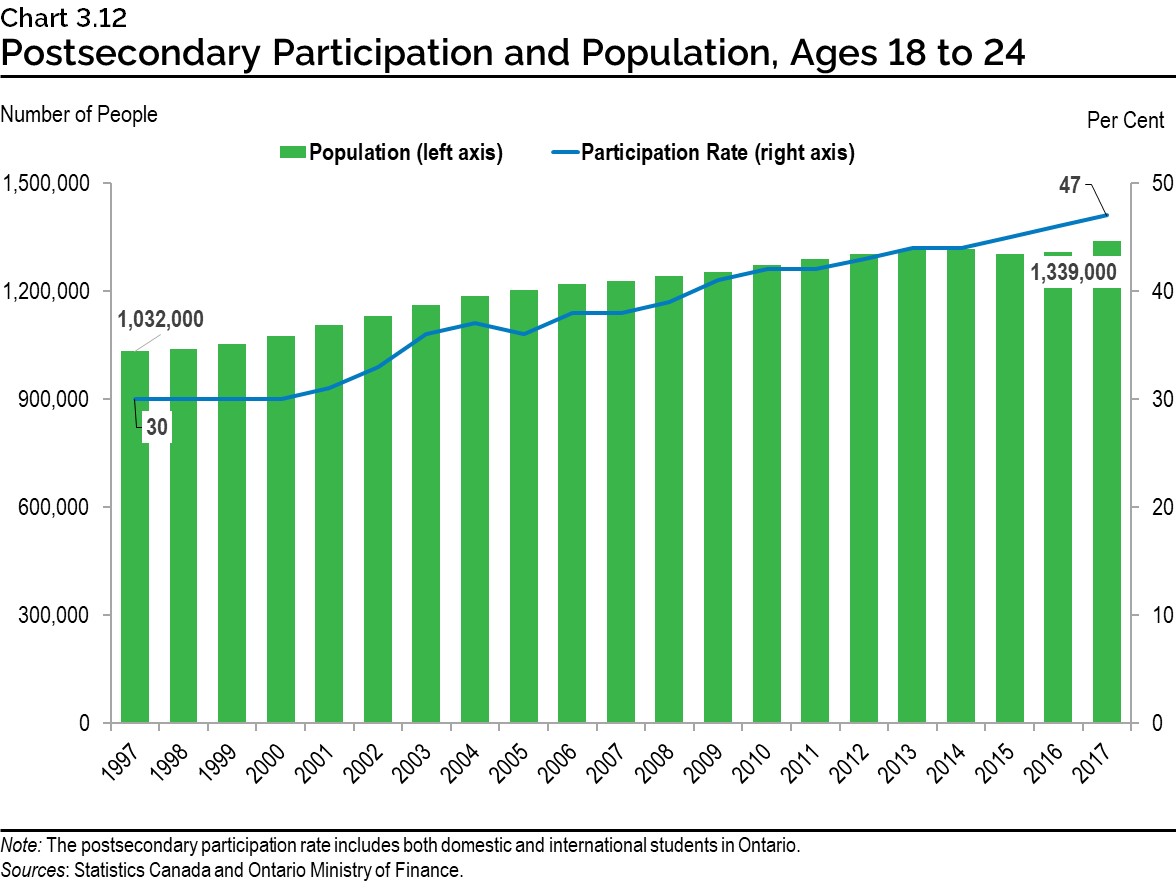
Demand for postsecondary education and training provides an example of historical service enhancement. In the postsecondary sector, demographics play a somewhat smaller role in determining enrolment than in the primary and secondary education system because participation is not universal.
In Ontario, the postsecondary education participation rate has increased from 30 per cent to 47 per cent over the past two decades. Postsecondary enrolment will continue to be highly influenced by a combination of demographics and demand, reflecting both economic conditions and the skills needed for future employment.
Inflation
Demand for public services is also impacted by cost inflation. Historically, inflation for government goods and services has risen at a slightly faster pace than consumer price index (CPI) inflation. Higher relative government-sector inflation was driven by health care costs, generally attributed to higher labour costs and new technologies.
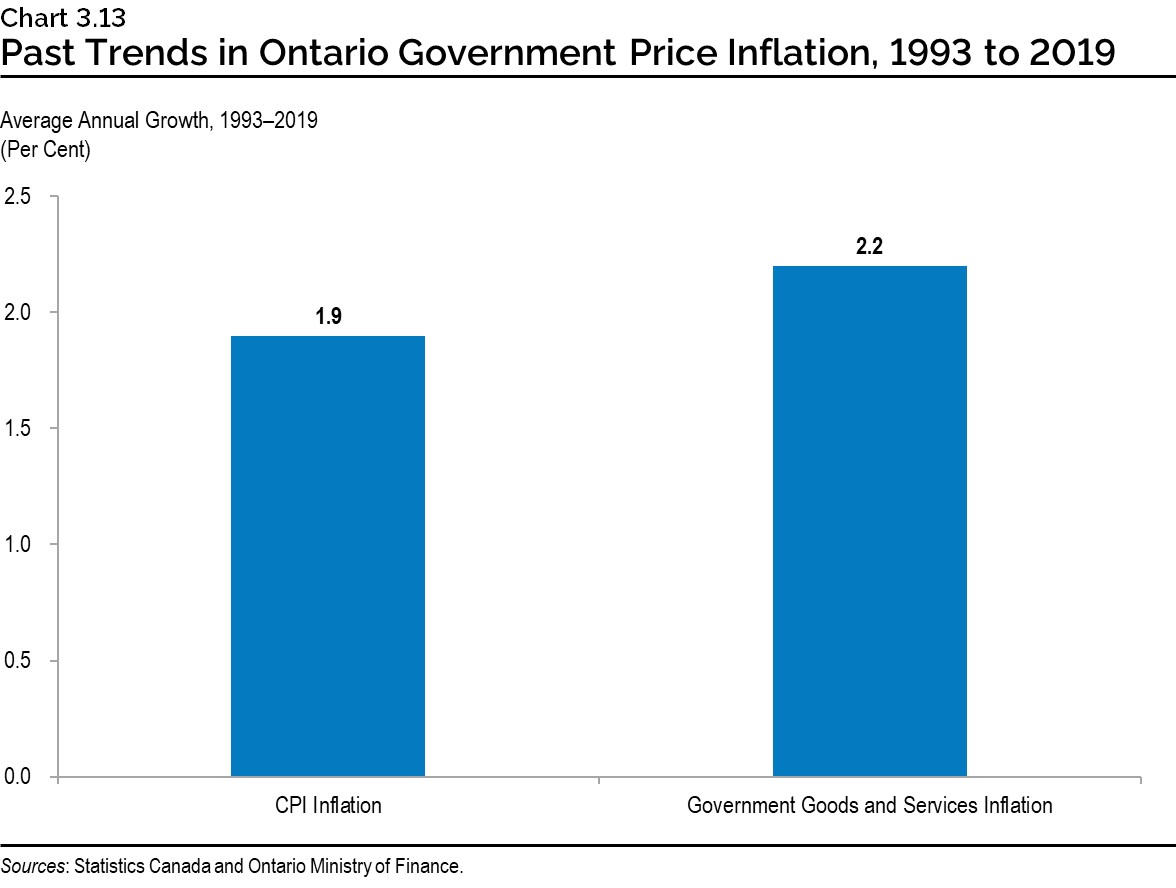
Over the projection period, average annual inflation for public services, at 2.2. per cent, is projected to rise modestly faster than CPI inflation of 2.0 per cent, reflecting this trend.
Future Fiscal Pressures
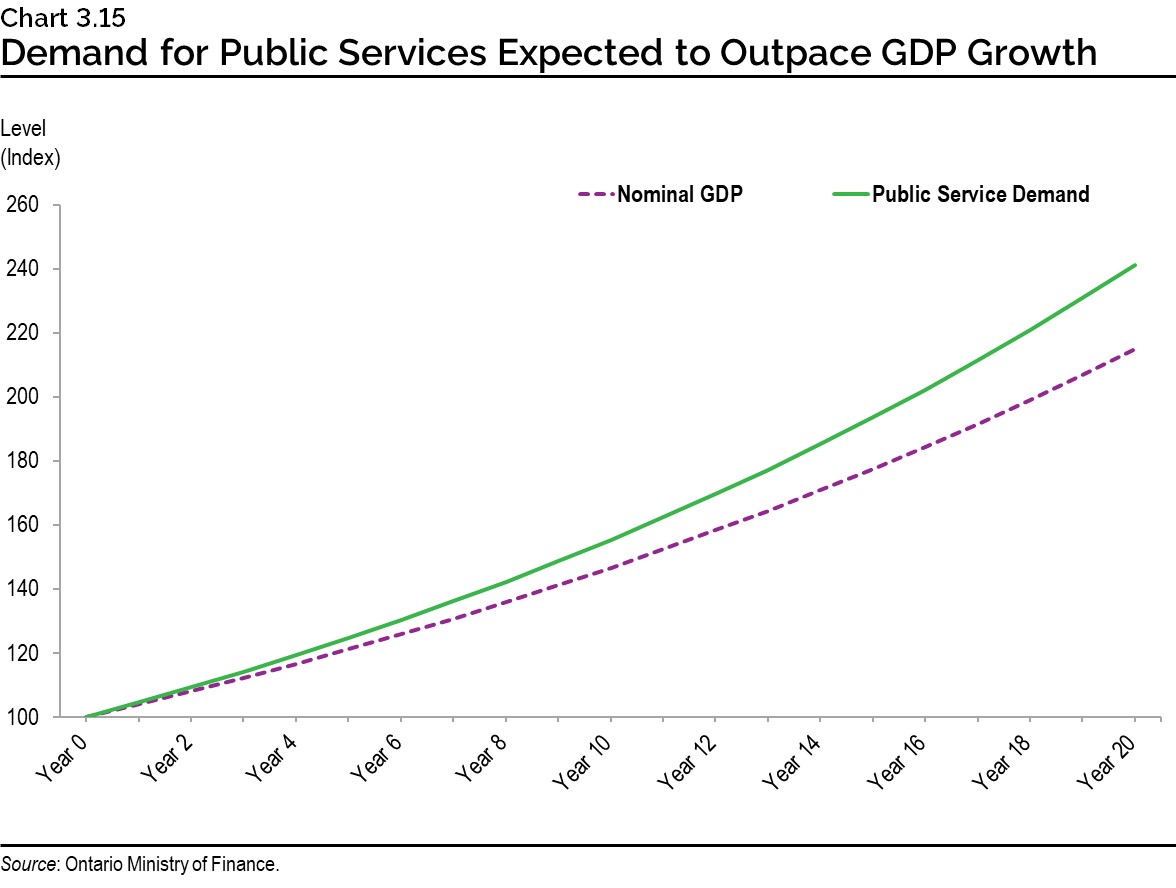
Over the long term, demand for public services is projected to rise at a faster pace than overall economic growth. As outlined earlier in this chapter, this is mainly due to the expected rise in health care demand arising from the pressures of an aging population.
Overall growth in demand for public services is expected to rise by an average of 4.5 per cent annually over the long term. Left unaddressed, this would lead to demand for public services exceeding nominal GDP by over 12 per cent at the end of a 20-year projection period.
A key challenge in the future will be to manage sustainable provision of public services in a manner that does not increase public services as a share of the economy. More spending on services could be offset by responsible, more prudent management of public finances. Growth in services could be maintained at a rate closer to underlying demographic demand with fewer new programs or service enhancements, and the review, modernization or phase-out of ineffective programs. Increased productivity in the provision of public services, such as through increased use of digital service delivery, would allow growing demand to be met without ongoing increases in the proportion of the province’s economic and financial resources being devoted to supporting higher demand. Moderating public-sector price inflation will also play a role in sustainably providing public-sector services.
2. Implications of Demographic and Economic Trends for Revenue Growth
This section examines how projected demographic and economic trends would influence future revenue growth, and the corresponding implications for provincial government finances.
Revenue Growth Driven by Economic Growth
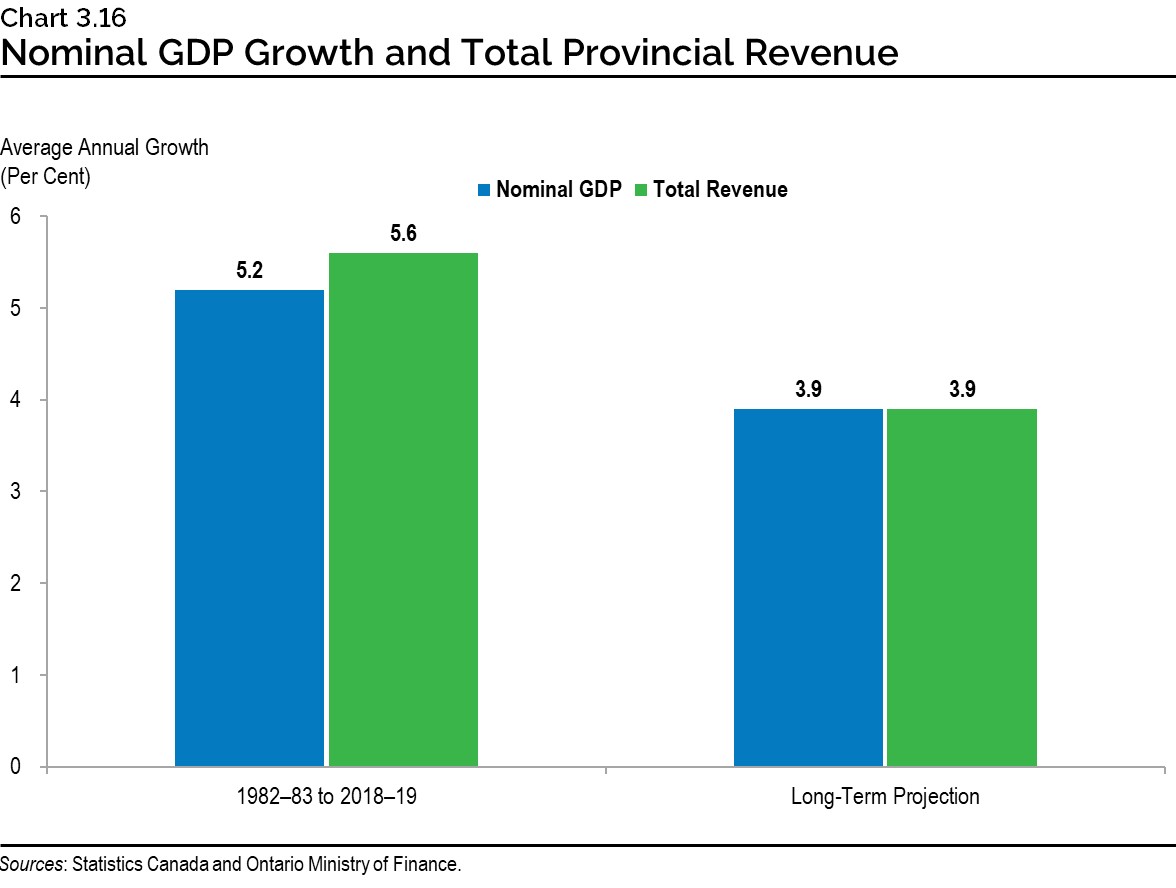
Over the longer term, total revenues are projected to grow in line with the economy. Because of the slower projected pace of economic growth, revenues are expected to grow at a slower rate than in the past.
Income from Retirement Savings Withdrawals
Many people in Ontario have benefited significantly from provisions of the tax system regarding retirement income savings. Tax treatment of contributions to the Canada Pension Plan, workplace Registered Pension Plans, and personal Registered Retirement Savings Plans, along with the deferred tax on the income earned in those plans, results in billions of dollars of deferred tax for individuals every year.
As a consequence of the aging population and their past savings, the Province is increasingly seeing a rise in the income related to past savings. This trend is expected to continue, leading to an increasing taxable income base.
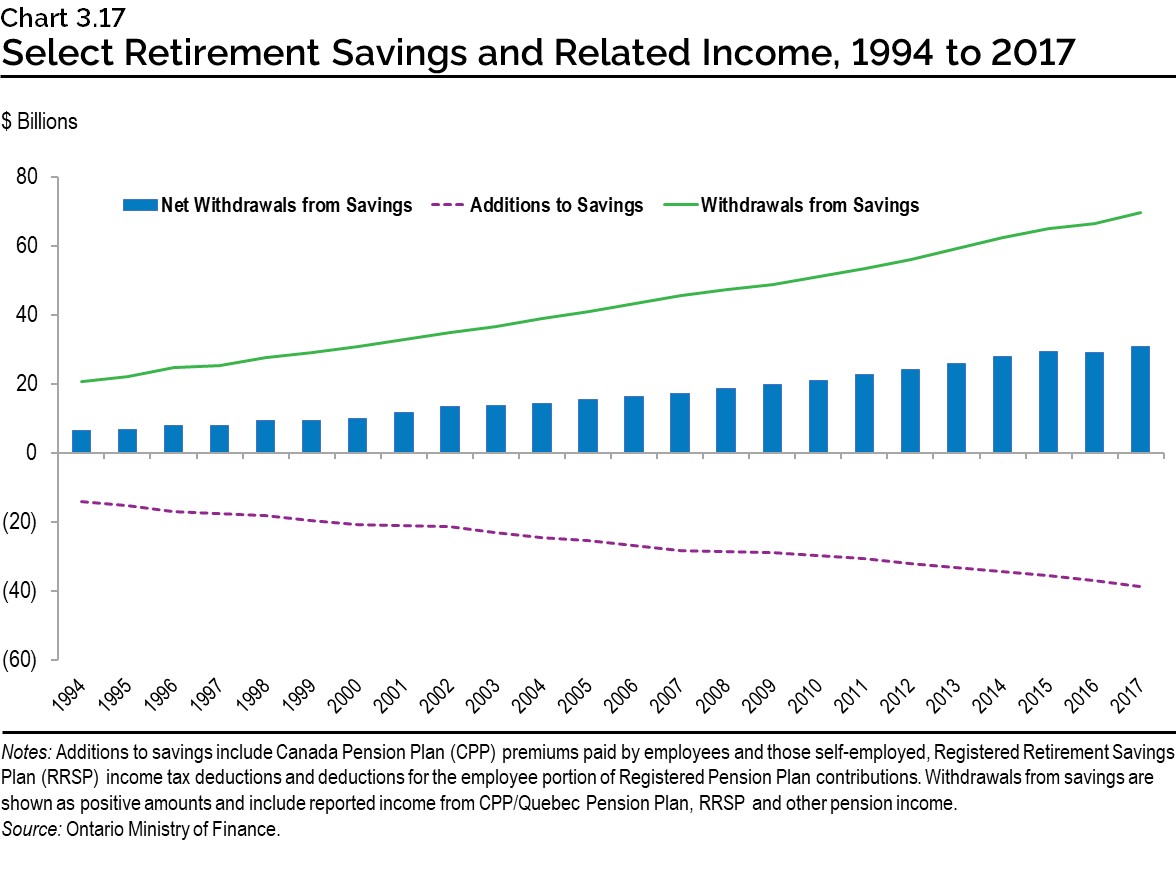
Income from these savings withdrawals increased at an average annual pace of 5.4 per cent over the past 23 years, outpacing overall income growth by 1.4 percentage points. This trend is likely to be more pronounced in the long term as seniors, who will make up a larger share of the population, draw on their retirement savings.
3. Ongoing Measures Will Be Needed to Support Fiscal Sustainability
A long-term approach to fiscal management is important. Prudent management will ensure that governments have the resources available to provide effective public services that residents can rely on both now and in the future, the flexibility to manage unexpected changes that may arise, and the capacity to limit the debt burden on future generations.
Prudent spending will require a sustained effort with a continued focus on financial management throughout the medium- to long-term time horizon.
Sustainability of Government Finances
Sound government finances are a cornerstone in ensuring ongoing, sustainable provision of public services over the long term.
A high debt-to-GDP ratio with no plan to reduce the debt burden will lower confidence in the province’s finances, impacting business confidence and investment. This results in a higher risk premium on borrowing and contributes to a higher cost of borrowing. Responsible fiscal management will lower the risk premium on government debt and reduce the interest on debt burden.
Sustainable public finances provide increased fiscal room that allows the government to respond to adverse economic and fiscal events, such as an economic downturn, natural disaster or a pandemic. High debt levels increase the public interest burden, reducing money available for other areas of fiscal policy, particularly when fiscal stimulus may be needed most.
There are also considerations with respect to intergenerational fairness. High levels of debt-funded operating spending will raise the debt burden for future generations who may not benefit from these public expenditures.
Ontario’s Debt Sustainability
Fiscal sustainability, as measured by the sustainability of public debt, represents the ability of a government to manage public finances in a way that ensures resources are available to fund public services over the long term, while maintaining flexibility to address unforeseen circumstances and service the debt.
The Institute of Fiscal Studies and Democracy’s Fiscal Sustainability Report, 2017, recognizes the need for governments to plan over an extended time horizon: “a government’s fiscal rectitude must not only be judged on the here and now, but also on how it has positioned itself over the long term and across generations.”
While the COVID‑19 pandemic has introduced significant uncertainty for global economic prospects, the Ontario government has produced Ontario’s Long-Term Report on the Economy (Long-Term Report) in recognition of the continued need for a long-range assessment of the province’s economic and demographic trends and their implications for fiscal policy. This analysis is one of the fundamental inputs to responsible, forward-looking fiscal and budgetary planning and reporting. In particular, it helps in understanding the province’s potential future economic path and implications for government finances.
There are also considerations with respect to intergenerational fairness. High levels of debt-funded operating spending will raise the debt burden for future generations who may not benefit from these public expenditures.
Office of the Auditor General of Ontario Annual Report 2019: Debt Sustainability Commentary and Recommendations
As an acknowledgment of the government’s priority of responsible fiscal management, the Office of the Auditor General of Ontario (OAGO) noted in its Annual Report 2019 the expanded requirements in the Fiscal Sustainability, Transparency and Accountability Act, 2019 (FSTAA), as compared with the earlier Fiscal Transparency and Accountability Act, 2004.
In a value-for-money audit featured in the same Annual Report 2019, the OAGO highlighted the importance of fiscal sustainability from the perspective of managing public debt. OAGO recommendations centred on actions towards achieving long‑term sustainability of Ontario’s debt.
Office of the Auditor General of Ontario Annual Report 2019: Value-for-Money Debt Sustainability Recommendations
Recommendation 1
To increase the ability of the Ministry of Finance (Ministry) to achieve long-term sustainability for the provincial debt, we recommend that the Ministry:
- Clearly define “extraordinary circumstances” as set out in the Fiscal Sustainability, Transparency and Accountability Act, 2019
- Identify relevant measures to assess debt sustainability
- Develop formal, evidence-based long-term targets and plans to meet them; and
- Monitor these measures and assess the impact on the province’s current and projected financing needs, and the cost of debt
Recommendation 2
So that the Ministry of Finance (Ministry) is better informed about the province’s ability to withstand potential new economic shocks and about potential scenarios to consider when faced with new significant economic impacts, we recommend that the Ministry request that the Ontario Financing Authority:
- Develop and test scenarios that consider the impacts of potential economic shocks (for example, the 2008 financial crisis); and
- Use the information from these tests to advise the Ministry on optimal borrowing levels and on the response strategies, such as fiscal and economic policies, it could apply in the event of economic shocks
Recognizing the importance of maintaining the long-term sustainability of the province’s finances and debt, the Long-Term Report is responding to the OAGO recommendations by:
- Developing long-term demographic and economic scenarios for the province
- Defining the current COVID‑19 pandemic as an extraordinary circumstance, and navigating the economic shock presented by the crisis; and
- Discussing relevant measures to assess the province’s debt sustainability
Government policy responses to the analysis featured in the Long-Term Report would be considered as part of priority setting and decision making for future budgetary and fiscal publications.
Long-Term Economic and Demographic Scenarios
Developing demographic and economic scenarios provides the government with needed insight into the province’s ability to withstand various risks and potential outcomes. It also helps to inform the potential range for Ontario’s long-term fiscal sustainability, including impacts on the province’s funding and borrowing requirements, and debt and cost of debt outlook. The scenario and implications analysis can help to shape future fiscal and economic policies, including targeted response strategies in the event of an unforeseen scenario materializing.
Economic and demographic projections, including alternative scenarios, are presented in Chapter 1: Demographic Trends and Projections and Chapter 2: Economic Trends and Projections.
Extraordinary Circumstance of COVID‑19
The COVID‑19 pandemic has introduced significant uncertainty to global economic conditions.
In Ontario’s Action Plan: Responding to COVID‑19, the government outlined a $17 billion initial response, prioritizing supports to ensure the health care system, communities and the economy are positioned to weather the challenges and uncertainty ahead. These supports underlie the government’s $20.5 billion deficit projected in the March 2020 Economic and Fiscal Update for 2020–21, a deficit representing 2.3 per cent of forecasted GDP. Following on the requirement from the FSTAA and the recommendation of the OAGO, the government is defining the extraordinary circumstance for the planned 2020–21 deficit as the COVID‑19 pandemic and the necessary suite of government response measures.
Navigating the Crisis
Despite this economic shock and financial market volatility, the Province has maintained its ability to borrow in the face of uncertainty, a sign of Ontario’s ongoing financial stability and debt sustainability. In the month following the release of the March 2020 Economic and Fiscal Update,
Measures of Debt Sustainability
Net debt, expressed as a ratio of GDP, is widely acknowledged in literature and among financial experts, including the Office of the Parliamentary Budget Officer and the OAGO, as the primary indicator by which to measure debt sustainability. The ratio measures the relationship between a government’s obligations and its capacity to raise the funds needed to meet them, indicating the burden of government debt on the economy. This is why the government’s debt burden reduction strategy, required in the annual budget under FSTAA, must include Ontario’s specific objectives for the projected ratio of provincial net debt to Ontario’s GDP.
The government, however, recognizes the importance of transparency with respect to the affordability of Ontario’s debt, and accepts the OAGO recommendation to identify other relevant measures to assess debt sustainability. Drawing on past OAGO commentary regarding useful measures to assess government debt levels, as well as measures considered by bond rating agencies, other relevant measures under consideration for Ontario which were included in the March 2020 Economic and Fiscal Update consist of the following:
- Ratio of net debt-to-total revenue: indicates how much time it would take to eliminate the debt if the Province spent all its revenues only on debt repayment. Projected at 242.6 per cent for 2020–21, this means it would take almost 2.5 years to eliminate Ontario’s net debt if all revenues were devoted to it over that period
- Ratio of interest on debt expense-to-total revenue: represents the amount of every dollar the government receives that goes towards interest to service the province’s debt load. As highlighted by the OAGO, “the higher the proportion of government revenues going to pay interest costs on past borrowings, the lower the proportion available for spending in other areas.” This measure is highly sensitive to interest rate risk. Historically low interest rates over the past decade have helped to keep Ontario’s interest on debt-to-revenue ratio steady around 8 to 9 per cent. It was projected at 8.4 per cent for 2020–21
The identification of relevant measures represents a starting point to develop potential targets and the plans to meet these targets, and these are planned to be introduced in the 2020 Budget along with a multi-year fiscal outlook. This would be followed by ongoing monitoring and assessment of the fiscal implications of changing trends in these measures.
Enshrining the Importance of Fiscal Sustainability in Legislation
An important component of the government’s commitment to prudent financial management is modernizing the framework that governs fiscal planning through the recently enacted Fiscal Sustainability, Transparency and Accountability Act, 2019 (FSTAA). The FSTAA puts sustainability at the centre of Ontario’s fiscal planning as a guiding principle — it enhances transparency and public reporting, and includes provisions that bolster oversight and compliance measures for elected officials.
The FSTAA also requires a debt burden reduction strategy as part of the government’s fiscal plan, effectively making debt sustainability a key consideration in all government decisions.
The Parliamentary Budget Officer’s (PBO) Fiscal Sustainability Report, released in February 2020, recognized Ontario’s commitment to long-term sustainability and identified Ontario as one of four provinces with sustainable fiscal policy over the long term.
Alternative Scenarios and Risks
There are opportunities to more sustainably manage the growth in resources required to provide public services. These include reducing program enhancement growth below historical trends and improving the productivity of service delivery.
As outlined in Chapter 2: Economic Trends and Projections, productivity growth plays a significant role in driving overall economic growth. As government revenues are driven by economic growth, future fiscal sustainability could be heavily influenced by productivity.
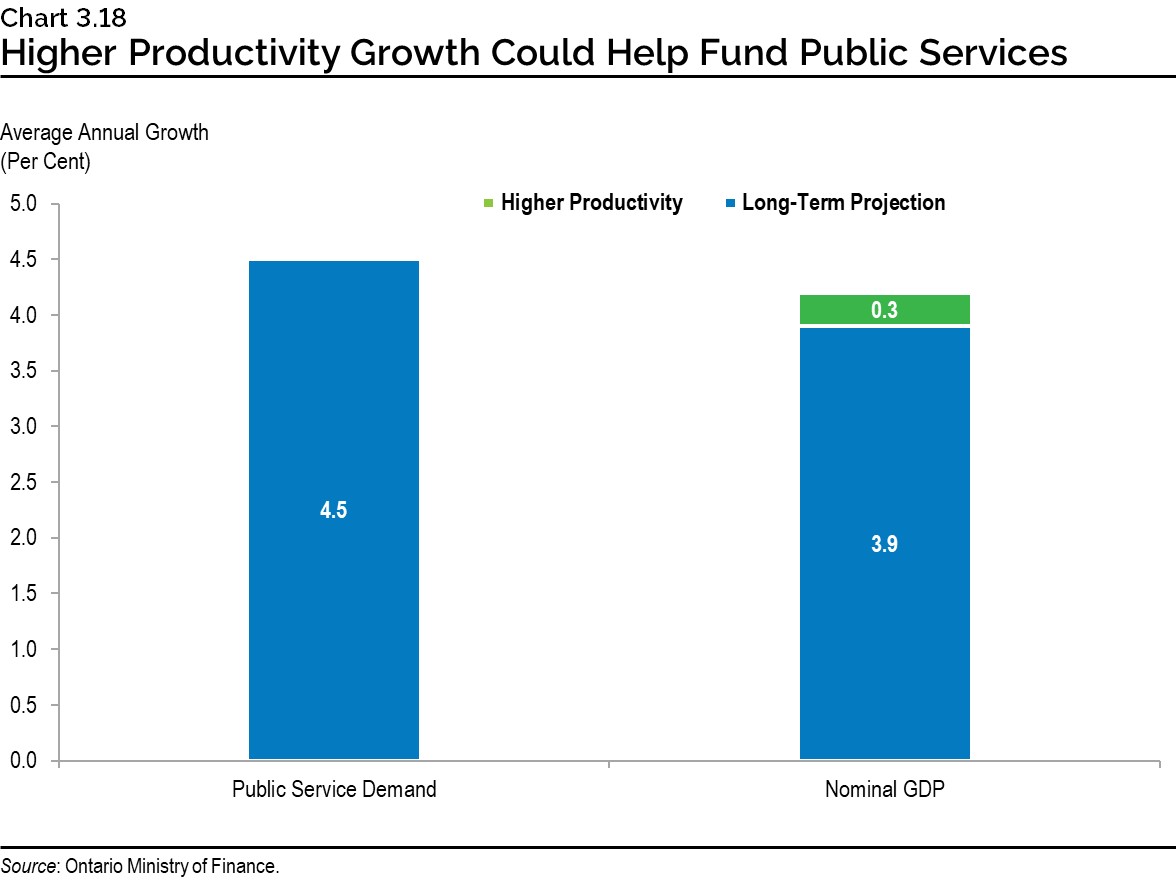
The economic projection assumes productivity growth of 1.1 per cent annually over the long term. In contrast, the high productivity scenario assumes growth of 1.4 per cent and the low productivity scenario assumes growth of 0.8 per cent.
Maintaining and enhancing productivity growth is essential to generating revenues necessary to fund public services. Under a high productivity scenario, Ontario’s higher average annual productivity growth of 0.3 percentage points compared to the base case projection would be expected to raise nominal GDP growth to 4.2 per cent, therefore providing important support to the projected 4.5 per cent growth in public services demand.
Alternatively, low productivity growth would lead to weaker revenue growth and fewer financial resources to meet the demand for public services, creating the potential for higher deficits that would increase the debt burden.
Potential Implications of COVID‑19 on Ontario’s Finances
The COVID‑19 pandemic could have significant and long-lasting consequences on government finances. A broad suite of unprecedented actions has been taken by governments and central banks in all parts of the world in order to prevent COVID‑19 from spreading further, and to protect the economy from facing an even deeper economic decline and sustained damage. As a result, government debts in many parts of the world are rising to unprecedented levels.
In the March 2020 Economic and Fiscal Update, the Ontario government announced immediate measures in order to respond to COVID‐19, including additional health care resources and contingencies, and direct support for people and jobs. The government’s plan also includes higher‐than‐usual reserve and contingency funds as a measure of prudence to protect against additional unforeseen adverse changes to revenue and expense.
For Ontario, the net result of these factors is a projected increase in the provincial debt over the near term. Rising debt levels, in both absolute terms and as a percentage of GDP, suggest that future debt servicing costs will be higher than they otherwise would have been. Potential lower future interest rates could mitigate this impact; however, interest rates are already historically low and cannot be expected to remain at current levels for extended periods of time. An eventual increase in interest rates, along with a larger debt portfolio arising from near-term deficits, will increase how much Ontario needs to spend on interest for every revenue dollar received. Effectively, a greater share of revenue will be required to service the province’s debt, leaving less revenue to fund the increasing demand for public services.
The full impact of COVID‑19 on government finances is subject to considerable uncertainty. Governments around the world face similar pressures and the eventual path to managing debt sustainability will require policy coordination across all levels of government.
Chart Descriptions
Chart 3.1: Past Trends in Government Services, Ontario, 1982 to 2019
This bar chart shows Ontario’s annual average growth in population, nominal GDP, and nominal government goods and servicesbetween 1982 and 2019. Population grew by 1.3 per cent, nominal GDP grew by 5.2 per cent, and nominal government goods and services by 5.3 per cent and.
Sources: Statistics Canada and Ontario Ministry of Finance.
Chart 3.2: Ontario Total Expense to GDP, 1981–82 to 2020–21
This line chart shows Ontario’s total expenses relative to nominal GDP between 1981–82 and 2020–21. Total expenses as a ratio to nominal GDP are expected to rise from 16.5 per cent in 1981–82 to 19.2 per cent in 2020–21.
Sources: Statistics Canada and Ontario Ministry of Finance.
Chart 3.3: Ontario Government Program Spending, 1981–82 to 2018–19
This line chart shows Ontario’s per cent share of total government program spending comprised of Health, Education and Training, and Other Program Expenditures between 1981–82 and 2018–19.
In 2018-19, the health care sector constituted the largest share of total program spending at 42 per cent, followed by education and training at 27 per cent. Over the past two decades the combined share of health and education as a share of total government expenditures has been increasing, while that of other program expenditures has declined.
Sources: Ontario Treasury Board Secretariat and Ontario Ministry of Finance.
Chart 3.4: Ontario Government Revenues, 2018–19
This chart shows the percent composition of total revenue in Ontario for 2018–19 by total taxation revenue (68.7 per cent), Government of Canada transfers (16.3 per cent), Income from government business enterprises (3.6 per cent), and other non-tax revenue (11.5 per cent).
Note: Numbers may not add due to rounding.
Source: Ontario Ministry of Finance.
Chart 3.5: Ontario Government Revenues, 1981–82 to 2018–19
This line chart shows the composition of Ontario’s total government revenue by source between 1981–82 and 2018–19. The lines represent total taxation revenue, income from government business enterprises, Government of Canada transfers, and other non-tax revenue.
Note: Revenues have been restated to reflect reporting changes and reclassifications.
Source: Ontario Ministry of Finance.
Chart 3.6: Fiscal Balance, 1981–82 to 2020–21
The bar and line charts show Ontario’s fiscal balance as a percent of GDP (represented by left-hand side axis) and fiscal balance in billions of dollars (represented by right-hand side axis) between 1981–82 and 2020–21.
Sources: Statistics Canada and Ontario Ministry of Finance.
Chart 3.7: Ontario Net Debt-to-GDP, 1981–82 to 2020–21
This line graph shows Ontario’s net debt as a percent of GDP between 1981–82 and 2020–21. The ratio rose from 10.4 per cent of GDP in 1981–82 to a peak of 40.5 per cent in 2014–15 before declining slightly to 39.5 per cent of GDP in 2018–19. It is projected to rise to 41.7 per cent in 2020–21.
Sources: Statistics Canada and Ontario Ministry of Finance.
Chart 3.8: Provincial Net Debt-to-GDP Comparisons
The bar charts show Ontario’s net debt as a percent of GDP in 2018–19 (left side chart), as well as change from 2008–09 to 2018–19 in net debt-to-GDP in percentage points (right side chart) for the Canadian provinces.
The left chart shows that Ontario had a net debt-to-GDP ratio of 39.5 per cent in 2018–19. Newfoundland and Labrador had the highest ratio at 46.4 per cent and Alberta the lowest at 8.0 per cent.
The right-side chart shows that Ontario had an increase in net debt-to-GDP ratio since 2008–09 of 11.7 percentage points. Newfoundland and Labrador had the highest increase in the ratio among all the provinces of 21.1 percentage points and Quebec had the largest decline of 2.9 percentage points.
Sources: Statistics Canada and Department of Finance Canada.
Chart 3.9: Growing Provincial Debt Supported by Low Interest Rates
This line chart shows Ontario’s net-debt-to-GDP ratio (represented by the left-hand side axis) as well as the interest on debt-to-total revenue ratio (represented by the right-hand side axis) between 1990–91 and 2020–21. Net debt-to-GDP rose from 13.4 per cent in 1990–91 to 39.5 per cent of GDP by 2018–19 and is expected to rise to 41.7 per cent of GDP by 2020–21. Interest on debt-to-total revenue rose from 7.3 per cent in 1990–91 to 8.1 per cent in 2018–19 and is expected to rise to 8.4 per cent by 2020–21.
Sources: Statistics Canada and Ontario Ministry of Finance.
Chart 3.10: Demand for Public Services Expected to Rise
This bar chart shows Ontario’s average annual growth of provincial public services demand for 1998 to 2018 and long-term projection. Between 1998 and 2018, provincial public services demand grew by 4.1 per cent. The long-term projection shows provincial public services demand will grow by 4.5 per cent, with population growing by 1.0 per cent, aging by 0.4 per cent, enhancement by 1.0 per cent and inflation by 2.2 per cent.
Note: Numbers may not add due to rounding.
Sources: Statistics Canada and Ontario Ministry of Finance.
Chart 3.11: School-Age Population in Ontario, 1971 to 2046
This line chart shows Ontario’s school-age population for children aged 4 to 13 years and aged 14 to17 years for the period 1971 to 2046. The figures prior to 2020 are historical, and they are projections between 2020 and 2046.
Sources: Statistics Canada for 1971–2019 and Ontario Ministry of Finance projections.
Chart 3.12: Postsecondary Participation and Population, Ages 18 to 24
These bar and line charts show Ontario’s population aged 18 to 24 years old (represented on left-hand side axis in number of people) and their participation rate (represented on right-hand side axis in per cent) in postsecondary education in Ontario between 1997 and 2017. The population rose from 1.032 million in 1997 to 1.339 million in 2017. The participation rate rose from 30 per cent in 1997 to 47 per cent in 1997.
Note: The postsecondary participation rate includes both domestic and international students in Ontario.
Sources: Statistics Canada and Ontario Ministry of Finance.
Chart 3.13: Past Trends in Ontario Government Price Inflation, 1993 to 2019
This bar chart shows consumer price index (CPI) inflation and government goods and services inflation calculated as average annual growth for the period 1993 to 2019. CPI inflation was 1.9 per cent and government goods and services inflation was 2.2 per cent.
Sources: Statistics Canada and Ontario Ministry of Finance.
Chart 3.14: Demand for Public Services Expected to Rise
This bar chart shows annual average growth of nominal GDP and provincial public services demand for the period 1998 to 2018 and long-term projection. Both nominal GDP and provincial public services demand grew by 4.1 per cent between 1998 and 2018. The long-term projection shows that nominal GDP will grow by 3.9 per cent and provincial public services demand will grow by 4.5 per cent.
Sources: Statistics Canada and Ontario Ministry of Finance.
Chart 3.15: Demand for Public Services Expected to Outpace GDP Growth
This line chart shows an index for Ontario’s projected long-term nominal GDP and public service demand from year 0 to year 20 (starting with year 0 being 100). The line shows that public service demand is above nominal GDP for the entire period, implying that public service demand growth would outpace nominal GDP growth over the projection.
Source: Ontario Ministry of Finance.
Chart 3.16: Nominal GDP Growth and Total Provincial Revenue
This bar chart shows Ontario’s average annual growth of nominal GDP and total provincial revenue for 1982–83 to 2018–19 and long-term projection. Between 1982–83 and 2018–19, nominal GDP grew by 5.2 per cent and total revenue grew by 5.6 per cent. The long-term projections show both nominal GDP and total revenue growing at 3.9 per cent.
Sources: Statistics Canada and Ontario Ministry of Finance.
Chart 3.17: Select Retirement Savings and Related Income, 1994 to 2017
This line and bar chart shows additions to savings, withdrawals from savings, and the net withdrawals from savings between 1994 and 2017 for Ontario. Additions to savings include Canada Pension Plan (CPP) premiums paid by employees and those self-employed, Registered Retirement Savings Plan (RRSP) income tax deductions and deductions for the employee portion of Registered Pension Plan contributions. Withdrawals from savings are shown as positive amounts and include reported income from CPP/Quebec Pension Plan, RRSP and other pension income. The chart shows that withdrawals from savings have been outpacing additions to savings, with a gradual increase in the net amounts.
Source: Ontario Ministry of Finance.
Chart 3.18: Higher Productivity Growth Could Help Fund Public Services
This bar chart shows Ontario’s nominal average annual long-term projection of growth of public service demand compared to nominal GDP economic growth. The left bar shows the public service demand growth of 4.5 per cent. The right bar adds the impact of higher productivity of 0.3 per cent to the base case nominal GDP growth of 3.9 per cent, thereby raising nominal GDP growth to 4.2 per cent.
Source: Ontario Ministry of Finance.
Footnotes
- footnote[1] Back to paragraph Demographic estimates between 2025 and 2045 are used to assess long-term demand for public services.
- footnote[2] Back to paragraph See Taxation Transparency Report, 2019, for more details - https://budget.ontario.ca/2019/fallstatement/transparency.html#section-4
- footnote[3] Back to paragraph Bartlett, R. & Lapointe, D. (2017). Fiscal Sustainability Report, 2017. Ottawa, ON: Institute of Fiscal Studies and Democracy.
- footnote[4] Back to paragraph Between March 26, 2020 and April 24, 2020.