Energy Conservation Measures
5.0 Energy Conservation Measures
5.1 Important Factors to Consider
There are a number of factors that need to be considered before implementing energy conservation measures at a sewage works. These factors include those that can affect the efficiency and effectiveness of treatment processes, as well as the cost-benefits of any changes to the operation or equipment used at a sewage works.
Any process or operational modifications to improve energy efficiency should not adversely affect effluent quality. Care should be taken to ensure that effluent discharge requirements are met. Similarly, the impact of any changes on biosolids quality should be considered where beneficial reuse is in place.
Energy conservation may require capital expenditure and/or an increase in O&M costs at a sewage works. The life cycle cost and cost-benefit analysis of the conservation measures should be reviewed and assessed before implementation to ensure that they are economically viable.
The current electricity market and pricing structure should be taken into account when looking at ways and means to reduce energy consumption and costs. Currently, energy costs in Ontario are based on supply and demand. The price can vary at different time of the day and week, and this should be factored in when making any changes that could affect the energy demand of a system or process as this could significantly affect energy costs.
5.2 Forms of Energy Used at Sewage Works
In order to understand the energy usage at sewage works, the form of energy consumed and the metering and/or billing associated with each energy form must be identified. Each sewage works has a unique energy profile. There exists the opportunity to structure energy usage based on the regional suppliers of energy, amount of energy consumed, size of energy provider, local regulations, the timing of energy usage and factors relating to energy conveyance within and to the sewage works (WEF, 2009). In broad terms, energy can be defined as the ability or capacity to do work and comes in various forms including chemical (i.e., burning), electrical, mechanical, thermal (i.e., steam), radiant, and nuclear.
The most common forms of energy used at sewage works are electricity, natural gas, fuel oil, propane, and steam (WEF, 2009). Biogas by-product from the operation of anaerobic digesters is also a commonly used energy source. Other renewable forms of energy such as solar, wind and geothermal may be used, although there is no wide-spread experience with these energy sources for sewage works.
Further information on forms of energy used at sewage works can be found in WEF (2009).
5.3 Typical Energy Use at Sewage Works
Energy consumption is dependent on many factors such as the volume and strength of sewage being treated, site location (e.g. climate, elevation), type of sewage treatment processes in operation, mode of operation (manual controls vs. automated controls), level of treatment required, and energy recovery processes that are in place.
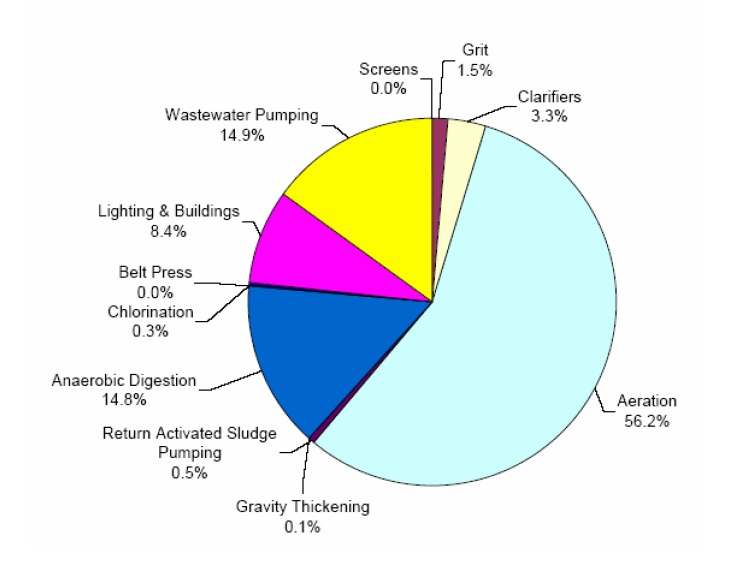
The following sections provide an overview of typical energy usage for various unit processes within a sewage works. Figures 5.1 and 5.2 present typical liquid and solids train treatment process stages, respectively. As can be seen from these figures, energy is used at each stage of the liquid and solids treatment trains and there is the potential for energy recovery at some stages. The relative amount of energy associated with each stage of the treatment process is shown by the size of the energy arrow. Figure 5.3 presents typical electricity requirements for a sewage works that uses activated sludge for secondary treatment. This figure does not include heating, ventilation and air conditioning (HVAC) and odour control, which can represent a significant fraction of energy used at some sewage works.
Information provided in this section was obtained from a number of sources, and in some cases it is unknown if energy use data for specific processes or equipment has resulted from best practices. Therefore, caution is recommended when using the data provided (e.g. for benchmarking purposes).
Further information on process-specific energy use at sewage works can be found in WEF (2009) and in WERF (2010c).
Figure 5.1 Typical Liquid Train Treatment Processes at Sewage Works
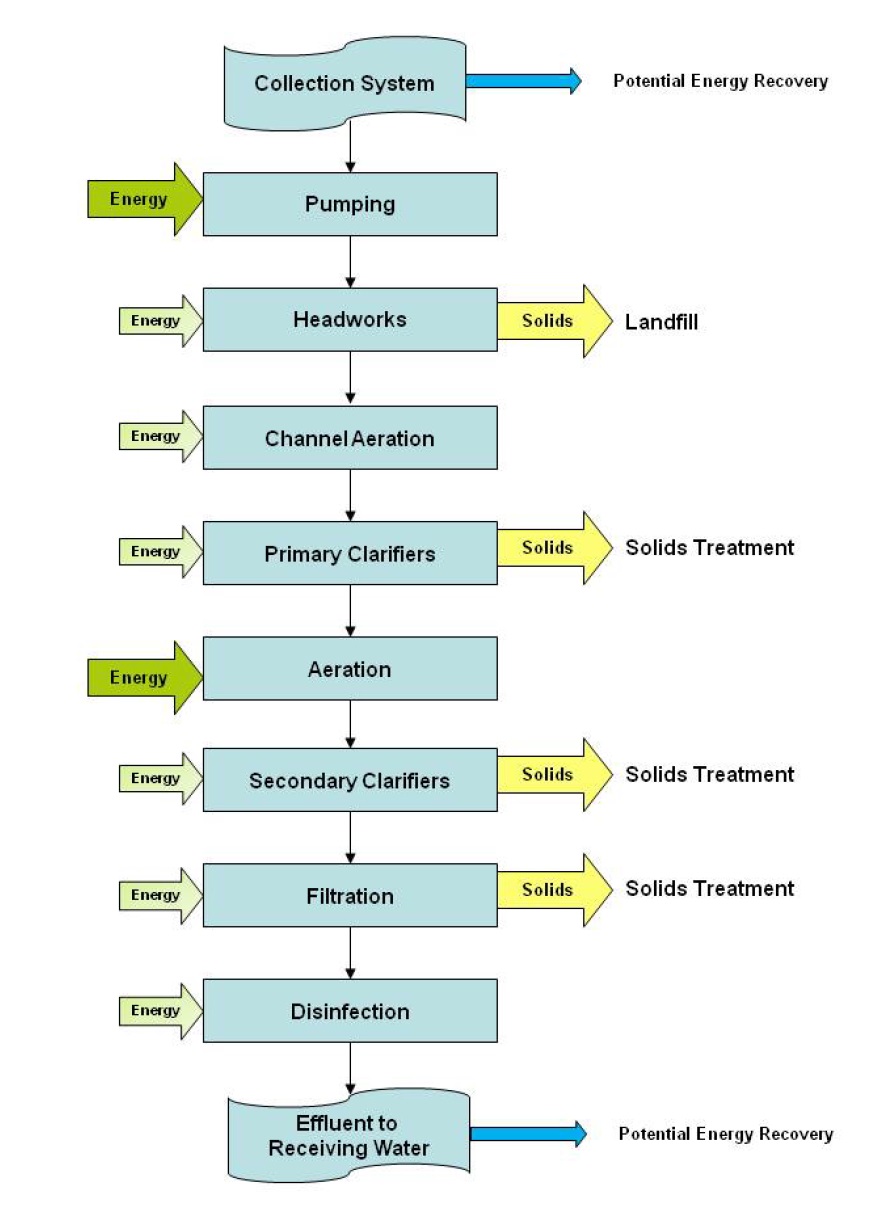
Figure 5.2 Typical Solids Train Processes at Sewage Works
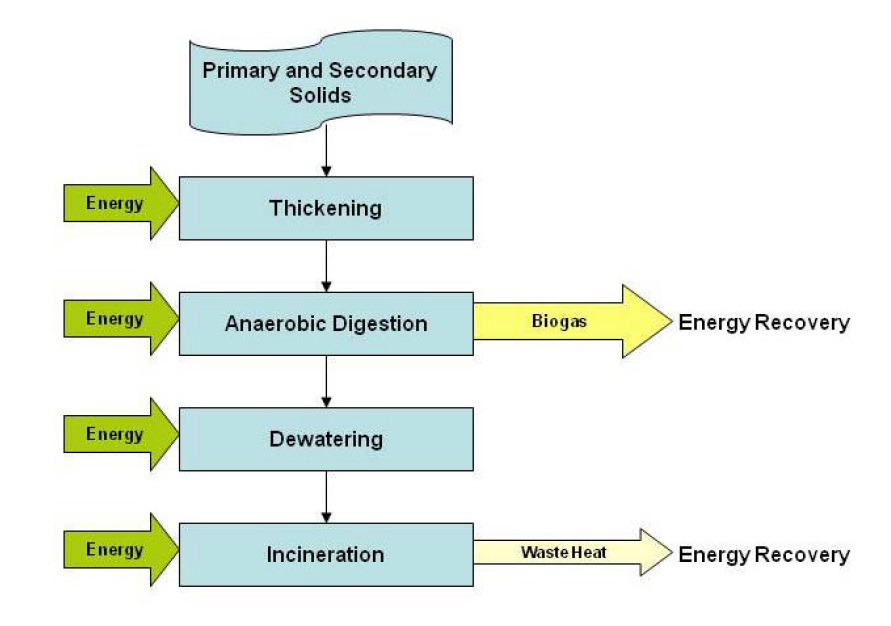
Figure 5.3 Electricity Requirements (Excluding HVAC) for Typical Conventional Activated Sludge Plant with Anaerobic Digestion, but without Mechanical Thickening/Dewatering (Adapted from SAIC, 2006)
5.3.1 Collection and Conveyance Systems
The energy associated with the collection and conveyance of sewage to a sewage treatment plant varies depending on the design of the sewage collection system and the topographical profile of the service area. Raw sewage pumping can account for between 15 percent and 70 percent of the total energy usage at a sewage treatment works and up to 90 percent if the energy required to operate all of the pumps in the collection system is considered (WEF, 2009).
From literature reviewed, 19 sewage works with flows ranging between 265 and 378,691 m3/d had energy requirements for sewage collection and conveyance, expressed as energy consumption per volume of sewage handled, of between 0 (for gravity flow systems) and 1.06 kWh/m3 (Environment Canada, 2006).
5.3.2 Preliminary Treatment
Preliminary treatment typically involves screening of influent followed by grit removal. Aerated channels may be used for preliminary treatment to keep solids in suspension prior to primary treatment, particularly at larger sewage treatment works.
Energy requirements for screening relate primarily to the screen cleaning process, which is typically a mechanical rake or water spray. The energy requirements for screening are minimal compared to overall sewage works energy use with screens sized to treat 60,480 m3/d requiring 0.55 kW motors (WEF, 2009).
Successful grit removal within a sewage works can result in higher treatment and energy efficiency in downstream treatment processes (i.e., sludge digesters). The actual energy requirement for grit removal is small in comparison with other unit processes and is dependent on the type of process in place. For example, vortex grit removal requires energy to transport the concentrated solids removed and to operate grit washers, while aerated grit removal requires blowers to introduce air into the chamber. Energy is used to provide air to aerated channels, which is dependent on the size and type of blower, as well as the aeration device used.
From literature reviewed, 22 sewage works with rated capacity flows ranging between 265 and 378,691 m3/d had combined energy requirements for screening and grit removal, expressed as energy consumption per volume of sewage treated, of between 0 (for a manually cleaned system) and 0.6037 kWh/m3 (Environment Canada, 2006).
5.3.3 Primary Treatment
Primary treatment involves the removal of settleable and floatable solids following preliminary treatment. Effective primary treatment can result in energy savings in downstream treatment process by, for example, decreasing the aeration requirements in the secondary treatment process and reducing solids handling and disposal requirements from the secondary clarifiers (WEF, 2009). Energy use in primary treatment depends on whether conventional primary treatment or chemically enhanced primary treatment (CEPT) is being used, or whether WAS is returned to the primary treatment stage for co-settling with raw sludge.
The energy requirements in conventional primary treatment are for (WEF, 2009):
- sludge and skimmer collection drives
- skimmings pumps and grinders
- sludge pumps
- channel aeration blowers
- exhaust fans
- supply fans.
With conventional primary treatment or with CEPT, pumping of the resulting primary sludge will represent a major portion of the energy used in primary treatment. The energy required for primary sludge pumping is very dependent on the process configuration, head losses and flows.
Use of CEPT can result in lower energy requirements in the aeration tank of the downstream secondary treatment process due to higher removals of biodegradable material than with conventional primary clarification. Conversely, compared with conventional primary clarification, additional energy is consumed in the CEPT process by pumping and mixing in the following areas (WEF, 2009):
- flash mixing
- polymer mixing
- polymer transfer pumps
- polymer addition pump;
- chemical mixing
- chemical transfer pumps.
Flash mixing typically represents the highest energy user within the CEPT process.
From a review of literature, eight sewage works with flows ranging between 3,332 and 378,691 m3/d had energy requirements for primary treatment of between 0.0009 and 0.0080 kWh/m3 (Environment Canada, 2006).
Microscreens, which are rotating drum filters with openings of typically less than 40mm, may be used as a primary treatment stage ahead of certain secondary treatment processes (e.g. membrane bioreactors, hybrid systems). Energy use by microscreens is for drum rotation and pumping backwash water for screen cleaning.
5.3.4 Secondary Treatment
Secondary treatment encompasses a large number of biological processes categorized as suspended growth, fixed film or a combination of both suspended growth and fixed film attributes known as hybrid processes.
Suspended Growth and Hybrid Processes
Suspended growth and hybrid processes maintain the microorganisms responsible for biological treatment in suspension through mixing. Although mixing can be accomplished mechanically, the most common suspended growth processes involve mixing by diffused aeration.
The highest energy consumer in the entire sewage treatment works is the aeration system associated with suspended growth and hybrid processes. For suspended growth processes, the aeration system can account for between 50 to 90 percent of the energy used at a sewage treatment works (WEF/ASCE, 1998). The energy usage for aeration systems is dependent on the type of aeration installed, process control systems in place, geometry of the aeration tank, sewage temperature, density of aerator placement, water depth and organic load. Table 5.1 presents a summary of aeration systems commonly used in biological treatment as well as typical clean water standard oxygen transfer and aeration efficiencies.
| Aeration System | Standard Oxygen Transfer Efficiency (%)1 | Standard Aeration Efficiency (kg O2/kWh)1 |
Advantages / Disadvantages |
|---|---|---|---|
| Fine Bubble Diffusers | 13 - 45 | 1.9 – 6.6 |
|
| Jet Aerators (fine bubble) | 18 – 25 | 2.2 – 3.5 |
|
| Mechanical Surface Aerators | - | 1.1 – 2.5 |
|
| Coarse Bubble Diffusers | 9 – 13 | 1.3 – 1.9 |
|
1 Clean water performance at standard conditions reported by manufacturers.
The level of treatment and type of process can impact energy usage associated with aeration. BNR treatment processes typically require higher energy input compared to processes not required to remove nitrogen and phosphorus. BNR processes typically require additional aeration for nitrification, pumping for internal recirculation of mixed liquor and sludge to various zones of the bioreactor, and possibly mechanical mixing in anoxic/anaerobic zones. Table 5.2 outlines the energy requirements for a number of activated sludge (AS) unit processes reviewed, which are categorized based on type of treatment, daily flow and type of aeration system in place.
| Process Type | Aerator Type | Sewage Flow (m3/d) |
Energy Use kWh/m3 |
Energy Use kWh/(kgBOD5 removed) |
|---|---|---|---|---|
| Non-Nitrifying AS | Fine Bubble | 6,438 | 0.3838 | 4.87 |
| Non-Nitrifying AS | Fine Bubble | 9,089 | 0.6280 | 3.93 |
| Non-Nitrifying AS | Fine Bubble | 43,549 | 0.2142 | 1.36 |
| Non-Nitrifying AS | Fine Bubble | 136,329 | 0.1070 | n/a |
| Non-Nitrifying AS | Coarse Bubble | 3,332 | 0.6166 | n/a |
| Non-Nitrifying AS | Diffused Aerator1 | 3,787 | 0.1563 | n/a |
| Non-Nitrifying AS | Diffused Aerator1 | 18,935 | 0.1559 | n/a |
| Non-Nitrifying AS | Diffused Aerator1 | 37,869 | 0.1557 | n/a |
| Non-Nitrifying AS | Diffused Aerator1 | 75,738 | 0.1541 | n/a |
| Non-Nitrifying AS | Diffused Aerator1 | 189,346 | 0.1532 | n/a |
| Non-Nitrifying AS | Diffused Aerator1 | 378,691 | 0.1528 | n/a |
| Non-Nitrifying AS | Surface Aerator | 40,520 | 0.0641 | n/a |
| Nitrifying AS | Diffused Aerator1 | 3,787 | 0.2501 | n/a |
| Nitrifying AS | Diffused Aerator1 | 18,935 | 0.2492 | n/a |
| Nitrifying AS | Diffused Aerator1 | 37,869 | 0.2490 | n/a |
| Nitrifying AS | Diffused Aerator1 | 75,735 | 0.2461 | n/a |
| Nitrifying AS | Diffused Aerator1 | 189,346 | 0.2443 | n/a |
| Nitrifying AS | Diffused Aerator1 | 378,691 | 0.2438 | n/a |
| Nitrifying AS | n/a | 18,935 | 0.2451 | 4.89 |
| Nitrifying AS | n/a | 20,449 | 0.3964 | 1.94 |
| Biological Nutrient Removal (including phosphorus) | Fine Bubble | 45,049 | 0.3951 | n/a |
| Biological Nutrient Removal (including phosphorus) | Fine Bubble | 114,020 | 0.2503 | n/a |
| Biological Nitrogen Removal plus Chemical Phosphorus Removal | n/a | 81,644 | 0.548 | n/a |
1 Not clear from original reference if this is fine pore or coarse bubble.
Additional suspended growth secondary treatment processes not shown in Table 5.2 include integrated fixed-film activated sludge (IFAS), oxidation ditches and extended aeration. IFAS systems are a combination of activated sludge and fixed film processes, whereby an inert media is suspended in the aeration tank together with mixed liquor, and sludge that is settled in the secondary clarifier is returned to the aeration tank. Oxidation ditches are low rate AS processes that treat sewage by providing mechanical aeration and mixing though channels in an oval reactor, typically with brush aerators. Extended aeration processes are suspended growth reactors with lower design organic loadings and longer hydraulic retention time within the aeration basin to compensate for the lack of primary clarification in the process flowsheet.
The energy requirement for IFAS systems is similar to that for conventional nitrifying activated sludge systems. A review of literature indicated that total energy usage for oxidation ditch and extended aeration-based sewage works ranged between 0.425 and 1.05 kWh/m3 (Monteith et al., 2007). The endogenous respiration requirements of these low-rate treatment processes with a high solids retention time (SRT) contributes to the increased aeration needs for these systems.
Fixed Film Processes
Fixed film processes, also known as attached growth processes, utilize microorganisms which are attached to inert media within the bioreactor. Fixed film processes can operate either anaerobically, anoxically, or aerobically depending on the configuration. To achieve effective treatment, the sewage and oxygen (for an aerobic process) must be brought in contact with the attached microorganisms that have formed a layer known as a "biofilm" on the inert support material contained in the reactor. Commonly utilized attached growth processes include trickling filters, rotating biological contactors (RBC), biological aerated filters (BAF), and moving bed biofilm reactors (MBBR).
The energy associated with a fixed film process depends greatly on the process in place. For example, energy is required in trickling filter processes for pumping to maintain a sewage recirculation rate of as much as three times the daily inflow. RBC processes require energy to rotate the contactors to provide mixing and oxygenation. From a review of literature, the total energy consumption for sewage works with RBC processes ranged from 0.2 to 0.35 kWh/m3 while the total energy required for sewage works with trickling filter processes ranged from 0.2 to 0.425 kWh/m3 (Monteithet al., 2007).
The BAF process is a high rate fixed film technology that uses energy for aeration and pumping. Influent is pumped through a submerged media, which can be fixed or floating. BAFs can be either upflow or downflow, with the downflow typically requiring less energy for influent pumping. Air is added either to the base of the bed or into the media itself. The media is intermittently backwashed to remove excess biofilm growth, and this operation requires pumping energy. Backwash water is typically returned to the headworks or primary clarifier, which requires energy for pumping. The overall electricity consumption for a nitrifying BAF was estimated at 0.65 kWh/m3 by one supplier (Degrémont, 2010).
The MBBR process is a fixed film technology in which the support media is maintained in suspension, usually using diffused aeration systems or in some cases using mechanical mixers. The energy requirements for MBBR processes compare closer to suspended growth processes than to other fixed film processes which do not require continuous mixing to ensure contact between the biofilm and substrate. For fixed film processes, such as the MBBR, there is typically a requirement to maintain a minimum DO concentration of 2 mg/L in the aeration tank bulk liquid to overcome the diffusional limitation in the biofilm. In general, however, the energy requirements for fixed film processes are lower than for suspended growth processes, with the exception of BAF and MBBR processes. The overall electricity consumption for a nitrifying MBBR was estimated at 0.80 kWh/m3 by one supplier (Degrémont, 2010).
BAF and MBBR systems will typically use more energy than other fixed film processes such as trickling filters and RBCs, but may use less than activated sludge processes due to lower sludge pumping requirements.
Secondary Clarification
The final step of the secondary treatment process is typically secondary clarification which requires relatively little energy. Sludge collection mechanisms require motors which vary in size depending on the configuration and size of the tanks. Typically, the motors required are in the range of 0.5 to 1.5 kW but, in the case of large chain and flight collectors used in rectangular clarifiers, motor size might increase to 3 to 5 kW (WEF, 2009). Energy is also required to pump the return activated sludge (RAS), where applicable, waste activated sludge (WAS) and scum or foam.
Membrane Separation
Solids separation in secondary treatment can also be carried out using membranes. Treatment using membrane systems can be broken up into numerous types including pressurized (side stream) and submerged membrane bioreactors (MBRs). The energy use associated with filtration for the two MBR configurations can vary greatly, with pressurized side stream membrane energy use ranging from 2 to 10 kWh/m3 of water produced compared to submerged membranes utilizing 0.2 to 0.4 kWh/m3(Côté et al., 1998; Paranjape et al., 2010). The latter energy requirement includes air supply for membrane scouring for submerged membrane systems (which is typically around 30 - 45 percent of the energy use), but does not include energy for biological process aeration.
Treatment of wastewater using MBRs incorporates microfiltration or ultrafiltration into the activated sludge process. The process replaces the need for conventional secondary clarification and typically operates at higher mixed liquor suspended solids (MLSS) concentrations than in conventional activated sludge (CAS). The process is generally considered to be energy-intensive, as energy is used to:
- mix the higher MLSS concentration using aeration
- continuously or intermittently scour the membranes for cleaning purposes using aeration
- provide adequate oxygen to the activated sludge
- recirculate mixed liquor to provide cross-flow velocity for pressurized MBR systems, or to prevent over-concentrating the MLSS in the membrane zone for submerged membrane systems.
In addition, energy may be required to maintain the pressure across the membrane to drive the solids separation process. Typically, energy usage associated with the microfiltration processes is approximately 0.4 kWh/m3 (Metcalf & Eddy, 2003). This is in addition to energy used for aeration in the bioreactor. Energy associated with maintaining a pressure gradient across membranes is lower for flat-plate systems that use gravity or gravity-assisted pumping, which can be used when the hydraulic gradient is sufficient to overcome the transmembrane pressure (Gellner, 2008).
5.3.5 Tertiary Treatment
Tertiary treatment involves a process stage after secondary treatment and prior to disinfection to remove total suspended solids (and total phosphorus) that are not adequately removed by secondary treatment. There are several tertiary treatment processes including granular media filtration, microscreens, and membrane microfiltration and ultrafiltration.
In granular media filtration, the influent enters the filter through an inlet channel and, after passing through the media, is collected in the underdrain system. Energy is needed in granular media filtration for backwashing of the filters and, in some cases depending on plant hydraulics and filter design, to pump the secondary effluent to the filters. A review of six sewage works treating flows of between 3,790 and 378,700 m3/d indicated that granular media filtration processes required approximately 0.029 kWh/m3of energy (Environment Canada, 2006).
Microscreens use rotating drum filters with small openings (typically less than 40µm) that are continuously backwashed. Solids that are collected on the screen are backwashed using high-pressure jets. Energy is used for rotating the drum and pumping backwash water.
Microfiltration and ultrafiltration can be utilized to filter settled secondary effluent with typical energy consumption of 0.4 kWh/m3for microfiltration (operating pressure of 7 - 100 kPa) and 0.5 to 3.0 kWh/m3 for ultrafiltration (operating pressure of 70 - 700 kPa). The actual energy use for filtration processes will depend on the characteristics of the feed (i.e., level of treatment prior to filtration) and process configuration (pressurized versus submerged) of the membranes (Metcalf & Eddy and AECOM, 2007).
5.3.6 Quaternary Treatment
Quaternary treatment involves advanced sewage treatment processes, including NF, RO, GAC and advanced oxidation. These processes have been developed to remove suspended, colloidal and dissolved constituents that remain in the effluent after conventional secondary and tertiary treatment, such as microconstituents (i.e., pharmaceuticals, personal care products and endocrine disruptors). The removal of these substances may be needed if enhanced effluent quality is required, for example, for water reclamation/reuse.
Quaternary treatment requires that enhanced upstream secondary and tertiary treatment be used. Although there is an energy requirement with advanced secondary and tertiary treatment, it will reduce the costs associated with quaternary treatment processes by reducing the size of the latter process and/or its O&M costs.
Nanofiltration
NF membranes are used to remove particles as small as 0.001µm (Metcalf & Eddy, 2003). Disinfection requirements following NF are minimized owing to the removal of bacteria, viruses, and some inorganic and organic constituents. The typical energy requirement for an NF process operating at a pressure of between 350 and 550 kPa is 0.6 to 1.2 kWh/m3 (Metcalf & Eddy and AECOM, 2007).
Reverse Osmosis
The RO process involves the removal of dissolved constituents by creating a pressure gradient across a semi-permeable membrane. Osmosis is a naturally occurring process in which the concentration of dissolved constituents will tend towards equilibrium across the semi-permeable membrane (i.e., with water tending to diffuse through the membrane from the lower concentration to the higher concentration side). In RO, pressure is applied which reverses the direction of flow and therefore dissolved constituent concentrate on one side of the semi permeable membrane. Due to the energy required to apply pressure to reverse the natural flow across the membrane, RO is an extremely high energy consuming process. The energy requirement of the RO process depends greatly on the amount of pressure applied to the membrane by high pressure pumping. Energy consumption of between 1.5 and 2.5 kWh/m3 can be expected for operating pressures of 1,200 kPa and 1,800 kPa, respectively (Metcalf & Eddy and AECOM, 2007). The RO process has a relatively high energy requirement compared to other quaternary treatment systems due to the high pressure pumping required (Monteith, 2009).
Granular Activated Carbon
GAC can be used to remove microconstituents using adsorption. Energy is consumed in the activated carbon adsorption process for pumping to overcome head loss in the contacting mode. It is also used to transfer carbon from storage silos or carbon delivery trucks to the activated carbon filters. The regeneration of spent carbon requires fuel for thermal regeneration to operate a pyrolysis furnace or to furnish steam. In some cases, carbon systems use chemicals such as caustic soda for regeneration. Carbon regeneration is typically carried out off-site by the carbon supplier.
Advanced Oxidation
Advanced oxidation processes are used to oxidize complex organic constituents that are difficult to degrade. The process involves generating a strong oxidant such as hydroxyl free radicals that potentially mineralize the dissolved constituents. Chemicals such as hydrogen peroxide, Fenton’s reagent and ozone can be used, with or without UV irradiation and specific catalysts. Energy requirements for advanced oxidation will be affected by the type and concentration of organic material in the influent to this process, and is also dependent on the type of advanced oxidation process used. The total energy requirement for advanced oxidation processes that combine UV and ozone is between 0.22 kWh/m3 and 0.42 kWh/m3 (Monteith et al., 2007).
5.3.7 Lagoon-Based Systems
There are several types of lagoon systems including facultative, partially mixed and aerated. Lagoons require little, if any, energy for pumping if they are sited to allow gravity flow. In some cases, pumping may be required if the lagoon inlet elevation is higher than the collection system. Pumping may also be required at the outlet of the lagoon if the receiver or route to the receiver is higher than the lagoon liquid surface elevation. The frequency of discharge can either be continuous, seasonal (i.e., discharge over weeks or months during specific times of the year) or annual (i.e., discharge over a limited time period, once a year), which can impact the energy use.
As facultative lagoons are passive systems, no other energy inputs are required, unless an aerator or mixer is used to prevent freezing. Aerated lagoon-based systems involve mixing and oxygen transfer in order to both satisfy the oxygen requirement as well as to maintain the suspended solids in suspension (U.S. EPA, 2002). Partially mixed systems provide oxygen to the system to satisfy only the oxygen requirement.
Aeration systems for lagoons are the same as discussed in Section 5.3.4. The energy requirements for aerated lagoons vary greatly based on type of aerator and operating depth of lagoon. The power requirement for partially mixed systems varies as well depending on configuration and depth, but in general is between 1 and 2 W/m3 of lagoon volume (U.S. EPA, 2002).
A lagoon’s configuration can greatly impact the energy used as, in a multiple cell lagoon, each cell can operate under different aeration and mixing conditions. For example, a three-cell lagoon can operate one cell as aerated followed by a partial mixed cell with the final cell operating as a facultative lagoon. From a review of literature available, the typical energy use for lagoons ranges from 0.1 to 0.4 kWh/m3 of sewage flow (Monteith et al., 2007).
5.3.8 Disinfection
Energy usage for disinfection varies depending on the process. In this section, only chlorination/dechlorination and UV irradiation are discussed, which are the most common wastewater disinfection processes.
Chlorination/Dechlorination
The most common type of disinfection process is chlorination using chlorine gas or bulk hypochlorite solution, which requires minimal electrical energy. The energy that is required for chlorination is utilized in the evaporators, and for pumping of dilution water and the chlorine solution. If the process involves onsite hypochlorite generation, the energy requirements will be considerably larger with 2.5 kWh required to produce 1 kg of equivalent chlorine as a 0.8 percent sodium hypochlorite solution (WEF, 2009).
The dechlorination process can be utilized after chlorination to remove excess chlorine prior to discharge. Dechlorination is accomplished by adding sulphur dioxide gas or sulphite salt solution to the effluent in a manner similar to that used in chlorination. Similar to chlorination, energy usage in dechlorination is relatively low. A review of information for plants sized 12,960 to 509,760 m3/d indicated that disinfection using chlorination/dechlorination represented 0.2 percent of the total energy usage of the sewage works (WEF, 2009). A review of a small number of plants ranging in size from 3,780 to 378,700 m3/d had electricity consumption ranging from 0.0003 to 0.0007 kWh/m3 (Environment Canada, 2006). Other data indicate that electricity consumption for chlorination processes range from 0.001 to 0.0079 kWh/m3(NYSERDA, 1995; Evans and Laughton, 1994).
UV Irradiation
UV disinfection is accomplished by sewage effluent flowing past lamps which emit an electromagnetic spectrum containing germicidal wavelengths. There are three types of UV lamps which can be utilized in disinfection; low pressure, low output (LPLO), low pressure, high output (LPHO), and medium pressure. Medium pressure lamps have a lower energy conversion efficiency (i.e., to biocidal output) than low pressure lamps. An LPLO UV lamp generates a broad spectrum of essentially monochromatic radiation with an intense peak at 254 nm and a lesser peak at 185 nm. A medium pressure UV lamp generates a polychromatic irradiation in the order of 50 to 100 times the total UV-C output of LPLO UV lamps (Metcalf & Eddy and AECOM, 2007).
In terms of total energy usage, LPHO UV systems use the least energy followed by LPLO systems and medium pressure systems. A LPLO lamp requires 40-80 W per lamp whereas a medium pressure lamp requires 1-25 kW per lamp (Environment Canada, 2006). The power usage for UV systems depends on a number of factors including:
- power usage per lamp
- number of UV lamps needed
- the efficiency of the lamps to convert electrical energy to UV output required.
One medium pressure lamp is able to provide the same disinfection dose as 10 low pressure lamps and therefore requires much less maintenance time than the low pressure systems. Large sewage works typically install medium pressure lamps due to the lower maintenance requirements, whereas smaller sewage works typically choose low pressure systems, and justify the higher maintenance needs by the energy cost savings.
Table 5.3 compares the energy consumed by chlorination/dechlorination and various types of UV lamps for a 68,140 m3/d sewage treatment plant as an example. Although energy consumption of the UV process is greater than for chlorination/dechlorination, there is the benefit of no harmful residual byproduct chemicals in the disinfected effluent.
A literature review of three sewage works treating flows between 5,302 and 162,837 m3/d utilizing low pressure UV lamps had energy usage of between 0.0451 and 0.0660 kWh/m3(Environment Canada, 2006). In comparison, four sewage works treating flows between 1,136 and 79,525 m3/d operating medium pressure UV lights had energy usage for the UV system of between 0.123 kWh/m3 and 0.147 kWh/m3 (Environment Canada, 2006).
| Type of Disinfection | Average Annual Energy Consumption (kWh) |
|---|---|
| Chlorination / Dechlorination | 144 |
| Low Pressure / High Output (LPHO) UV | 1080 |
| Low Pressure / Low Output (LPLO) UV | 1440 |
| Medium Pressure (MP) UV | 4560 |
5.3.9 Solids Management
Handling and management of solids generated by the treatment processes of sewage works can account for a large portion of the energy consumption for a facility. However, sludge management, specifically anaerobic digestion, can potentially generate energy to power itself and other processes within the sewage works. Processes encompassed in sludge management can include: thickening, dewatering, stabilization (i.e., aerobic or anaerobic digestion), drying and incineration.
Thickening and Dewatering
Sludge/biosolids thickening and dewatering are processes that involve physically removing a portion of the liquid from the solids to increase the efficiency of downstream processes such as digestion and incineration. Energy use for sludge/biosolids thickening and dewatering varies depending on the process. Thickening processes include co-settling of WAS in primary clarifiers with raw sludge, gravity settling, dissolved air flotation, centrifugation, gravity belt and rotary drum. A literature review of six sewage treatment works treating between 3,787 and 378,691 m3/d sewage found that the energy use for dissolved air flotation thickening ranged between 0.0331 and 0.0505 kWh/m3(EPRI, 1996). A review of seven sewage treatment works treating between 3,787 and 378,691 m3/d found that the energy use for belt filter press solids dewatering ranged between 0.0041 and 0.0111 kWh/m3(EPRI, 1996; NYSERDA, 1995). A review of three sewage works using centrifuges to dewater solids found that energy use ranged between 0.0413 and 0.1888 kWh/m3(Evans and Laughton, 1994; NYSERDA, 1995).
Digestion
Sludge is stabilized using the digestion process. Digestion can be carried out anaerobically or aerobically. For both types of digestion, the process can be operated in the mesophilic or thermophilic temperature range. Mesophilic anaerobic digestion is the most common type used in sewage works.
For all types of digestion, energy is required to increase the temperature of the feed to the digester tanks (feedstock) and/or maintain the desired operating temperature within the digester. Natural gas and/or biogas (from anaerobic digestion) may be used as the energy source for digester heating. Typically, a hot water/sludge heat exchanger is used on sludge recirculation lines, using natural gas or biogas as the fuel source for the boiler. Other means of heating digester sludge include steam injection and pre-pasteurizationor other thermal pretreatment processes. In addition to energy consumed to heat sludge, electrical energy is required for mixing and pumping of raw and digested sludge.
Digester Mixing
Mixing energy is a relatively minor component of total energy used by digestion. However, there are significant differences in energy used for this part of the process, depending on the type of mixer used, shape of the digestion tank and concentration of solids in the digester.
Anaerobic digester mixing can be accomplished using compressed biogas, mechanical turbines, or sludge recirculation. Typical power demand for anaerobic digester mixing is between 5 and 8 W/m3 (WEF, 2009). The shape of egg-shaped digesters allows for improved recirculation of the digester contents and can have lower energy requirements for mixing. However, they have a greater exposed surface area and therefore may have greater heat loss than more conventional cylindrical tanks (WEF, 2009). The concentration of solids in a digester can impact energy used for effective mixing, with higher solids levels requiring more mixing energy.
Aerobic Digestion
Stabilizing sludge through aerobic digestion is an energy consuming process due to the high aeration requirements for satisfying the oxygen demand and for mixing. A review of one sewage works treating 2,840 m3/d of sewage and aerobically digesting sludge indicated theenergy use associated with digestion was 0.1901 kWh/m3(Environment Canada, 2006).
Anaerobic Digestion
Stabilization of sludge using anaerobic digestion is unique as the process not only consumes energy, but can concomitantly generate energy in the form of biogas that can be recovered and used to decrease the total sewage works energy requirements. Biogas can be used as an alternative fuel to natural gas to fire boilers for heating the digester and for plant heating and hot water systems. It may also be used as an energy supply for incineration. There are other options for energy recovery from biogas, which are discussed in Section 5.5.12. Biogas that is not used must be flared off to the atmosphere. Approximately 20 percent of the total digester biogas produced in Canada is flared (CH2M Hill, 2000), which is a significant source of GHG emissions directly from sewage treatment works.
Energy is required in the process to increase the temperature of the sludge to above the required operating temperature of 35°C for mesophilic digestion and above 55°C for thermophilic digestion. In Canada, the form of energy utilized to heat the sludge is usually a combination of the biogas from the digester and natural gas (Environment Canada, 2006). Anaerobic digestion is the largest natural gas user at a sewage works, the other use typically being for space and building heating. A review of thirteen sewage works treating between 2,960 and 711,900 m3/d of sewage were reported to consume between 72.5 and 11,144,000 m3/d of natural gas to stabilize sludge using mesophilic anaerobic digestion (Environment Canada, 2006).
Thermophilic anaerobic digestion requires additional heating in order to operate at the elevated temperature of 55°C. The majority of the increased energy required for thermophilic anaerobic digestion is to increase the temperature of the feedstock, which during winter can double the energy requirements for this part of the process. As the SRT for thermophilic process can be less than for mesophilic digesters, the energy requirements can be somewhat offset in comparison to mesophilic anaerobic digesters.
A review of eleven sewage works treating between 2,956 and 378,691 m3/d of sewage indicated that electrical energy usage for the anaerobic digestion process ranged between 0.0149 kWh/m3 and 0.1137 kWh/m3 (EPRI, 1996; Environment Canada, 2006).
Sludge/Biosolids Drying
There are three types of solids drying processes, one which uses thermal energy to evaporate water and increase the solids content, another that uses ambient air-drying to accomplish reduced moisture content of sludge/biosolids, and a third that uses solar energy. The energy requirements for drying processes can vary greatly depending on the process used.
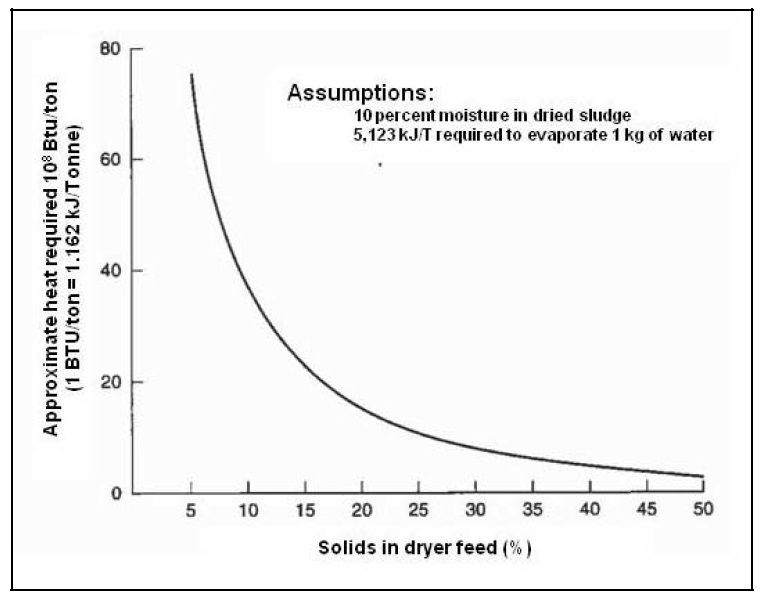
Thermal evaporative processes require considerable energy as a great deal of energy is needed to raise the temperature of the water in the solids to the point to allow it to evaporate and vaporize the water. Thermal drying methods can be direct or indirect, depending on the way that thermal energy is transferred to the sludge/biosolids (U.S. EPA, 2010d). Figure 5.4 illustrates the energy requirements and shows that the energy required decreases as the solids content increases. The energy required for thermal drying includes fuel/thermal energy and electricity for equipment operation, with a typical efficiency rate of 905 to 1,100 kWh per tonne of water evaporated (1,400 - 1,700 Btu per pound) (U.S. EPA, 2010d).
Ambient-air-based evaporative drying processes require considerably less energy to operate than thermal evaporative processes, with the majority of the energy required for pumping of sludge and mechanically maintaining the evaporative beds (Wang et al., 2007). The disadvantage of ambient air drying is that it has a significantly greater footprint than thermal drying and may not be a practical option for many sewage works.
Solar drying systems use less energy than thermal drying systems, and have a reduced footprint when compared to ambient drying systems. In these systems, the solids drying bed is enclosed within a greenhouse-type structure and solar energy is used to enhance the evaporative drying process. Drying can be enhanced by heating the floor of the structure, and this heat can be provided using waste heat from effluent. Energy is needed in solar drying for turning and conveying the sludge/biosolids, and for ventilation. The amount of energy needed for this process is estimated to be 30 – 40 kWh/tonne of water evaporated (Parkson Corporation, 2010).
Figure 5.4 Estimate of Energy Required for Thermal Evaporative Drying of Sewage Sludge as a Function of Dryer Feed Solids Content (Adapted from Wang et al., 2007)
Incineration
Incineration can be used as a sludge destruction process. Assuming the sludge is adequately dewatered, this process can require relatively small amounts of energy and can almost be a self-reliant process as energy and heat can potentially be recovered. A literature review of two sewage works using incineration to destroy the sludge from the treatment of sewage flows of 95,430 m3/d and 136,329 m3/d indicated energy requirements of 0.0596 kWh/m3 and 0.0366 kWh/m3, respectively (NYSERDA, 1995). The type of sludge incinerated impacts the amount of energy required for incineration as undigested sludge has a higher heating value than digested sludge. The calorific value of sludge is dependent on the composition of the solids being digested, as shown in Table 5.4.
Electrical energy is used by incineration to drive pumps, fans and conveyors, as well as for air pollution control equipment. The amount of electrical energy used is dependent on the incinerator type and how it is operated. Multiple-hearth furnaces use between 130 to 240 kWh/dry tonne of electrical energy and fluidized bed furnaces use between 220 to 400 kWh/dry tonne (WEF, 2009).
| Type of Solid | Calorific Value (MJ/kg Total Dry Solids) |
|---|---|
| Primary Sludge | 20 - 28 |
| Activated Sludge | 16 - 22 |
| Digested Sludge | 10 - 15 |
| Grease and Scum | 39 |
| Screenings | 21 |
5.3.10 Odour Control
Controlling odours from sewage works requires a varying amount of energy, depending on the processes and equipment in place. Typical energy consuming components of odour control processes include fans. There is limited data on energy use by odour control processes. There is likely to be little difference in energy usage for different types of odour control systems, as the majority of energy used will be for moving foul air to the odour control process. The amount of energy used in odour control, which is dependent on the amount of air that is moved, may be significant.
5.3.11 Heating, Ventilation and Air Conditioning
Energy use relating to HVAC at a sewage works can vary seasonally and is dependent on the plant layout, climate, and degree of sewage works enclosure. An audit should be conducted by a HVAC specialist to determine the energy use by HVAC and to identify if there is an opportunity for energy conservation through changes to the HVAC system. However, this is limited due to the minimum air exchange requirements needed to meet the standards under NFPA 820.
5.3.12 Miscellaneous Energy Use
There are numerous energy using equipment and processes that are not directly related to a specific sewage treatment process. Miscellaneous energy use in sewage works can result from (WEF, 2009):
- sump pumps
- compressed air used in auxiliary services and for instrument air
- hoisting cranes
- pumping potable or service water
- instrumentation
- electrically operated valves
- digester gas flares
- building lighting,
- floor washing machine.
The amount of energy use associated with these areas varies greatly between sewage works and should be looked at on a case-by-case basis to determine if energy conservation is feasible and to identify the most appropriate methods to use.
5.3.13 Summary of Energy Use
Table 5.5 provides a summary of the typical reported process-specific energy use data discussed in the above subsections. The values provided should be read in the context of the information given in the above subsections. It should be noted that these data will be affected by site-specific factors (e.g. wastewater flow and load, treatment requirements, equipment specifications, hydraulic gradients) and therefore are not intended to be used for benchmarking purposes.
| Process or Equipment | Typical Energy Use | Comment |
|---|---|---|
| Collection and conveyance pumping | 0 to 1.06 kWh/m3 | Gravity systems use no energy
Typically between 15 and 70 percent of total energy use by treatment works is for raw sewage pumping |
| Preliminary treatment – screening and grit removal | 0 to 0.6037 kWh/m3 | No energy use for manually cleaned systems |
| Primary treatment | 0.0009 to 0.008 kWh/m3 | Excludes microscreens |
| Secondary treatment – suspended growth processes: Non-nitrifying activated sludge | 0.0641 to 0.6280 kWh/m3 | |
| Secondary treatment – suspended growth processes: Nitrifying activated sludge | 0.2438 to 0.3964 kWh/m3 | |
| Secondary treatment – suspended growth processes: Oxidation ditch and extended aeration | 0.425 to 1.05 kWh/m3 | |
| Secondary treatment – suspended growth processes: BNR | 0.2503 to 0.3951 kWh/m3 | |
| Secondary treatment – suspended growth processes: BNR + chemical P removal | 0.548 kWh/m3 | |
| Secondary treatment – fixed film processes: Trickling filter | 0.2 to 0.425 kWh/m3 | |
| Secondary treatment – fixed film processes: RBC | 0.2 to 0.35 kWh/m3 | |
| Secondary treatment – lagoons | 0.1 to 0.4 kWh/m3 | |
| Secondary treatment – solids separation: Conventional clarification | 0.5 to 5 kW | Motor size – larger motors required for large chain and flight collectors |
| Secondary treatment – solids separation: Membrane filtration | 0.4 kWh/m3 | For microfiltration |
| Tertiary treatment - Granular media filtration | 0.029 kWh/m3 | |
| Tertiary treatment - Microfiltration | 1.4 kWh/m3 | |
| Tertiary treatment - Ultrafiltration | 1.5 to 3 kWh/m3 | System configuration dependent |
| Quaternary treatment - Nanofiltration | 0.6 to 1.2 kWh/m3 | |
| Quaternary treatment - RO | 1.5 to 2.5 kWh/m3 | |
| Quaternary treatment - Advanced oxidation | 0.22 to 0.42 kWh/m3 | |
| Disinfection - UV | 0.0451 to 0.147 kWh/m3 | |
| Disinfection - Chlorination / dechlorination | 0.0003 to 0.0079 kWh/m3 | |
| Solids management - Thickening | 0.0331 to 0.0505 kWh/m3 | For dissolved air flotation |
| Solids management - Dewatering | 0.0041 to 0.0111 kWh/m3 | For belt filter press |
| Solids management - Dewatering | 0.0413 to 0.1888 kWh/m3 | For centrifugation |
| Solids management - Aerobic digestion | 0.1901 kWh/m3 | |
| Solids management - Anaerobic digestion | 0.0149 to 0.1137 kWh/m3 | |
| Solids management - Drying | 905 to 1,100 kWh/tonne of water evaporated | For conventional thermal dryers |
| Solids management - Drying | 30 to 40 kWh/tonne of water evaporated | For solar drying systems |
| Solids management - Incineration | 130 to 240 kWh/dry tonne | Electricity for multiple hearth |
| Solids management - Incineration | 220 to 400 kWh/dry tonne | Electricity for fluidized bed |
5.4 Energy Management Plan
To implement a successful and cost-effective energy conservation program for an existing sewage works, the first step should be the preparation of a comprehensive energy management plan. A good energy management plan should provide leadership and clear direction on the approach and processes involved in implementing energy conservation measures at a sewage works.
The following sections provide an overview of the energy management planning process. Additional sources of information on preparing and implementing an energy management plan can be found in Section 5.4.2.
Although the energy management planning process described below is aimed at existing facilities, energy management should also be a part of the planning and design of facility upgrades or when designing and constructing new sewage works. In these cases, consideration should be given to the energy usage of all equipment, processes and systems to determine if a less energy intensive alternative can be used. The MOE Design Guidelines for Sewage Works (2008) provides some guidance on energy conservation in the design of new and expanded sewage works.
5.4.1 What is an Energy Management Plan
An energy management plan is a planning document that acts as a single source for all the critical information, steps, resources, and methods needed to make efficient and effective changes to reduce energy demand. It will allow the critical information to be gathered before decisions are made on changes to energy using equipment, processes or systems, and provides clear direction to ensure energy conservation measures that are implemented are effective.
There are six main steps to an energy management plan, which are:
- committing to achieving a reduction in energy use and setting targets for reduction
- establishing past, current, and future energy consumption, which is done by conducting an energy assessment (also known as an energy audit)
- identifying and reviewing opportunities for energy conservation;
- developing an implementation plan, with budget
- implementing energy conservation measures
- monitoring and reviewing energy conservation measures that have been implemented.
These steps are briefly discussed in the following subsections.
Committing to Energy Reduction and Setting Targets
As the first step towards energy conservation, a policy should be developed to use energy efficiently and to keep GHG emissions to a minimum wherever possible. A simple statement of policy objectives will show the commitment of senior management to energy efficiency and to the reduction in the carbon footprint of the sewage works. In addition, there should be a clear, shared vision of the action to be taken to reduce energy consumption, which means ensuring all plant staff are aware of the commitment for change and that they share that commitment.
It is important to identify an "energy champion" for the facility. This person should have the support of senior management and be given the necessary resources to be effective. The energy champion should be the main person responsible for managing and implementing an energy management plan. To aid in this process, consideration should be given to forming an "energy team" that will report on progress and identify problems to stimulate further action. Consideration should be given to including operations and managerial staff on the team, to ensure energy management is part of the normal reporting structure of the facility.
Prior to conducting an energy assessment, the areas that are to be included in the assessment should be identified and established, such as collection systems, treatment processes, HVAC, lighting and building heating.
This stage of the energy management plan should also include setting targets for energy reduction. In some cases, a municipality may have a mandate to reduce energy by a specific percentage, which can be used as the basis for setting targets. If an energy conservation mandate does not exist, setting voluntary targets for a sewage works can be done. Setting voluntary targets presents a clear picture of what is to be achieved and by when. Target setting can be done by comparing current overall energy use by the sewage works with that used at a typical sewage works and also by facilities that are considered to have implemented comprehensive energy conservation measures.
Conducting an Energy Assessment
The level of detail for the energy assessment needs to be determined, i.e., whether it will be a "walk-through" or more detailed assessment of processes. A walk-through assessment is the lower cost option as it will take less time and can typically be carried out by plant staff or another municipal employee having experience with wastewater treatment processes and energy usage. However, a detailed assessment will likely identify more options for energy conservation.
A sewage treatment works may have the necessary in-house expertise to conduct an energy assessment. If not, an external organization that specializes in energy assessments will need to be engaged. Due to the potential impacts of any energy conservation measures on other treatment processes and effluent quality, it is recommended that the external organization assisting with the energy assessment has experience with sewage treatment works.
It is recommended that key members of staff accompany the individual(s) conducting the energy assessment. This will allow the assessor to gain a better understanding of the equipment, processes and systems at the sewage works and help to identify potential energy conservation measures. It will also ensure that plant staff feel part of the assessment process, which will help with the "buy-in" of any measures recommended for implementation.
The aim of the energy assessment is to identify what the current situation is in terms of energy used at a sewage works and to gather enough information to identify potential energy conservation opportunities. A load schedule for the sewage works should be the starting point for an energy assessment. The assessment should identify equipment that use energy, the type of energy being used, and the amount and distribution of energy being used in each area. An energy consumption profile should be developed that includes data on usage for each season, weekdays and weekends, daily variations, and peak demand. Power monitors can be used for this.
Energy use should be determined as energy unit per cubic metre of sewage treated or energy unit per amount BOD5removed. Determining energy usage may involve reviewing billing data, using manufacturers' specifications, metering energy usage and/or making estimates based on typical energy usage for equipment or processes from published data. To help with benchmarking plant energy use, the U.S. EPA's energy star® program has an online tool to compare energy use at a wastewater treatment plant with similar facilities (U.S. EPA, 2010b). Similarly, Local Authority Services provides on-line information and tools on energy management and benchmarking for wastewater facilities (AMO, 2010).
The energy assessment should also involve gaining an understanding of future energy usage at a sewage works, i.e., if there are plans for changes to the treatment capacity and/or the types of treatment processes used.
More information on conducting energy assessments can be found in publications by the U.S. EPA (U.S. EPA, 1986) and the Electric Power Research Institute (EPRI, 1994).
Identifying Energy Conservation Opportunities
Once the energy assessment has been completed, a more detailed comparison of energy usage at the plant for specific equipment or areas can be carried out and compared against data for similar facilities. Data on typical energy usage for specific sewage treatment processes and equipment is provided in Section 5.3, and other sources of information are identified in Section 5.4.2.
This benchmarking exercise can help to identify areas of excessive energy use and determine what the energy use target should be. Opportunities to conserve energy in areas that compare favourably with other facilities should also be considered, as improvements in energy efficiency by equipment and processes in these areas may still be possible. Information on opportunities to conserve energy for specific processes and equipment is provided in Section 5.5.
The procedure used to identify potential energy conservation measures is dependent on the level of detail that is required to make a decision on an investment, which is set by the municipality (or the owner/operator of the sewage works). It may be feasible to conduct a preliminary assessment to identify a broad range of potential opportunities, followed by a more detailed assessment of potentially feasible options that may involve obtaining quotes on cost data from equipment suppliers or other sources.
Not all potential energy conservation measures identified will be feasible and a number of factors need to be considered to determine this (EPRI, 1994), including:
- effect on plant processes and effluent quality
- capital and operating costs
- energy and electrical demand savings
- the cost-benefit ratio
- understanding the electricity spot market rates and opportunities to save costs by load shifting and peak shaving.
The total cost for energy conservation measures should include a life cycle analysis resulting in a net present value estimation. This includes the capital cost of installing or upgrading any process(es) or equipment, the total O&M cost for new equipment, financing cost, cost savings as a result of lower energy use, and any grants that may be available. The O&M costs should include energy costs, labour requirements for maintenance and operation, chemical costs and also any costs associated with the impact on other treatment processes as a result of implementing the measure (e.g. an increase in solids requiring processing as a result of more efficient solids separation).
Once the above has been carried out, feasible energy conservation measures should be prioritized. Prioritization should take into account the amount of energy reduction achievable, the cost-benefit ratio, how implementation fits in with any changes to a sewage works (e.g. plant upgrades), and any special funding or grants that may be available from the municipality, other government sources or from the local energy supplier.
In addition to implementing changes to achieve energy conservation, the energy use of new equipment or processes should become a significant factor for consideration in the procurement process. The development of procurement standards or policies to consider energy efficiency when replacing equipment and communicating these to managers and maintenance personnel are recommended.
Developing an Implementation Plan
After identifying opportunities and prioritizing them, the next stage is to develop an implementation plan. This plan will be based on the budget available for implementation, as well as any special funding or grants that may be available.
Prior to implementation, the municipality (or owner/operator of the sewage works) will need to determine who will manage the project(s) associated with upgrades or other changes required for each measure identified. If an external party is to be involved, the usual procurement procedure may be used. If the project(s) is to be managed internally, it is recommended that the project team includes plant staff that are involved in the energy assessment process.
Changes resulting from an energy conservation project can have a significant impact on the overall system at the sewage works, and can include impacts on staff. Therefore, it is recommended that staff training be included as part of the project to minimize any pressures on staff that may result from changes.
In many cases, budgetary constraints will dictate the time period for implementing all energy conservation opportunities identified.
Implementing Energy Conservation Measures
Due to the capital cost associated with some of the measures, it is possible that some measures would need to be budgeted for and implemented over multiple years. Some of the energy conservation measures may qualify for grants or other funding programs (e.g. from the local energy supplier). Possible funding sources should be investigated.
Monitoring and Reviewing Implemented Energy Conservation Measures
Once energy conservation measures have been implemented, follow-up work should be carried out to verify and document the estimated energy savings that have been achieved. This can be used as a means to continuously improve on energy conservation.
In order to assess the amount of energy saved as a result of measures implemented, monitoring of energy use is required before and after implementation. It is recommended that monitoring be carried out for at least two years after energy conservation measures have been implemented and the energy savings achieved compared to the objectives and targets set. If there is a discrepancy where the energy savings is significantly less than that originally estimated, further investigation should be carried out to determine if changes are required to improve energy conservation.
Periodic assessments of energy use after the completion of an energy conservation project can allow for continuous improvement in energy reduction, as it will keep staff aware of the importance of energy use at the sewage works and allow for regular assessments and identification of new opportunities for energy reduction.
5.4.2 Additional Sources of Information
The following sources provide additional information on energy management planning. Information is also available in some of the referenced publications provided in Section 6, such as WEF (1997 and 2009).
- Natural Resources Canada’s (NRCan) Office of Energy Efficiency (OEE) provides information on energy efficiency that can be considered by sewage works (NRCan, 2010).
- NRCan has published the Energy Efficiency Planning and Management Guide(NRCan, 2002) which has sections on implementing an energy management program and carrying out energy audits.
- The U.S. Department of Energy’s Federal Energy Management program is a useful resource for information on energy management (U.S. Department of Energy, 2010).
- The U.S. Environmental Protection Agency (U.S. EPA, 2010c) is a good source for further information on preparing an energy management plan.
- Environment Canada provides information on energy saving opportunities for building lighting and cooling, and also for computers on their website (Environment Canada, 2010b). The website also provides a boiler efficiency calculator that can be used to analyze the efficiency of boiler operations.
- The New York State Energy Research & Development Authority recently published the Water & Wastewater Energy Management Best Practices Handbook (NYSERDA, 2010), including information on energy management program development.
- Information on benchmarking for wastewater treatment facilities can be found in a report published by M/J Industrial Solutions (M/J Industrial Solutions, 2003) and the WRc Group (WRc Group, 2003).
5.5 Energy Conservation Opportunities
The following sections discuss a number of potential opportunities that can reduce energy used by specific equipment at sewage works and within the various process stages. In general, as blower system and pumping operations can account for 80-90 percent of the energy use at a sewage treatment plant, a review of their operation can result in the largest energy conservation opportunities (Environment Canada, 2006).
Further information on energy conservation and energy recovery opportunities at sewage works can be found in WEF (2009) and in the referenced WERF publications (2010a, 2010b, 2010c).
5.5.1 Electric Motors
The operation of electric motors represents an estimated 90 percent of the electrical energy used at a typical sewage treatment works (WEF, 2009). Motors can represent not only a major energy demand but also a major on-going maintenance expense. For upgrades, re-commissioning existing motors (i.e., identifying and implementing operational and maintenance improvements) to meet the actual requirements versus the original design requirements may reduce energy used by motors.
There are typically two types of motors available; standard or high-efficiency. The impact of installation of standard versus high-efficiency motors is dependent not only on the size of the motor but also the usage. For small motors, the energy efficiency between standard and high-efficiency motors is greater, even though the actual energy use may be significantly lower than for larger motors. For large motors, even a small improvement in efficiency for a motor that is run continuously represents a considerable energy cost savings. The National Electrical Manufacturers Association in the U.S. (NEMA) has recently implemented the NEMA Premium® energy efficiency motors program, which is a useful source of information on energy- efficient motors (NEMA, 2010).
Retrofitting a sewage works with high-efficiency electric motors can represent a large capital cost; however, life-cycle cost analyses indicate that over a 10-year continuous operational period, the energy consumption of a standard efficiency motor can represent 50 times its initial purchase price (WEF, 2009). High-efficiency motors offer a number of advantages over standard efficiency motors other than energy savings, including (Natural Resources Canada, 2002):
- generation of less internal heat
- less noise
- longer life expectation due to higher reliability
- lower maintenance requirements (bearing replacement)
- less process downtime.
In addition, energy savings can be realized by accurately sizing motors during the initial design process. Typically, motors are sized for the maximum design load; however, this load will not typically be experienced until far in the future. Therefore, when an initial design of a sewage works or retrofitting of motors is undertaken, thought should be given to staging the installation of motors so that the full load requirements are experienced over a period of time by installing additional or larger motors as the load requirements increase.
Operational measures that can be implemented to reduce the energy use of motors include the following (U.S. EPA and GETF, 2008):
- ensuring the proper maintenance is routinely performed on motors, including checking the switches and connections regularly
- operating the motor as close to the manufacturer’s suggested voltage as possible, as any change in voltage can negatively impact the motor efficiency.
Further information on energy conservation opportunities relating to electric motors can be found in WEF (2009).
5.5.2 Pumps
Within sewage works, pumps are used to raise sewage to the highest point in the system, pump sewage and sludge/biosolids over long flat distances, and for recirculation and mixing. The energy associated with pumping can account for significant amounts of overall energy use as pumps are typically designed for the sewage works design peak loading conditions and can operate nearly continuously depending on the application. Establishing the actual efficiency of a pump requires collecting data at the pumps (i.e., pump head and flow), and comparing this data to the manufacturer’s pump curves for each pump. For upgrades or new facilities, re- commissioning pumps to meet the actual requirements versus the original design requirements may reduce energy needed for pumping.
Options for decreasing the energy consumption of pumps are outlined in Table 5.6 but it is suggested that prior to implementing changes to pumping, a hydraulic model be developed to simulate any potential energy reduction measures.
Further information on determining pump efficiency and evaluating and optimizing the energy use associated with pumping can be found in WEF (2009) and U.S. EPA and GETF (2008).
| Energy Reduction Measures | Details |
|---|---|
| Field check pump efficiency | Compare actual pump head and flow data with manufacturer’s pump curves to establish efficiency |
| Replace motors with high-efficiency motors | Energy efficiency between standard and high-efficiency motors is greater for smaller motors, but can have considerable energy savings impact with large motors that are run continuously |
| Operate pumps and pump combinations in their best efficiency range | This is the point at which the effects of head and flow converge to produce the greatest amount of output for the least amount of energy |
| Use soft starters on large pumps, or special pump start and stop controls to reduce peak demand | Reduces the starting current of pumps |
| Optimize number of starts and stops | Lower number of starts and stops will reduce energy use |
| Reduce flow to be pumped | Energy reduction is proportional to the flow reductionReduce flow to be pumped by reducing infiltration and inflow (I/I) and implementing water conservation programs |
| Reduce head | Achieved by reducing the height to which sewage must be raised or by lowering the friction losses (i.e., minimizing bends in piping) |
| Reduce impeller size | Pumps which are oversized for current flow requirements (pumps sized for future flow conditions) can have the impeller size reduced until higher flows are received in the future |
| Reduce instances of pipe restrictions | Minimize instances of pumping into pipe sections with restrictions and pressure reducing valves |
| Maintain pumps regularly | Maintain pumps regularly to prevent deterioration of pump efficiency |
| Turn off pumps | In some instances it might be possible to run pumps at higher rates for shorter duration rather than continuously at lower rates |
| Consider variable speed pumping | Can be used for influent, effluent, WAS, RAS and internal recycle streams. Energy and pump speed are exponentially related, e.g. a 30% reduction in speed will reduce energy use by approximately 65% (MDM, 2010). |
| Consider off-peak pumping or storing to pump at off-peak times | Can be used for filter backwashing |
5.5.3 Variable Speed Controls
Variable speed control can be used within sewage works to control the output from pumps and blowers. It is typically used to provide a continuous output based on the demand as measured by a key control parameter (e.g. dissolved oxygen or liquid level). The most commonly used speed control in sewage works is pulse-width- modulated variable frequency drives (VFDs) coupled with an alternating current induction motor (WEF, 2009).
There are two types of VFD: variable and constant torque drives. When adjustable speed control is required a variable torque drive is recommended. Energy savings result from lowered motor speed which in turn decreases the power required to operate the motor. The energy used by motors is exponentially related to the speed of the motor, e.g. a reduction in speed of 30 percent can result in an energy reduction of approximately 65 percent (MDM, 2010). Therefore, energy savings as a result of using VFDs can be significant. More information on variable speed control within sewage works can be found in WEF (2009). Information on variable speed control for blowers is discussed in Section 5.5.6.
VFDs can be utilized for primary sludge pumping. Primary sludge pumping energy use can be minimized by introducing modulated or intermittent sludge pumping (WEF, 2009). This process involves pumping a lower volume of sludge that has been given time to concentrate within the primary clarifier. This reduces the required run time of the pumps. It can also result in a lower volumetric loading to the digester that may result in a higher solids destruction (and therefore a higher biogas generation), and consequently less haulage required for biosolids. VFDs can also be used for certain sludge/biosolids thickening and dewatering equipment.
5.5.4 Collection and Conveyance Systems
Energy usage within collection and conveyance systems is for pumping when the site location of the sewage works does not allow for gravity flow alone. Energy conservation measures for pumps is discussed in Section 5.5.2. Determination of the feasibility of off-peak pumping should also be investigated on a case-by-case basis.
There are a number of other opportunities for conserving energy within collection and conveyance system (MOE, 1977), which include:
- constructing sewers at a minimum practical depth to reduce pumping energy requirements
- keeping the number and size of pumping stations to a minimum, including considering inverted siphons and above-grade sewers (e.g. in the vicinity of a sewage treatment plant)
- correcting significant infiltration and inflow into sewers to minimize the volume of sewage to be pumped
- reducing hydraulic losses in forcemains by sizing them for current flows and constructing a second forcemain when required.
5.5.5 Biological Processes
As there are a large number of biological treatment processes with a wide range of energy uses, the energy conservation measures applicable to each process will vary. The following subsections provide information on energy conservation opportunities for biological treatment processes, excluding aeration systems which are covered in Section 5.5.6.
Suspended Growth and Hybrid Systems
For the majority of suspended growth and hybrid biological systems the energy associated with aeration will be the highest energy user in the process. Section 5.5.6 reviews measures that can be considered to lower the energy associated with this aspect of suspended growth activated sludge processes.
Manipulation of the solids retention time (SRT) within suspended growth process can impact the aeration energy required. High SRTs require higher aeration energy to meet the increased oxygen demands of the biological process. However, it also results in lower energy required to treat biosolids as a lesser quantity of sludge is produced. Conversely, there will be lower biogas generation potential if anaerobic digestion of the solids is carried out.
Changing the bioreactor SRT can impact effluent quality as well as other unit processes. A higher SRT can improve the removal of organics, which may reduce the energy associated with any quaternary treatment stage. Depending on the requirements for treatment, SRT requirements can vary. When BOD removal alone is required, an SRT of 4 to 6 days is typically required (MOE, 2008). In comparison, when nitrification is required, an SRT of 7 to 18 days is typically needed, with the large range a result of the sensitivity of nitrifying organisms to low temperatures and numerous potential inhibitory chemicals.
Nitrification can reportedly increase aeration energy by 33 to 100 percent compared to non-nitrifying conventional AS, depending on the operating SRT (WERF, 2010c; U.S. EPA, 2010e). However, the total aeration costs can be reduced by about 20 percent by denitrification to 8 to 10 mg/L total nitrogen for typical municipal sewage (U.S. EPA, 2010e). This is because the denitrification process consumes influent cBOD5, which reduces the organic loading on the aerobic system. It has even been reported that the combination of nitrification and denitrification has the potential to reduce net aeration energy compared to non-nitrifying conventional AS (Rosso and Senstrom, 2007; WERF, 2010c). The addition of an anaerobic and/or an anoxic zone ahead of the aerobic zone also reduces the aeration volume needed for nitrification.
Reducing the SRT from 15 days to 3 days in AS processes can result in up to 20 percent energy savings for aeration (EPRI, 1994). Decreasing the SRT within a bioreactor can increase the sludge production rate within the process due to higher yields and because lower MLSS concentrations require higher pumping rates of waste sludge for processing, which can negate a portion of the energy saving recognized by lower aeration requirements.
MBRs are typically high energy using processes, and for this reason numerous strategies have been developed to decrease their associated energy use. Strategies include using passive recirculation for sludge return, pacing of the sludge recycle with influent flows, and sequencing the membrane scouring cycles to reduce the number of blowers in service. Intermittent aeration for hollow fibre membrane-based MBRs has been shown to be advantageous in terms of operation and can also reduce energy associated with the blowers (Henzeet al., 2008).
Suspended growth processes, especially those that remove nutrients biologically, may require energy to pump recirculation streams. Information on conserving energy associated with pumping can be found in Section 5.5.2. In addition to these measures, the RAS rate should be optimized to minimize RAS pumping.
Suspended growth processes with anoxic/anaerobic zones within the biological process typically require mixing to maintain the activated sludge in suspension. Energy conservation measures relating to mixing are discussed in Section 5.5.7.
Fixed Film Systems
Trickling filters require energy mainly for the pumping of influent to the biological process and for effluent recirculation. The recirculation rate is limited to some extent by the loading rate (flushing intensity or spülkraft (SK) rate), measured as mm of influent penetration into the media depth per pass of distributor arms, but in some cases the recirculation rate can be optimized based on flow patterns. It may be possible to meet effluent requirements by decreasing the recirculation rate (i.e., from 2:1 to 1:1 in relation to influent flow). In addition, at night or during low flow periods it may be possible to decrease the recirculation rate further by either turning off pumps or reducing the pump speed (EPRI, 1994). However, care should be taken not to decrease the recirculation rate to a level where filter media can dry out. Additional information on opportunities to conserve energy relating to pumping can be found in Section 5.5.2.
In RBCs, energy is used to rotate the contactors. If the plant is not operating at full capacity, it may be possible to reduce the speed of the rotation or leave a section of the contactors idle. However, care must be taken to ensure that an imbalance on the shaft is avoided if an RBC is left idle, as this can result in failure of the RBC system.
BAF Systems
Aeration in BAF treatment systems is a major energy user for this type of process. Section 5.5.6 reviews measures that can be considered to lower the energy associated with aeration. Pumping of influent and backwash water is the other main energy using component of BAFs and additional information on opportunities to conserve energy relating to pumping can be found in Section 5.5.2.
5.5.6 Aeration Systems
Grit Tank Aeration
Air used by aerated grit tanks should be optimized to provide the minimum amount of air required for effective grit separation. By reducing the air to the minimum required, energy use reductions can be achieved through reduced use of blowers. Air requirements can be reduced by baffling grit tanks in some cases. Air requirements for aerated grit tanks can be determined by monitoring the organic content of grit under different air flow rates to ensure that there is sufficient aeration to prevent the settling and accumulation of putrescible matter.
Secondary Treatment Aeration
The components of the aeration systems that can be adapted for energy savings include blowers, type of aerators installed, operating dissolved oxygen (DO) concentration and the level of system control in place. Optimization of aeration equipment to reduce energy consumption may result in significant energy and operational cost savings for the plant.
Blowers
There are various types of blowers, each with their own opportunities for energy conservation (Aerzen, 2009). Overall, energy savings can be realized when a blower’s output matches closely the average load demands. As an example, the City of Saint Thomas, Ontario re-piped the air distribution system at the Saint Thomas Water Pollution Control Plant, resulting in the use of only one blower and a payback period of approximately 3 years. For upgrades of facilities, re-commissioning blowers to meet the actual requirements versus the original design requirements may reduce energy needed for blower operation. Matching the blower output to aeration requirements will require DO control (see below). This will typically involve the use of variable inlet vanes or throttle valve control in the case of centrifugal blowers and the use of VFDs for positive displacement blowers. Typically, blower control using VFDs will be more energy efficient than throttling, which can introduce losses that decrease blower efficiency (Lenhardt et al., 2008). In addition, the use of variable inlet vanes will be more energy efficient than throttling. As discussed in Section 5.5.3, significant reductions in energy use can be achieved through the use of VFDs and other means of reducing a blower’s output, as the reduction in blower speed is exponentially related to energy use reduction. When considering changing blower type or operation to reduce energy consumption, it is recommended that the aeration system as a whole be considered and that the blower supplier be contacted for information on the optimal blower control system for the specific application, particularly in retrofit applications.
Innovations in blower design include the development of high-speed, single-stage centrifugal "turbo" blowers, which use advanced bearing designs (magnetic or airfoil) to operate the blower impeller at high speeds (40,000 rpm) (Aerzen 2009; Jones and Burgess, 2009; Lenhardt et al., 2008; WERF, 2010c; U.S. EPA, 2010d). Manufactures of high-speed blowers indicate that there can be significant energy saving from using this blower type (Jones and Burgess, 2009). The reported advantages of high-speed blowers (Jones and Burgess, 2009) include:
- 10-20 percent more efficient than conventional blowers
- a turn down capacity of up to 50 percent with little effect on efficiency
- a relatively small footprint
- relatively lightweight
- relatively quiet operation with low vibration
- relatively low maintenance requirements.
The disadvantages of high-speed blowers include the fact that it is a new technology with few North American installations, and there is a limited service network for these blowers (Jones and Burgess, 2009). The efficiency of these types of blowers is also dependent on the ability of the blower to meet the air demand.
With regard to positive displacement blowers, screw blowers reportedly represent a more energy efficient alternative to rotary lobe blowers, with claimed energy savings of up to 50 percent (Atlas Copco, 2010). The former incorporate twin-screw rotor elements functioning on the principle of positive displacement combined with internal compression. The rotary screw compressor technology was released to the U.S. Market in the summer of 2010 (U.S. EPA, 2010d).
Table 5.7 presents a number of energy conservation measures for blowers that can result in energy savings at a sewage treatment works. Additional information on conserving energy relating to blowers can be found in WEF (2009).
| Type of Blower | Energy Conservation Measure |
|---|---|
| All Blowers | Reduce inlet filter losses by replacing filters elements with less restrictive ones |
| All Blowers | Perform preventative maintenance regularly relating to filters, belts and lubrication |
| All Blowers | Operate blowers and blower combinations in their best efficiency range |
| All Blowers | Use soft starters or special blower start and stop controls (such as cascade operation) to reduce peak demand |
| All Blowers | Optimize the number of blower starts and stops |
| All Blowers | Replace motors with high-efficiency motors that are sized to the actual load demand (Section 5.5.1) |
| All Blowers | Modulate airflow using variable frequency drives |
| All Blowers | Use automatic blower controls (including DO) to continuously match output to load demands |
| All Blowers | Reduce discharge pressure by controlling pressure set points to maintain control valves near the maximum open position which is termed "most open valve" logic |
| All Blowers | Replace oversized blowers with smaller or adjustable output blowers that more closely match process requirements |
| Centrifugal Blowers | Trim or replace impellers to match output with actual load demand |
| Positive Displacement Blowers | Change sheaves to match output to actual demand |
Aeration Equipment
Energy use is directly related to the size of the aeration system and the efficiency with which oxygen transfer is accomplished. There are a number of different types of aeration equipment, including mechanical, diffused, jet and static tubes. The oxygen transfer efficiency varies for each aerator type (see Section 5.3.4), which needs to be considered when installing or upgrading aeration systems. The efficiency of aeration equipment is affected by the alpha factor (the oxygen mass-transfer coefficient of the wastewater compared with that for clean water), which varies with the type of aerator used, tank geometry, and depth of submergence of diffusers (Metcalf & Eddy, 2003).
For existing mechanical aeration systems, energy conservation can result from implementing two-speed mechanical aerators. In some cases, combining mechanical and diffused aeration may be the most energy efficient approach (U.S. EPA and GETF, 2008).
As coarse-bubble diffusers are not as efficient as fine-bubble diffusers, upgrades to aeration tanks typically involve replacing coarse-bubble with fine-bubble diffusers. Energy savings of between 9 and 40 percent can be achieved with fine-bubble aeration system when compared to coarse bubble (MOE, 1998). When considering an upgrade from coarse to fine-bubble diffusers, an evaluation of the existing blower output should be carried out to determine if it can be reduced without a significant reduction in blower efficiency, or if new blowers are required. Further energy reductions can be achieved if pure oxygen is used in a diffused aeration system, as this improves the oxygen transfer efficiency, which reduces the amount of gas blowers must pump. However, the energy use for producing the pure oxygen (usually by cryogenic air separation) needs to be taken into account.
The practice of regular cleaning and maintenance or the replacement, when required, of aeration equipment can decrease energy use and prevent decreased system performance, reduced oxygen transfer efficiency (OTE ), and early wear of mechanical components. Maintenance of diffusers, particularly fine bubble diffusers, is required as their efficiency can be lowered due to diffuser clogging or fouling, reduced mechanical efficiency, and general wear and tear (Newbigging et al., 1999). Maintenance recommendations and a cleaning protocol provided by the equipment suppliers should be followed.
DO Control
Installation of online DO analyzers in the aeration tanks, tied in to control loops and programmable logic controllers, can provide automatic DO control and optimize the operation of the aeration system in terms of energy consumption. Blower operation and/or air piping control valve positions can be manipulated through instrumentation and on-line automatic control to maintain DO set-points within and between bioreactors of the aerobic secondary treatment process. Instrumentation includes DO meters and air flow meters, the reliability of which is critical to the success of using DO control to reduce energy use by aeration blowers. Mechanical aerators can use gear reducers to reduce speed and VFDs if automated DO control is used.
With proper automated controls, the aeration system can reduce the volume of air supplied to the aeration tanks during low loading conditions, thus reducing energy use. In addition, by maintaining the minimum operating DO concentration required to sustain effective biological activity (1 to 2 mg/L depending on whether nitrification is required) in the bioreactor, continuous or diurnally low DO conditions as a result of insufficient aeration can be prevented, potentially resulting in improved biological process stability and performance. Significant energy savings can be realized by controlling the DO within a bioreactor. Reducing air flow to decrease DO concentration from 5 mg/L to 1 mg/L can result in 73 percent less airflow required in the bioreactor (Kopchynski, 2009). Automatic DO control can reportedly save 20 to 40 percent of aeration energy (WERF, 2010c). More information regarding the configuration and development of automatic DO control systems can be found in WEF (1997).
DO reduction may be limited by mixing requirements in aeration tanks, and in the case of fine bubble aeration systems, the minimum required airflow through the diffusers can be a limiting factor.
On/Off Aeration
In addition to proper aerator maintenance, in some nitrifying biological treatment processes, implementation of on/off (also referred to as cyclic or intermittent) aeration can be used to reduce energy consumption (MOE, 2000b). The biological system must be a nitrifying process as the nitrates, which are produced during nitrification, are utilized by microorganisms during the air-off (anoxic) cycle as an "oxygen source" (i.e., electron acceptor). The use of on/off aeration is well suited to the sequencing batch reactor (SBR) process or flow-through systems where biological nitrogen removal is required (Chai et al., 2006; Habermeyer and Sanchez, 2005; Chen et al., 2001).
The types of aeration systems suitable for an on/off aeration strategy include fine bubble membrane diffusers, coarse bubble diffusers, mechanical aerators, and jet aerators. On/off aeration is not suitable for fine bubble stone (ceramic) diffusers, or porous plastic diffusers due to the potential for clogging during the air-off cycle (MOE, 2000b). The impact of air-on/off cycles on the operation of the blowers should also be evaluated.
Intermittent aeration is not appropriate for all STPs, especially those operating at or near their rated capacity, and needs to be evaluated on a case-by-case basis so as not to adversely impact the treatment process (U.S. EPA, 2010d). In order to successfully operate the aeration system in on/off cycles, the ratio of aeration system uptime and downtime, and the frequency of on/off cycles must be determined through on-site testing.
Process control of an on/off aeration strategy can be enhanced through the installation of online DO analyzers to automatically control the duration of the aeration cycles. Supplemental mechanical mixing may be required to maintain mixed liquor in suspension during non-aerated periods. Information regarding techniques for optimizing on/off aeration can be found in MOE (2000b).
In the case of MBRs, the use of air cycling, or sequential aeration (similar to on/off aeration), can be implemented such that air can be cycled between a number of membrane cassettes to minimize the number of blowers required to run continuously. One strategy developed utilized 10 seconds of aeration followed by 30 seconds of air off (Pawloski et al., 2007).
Use of Selectors
The installation of an anoxic selector, either as part of a BNR process or to provide a pre-denitrification stage for a nitrifying plant, can reduce energy associated with aeration. This is because the denitrification process consumes influent cBOD5, which reduces the organic loading to the downstream aerobic system. The energy required to pump internal recycle streams in a BNR plant or to a denitrifying selector should be taken into account when determining the net energy conservation resulting from this measure.
5.5.7 Mixing Systems
There are numerous unit processes that require mixing in order to combine or improve the contact between two or more streams within the sewage treatment works, including:
- chemical addition (i.e., coagulant, polymer, or disinfectant)
- flocculation prior to chemically enhanced primary, secondary or tertiary clarification
- suspended growth biological processes
- aerated lagoons
- aerobic or anaerobic digesters
- sludge/biosolids storage tanks
- chemical solution storage tanks.
Mixing typically can occur as a result of aeration or using a mechanical mixer such as an impeller or by recirculation pumping. The power requirements for impeller mixing relates to the type of mixer, the size of the impellers, the density of the liquids, and speed of rotation. Energy conservation opportunities for mechanical mixers should be investigated on a case-by-case basis to determine whether changes to the mixing intensity and mixing duration provide adequate contact while decreasing the energy requirements. An assessment of the mixing process using a tracer chemical (e.g. fluoride or lithium) and/or the use of computational fluid dynamics (CFD) modelling can be used to optimize mixing.
More energy-efficient mixers are available, such as in-line, vertical linear motion and hyperboloid mixers, that can reduce energy associated with mixing. In-line mixers are static mixers that use geometric designs inside a pipe to create a mixing action between two or more fluids. This type of mixer may be used for mixing chemicals (e.g. coagulants) with sewage. Vertical linear motion and hyperboloid mixers are suitable for mixing within tanks.
Further information on mechanical mixing can be found in Metcalf & Eddy (2003).
5.5.8 Disinfection Processes
Although disinfection using chlorination/dechlorination is a low energy process, there may be opportunities to reduce energy usage related to chlorine/hypochlorite dilution water pumping (Section 5.5.2) or to reduce the energy required by the evaporator heaters if chlorine gas is utilized (WEF, 2009).
There are several UV equipment and process control options that can be implemented to decrease the energy use. Electronic solid state ballasts are more energy efficient than electromagnetic ballasts. Process control strategies can be used to allow for the correct dose to be delivered based on the wastewater quality to ensure compliance with the discharge requirements. Flow-paced control involves controlling the number of banks of UV lamps that are energized, based on the flow through the disinfection unit. When more than one bank of lamps is installed, it may be possible to reduce the number of banks in service during low flow periods to reduce energy use by UV disinfection, e.g. evenings and weekends. This type of process control is most frequently utilized on low pressure UV systems, whereas with other UV systems flow-pacing is used in conjunction with dose-paced process control (Hunter, 2006). Dose-pacing is applicable to high output UV systems that have output modulation capabilities. Dose-paced controls involve UV dosing based on a calculated required dose from online monitoring of flow, UVT and/or UV intensity (Hunter, 2006).
5.5.9 Sludge Management Processes
Sludge management varies between sewage works but can encompass a number of processes including sludge thickening, dewatering, digestion (stabilization), drying and incineration. The energy requirements can be influenced by a number of factors and modifying the operation of one process can impact the efficiency of other downstream processes.
Sludge Pumping
Solids analyzers can be used to terminate the timed pump cycle for primary sludge and WAS if the sludge becomes too thin. This can minimize pumping energy, as well as have a positive impact on downstream solids management processes as a result of maintaining a minimum acceptable solids level for the sludge.
Thickening
Higher solids concentration resulting from thickening translates to less energy required to heat anaerobic digestion processes (Elliot, 2003; EPRI, 1994).
For mechanical and gravity thickeners, adding polymer to the sludge and optimizing the sludge feed concentration can reduce energy use by these processes. Energy required for DAF processes can be reduced by (Elliot, 2003):
- adding polymer
- operating continuously instead of intermittentl;
- adjusting the supplied air to optimize the air-to-solids ratio
- ensuring the feed has the highest possible solids content.
Anaerobic Digestion
Anaerobic digestion can not only be an energy consuming process but also an energy producer within the sewage works, as discussed in Section 5.3.9. Ensuring that heat is not lost in the process, by proper insulation of digesters, can minimize the energy input required.
There are various options to optimize biogas production during anaerobic digestion of sludge, which are discussed in Section 5.5.12.
Aerobic Digestion
Aerobic digestion is a more energy-intensive stabilization process compared with anaerobic digestion. This is due to the power required for aeration and the fact that there is no energy recovery potential in the form of biogas.
Autothermal aerobic digestion (ATAD) involves processing a high solids feed (minimum solids concentration of 5 percent) in an insulated reactor (WEF, 2009). Conventional mesophilic aerobic digestion involves an exothermic reaction which typically sees the heat dissipated from open aerobic reactors. As ATAD takes place in insulated reactors, the heat does not dissipate and heating of the sludge is not required, making it more energy-efficient than conventional aerobic digestion. The SRT of the ATAD process typically ranges from 8 to 15 days (WEF, 2009). The mixing requirements are much higher for ATAD , as high as 130 W/m3, in comparison to the mixing requirements for the anaerobic digestion process of 7 W/m3 (WEF, 2009).
In addition to the suggestions made in Section 5.5.6 on aeration systems, energy conservation opportunities within the aerobic digestion process include the following (WEF, 2009):
- operating at lower dissolved oxygen concentrations
- operating at the optimal solids concentration.
Drying
As shown in Figure 5.4, the energy required for drying sludge/biosolids is affected by the percentage of solids in the dryer feedstock. Increasing the solids content of dryer feedstock through improved dewatering of sludge/biosolids can significantly reduce the thermal energy needed for drying. The amount of energy required to increase the solids content of the feedstock should be compared with energy savings expected with the drying process to ensure an overall energy reduction is achievable.
Incineration
Similar to drying processes, the amount of energy used by incinerators can be reduced with higher solids content of the feedstock. The energy content of sludge/biosolids will affect energy use by incineration. This is impacted by the upstream treatment processes used for solids management. For example, raw sludge typically has a higher energy content than digested sludge due to the lower level of volatile solids in the latter.
Other factors to consider that can affect the amount of energy used by incineration include (MOE, 1998):
- maintaining a consistent solids content in the feedstock
- minimizing shut-down times, to reduce the amount of energy associated with start-up
- land-applying biosolids as an alternative to incineration.
The potential for energy recovery from incineration is discussed in Section 5.5.12.
5.5.10 Odour Control
Consideration should be given to the elimination or reduction in odour from all odour sources as the first step to reducing the energy used for odour control at a sewage works. This can be done through improvements to the operation of certain processes (e.g. DO control in bioreactors), by local containment and by introducing contained foul air into aerobic secondary processes (Barbosa et al., 2002).
There are a number of odour control processes that can be used in sewage works. Although not identical to HVAC systems, the major components of an odour control system can be similar. For this reason, it is often beneficial to have an HVAC specialist assess the odour control system and identify any energy saving opportunities. For new systems, the installation of biofilters for odour control instead of conventional odour control equipment such as wet scrubbers should be considered as this can result in lower energy consumption.
5.5.11 Building Systems
LEED
Buildings can be evaluated using the Leadership in Energy and Environmental Design (LEED) rating system, which can be used for new construction and also to improve existing buildings. The Canadian rating systems are adapted from US Green Building Council’s (USGBC) LEED Green Building Rating System to take into account Canadian climates, construction practices and regulations (CGBC, 2010).
The rating system promotes a whole-building approach to sustainability by recognizing performance in five key areas of human and environmental health (CGBC, 2010):
- sustainable site development
- water efficiency
- energy efficiency
- materials selection
- indoor environmental quality.
LEED can be utilized to provide operators with the tools they need to make changes that can have a measurable impact on a building’s energy performance. As such, LEED can be a useful way to determine energy efficiencies relating to buildings at sewage works.
HVAC
The energy consumption of HVAC systems varies greatly by sewage works depending on site conditions. Due to minimum ventilation requirements for buildings, the energy saving potential for HVAC systems may be limited. For upgrades or new facilities, re-commissioning the HVAC system to meet the actual requirements versus the original design requirements may reduce energy used by HVAC. In order to determine whether there are energy conservation opportunities for an existing HVAC system, a weather-normalized baseline should be established since the energy demand of the system will vary greatly depending on the season. As the HVAC systems in sewage works are similar to those in other industries, an assessment by an HVAC specialist should be undertaken to determine any site-specific ways to reduce HVAC energy consumption. Potential opportunities to reduce energy requirements can include the following (U.S. EPA and GETF, 2008):
- improving the insulation within the facility
- minimizing leaks in the system
- installing and optimizing occupancy and time based controls or programmable thermostats
- performing regularly scheduled maintenance on all equipment.
Potential energy savings can also be achieved with HVAC systems by replacing the V-belt drive for power transmissions with a synchronous belt where the structure of the unit is suitable. v-belt efficiency deteriorates over time, while for synchronous belts the efficiency is steady over time (Oman, 2006).
Lighting
Lighting of sewage works and administration buildings can account for 2 percent or more of the total energy used at a sewage works. Although this does not represent a large energy consumer, this area may be one of the easiest in which to improve energy efficiency (Elliot, 2003; U.S. EPA and GETF, 2008). A number of measures can be implemented to reduce the energy use of lighting, including (Elliot, 2003; U.S. EPA and GETF, 2008):
- installation of motion detection controls
- installation of timers
- division of lighting into sections so that small sections of lights within the facility can be switched on as needed
- setting up comprehensive lighting controls for large buildings
- using lower intensity lighting in process areas compared to administration areas
- taking advantage of natural light where possible
- installation of "T5" narrow-diameter fluorescent light tube (which run from a special ballast similar to the type used for standard fluorescent bulbs) or "T8" standard sized 1 inch fluorescent tube lighting
- using pulse start metal halide lights
- installation of indirect fluorescent lighting.
It is suggested that the general lighting system and controls be reviewed every 5 to 10 years, which is a similar timeframe for the technology development cycle for these systems.
Hot Water
The use of on-demand water heaters can reduce energy use for hot water at a sewage treatment works when compared with hot water tanks. The amount of energy saved is dependent on the amount of hot water used, where more efficiencies are realized with smaller volumes. If a facility uses large volumes of water, it may be more efficient to install an on-demand heater at each hot water outlet (U.S. Department of Energy, 2009).
5.5.12 Energy Recovery
Energy recovery within sewage treatment plants can be accomplished by capturing the byproducts of treatment processes and using them to decrease the sewage works energy consumption.
Digester Biogas
The most common energy recovery source within sewage works is biogas from the anaerobic digestion process. A typical biogas contains 55 - 70 percent methane and has a heating value of 22,000 kJ/m3 (WEF, 2009). On average 0.8 m3 of biogas is produced for every kilogram of volatile suspended solids (VSS) destroyed, which translates to 17,000 kJ/kg of VSS destroyed (WEF, 2009). Most commonly, when there is sufficient biogas it is used to heat the digestion process (35°C minimum required temperature for mesophilic and 55°C for thermophilic digestion).
It is important to have a homogenous feedstock to the digesterto optimize biogas production. If the feedstock is inconsistent, digester gas storage will be necessary. Other means of optimizing biogas production include improving solids capture and dewatering in the thickening processes upstream, which can reduce the heating requirements of anaerobic digesters (Elliot, 2003). Adding high-strength organic waste (e.g. from industrial or agricultural sources) to the feedstock can help to ensure feedstock consistency and may significantly increase biogas production.
The amount of digester biogas produced is related to the SRT of waste activated sludge (WAS) for the activated sludge process, whereby a short SRT will produce more biogas as there are more volatile solids. Pretreatment of thickened sludge prior to anaerobic digestion may increase the amount of biogas from this process, as well as reduce the size of tanks required for anaerobic digestion. There are seven main types of WAS pretreatment processes, namely enzymatic hydrolysis, pasteurization, mechanical disruption, high pressure, thermal hydrolysis, ultrasonication and forced pulsed technology for cell lysis. Each type of process has the potential to break down the cell walls of bacteria in WAS, releasing biodegradable components (i.e., volatile solids) that can result in an increase in biogas production and decrease in the amount of biosolids requiring disposal. There are a number of factors relating to energy use that need to be taken into account when considering WAS pretreatment, which include (WEF, 2009):
- the energy use of the pretreatment system, which can range from 45 to 450 W/kg TSS, depending on the system used (although the resultant increased biogas generation rate from the downstream digester potentially can provide a net energy credit)
- the release of biodegradable organic matter from the breakdown of bacteria, which will add to the oxygen demand in the secondary treatment process
- the release of ammonia from the breakdown of bacteria, which will add to the oxygen demand for nitrification
- the effect of lower volatile solids on the energy required for incineration
- a lower viscosity of pretreated WAS may occur, which can reduce the energy needed for mixing needs in the digester
- an impact on dewatering and disposal costs due to lower levels of biosolids.
In order to transform biogas into a useful form of energy (i.e., electricity and/or heat), biogas utilization equipment must be installed and gas storage may be required to allow for inconsistent gas production. For the majority of the equipment, the biogas needs to be cleaned due to the presence of hydrogen sulphide (H2S), silica based compounds and water vapour. For example, in order to prevent poisoning of catalysts, H2Smust be almost completely removed if biogas is to be used by fuel cells. H2S can also combine with water vapour leading to corrosion of engine and turbine components in combined heat and power (CHP) systems. Siloxanes pose a problem for internal combustion engines as they are oxidized to silica at high temperatures, which is highly abrasive. Siloxanes are also detrimental to fuel cells. One common method used to remove H2S from digester gas is a scrubber. Scrubbers can be either wet or dry and operate by bringing the gas in contact with either a liquid or reactive material that reacts with the biogas and results in the removal of hydrogen sulphide and also reduces the carbon dioxide content (WEF/ASCE, 1998). The removal of siloxanes can be done using adsorption (with activated carbon or polymorphous graphite) together with upstream refrigeration/condensation drying for gas conditioning (WERF, 2010c), or absorption in solvents (e.g. polyethylene glycol). These systems have relatively high energy costs associated with the regeneration and disposal of the adsorption/absorption materials.
There are a number of ways that biogas can be converted to energy within a sewage treatment works. It can be used as a heat source for the digestion process itself, converted to heat, converted to electricity that can be used in other parts of the plant, converted to heat and electricity (known as cogeneration or CHP) or can be used as a direct fuel source for equipment such as engines, fuel cells and turbines. It can also be used by direct combustion in boilers. There is the option to upgrade the biogas to natural gas quality by removing some of the carbon dioxide and other impurities, and the upgraded biogas can then be supplied to the local natural gas network. Upgraded biogas is currently being injected into the natural gas distribution system in British Columbia, Quebec, Europe (including France, Sweden, Germany and Austria) and some U.S. states. Biogas can also be used as a fuel for vehicles, and this is commonly used in Europe and is also being done in the City of Toronto.
A business case study should be carried out before deciding which form of useable energy excess biogas should be converted to, as this decision will be affected by electricity and natural gas prices, as well as associated capital and operational costs.
Table 5.8 summarizes various biogas processing equipment that can be used to convert biogas to useable energy. The table includes efficiencies in terms of size and electrical and thermal energy for the various types of conversion equipment, including combustion engines/turbines, fuel cells, and steam turbines. As is shown in Table 5.8, there are a number of options available for biogas use other than as a heat source. Using biogas to produce energy other than a heat source can help a sewage treatment works to eliminate flaring of biogas, particularly during warmer months when heating requirements are lower.
In smaller sewage treatment plants, the most feasible energy recovery mechanism could be microturbines. Microturbines have the capability to convert smaller amounts of digester biogas, which can be utilized to supplement energy requirements. The range of power production for microturbines is 25 kW to 500 kW. Microturbine generator units are comprised of a compressor, combustor, turbine, alternator, recuperator and generator, although simple-cycle turbines run without a recuperator (OMES, 2004). They can be used for combined CHP systems or for combined cooling, heating and power (CCHP). Due to the potential variability in biogas production at sewage treatment works, the most efficient option for some sewage treatment works may be to size the microturbine for the lowest gas production rate and install a boiler to use excess biogas. Microturbines require complex and expensive treatment technologies for biogas cleaning, which can lower the overall potential savings associated with this energy recovery method (WERF, 2010c).
| Equipment | Equipment Size Range (kW) | Typical Net Electrical Efficiency (%) | Typical Net Thermal Efficiency (%) |
|---|---|---|---|
| Internal Combustion Engine (ICE) | 50 - 5,000 | 40 | 33 |
| Lean Burn ICE | n/a | n/a | 37 |
| Combustion Gas Turbines | 250 - 250,000 | 30 | 40 |
| Direct Drive Equipment | n/a | n/a | 30(1) |
| Microturbines | 30 - 250 | 27 | 35 |
| Phosphoric Acid Fuel Cells | 200 | 35 | 40 |
| Molten Carbonate Fuel Cells | 300 - 1,200 | 50 | 40 |
| Steam Turbines | 500 - 1,300,000 | 25 | 45 |
| Stirling Engines | 1 – 50 | 27 | 60 |
1 From Monteith et al., 2006.
Fuel cells generate electricity using an electrolyte that is between an anode electrode, which receives the fuel (in this case, biogas) and a cathode electrode that provides the oxidant (usually air). The fuel cell is capable of using a range of fuel types, including natural gas, diesel and ethanol, which allows consistent power generation when biogas levels are not consistent, without the need for an external fuel-storage and blending system (Mossinger, 2009). Fuel cells are currently being used with biogas at a number of full-scale sewage treatment works, including southern California (Mossinger, 2009) and Washington (WERF, 2010c).
Direct drive technology involves operating engines directly on biogas to run pumps or blowers. This technology, which was trialled at the Waterloo WWTP in the Region of Waterloo, is likely to have a shorter payback period than other options for biogas energy recovery (Monteith et al., 2006).
Sludge/Biosolids as a Fuel Source
Fluidized bed gasification technology can be used as a destruction/disposal method for sludge/biosolids, while at the same time producing electricity. This type of system can operate with biosolids alone or with additional biomass as an auxiliary fuel source (e.g. yard clippings, lumber scraps). Combustion energy from the gasifier is used to produce steam, which produces electricity using a turbine.
The Stamford Water Pollution Control Authority (SWPCA) in Connecticut is reviewing the option of using dried, pelletized biosolids as a fuel source for a gasification plant. The SWPCA carried out an extensive review and pilot study of biosolids gasification, before sending biosolids samples to four full-scale gasification plants (one in British Columbia, two in the U.S. and one in Germany) for testing. Construction of the gasification plant is expected to be completed by the end of 2010 and will initially use waste wood materials as a fuel source. The energy produced by the gasification plant will be used to dry biosolids at the Stamford municipal wastewater treatment plant.
A fluidized bed gasification plant has been approved for the City of Hamilton. The estimated power production for this facility is 11.6 MW of electricity, using 272 dry tonnes/d of biosolids and 272 dry tonnes⁄day biomass. The system will capable of using digested biosolids and undigested sludge co-fired with biomass (i.e., leaf and yard waste, arbour waste and clean lumber scraps) as a second fuel. The fluidized bed gasification plant is expected to have a demand of 1.6 MW, leaving 10 MW of electricity that can be exported to the grid (Nolan,et al., 2009).
Waste Heat
Thermal energy recovery is another potential energy source within sewage works, which is possible when there are sources of large amounts of heat exhausted from the treatment processes that could be captured. Sources of thermal energy include heat recovered from boiler steam, and the exhaust heat or cooling water from engines. The biosolids from the ATAD process can also be used as a heat source. Thermal energy recovery requires that appropriate heat exchangers be in place.
The exhaust temperature from fluidized bed furnace (FBF) incineration is approximately 540°C, which provides an opportunity for energy recovery through heat exchange down to about 200°C. It is usually not practical to cool the exhaust gases below 200°C for energy recover. Thermal energy can be recovered using a steam boiler and a turbine/generator or thermal oil heating heat exchangers (WEF, 2009). Some of the recovered energy can be used to dry incoming sludge, which can reduce the energy needed for incineration. The VERA Hamburg fluidized bed incinerator in Germany is a good example of efficient heat recovery from this process. Further information on this facility is available from the VERA website (VERA, 2010).
Another option for heat recovery in sewage works is by cogeneration of energy. Cogeneration is a term utilized when the heat produced from electrical energy generation is captured and used within the sewage works as steam or to space heat sections of the sewage works. For example the heat produced as a by-product of internal combustion engines can be captured and utilized to provide heat to the anaerobic digestion process (WEF, 1997). Typically, cogeneration is most feasible for large sewage treatment works that produce large amounts of waste heat, which can be captured and used in other processes.
There is the potential to recover heat from sewage within the collection and conveyance system. A heat exchanger is used to extract heat from raw sewage that can be used to heat water for building heating or for domestic hot water use. There is the potential to extract enough heat to be used by a large number of buildings, which is being carried out in Vancouver, British Columbia (Greenline, 2010). An assessment of the impact of heat recovery from sewage on sewage treatment processes (particularly biological systems) should be carried out to ensure there is no reduction in treatment efficiency as a result of the temperature of the influent being lowered. Waste heat from sewage effluent can also be used within the sewage treatment plant, e.g. for heating the floor of a solar drying process, which will enhance the drying capability of these processes. Alternatively, effluent heat can be recovered and used to heat buildings.
Braking Motor Energy
Centrifuges used for dewatering sludge/biosolids can be made more energy-efficient by capturing energy generated by the braking motor during deceleration for use by the driving motor. In essence, braking energy that previously heated the brake pads of conventional friction brakes is used to produce electricity that can either charge a battery or can be fed directly to the driving motor (i.e., via two VFDs that are interconnected via a common DC-link). Cost savings result in the reduction in electricity from the mains supply, as well as the cost of brake resistors. The use of centrifuge braking motor energy has recently been implemented at the Falkenburg wastewater treatment plant in Sweden (WaterWorld, 2009).
Pressure Recovery
The high energy consumption of RO (primarily by the high pressure pumps) can be reduced by using an energy recovery device. There are two main types of devices: pressure exchangers that transfer pressure energy from the reject liquid to the low pressure RO influent stream and energy recovery turbines that produce electricity by passing the high pressure reject liquid through an in-line rotary device. Pressure energy recovery devices, which transfer the pressure energy to a form that can be used by the RO pumps, can reduce energy consumption of the RO process by up to 50 percent in desalination systems (Lenntech, 2009), and it is expected to yield similar results when used in wastewater treatment.
Further information on energy recovery can be found in WEF (2009).
5.5.13 Emerging Technologies
There are emerging renewable energy technologies that can produce energy at sewage works including those utilizing solar and wind power (WERF, 2010c). Many sewage works have already installed alternative energy power production facilities, including solar, wind, and hydro, for heating and electricity generation (U.S. EPA, 2010e). There may be opportunities to sell excess power generated from renewable energy sources to the local electricity supply grid, which can help offset the capital cost of installing the renewable energy equipment.
There are a large number of renewable energy technologies that can be used at sewage works to capture and store energy, including (U.S. EPA, 2009):
- photovoltaic solar panels which turn sunlight into electricity
- wind turbines which turn rotors and produce electricity
- transpired solar collectors which utilize sunlight to warm air for heating purposes
- solar hot water heaters which heat up water
- heat capture from sewage at pumping stations
- small-scale hydroelectric power plants which generate electricity from liquid flow in outfalls or forcemains
- "run of the river" hydroelectric generation, where the flow and elevation drops in a sewer system or outfall shafts are used to generate electricity
- microbial fuel cells that combine hydrogen and oxygen to produce heat and/or electricity
- microbial electrolysis of wastewater for production of hydrogen and electricity
- geothermal heat pumps that transfer heat extracted from the ground.
As there are currently only few applications of the above technologies at sewage works, the implementation of them should be investigated on a case-by-case basis.
5.5.14 Power Management
Power management can present opportunities to minimize energy losses and costs by implementing a number of measures within sewage works, including:
- installation of high-efficiency transformers, which can minimize the energy lost through energy conveyance
- increasing the power factor by the installation of capacitors for the entire plant or single capacitors for higher load items (i.e., motors)
- shifting energy loads to off-peak periods, where possible (e.g. sludge handling, pumping if have adequate storage to offset peak flows).
Discussions with utility providers of the measures implemented to minimize or shift energy usage can be a starting point for sewage works to negotiate lower tariffs.
Further information on power management at sewage works can be found in WEF (2009).
5.5.15 Summary of Energy Conservation Opportunities
Table 5.9 summarizes a number of the energy conservation opportunities at sewage works.
| Unit Process | Operational Changes Resulting in Energy Savings | Capital Investments Resulting in Energy Savings |
|---|---|---|
| Pumping | Off peak pumping (requires adequate storage to offset peak flows)
Select most efficient pumps or pump combinations Minimize number of pump starts and stops |
Upgrading pumps to high-efficiency and/or variable speed drives (highest energy saved) |
| Headworks | Optimization of air flow to the grit chamber (by monitoring the organic content of the grit) | High-efficiency motors / variable speed drives |
| Primary Clarifier | Off peak pumping
Enhancing primary settling through coagulant and/or polymer addition (will improve thickening, digestion and pumping) |
|
| Aeration | Control SRT within reactor in order to reduce the oxygen demand | High-efficiency blowers or variable output blowers |
| Aeration | On/off aeration operation | Installation of fine bubble diffusers |
| Aeration | DO control | Pre-denitrification within anoxic selector (reduces oxygen requirements in bioreactor) |
| Maintenance of air diffusers and instrumentation | Installation of instrumentation to control the DO concentration (through number of blowers on or air flow rate | |
| Secondary Clarifiers | Optimize RAS rates which can lead to lower pumping requirements | |
| Filtration | Off peak backwashing | Installation of elevated storage for backwashing during off peak periods |
| Disinfection | Process control based on flow or water quality
On/off UV (some UV lamp banks off when low flows) |
Electronic ballast in a UV disinfection process |
| Anaerobic Digestion | Maximize use of digester gas in boilers and other areas to minimize consumption of natural gas | Installation of CHP system |
| Dewatering | High-efficiency pumps / variable speed drives |
5.5.16 Additional Sources of Information
The Water Environment Research Foundation (WERF) completed a study in 2010 on best practices for energy-efficient operation of wastewater treatment plants in Europe and North America, which covers a wide range of equipment and process types (WERF, 2010a; 2010b; 2010c). WERF plans to develop a unified model "Carbon, Heat, Energy Analysis – Plant Evaluation Tool". This is intended to serve as a tool for STPs to assess the energy efficiency of given site-specific unit processes. The Plant-wide Energy Tool (PET) will be able to rapidly assess a facility and identify opportunities to enhance treatment, energy utilization efficiency and sustainability of operations (WERF, 2010a).
Additional information on energy conservation opportunities is available in some of the referenced publications provided in Section 6, such as WEF (1997 and 2009), NYSERDA (2010) and U.S. EPA (2010d).
5.6 Case Study Examples
5.6.1 On/Off Aeration at Various Ontario Sewage Treatment Works
Four Ontario sewage treatment plants in Cobourg, Deseronto, Elmvale, and Paris took part in a study to determine the impact on effluent quality and energy usage of implementing full-scale on/off aeration strategies. In order to ensure nitrification was not impacted, on/off aeration was implemented in conjunction with SRT control measures. The trials took place over a 6 to 12 month period in 1997/1998. Table 5.10 outlines the details on the sewage treatment plants, on/off aeration trials, and the plant energy cost savings. The results from these four trials demonstrated the feasibility of implementing on/off aeration in various types of treatment processes and aeration systems. The variation in energy savings realized was primarily due to the type of aeration system installed. There was no effluent quality impact noted based on measured cBOD5, TSS or TP concentrations. However, nitrification was found to be more sensitive after the implementation of on/off aeration, especially during winter months. A payback period of 1 to 1.5 years was calculated based on capital costs associated with retrofitting the facilities and the operating energy savings realized due to implementation of on/off aeration.
This case study is based on information presented in MOE (2000b).
| Plant | Plant Details | Type of Aeration System | On/off Aeration Trial Details and Results | Energy Usage Before On/Off Aeration(kWh/m3) | Energy Savings From On/Off Aeration (%) |
|---|---|---|---|---|---|
| Cobourg #2 STP | Two parallel conventional activated sludge trains operating at 50% of 117,700 m3/d design capacity | Mechanical aerators | Flow splitting in trains changed from 50/50 to 35/65 to account fordifferent aerator capacity in each aeration tank.
Cycle times set at 30 minutes air-on and 30 minutes air-off. Mixing during air-off cycles by residual turbulence and influentflows in one train and by aerators set to low speed in the second train. No significant impacts to effluent cBOD5, TSS, or TP concentrations observed. Significant reductions in effluent total ammonia nitrogen (TAN) and modest reductions in effluent total nitrogen (TN) concentrations were observed due to the increased SRT control and denitrification during the air-off cycles, respectively. |
0.50 | 6 |
| Deseronto STP | Extended aeration package plant operating at 93% of 1,400 m3/d design capacity | Fine bubble membrane diffusers | Cycle times set at 30 minutes air-on and 30 minutes air-off during the day and 30 minutes air-on / 45 minutes air-off during the night.
Mixing during air-off cycles by residual turbulence and inflows. No significant impacts to effluent cBOD5, TSS, or TP concentrations were observed. An increase in effluent TAN concentrations from less than 2 mg/L to over 12 mg/L observed during the winter due to loss of nitrification. Sludge handling problems resulted in operations staff reducing the SRT from between 20 and 40 days to less than 20 days during the trial which resulted in a washout of nitrifiers. |
0.44 | 21 |
| Elmvale STP | Extended aeration plant operating at 73% of 1,500 m3/d design capacity | Jet aeration system | Initially, two parallel aeration tanks were in operation. However before starting trial, one aeration tank was taken offline to improve the energy efficiency of the plant, as it was determined that based on their design capacity, the aeration tanks were significantly oversized.
Initially, cycle times were set to 30 minutes air-on / 30 minutes air-off; during the course of the study, these were optimized to 45 minutes air-on / 75 minutes air-off during AM hours, and 60 minutes air-on / 60 minutes air-off in PM. Mixing during air-off cycles was provided by the jet pumps. No significant impacts were observed in effluent cBOD5, TSS, TP, or TAN concentrations. Significant reductions in effluent TN concentrations were observed due to the denitrification provided during the air-off cycles. |
1.8 | 45 |
| Paris STP | Extended aeration plant operating at 51% of 7,100 m3/d design capacity | Mechanical surface aerators | Cycle times set at 30 minutes air-on / 30 minutes air-off.
No significant impacts were observed on effluent cBOD5, TSS, or TP concentrations. Nitrification was lost during the winter months due to an increase in industrial loadings to the plant, resulting in DO limiting conditions within the aeration tanks. As a result, the on/off aeration strategy was suspended, and the system was returned to full aeration mode. |
0.52 | 13 |
5.6.2 Core Area Wastewater Management Program in Victoria, British Columbia
The Capital Regional District (CRD) in Victoria has undertaken a core area wastewater treatment program to stop discharging wastewater with limited treatment into the marine environment, as has been practiced. The CRD has taken the approach that wastewater should be viewed as a resource. Project focus is on energy from organic solids, wastewater heat energy, water reuse, and nutrient recovery. Aggressive water conservation programs will also be implemented to reduce sewage flows at source. The CRD has selected a system design which provides centralized treatment in the form of a new liquids only sewage treatment plant at McLoughlin Point in Esquimalt and a separate sludge digestion / biosolids management facility at the Hartland Landfill or another suitable location (CRD, 2010b).
The options adopted that relate to energy conservation with a claimed negative carbon footprint by taking advantage or resource recovery opportunities, include:
- heat extraction from sewage for use in buildings, digester heating, and district heating
- biogas production to reduce reliance on natural gas
- dried sludge as fuel substitute for cement kilns, waste-to-energy facility or as a soil amendment.
This case study is based on information from the Capital Regional District (2010b).
5.6.3 Use of Digester Biogas for Cogeneration and Plant Heating, City of Ottawa
The City of Ottawa’s wastewater treatment plant, the Robert O. Pickard Environmental Centre, has implemented an energy management plan that uses digester biogas as a fuel for cogeneration and for the boiler plant (Ontario Centre for Municipal Best Practices, 2006).
There are three generators driven by internal combustion reciprocating engines for the cogeneration plant, which can produce 2.4 MW of electrical power that is used for the aeration blowers, gas compressors, pumps, and centrifuges, and 2.9 MW for the plant heating system. The boiler plant consists of 4 dual fuel 3000 kW input boilers. Digester gas is used to fire the boilers when the heat demand for the plant is not being met by the cogeneration system.
The STP Supervisory Control & Data Acquisition (SCADA) system is used to balance the digester gas allocation. If there is excess gas being flared, the boiler plant will be fired. The goal is to at all times optimize the output of the electro/thermal cogeneration units. Output is also maximized by effective maintenance practices.
The cogeneration facility has been operating continuously since October 1997. The cogeneration units required an initial capital investment of $4.5 million dollars, with an estimated annual electricity net cost savings of $1,000,000. An additional $400,000 per year is savedby using digester gas rather than purchased natural gas to satisfy process and building space heat demands.
5.6.4 Energy Self-Sufficient Wastewater Treatment at the Strass im Zillertal WWTP, Austria
Energy conservation measures implemented at the Strass im Zillertal WWTP have resulted in an annual net surplus of electrical energy of 8 percent, which is fed to the public electricity supply grid. This is achieved by using a combination of efficiency measures and the use of extensive energy recovery programs at the plant (Wett et al., 2007; WERF, 2010a; WERF, 2010b).
Aeration requirements at the plant are minimized by operating a two-stage activated sludge treatment system. The first stage operates at a high food-to-microorganism (F/M) ratio and a short SRT of about 0.5 day, while the second stage has a lower F/M and a target SRT of about 10 days. Pre-denitrification is also used prior to the second stage of aerobic biological treatment to reduce the oxygen requirement. On-line ammonia measurement is used to control the DO in each stage of the biological treatment process. The WWTP achieves an annual average total nitrogen reduction of about 80 percent (WERF, 2010b).
Solids from the first stage of the biological treatment plant have a high volatile organics content, as most of the organic matter removed during this stage is by adsorption due to the very low hydraulic retention time of 30 minutes. The high volatile solids content results in a high biogas yield from the digesters. The high gas yield is converted to electrical energy by a CHP system, which is used to power the plant. The high efficiency co-generation engine provides 340 kW ofpower, which resulted in 8500 kWh of electricity production in 2005, which exceeded the plant energy demand of 7,900 kWh that year (WERF, 2010b).
5.6.5 Energy Savings Opportunities at Carolina Regional Wastewater Treatment Plant, Puerto Rico
The Carolina Regional Wastewater Treatment Plant is a primary treatment facility with a design average flow of 179,343 m3/d and a peak flow of 340,686 m3/d with discharge to the Atlantic Ocean. An energy audit of the existing plant and associated pumping station was performed with the following objectives:
- to provide an assessment of the existing plant processes and equipment
- to recognize process and/or equipment modifications that could lead to a reduction in energy consumption
- to determine the economic benefits associated with the possible changes
- to provide a proposed action plan for how to reduce the plant’s energy consumption.
Following the audit, a list of recommended actions was developed which is outlined in Table 5.11. If all items in Table 5.11 were implemented, a total cost savings of between US$138,000 and US$160,000 could be realized, which is a 16 to 18 percent savings from 2006 energy costs. Although automation of the system was not considered in the audit, if implemented, it is believed that additional energy savings of between 5 and 35 percent would be achieved (Kleveter and Ellermeiser, 2009).
Other energy saving opportunities that were investigated but were not included in the recommended actions included peak shaving and time of use, as they were determined to not be economically viable options at the Carolina Regional WWTP.
| Energy Conservation Opportunity | Potential Cost Savings per Year (in US dollars) | Return on Investment (years) |
|---|---|---|
| Recommend using smaller of two pumps installed at pumping station during low flow conditions | $44,600 | n/a |
| Replace transformer nearing end of useful life to reduce no-load losses | $14,400 | n/a |
| Replace the existing variable speed magnetic drives with adjustable frequency drives for the plant water pumps | $21,100 | 2.3 |
| Install occupancy sensors for building lighting | $3,800 | 0.4 |
| Replacement of all motors at the pumping station and plant with premium efficiency motors | $20,000 | 2.3-3.6 (depending on motor size) |
| Installation and efficient use of HVAC systems in administration building | $1,000 | n/a |
| Installation of capacitors to improve the power factor | $32,800 | n/a |
5.6.6 Energy Conservation and Large Scale Wind and Solar Power Initiatives at City Island Wastewater Treatment Plant in Atlantic City, New Jersey
Energy savings of US$1.6 million per year have been realized at the City Island WWTP in recent years as a result of implementing strategic energy conservation measures, including wind and solar initiatives.
The first step in the process was to reduce energy consumption at the plant by targeting aeration and biosolids processing. Half of the plant’s total energy demand (2.3 MW) was used in aeration to drive the four aerator impellers in the six aeration tanks. By switching to more efficient screw-style mixers and implementing on-line continuous control based on DO levels, an eight percent reduction in energy consumption was realized with a savings of US$96,000 per year.
Energy savings within biosolids processing were realized by replacing 20-year old centrifuges with units that were able to increase the solids content of the sludge feed into the incinerators from 25 to 32 percent. This reduced the natural gas consumption by 23 percent, translating into a cost saving of US$429,000 per year.
The possibility of using wind power to supply a portion of electrical energy was proposed by the Jersey-Atlantic Wind LLC as part of a lease/power purchase agreement, as the WWTP is located in a very windy location. In 2006, five 1.5 MW wind turbines began operation and are able to produce 60 percent of the plant’s power needs. There is a 20-year agreement with a purchase price of 7.95 cents per kWh in comparison to 13.5 cent per kWh previously paid. To 2009, there has been a US$1.7 million dollar savings realized.
The facility installed a 500 kWphotovoltaic system in 2005. The system was mounted in five arrays on rooftops, ground mounting and as a canopy over the employee parking lot. Over 12 months in 2007-2008, the system generated 665,737 kW or 3 percent of the plant power needs. In addition, the facility is able to sell renewable energy credits to others, which in 2008 generated US$338,416.
The above case study is based on information from Grennier (2009a).
5.6.7 Energy Reductions at the Lowell Regional Wastewater Utility, Massachusetts
In 1996, the Lowell Regional Wastewater Utility (LRWWU) in Massachusetts began to focus on energy and environmental initiatives. Since 1996, this 121,133 m3/d activated sludge plant has decreased its energy use from 10 million MWh to 6.7 million MWh while increasing flow by 22,712 m3/d. The resulting cost savings is approximately US$400,000 per year.
LRWWU began by soliciting employee input on energy conservation opportunities. The employee input led to numerous improvements including use of fluorescent energy-efficient lights and motion sensors which saved $20,000 each year. In addition, an employee idea of rotating pumps on and off (instead of operating all pumps continuously) during dry flow conditions to transfer water to six clarifiers from grit removal realized a savings of $12,000 per year.
LRWWU has also undertaken numerous system upgrades, which are outlined in Table 5.12.
| Upgrade | Details |
|---|---|
| Aeration system improvements | Replacement of mechanical surface aerators with fine bubble membrane diffusers
Installation of energy efficient blowers Installation of new SCADA control system |
| Pump upgrades | Replacement of influent, RAS, and WAS pumps with high- efficiency pumps and motors with VFDs |
| Heating conversion | Replacement of electric heaters with natural gas heaters to heat 12 pumping stations
LRWWU replaced electric water heaters with gas for potable water in the plant |
| Replacing motors | Motors were replaced with high-efficiency motors |
Future initiatives planned at LRWWU include thermostat setback controls to reduce heating levels on a more consistent basis and metering that provides real time energy use data.
This case study is based on information from Grennier (2009b).