Minister’s message

Caroline Mulroney,
Minister of Transportation
With the population of the Greater Golden Horseshoe (GGH) expected to grow by one million people every five years, reaching an incredible 15 million by 2051, our government is taking action to plan for and support this substantive growth. We’ve developed Connecting the GGH: A Transportation Plan for the Greater Golden Horseshoe to address gridlock and provide more capacity for people and goods to move through the region.
We’re building new highways, like Highway 413 and Bradford Bypass because without them, already intense gridlock will more than triple within as many decades. We’re expanding regional passenger rail services, spanning all corners of the region, delivering on our mandate of two-way, all-day, 15-minute service. We’re also moving ahead with the largest program of subway builds in Canadian history to connect new communities, make more jobs available to more people, and make getting around easier and more convenient. No matter how you choose to move, we are building all forms of transportation infrastructure to help you get to where you need to go more safely, faster, and convenient.
With over 100 immediate and near-term actions for the rapidly-growing region, we are laying the foundation that will improve people’s access to jobs, housing, healthcare, education and family and friends.
This is a plan with purpose, built on the guiding principle to ‘get it right’ because we simply can’t afford not to. Those choosing to start a family, move for work or build their business in the GGH area are counting on us. And the millions of visitors that flock to the region’s world-class destinations, like the City of Toronto, Niagara Falls, or the Blue Mountains, don’t want to spend their limited time sitting in bumper to bumper traffic for hours on end.
With that in mind, our plan considers many new challenges including significant population growth, economic transitions, impacts of climate change, new technologies and shifting demographics that present new and increased demands on Ontario’s current and future transportation systems.
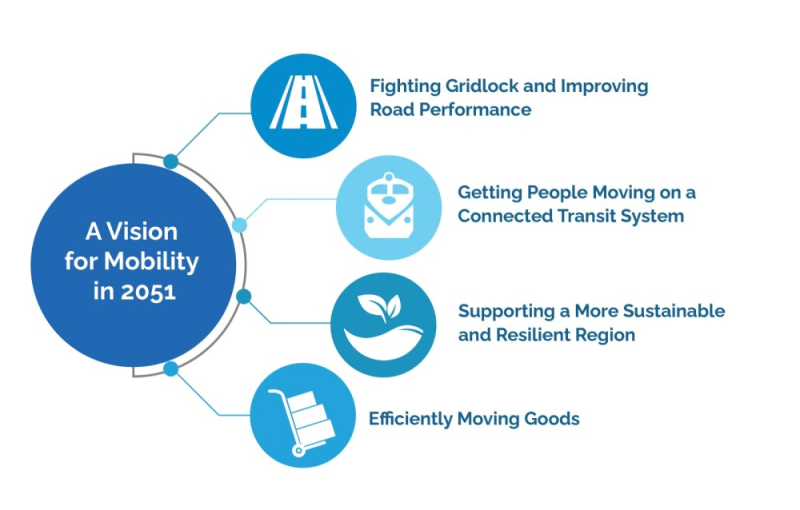
Our 2051 vision includes four interconnected themes focused on: Fighting Gridlock and Improving Road Performance; Getting People Moving on a Connected Transit System; Supporting a More Sustainable and Resilient Region; and Efficiently Moving Goods.
Meaningful work and engagement, including the release and engagement on the GGH discussion paper, has helped us build a foundation for a long-term GGH Transportation Plan — a clear path forward that takes us to 2051 to meet the region’s unique transportation needs. Each community in this region is distinct, and we heard from each and every one.
Our vision for the GGH would not be complete without the valuable input of thousands of individuals who took the time to complete a survey, attend roundtables, and submit comments on improving mobility throughout the region. We carefully considered your feedback to ensure our plan is comprehensive, thoughtful and balanced and I thank each of you for helping to build a better Ontario.
Our plan is an evergreen, living document that will continuously evolve, be updated and improved to be responsive to the needs of people and businesses. We are committed to continuing to work closely with municipal, Indigenous, and Francophone communities, transportation agencies, including Metrolinx, industry, and businesses to align planning and improve transportation in the region.
Working together, we will achieve a resilient road network that provides additional capacity in the most gridlocked areas, more efficient freight routes and better route alternatives. This will result in a more robust, sustainable and future ready transportation system that will reduce delays to people and goods and keep this vital region moving.
Executive summary
Home to 10 million people, the Greater Golden Horseshoe (GGH) is the economic engine of the province and Canada, generating two-thirds of Ontario’s gross domestic product (GDP). A well-functioning transportation system is critical to Ontario’s economic prosperity and the quality of life for the nearly 15 million people who will call the GGH home by 2051. Ontario needs a transportation system that meets the needs of today and is future ready and resilient for a growing population.
Addressing gridlock requires building more highways and establishing more choices on how and when people and goods travel and creative solutions to make the most of the infrastructure. This includes moving forward with planning and building new highways, like Highway 413 and the Bradford Bypass, to provide more capacity for people and goods to move through the region.
The province has recently made historic strides to realize the Subway Transit Plan for the GTA, the largest subway expansion in Canadian history, which will transform the region’s outdated subway system into a modern, integrated rapid transit network. In addition, the province is undertaking the largest GO Passenger Rail Expansion in Ontario’s history and is building transit-oriented communities that will provide more housing options for people, increase transit ridership and reduce road gridlock. But to keep up with forecasted growth and future needs of the region, more is needed.
A sustainable and resilient transportation system means using lower carbon solutions and planning and designing more low-carbon enabling and climate resilient infrastructure. It also means fighting gridlock to get the region’s local roads and highways moving and reduce emissions, which are higher in stop and go traffic. It means building new route alternatives to create a more resilient network and harnessing new technology and innovations that can be designed for an unknown future, ultimately giving users more choices for moving around the region.
The Ministry of Transportation, in collaboration with its partners and stakeholders, has developed Connecting the GGH: A Transportation Plan for the Greater Golden Horseshoe to provide a 30-year vision for enhanced mobility within and across the region and Ontario.
Why do we need a plan?
The GGH region has experienced substantial growth over the last several decades. As this growth continues into the next 30 years, adding approximately one million people every five years, the region and its transportation system will face intensified challenges coupled with changing demographics, shifting work-live patterns, climate change impacts and accelerated advancement of new technologies.
It is therefore vital to put in place a sustainable, interconnected and resilient plan to provide a 30-year vision for mobility across the region that will guide and align planning and investments by the province and other transportation providers.
What’s in the plan?
The plan includes a Vision for Mobility in 2051 that sets out a 30-year vision of a transportation system that provides safe, efficient and convenient options for people and businesses and supports the well-being and economic prosperity of the region into the future.
The 2051 vision includes infrastructure, service improvements and policies organized under four inter-related themes:
- Fighting gridlock and improving road performance
- Getting people moving on a connected transit system
- Supporting a more sustainable and resilient region
- Efficiently moving goods
The plan also includes over 100 immediate and near-term actions that the province and its partners are taking, and will take, to make substantial progress towards the 2051 Vision for Mobility. These actions are organized under seven goals:
- Actions to Fight Gridlock, including building new and faster route alternatives such as Highway 413 and the Bradford Bypass.
- Actions to Improve Transit Connectivity, including historic investments in transit such as the all-new Ontario Line, multiple subway extensions, regional Light Rail Transit (LRT) projects, and work to provide and progressively electrify two-way, all-day 15-minute service across the GO Transit rail network.
- Actions to Give Users More Choice, including working with municipalities across the region to bring bus services to areas that are unserved or underserved by transit through the Ontario Community Transportation Grant Program.
- Actions to Keep Goods Moving, including expanding truck parking locations and improving the sustainability and efficiency of the freight sector by encouraging use of off-peak delivery.
- Actions for a Safe and Inclusive Transportation System, including establishing a new funding program to support Indigenous communities and organizations in pursuing transportation-related projects.
- Actions to be Future Ready, including investing in electric vehicle production and exploring opportunities to make it easier to get to and from transit stations using automated vehicle technologies.
- Actions to address Connections Beyond the GGH, including expanding GO train service to the City of London and supporting feasibility work to re-introduce rail service to northeastern Ontario.
What will the plan achieve?
By setting out a long-term vision and concrete actions, the plan aims to:
- improve the choices we have to get around — getting people and goods moving where they need to be faster for decades to come
- reduce gridlock — adding more time to people’s days and saving taxpayers’ money otherwise lost idling in traffic
- reduce greenhouse gas emissions and increase resiliency to extreme weather events such as flooding
- provide a safe, inclusive and interconnected transportation system — delivering a better user experience no matter which mode you choose
How was the plan developed?
The GGH Transportation Plan has been developed through a comprehensive and innovative process. The Ministry of Transportation (MTO) has worked with partners — municipalities, Indigenous communities and organizations, transit agencies, community and business stakeholders and the public — to examine both long-term needs and shorter-term gaps.
How will the plan be implemented?
Successful implementation of the plan will require close collaboration among all players, including governments, agencies, and private service providers, as well as support from users such as businesses and residents.
The plan sets out the next steps on implementation in the areas of:
- coordination and harmonization with municipalities on transportation planning and service integration
- alignment with the land use planning framework
- multimodal collaboration
- capital planning and project delivery
- monitoring progress and updating the plan
1.0 Introduction
Purpose of the plan
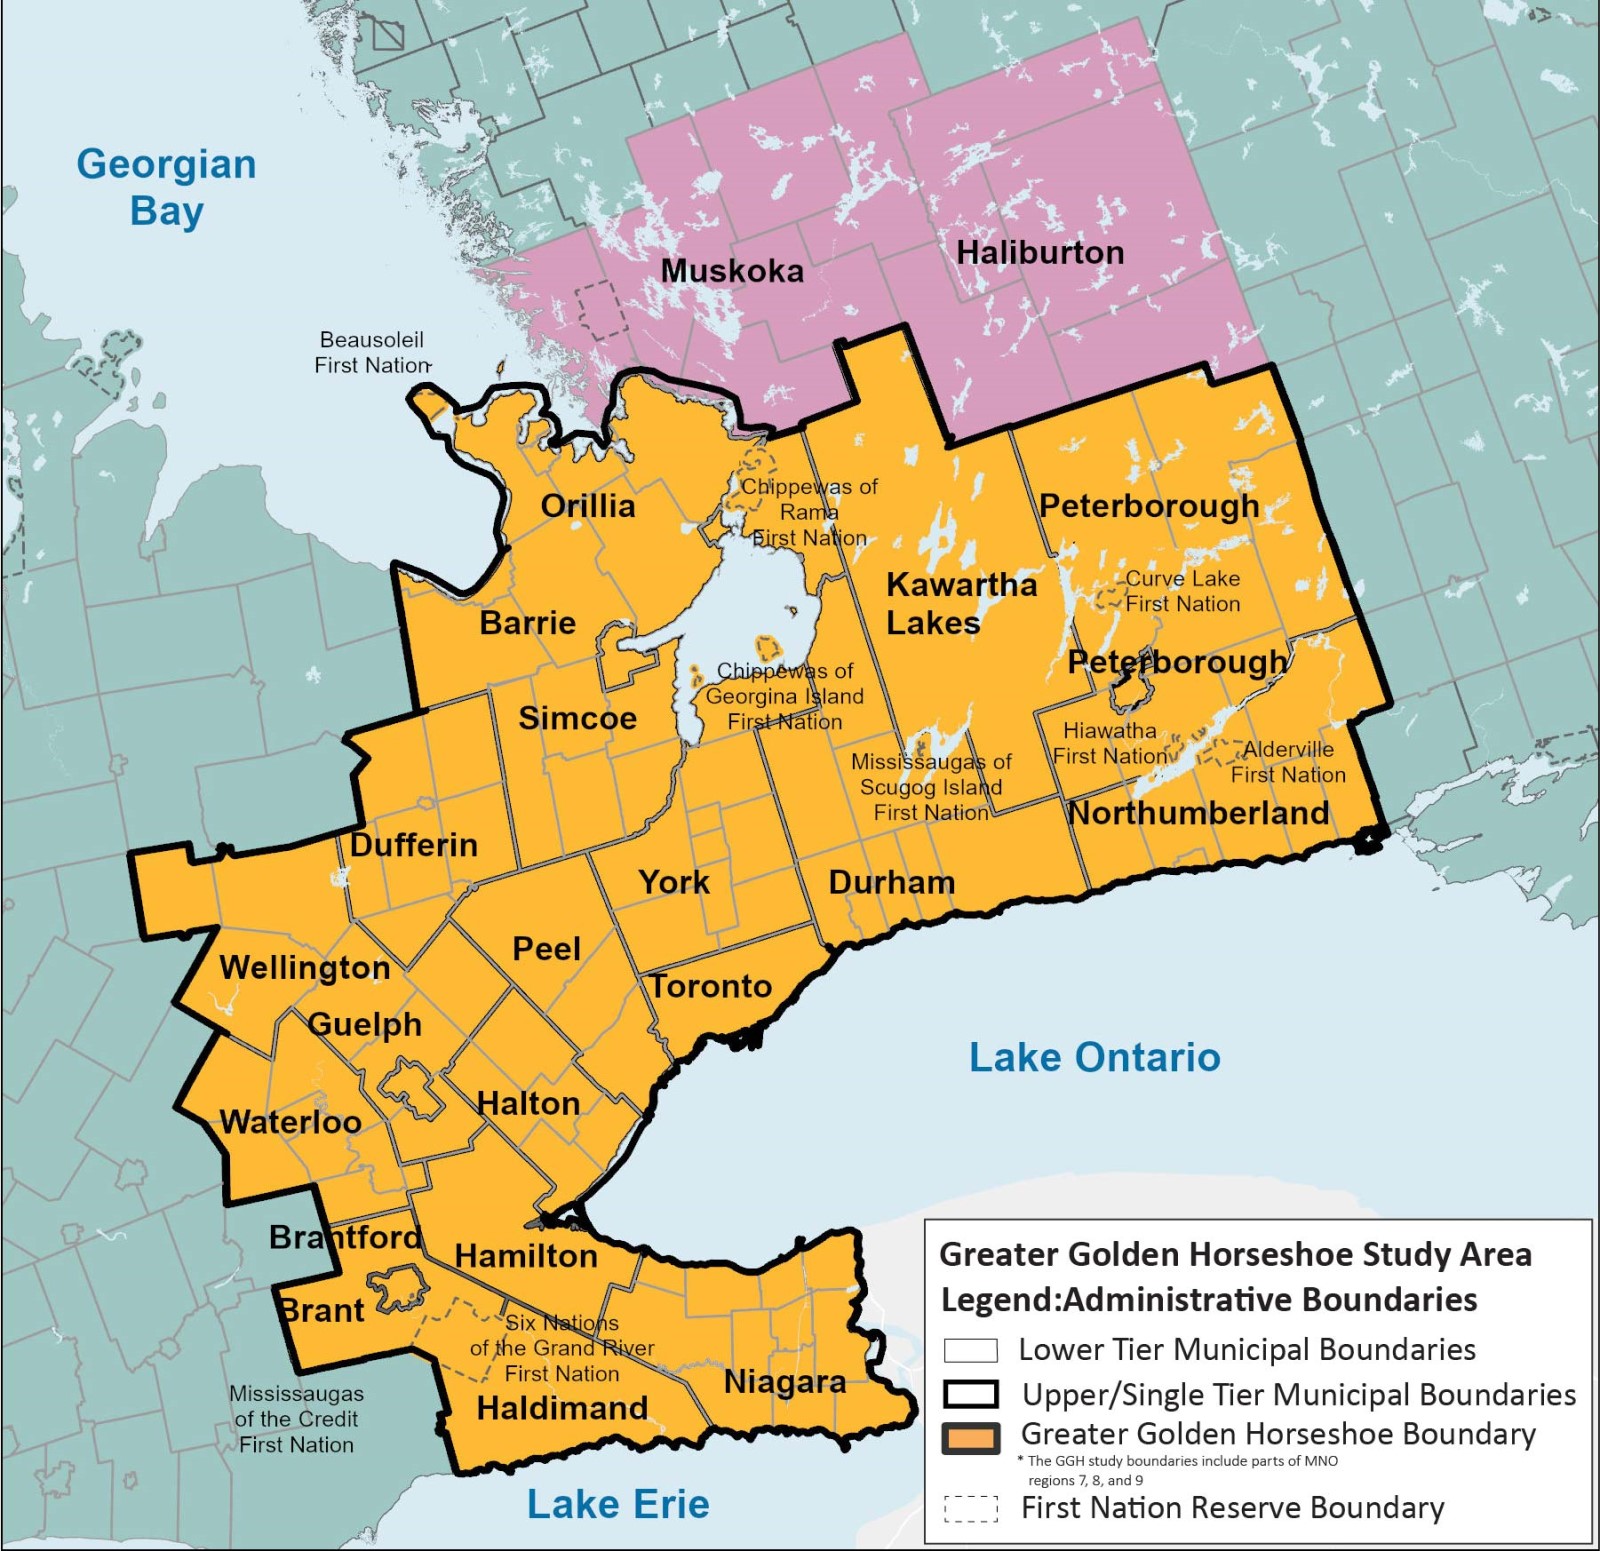
The Greater Golden Horseshoe (GGH) is the urban region centred around the City of Toronto, located at the western end of Lake Ontario. It stretches north to Georgian Bay, south to Lake Erie, west to Wellington County and Waterloo Region, and east to the counties of Peterborough and Northumberland (Map 1). It is home to 10 million people, or two-thirds of Ontario’s population.
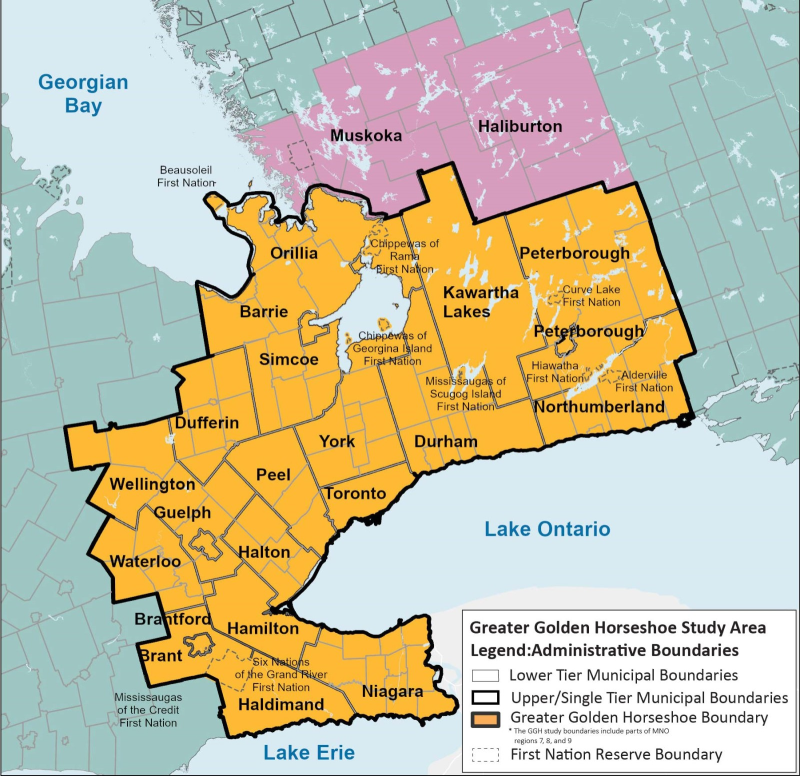
Map 1: Greater Golden Horseshoe Study Area. View a larger version of this map (jpg).
Legend: Administrative boundaries — Lower Tier Municipal Boundaries, Upper/Single Tier Municipal Boundaries, Greater Golden Horseshoe Boundary (the GGH study boundaries include parts of MNO regions 7, 8, and 9), First Nation Reserve Boundary.
The GGH is the economic engine of the province and country. Two-thirds of Ontario’s gross domestic product (GDP)
The purpose of the GGH Transportation Plan is to provide a 30-year vision for mobility across the region to guide and align planning and investments by the province and other transportation providers that will:
- fight gridlock and improve road performance
- get people moving on a connected transit system
- support a more sustainable and resilient region
- efficiently move goods
Regional Transportation Planning in Ontario
The Ontario government is releasing a series of regional transportation plans that will help build a better transportation system to keep goods and people moving across the province. In addition to this GGH Transportation Plan, Ontario has released draft transportation plans for Southwestern Ontario and Northern Ontario, and plans to release a Draft Eastern Ontario Transportation Plan in early 2022.
Connecting the Southwest: A Draft Transportation Plan for Southwestern Ontario includes initiatives such as widening Highway 3, making Highway 401 safer, supporting the trucking industry with more and improved rest areas, transit projects in London, and more passenger rail options to travel across the region. In addition, MTO has established a task force of local leaders to advise the government on additional actions and in particular work towards integration and enhancement of public transit and community connections.
Connecting the North: A Draft Transportation Plan for Northern Ontario includes actions such as widening more sections of Highways 69, 11/17 and 17, investing in remote airports, adding new Ontario Northland bus routes, investing in new and enhanced rest areas, supporting economic recovery from COVID‑19, offering the G1 knowledge test in Indigenous languages, and continuing to move forward on a plan for passenger rail services in northeastern Ontario.
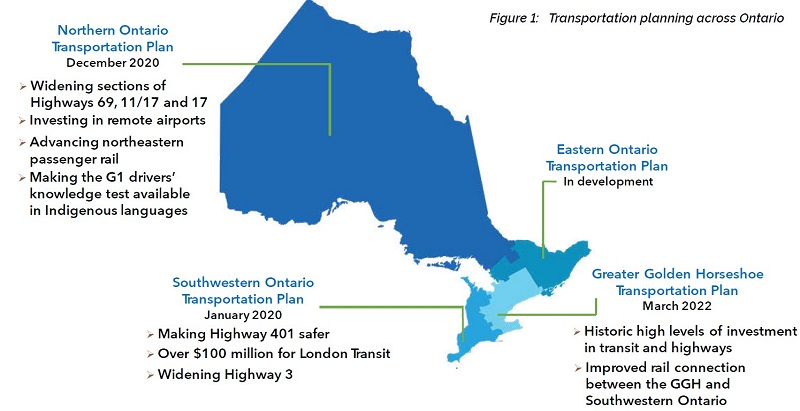
Figure 1: Transportation planning across Ontario. View a larger version of this map (PNG).
Northern Ontario Transportation Plan (December 2020)
- Widening sections of Highways 69, 11/17 and 17
- Investing in remote airports
- Advancing northeastern passenger rail
- Making the G1 drivers’ knowledge test available in Indigenous languages
Southwestern Ontario Transportation Plan (January 2020)
- Making Highway 401 safer
- Over $100 million for London Transit
- Widening Highway 3
Eastern Ontario Transportation Plan (in development)
Greater Golden Horseshoe Transportation Plan (March 2022)
- Historic high levels of investment in transit and highways
- Improved rail connection between the GGH and Southwestern Ontario
2.0 Getting around the GGH: Why we need a transportation plan
The GGH transportation system today
The GGH is a dynamic and rapidly growing region. It is a nationally significant hub for goods movement and business travel that sees $1.16 trillion in goods transported annually on its highways. It is a critical gateway for trade and tourism, with over 22 million trips taking place every day throughout the region, including 2 million transit trips.
As a hub for goods movement, the GGH plays an important role in supporting a wide range of industries, from agriculture to e-commerce. The region is in close proximity to the border of the United States (U.S.), and within a day’s drive of more than half of the U.S. and Canadian populations. This allows for access to major markets of the U.S. Midwest and East Coast, and linkages to northern and eastern Ontario.
The GGH transportation system is multimodal, comprised of road, rail, marine, air, bicycle, and pedestrian networks to move people and goods through the region. The regional transportation system includes hubs that function as transfers between modes and gateways to other parts of Ontario. The transportation system includes over 1,500 km of 400-series highways with major east-west (e.g., Highways 401, 407, QEW) and north-south (e.g., Highways 410, 427, 400 and 404) routes. The regional transit network includes GO rail lines that converge on Union Station, and span outwards to Barrie, Richmond Hill, Stouffville, Oshawa, Hamilton, Niagara, Milton, Kitchener, and with all new, historic connections beyond the region to London via Stratford and St. Marys.
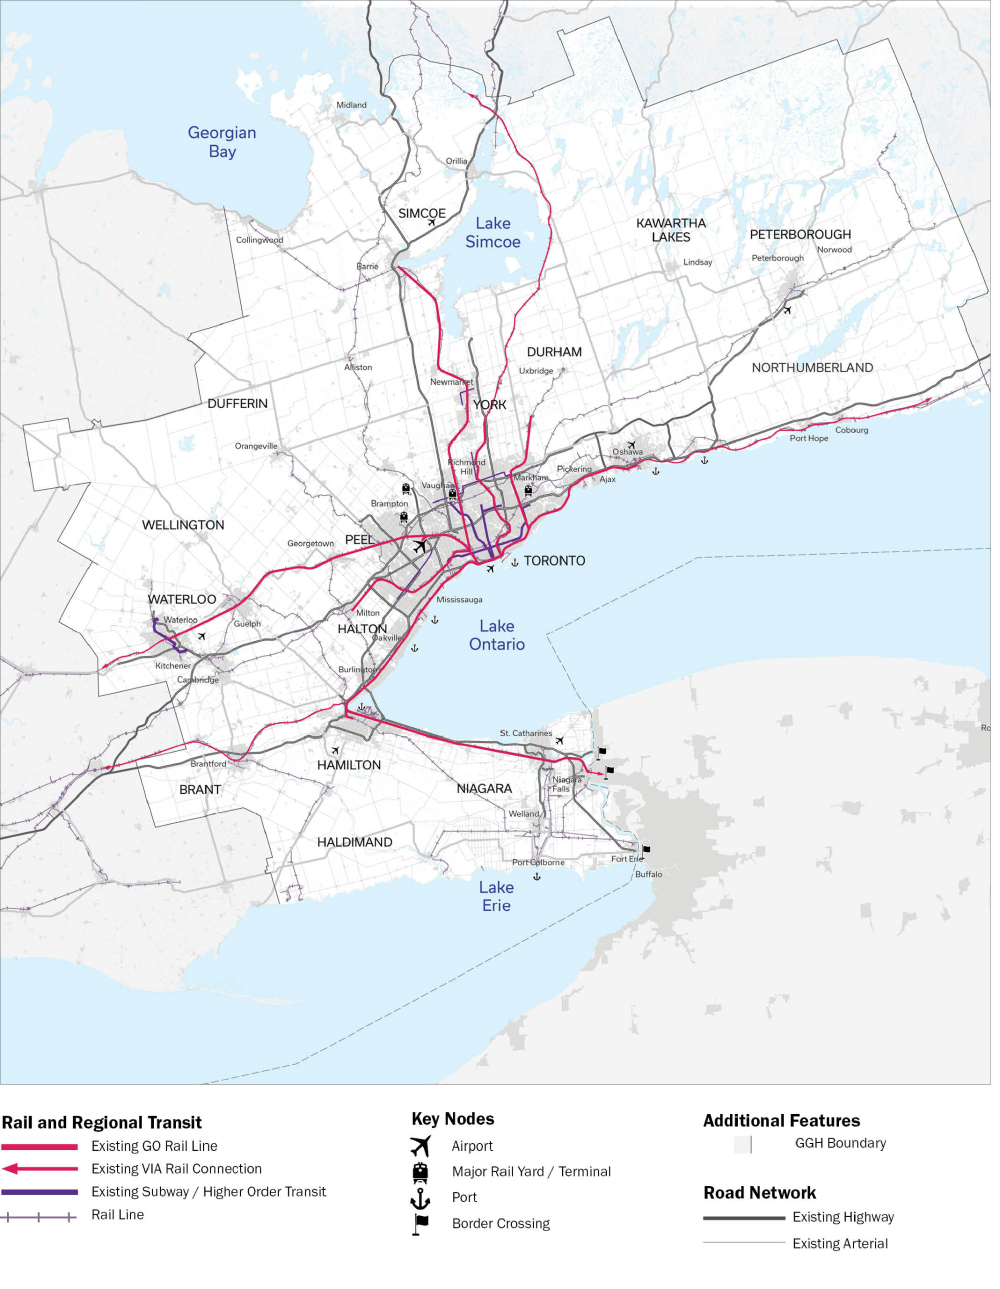
The GGH is served by many bus and other rapid transit services operated by local or regional transit agencies. It is also home to major rail networks, ports and airports that facilitate the movement of goods and people, such as CN, CP, Hamilton-Oshawa Port, Port of Toronto, Pearson International Airport and Hamilton International Airport. The major components of the transportation system in the GGH today is shown on Map 2.

Map 2: Existing transportation system map. View a larger version of this map (PNG).
Legend:
Rail and Regional Transit: Existing GO Rail Line, Existing via Rail Connection, Existing Subway/Higher Order Transit, Rail Line
Road Network: Existing Highway, Existing Arterial
Key Nodes: Airport, Major Rail Yard/Terminal, Port, Border Crossing
Additional Features: GGH Boundary
The vast majority of trips in the region take place on roads, as shown in Figure 2.
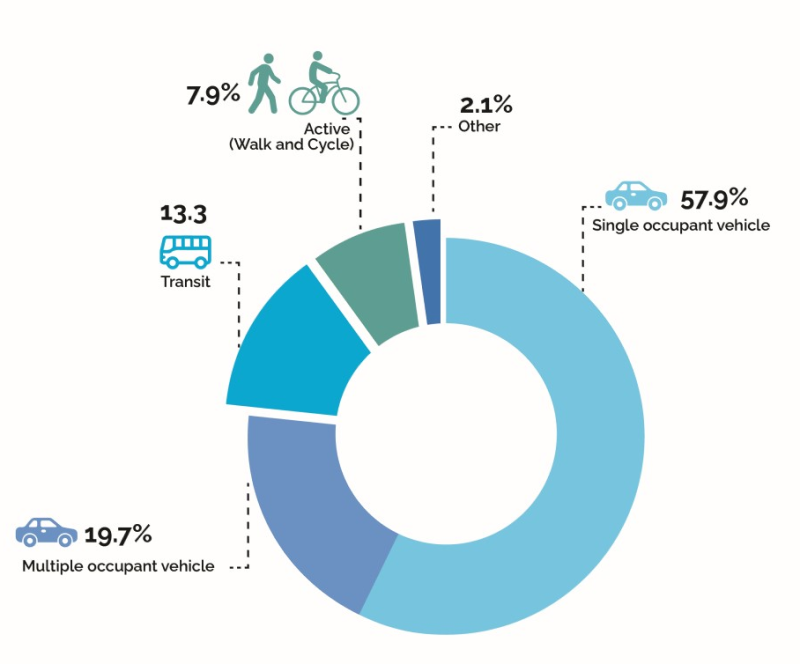
Figure 2: Transportation mode split in the GGH (2016 Transportation Tomorrow Survey)
Transportation modes splits are 57.9% single occupant vehicle, 19.7% multi-occupant vehicle, 13.3% transit, 7.9% active (walking or cycling) and 2.1% other.
Planning the transportation system for the next 30 years needs to be responsive to both current users of roads and transit, and also plan for future changes that will alter the way people use the transportation system including new technologies such as connected and automated vehicles, shifting patterns of work and where people live in the region, climate change impacts, and shifting demographics. Some of these changes have the potential to disrupt the transportation industry.
These challenges are elaborated below.
A rapidly growing and changing population
The GGH is forecast to grow from 10 million people in 2019, to 14.9 million by 2051, adding approximately one million people every five years (Figure 3).
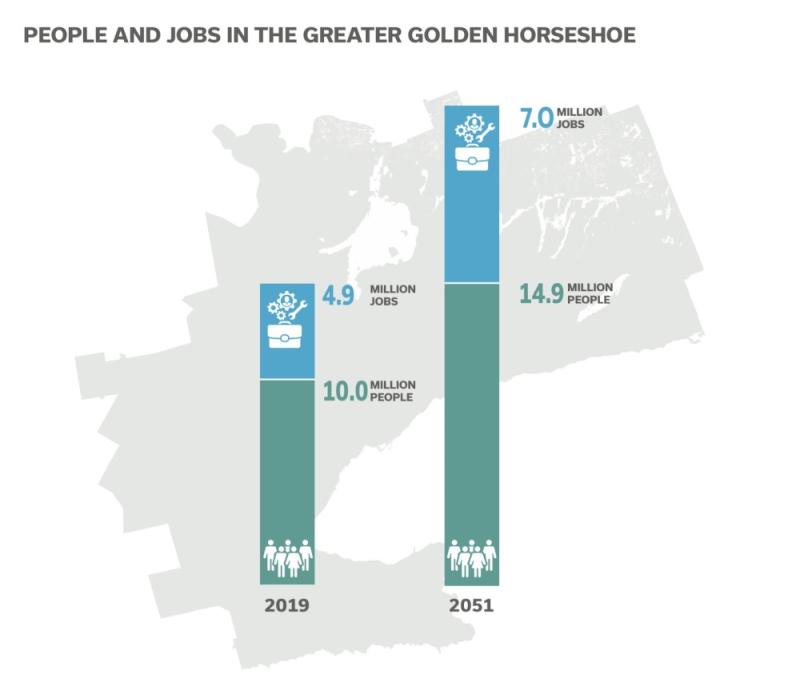
Figure 3: People and jobs in the Greater Golden Horseshoe (Amendment 1 (2020) to the Growth Plan for the Greater Golden Horseshoe 2019).
Graphic illustrating increase in people and jobs in the Greater Golden Horseshoe between 2019 (4.9 million jobs, 10.0 million people) and 2051 (7.0 million jobs, 14.9 million people).
Furthermore, patterns of travel are shifting, with an increasing demand for more choices in when and how we travel, requiring access to a robust transit system for everyday travel needs throughout the day.
Increasing impacts of gridlock on the economy
Gridlock on our highways and roads already costs the economy more than $11 billion a year in productivity and is worsening.
Figure 4 illustrates the increase in travel times we can expect on key 400-series highways if we don’t take action. These economic lifelines carrying goods across the region will experience significantly more gridlock. For example, by 2051, traveling the 401 across the GGH will take over 90 minutes longer than it takes today.
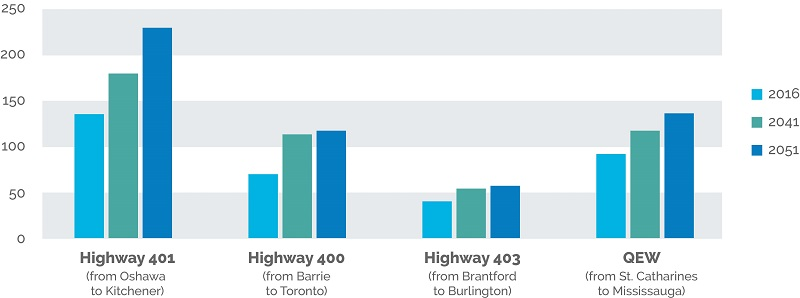
Figure 4: Modelled travel time on major highways in minutes during a.m. peak hour. View a larger version of this image (PNG).
Graphic illustrating 2016, 2041 and 2051 modelled travel time on major highways in minutes during a.m. peak hour. Travel times increase from 2016 to 2041 and to 2051 on highways 401, 400, 403 and QEW.
Highway 401 (from Oshawa to Kitchener)
- 2016 - 135 minutes
- 2041 - 179 minutes
- 2051 - 229 minutes
Highway 400 (from Barrie to Toronto)
- 2016 - 70 minutes
- 2041 - 113 minutes
- 2051 - 118 minutes
Highway 403 (from Brantford to Burlington)
- 2016 - 41 minutes
- 2041 - 55 minutes
- 2051 - 58 minutes)
QEW (from St. Catharines to Mississauga)
- 2016 - 92 minutes
- 2041 - 117 minutes
- 2051 - 137 minutes
In addition to the significant impact on the freight industry and long-distance goods movement, gridlock delays trips to work and for recreational activities, local deliveries, and overall quality of life. Addressing gridlock is therefore a top priority of this plan.
Gridlock on Highway 401
The central segment of Highway 401, between Highway 427 and Highway 404, is the most travelled, most critical piece of the highway network to the regional economy. It is:
- A high-volume carrier of long distance and commuter traffic with over 416,000 vehicles per day, including 41,000 trucks, at its busiest point.
- A significant trade corridor with over $600 million in value of goods transported daily at its busiest point, and up to 44% of Ontario’s interprovincial trade by road.
This section of 401 is experiencing gridlock today — travellers (auto drivers, truck drivers and bus drivers) spend 22 minutes on this 22 km stretch at an average speed of 60 km/hr. Without action, gridlock will be worse and travel time doubled — to 44 minutes with an average speed of 30 km/hr by 2051.
Commuter patterns are changing
Transit is a critical part of moving large numbers of people in an urban region, particularly during peak rush hour. The rapid transit projects of the past focused on getting people to work in downtown Toronto, but this approach does not meet the needs in the region today. Between 2011 and 2016, the number of morning commuting trips to downtown Toronto from regions outside Toronto declined by 3% while commutes from Toronto to outer municipalities increased by 15%.
This plan will support people travelling short distances, as well as connections for longer-distance services across the whole region and province. Ontario is improving access to transit to connect people to jobs and each other, encourage tourism and make it easier to get to a medical appointment, a grocery store or to visit family and friends.
The region is also seeing an overall shift and more variability in the times of day that people are traveling. Many industries shifted to remote work during the COVID‑19 pandemic and are expected to maintain some degree of remote work post COVID‑19. Other sectors such as transportation, warehousing and manufacturing adapted and continued their operations to provide essential services during the pandemic. These sectors, especially the ones located in more dispersed locations, are growing and are anticipated to return to normal operations.
Meeting the travel needs of rural and suburban communities
Rural areas have more dispersed population and employment, fewer mobility options and the need to travel greater distances. In rural areas in the GGH, the number of jobs that can be reached within 45 minutes by any means of transport is only a fraction compared to more urbanized areas of the region.
Creating more transportation options, including supporting drivers, is vital for rural communities. Generally, transit options and frequency between municipalities outside of urban areas are limited and take longer.
In addition to providing more access to jobs and training, enhancing transportation options and connections between smaller communities will be vital for tourism within the GGH and the province and will be essential for economic recovery. Several sectors depend on tourism for over 60% of their jobs
Addressing the impact of Ontario’s transportation sector on climate change
Addressing the issue of climate change is a global priority, one that will require the contribution of all levels of government, people, and industry.
Transportation is the largest source of greenhouse gas (GHG) emissions in Ontario and increased delays caused by gridlock in urban areas only intensify the problem. Reducing emissions from the province’s transportation sector and building a low-carbon transportation system are critical to meeting the province’s GHG commitment to reducing Ontario’s emissions by 30% by 2030 (based on 2005 levels).
Ontario is already taking action to reduce emissions and move towards a greener transportation system. GO Rail Expansion alone is estimated to reduce carbon dioxide emissions by more than 7 million tonnes by 2055. Current investments in transit are at all-time highs, including new subway and light rail lines. Ontario’s multibillion dollar commitments to extend and enhance transit services across the region, accompanied by higher density transit-oriented communities, will provide a convenient, sustainable way for people to travel. At the same time, the rapid advancement of electric vehicle (EV) technology offers Ontario an opportunity to address a key source of emissions. The number of electric vehicles registered in Ontario has doubled over the last three years. When paired with Ontario’s clean electricity grid, EVs can substantially reduce GHG emissions from personal, commercial, and transit vehicles.
New mobility services and advancing technologies
Rapidly advancing technologies are enabling new mobility models that are transforming how the transportation sector functions. Information and communications technologies are providing greater access to information on travel options and enabling new service delivery models, including on-demand mobility services such as e-scooters, bike-share and e-bike programs, ride-hailing, and car-sharing, along with Mobility as a Service (MaaS) platforms that tie together multiple transportation modes. These services, in conjunction with infrastructure investments that support their adoption, can complement existing shared modes like public transit by making it easier to get to and from transit stations or stops and providing mobility options in areas with limited transit service.
Emerging technologies such as connected and automated vehicles also have the potential to improve transportation choices within the GGH and significantly enhance accessibility in lower-density suburban and rural areas, where standard models of providing transit are most costly. Together these technologies may be able to help address first and last-mile challenges (i.e., to and from a transportation hub to the final destination like home or a business) and other mobility barriers for vulnerable groups, including seniors and people with disabilities.
The GGH Transportation Plan acts on the opportunity presented by these new technologies and mobility models to create a transportation system that supports innovation and accessibility.
3.0 A partnership approach: How we developed the plan
This plan has been developed with input from partners including municipalities, Indigenous communities and organizations, transit agencies, community and business stakeholders. The result is a comprehensive plan that addresses the priorities to fight gridlock and connect people to jobs, critical services and the region’s many tourist destinations.

View a larger version of this image (PNG).
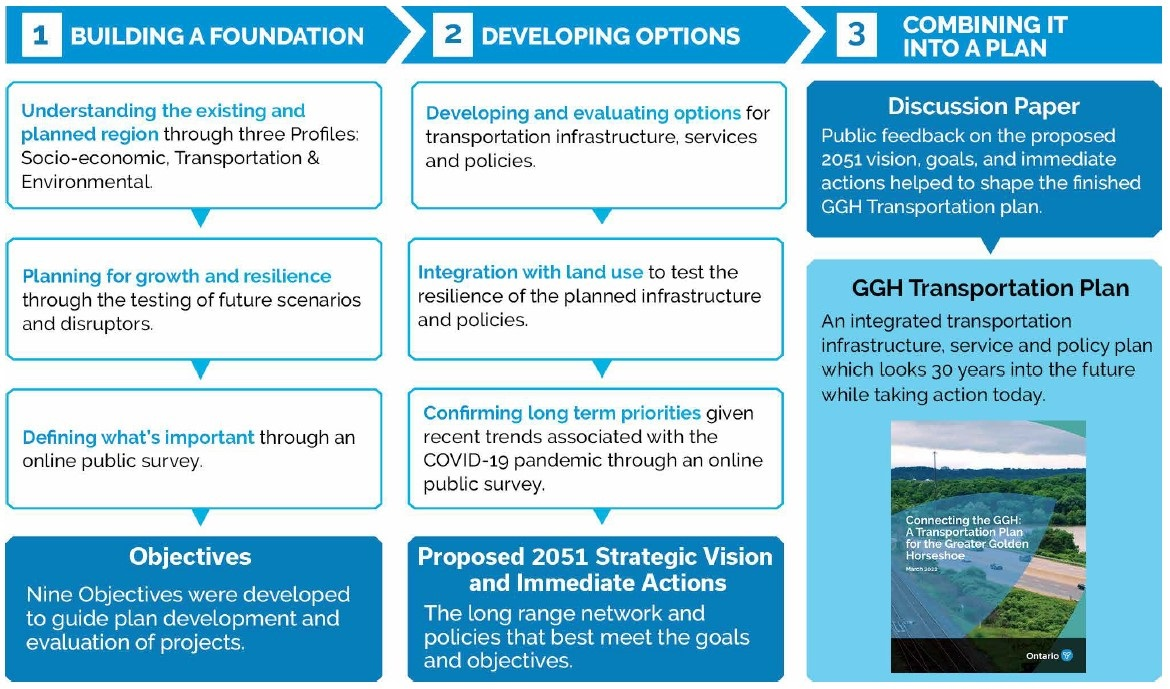
1. Building a foundation
- Understanding the existing and planned region through three Profiles: Socio-economic, Transportation & Environmental.
- Planning for growth and resilience through the testing of future scenarios and disruptors.
- Defining what’s important through an online public survey.
Objectives: Nine Objectives were developed to guide plan development and evaluation of projects.
2. Developing options
- Developing and evaluating options for transportation infrastructure, services and policies.
- Integration with land use to test the resilience of the planned infrastructure and policies.
- Confirming long term priorities given recent trends associated with the COVID‑19 pandemic through an online public survey.
Proposed 2051 Strategic Vision and Immediate Actions: The long-range network and policies that best meet the goals and objectives.
3. Combining it into a plan
Discussion Paper: Public feedback on the proposed 2051 vision, goals, and immediate actions helped to shape the finished GGH Transportation plan.
GGH Transportation Plan: An integrated transportation infrastructure, service and policy plan which looks 30 years into the future while taking action today.
Developing the 2051 elements of the plan has been a multi-step process.
First, foundational research and analysis was conducted, including forecasted growth. Map 3 shows the projected concentration of people and jobs across the GGH region by 2051. A gap analysis identified areas within the region where current plans will not adequately meet future needs. This work was used to identify locations and corridors for network enhancement through policy and/or infrastructure solutions.
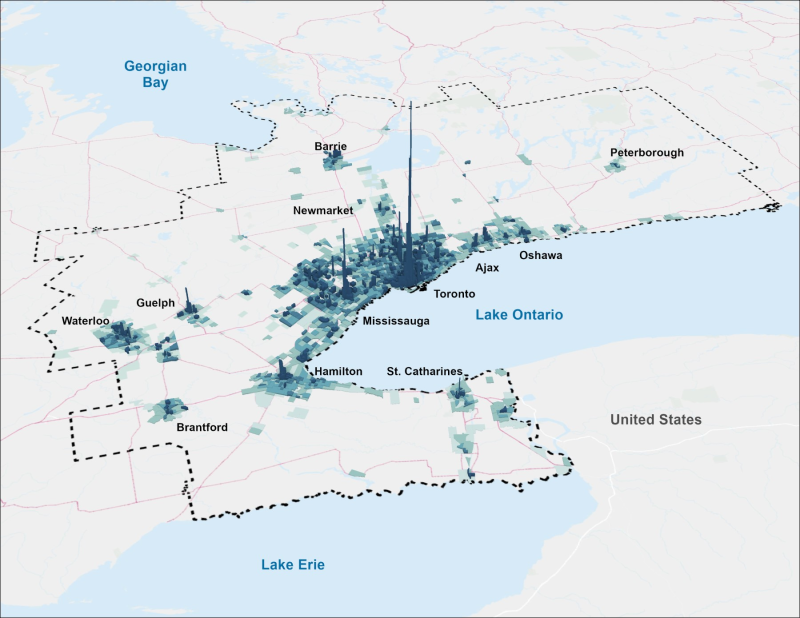
Map 3: Forecast concentration of people and jobs per hectare across the GGH in 2051, showing the highest concentrations within the Greater Toronto and Hamilton area, along with Waterloo, Guelph, Brantford, St. Catharines, Barrie and Peterborough. View a larger version of this map (jpg).
A horizon scan was conducted to identify the most significant technological and societal trends that are likely to impact the region. Different conceptual 50-year future scenarios were compared with each other and with a business as usual (BAU) scenario representing an extrapolation of current growth, trends, and policies. These scenarios revealed key transportation corridors and growth clusters that remain important under a range of future conditions.
The potential impact of disruptors was also assessed. Goods movement in the region is evolving with the rise of e-commerce and just-in-time delivery. The pandemic has disrupted societal and transportation patterns and resulted in accelerated trends in teleworking and choices in how we travel that may have long-term impacts. Each of these has the potential to affect the overall performance of the transportation system.
Guiding objectives for the regional transportation network were established through public consultation, including a public survey. An evaluation framework was derived from these objectives and used to measure and compare the performance of each transportation solution.
Based on this work, a long list of infrastructure, service improvements and policy options were developed and analyzed. Land use and transportation planning are closely related and inter-dependent, particularly in the GGH region where significant growth is taking place and space is increasingly limited. The GGH Transportation Plan used population and employment forecasts consistent with Ontario’s A Place to Grow: Growth Plan for the Greater Golden Horseshoe as the basis for the travel demand forecasts for 2051. The plan also considered scenarios where growth is more concentrated in major urban centres or more dispersed across the region to test the resilience of the planned infrastructure and policies.
Those options were then evaluated to identify the best combination of solutions to address future needs. The analysis resulted in the identification of a long-range regional transportation network, supporting policies and related actions.
Finally, public feedback on the discussion paper, Towards a Greater Golden Transportation Plan, helped to shape the plan you are reading today.
Additional background on each stage of the plan development process can be found in the Appendix.
4.0 A vision for mobility in 2051
Introduction
This chapter sets out the 30-year vision for mobility in the GGH, at a regional scale and with a focus on solutions that will have a region-wide impact. This recognizes that additional solutions may be planned at a local level, as well as beyond 2051.
Our vision is of a connected transportation system that provides safe, efficient and convenient options for people and businesses and supports the well-being and economic prosperity of the region into the future.
A more resilient road network will provide better route alternatives and more capacity in the most gridlocked areas. Transit will be available at all times of day to support access to destinations across the region. Policies such as fare integration will help to break down regional boundaries and provide a streamlined travel experience. A network of freight routes will move goods efficiently to and around the GGH and adapt to emerging trends in retail and manufacturing.

View a larger version of this image (PNG)
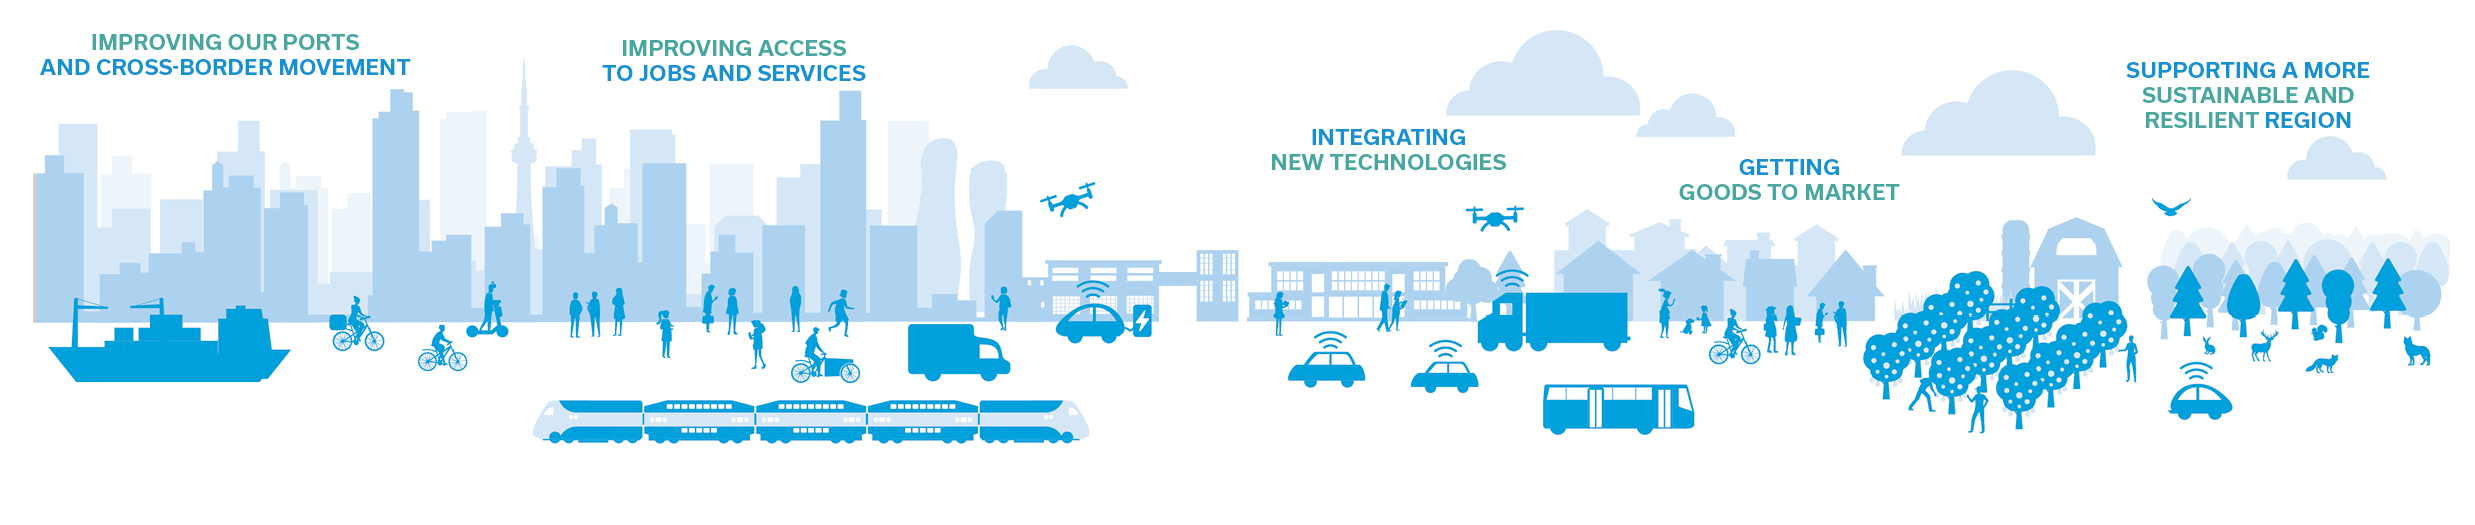
Transect of the GGH region, illustrating vision as it relates to a diverse range of various users and geographies in the region:
- improving our ports and cross-border movement
- improving access to jobs and services
- integrating new technologies
- getting goods to market
- supporting a more sustainable and resilient region
To achieve these objectives, the plan includes a mix of solutions:
- New infrastructure — more and better-connected highways, transit and walking and cycling paths, and improved road capacity in the most gridlocked areas.
- Better services — including more frequent and convenient buses, trains, and on-demand shared vehicles.
- New policies — improving the transportation experience by supporting goods movement, encouraging new ways of getting around that also improve accessibility, addressing climate change impacts, and harnessing and promoting new technology.
On their own, no single solution is sufficient to address the future transportation challenges and needs of the region. All the solutions are aimed at advancing towards the vision.
The solutions are organized into four inter-related themes that are described in the next sections: fighting gridlock and improving road performance; getting people moving on a connected transit system; supporting a more sustainable and resilient region; and efficiently moving goods (Figure 5).
Figure 5: Four interconnected themes of the 2051 Plan
A Vision for Mobility in 2051
- Fighting gridlock and improving road performance
- Getting people moving on a connected transit system
- Supporting a more sustainable and resilient region
- Efficiently moving goods
Benefits of the 2051 Plan
Together the solutions laid out in the plan will reduce gridlock, increase transit use and make high-frequency transit more accessible for low-income residents. Benefits include:
- improved average travel speeds and over 157,000 hours of total travel time savings in each morning peak, a 25% reduction
footnote 8 - reduced overall travel time for truck drivers between major hubs and gateways by nearly one hour every weekday, a saving of 34%
- over 4 million daily transit trips, a 15% increase
- over 2 million more people within a 10-minute walk of high-frequency transit, a 14% increase, including over 291,000 more low-income residents
4.1 Fighting gridlock and improving road performance
The 2051 plan will achieve a resilient road network that provides additional capacity in the most gridlocked areas, more efficient freight routes and better route alternatives. This will result in a more robust, reliable and efficient road network that will reduce delays to people and goods.
This will be achieved with a mix of new infrastructure and policies, illustrated in Map 4 and detailed below:
New infrastructure:
- A connected and reliable highway network that incorporates major projects currently at various stages of exploration, planning, design, or procurement including:
- Highway 413, a new highway connecting Highways 401, 407 ETR, 410, 427 and 400 to provide new options for drivers and freight. By 2031, the overall traffic on this route is expected to exceed 300,000 commutes per day while cutting commute times by up to 30 minutes and providing economic benefits across the entire region.
- The Bradford Bypass, a new northern freeway connection between Highway 400 and Highway 404. Motorists and trucks are anticipated to see more than a 60% savings in travel time when using the new freeway compared to existing routes along local roads, which will save up to 35 minutes.
- The Morriston Bypass, a new alignment that will enhance Highway 6 between Guelph and Hamilton and to bypass traffic around Morriston.
- Twinning of the Garden City Skyway, a new twinned structure that is a 2.2 km crossing of the Welland Canal (shipping corridor) to be constructed north of the existing bridge and will carry 4 lanes of QEW Toronto-bound traffic.
- The expansion of Highway 401 through Toronto, the region’s most travelled, most critical piece of the highway network.
- Targeted widening of other existing highways at bottlenecks across the region, including improved connections to the outer ring on Highways 400, 401, 403 and the QEW.
- An extension of Highway 404 to Highway 12 and a new corridor linking Brantford to Cambridge.
- A connected network of managed lanes: Over the lifetime of the plan the highway network will evolve, with new managed lanes implemented where appropriate and as demand warrants. This will add additional road capacity and could include HOV (High Occupancy Vehicle) lanes, dedicated bus lanes or dedicated truck lanes, depending on the needs of each corridor.
The road infrastructure described above and shown on Map 4 includes regional-scale infrastructure projects. Municipal and local road infrastructure is also an important part of the GGH transportation system, although not shown on the map, and will continue to be planned by local authorities.
Highway 401 expansion through Toronto
Ontario is setting a vision for a stronger road network by enhancing the capacity and performance on gridlocked roadways, like Highway 401. As highlighted in Near-Term Action 7, MTO is exploring options to increase road capacity along the most gridlocked section of the Highway 401 corridor to address bottlenecks, and contribute to the safe and reliable movement of essential goods along Canada’s busiest highway and critical trade corridor.
2051 Policy directions:
The following long-term policy directions will contribute to reducing gridlock and optimizing the infrastructure network described above:
- Safety: Plan and design the road network to support safety, mobility and convenient, efficient travel for all users, regardless of age, ability or mode of travel.
- Travel demand management: Reduce or shift the need to travel, particularly during peak hours, promote and incent telecommuting, flexible work hours, and alternative modes.
- Connected managed lane network: Examine the need and feasibility for the appropriate managed lane application and supporting policies in each corridor to form a connected managed lane network as identified in Map 4.
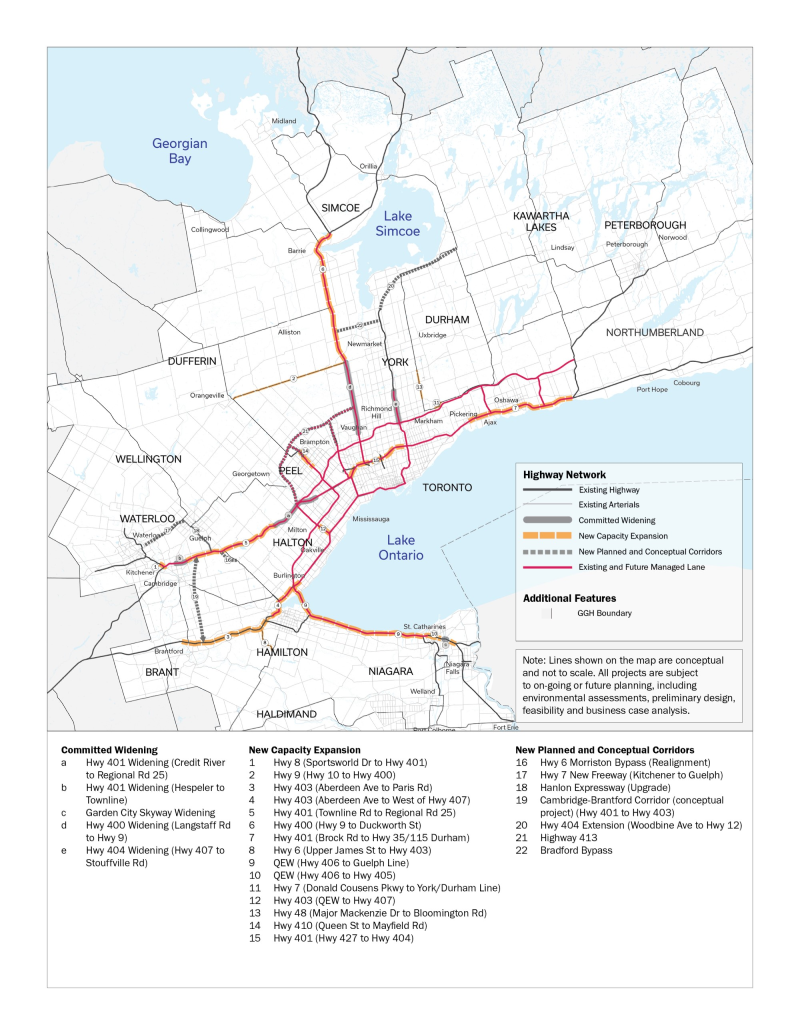
Map 4: Current, planned and conceptual future road infrastructure. View a larger version of this map (jpg).
Map shows current road infrastructure in the GGH region, including existing highways and arterials and the existing managed lane network, as well as planned and conceptual future road infrastructure, including committed widenings, new capacity expansions, new planned and conceptual corridors and future managed lanes.
Additional Features: GGH Boundary.
Note: Lines shown on the map are conceptual and not to scale. All projects are subject to on-going or future planning, including environmental assessments, preliminary design, feasibility and business case analysis.
Committed Widenings: a. Hwy 401 Widening (Credit River to Regional Rd 25); b. Hwy 401 Widening (Hespeler to Townline); c. Garden City Skyway Widening; d. Hwy 400 Widening (Langstaff Rd to Hwy 9); e. Hwy 404 Widening (Hwy 407 to Stouffville Rd)
New Capacity Expansions: 1. Hwy 8 (Sportsworld Dr to Hwy 401); 2. Hwy 9 (Hwy 10 to Hwy 400); 3. Hwy 403 (Aberdeen Ave to Paris Rd); 4. Hwy 403 (Aberdeen Ave to West of Hwy 407); 5. Hwy 401 (Townline Rd to Regional Rd 25); 6. Hwy 400 (Hwy 9 to Duckworth St); 7. Hwy 401 (Brock Rd to Hwy 35/115 Durham); 8. Hwy 6 (Upper James St to Hwy 403); 9. QEW (Hwy 406 to Guelph Line); 10. QEW (Hwy 406 to Hwy 405); 11. Hwy 7 (Donald Cousens Pkwy to York/Durham Line); 12. Hwy 403 (QEW to Hwy 407); 13. Hwy 48 (Major Mackenzie Dr to Bloomington Rd); 14. Hwy 410 (Queen St to Mayfield Rd); 15. Hwy 401 (Hwy 427 to Hwy 404)
New Planned and Conceptual Corridors: 16. Hwy 6 Morriston Bypass (Realignment); 17. Hwy 7 New Freeway (Kitchener to Guelph); 18. Hanlon Expressway (Upgrade); 19. Cambridge-Brantford Corridor (conceptual project) (Hwy 401 to Hwy 403); 20. Hwy 404 Extension (Woodbine Ave to Hwy 12); 21. Highway 413; 22. Bradford Bypass
4.2 Getting people moving on a connected transit system
The 2051 plan sets out a path to transform the regional transit system from today’s radial network with most connections centered on Union Station and downtown Toronto, to an expansive grid that allows people to travel across the region by transit, quickly and easily, without going through the core. New routes, more frequent services and more connections will all form a part of the enhanced transit network.
This transformation will be achieved with a mix of new infrastructure, services, and policies, illustrated in Map 5 and detailed below:
New rapid transit network:
- Current major projects that are at various stages of planning, design and construction including:
- Eglinton Crosstown, Hurontario, Hamilton and Finch West light rail transit (LRT) lines.
- Eglinton Crosstown West Extension with planned connection to Pearson International Airport, the Ontario Line, the Yonge North Subway Extension into York Region and three-stop Scarborough Subway Extension.
- Expanding frequent two-way, all-day 15-minute services across the GO Rail network.
- Two new conceptual cross-regional rapid transit connections:
- A new east-west line between Burlington and Oshawa, north of Toronto, that connects existing and proposed GO Rail, subway, and LRT lines outside of Union Station, and serves major employment centres and growth areas.
- A new transit loop that connects the Ontario Line to new major transit hubs where regional services connect, including Pearson International Airport and Richmond Hill Centre, and to other subway and GO Rail lines.
The 2051 network in the plan represents a long-term vision to guide future planning. The rapid transit described above and shown on Map 5 includes higher order regional transit, including GO Rail, subways, LRT and bus rapid transit (BRT). As a transit project advances through planning studies and business cases, the ultimate transit type, technology, and alignment may change and evolve over the lifetime of this plan. Other types of transit, such as priority bus routes and local transit, are an important part of the system and will continue to be planned by municipalities in coordination with Metrolinx.
MTO also recognizes that there are other transit concepts and initiatives across the region that are not shown on Map 5. These initiatives may include, for example, new passenger rail services to Bolton and Cambridge. MTO will continue to work with municipalities and Metrolinx to review these initiatives and other future transit needs throughout the region.
Transforming the transit network through cross-regional connectivity
The 2051 network includes a new concept for an east-west higher order transit connection across the top of Toronto that would connect existing and planned GO Rail, LRTs, and subways between Burlington and Oshawa. It would transform the regional transit system from today’s radial commuter network centred on Union Station to an expansive grid, so people can get where they need to go without going through the downtown core. This new line will build on already protected lands for the 407 Transitway, a bus rapid transit corridor parallel to Highway 407.
New services:
- New regional bus services better connecting the outer ring municipalities and rural areas of the GGH, with a network of enhanced, existing and new regional bus connections delivered by public, private, and/or on-demand operators.
- Frequent local transit service goal of 10 minutes or less during peak periods in all urban areas in the region, providing local service and connections to and from the higher order transit network.
- Improved 24-hour transit connections to the region’s largest employment areas, providing workers convenient access to the higher order transit network.
- Improved passenger rail service between Toronto, Peterborough, Eastern Ontario and Québec.
Importance of local transit connections
Making local transit more accessible and reliable for users will go a long way to increase transit use and relieve gridlock. The transportation plan sets a goal of frequent local transit service of 10 minutes or less during peak periods, in all urban areas in the GGH. This will help people who rely on local transit exclusively or use it to connect into the higher order transit system.
2051 Policy directions
The following long-term policy directions will support and enable the regional transit system to perform as planned:
- An integrated region-wide transit system: Integrating transit fares and services will improve the transit user experience, provide seamless connections across the region and make travel by transit a more convenient and accessible option.
- Improved services and greater access across the transit system for underserved areas and communities, will make transit and other transportation services more convenient and affordable for a full range of users.
- First and last-mile connections between stations and communities will be safe and convenient.
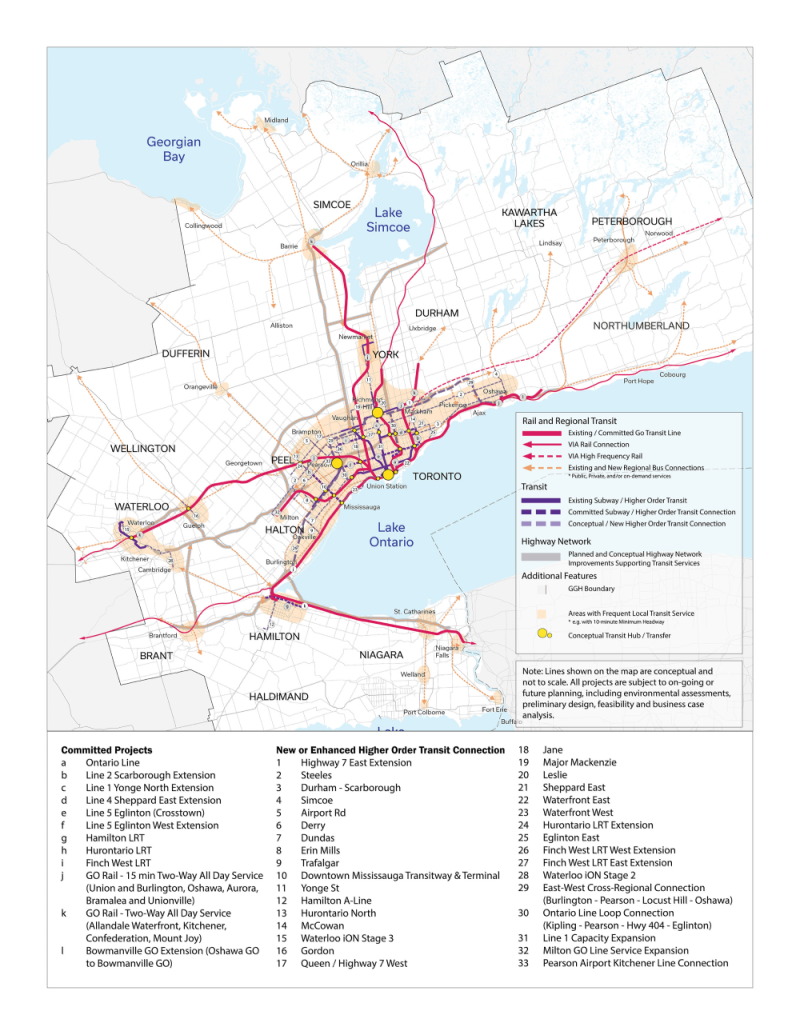
Map 5: Current, planned and conceptual future transit infrastructure and services. View a larger version of this map (PNG).
Legend:
Rail and Regional Transit: Existing/Committed GO Transit Line, via Rail Connection, via High Frequency Rail, Existing and New Regional Bus Connections (Public, Private and/or on-demand services)
Transit: Existing Subway/Higher Order Transit, Committed Subway/Higher Order Transit Connection, Conceptual/New Higher Order Transit Connection
Highway Network: Planned and Conceptual Highway Network Improvements Supporting Transit Services
Additional Features: GGH Boundary, Areas with Frequent Local Transit Service (e.g. with 10-minute Minimum Headway), Conceptual Transit Hub/Transfer
Note: Lines shown on the map are conceptual and not to scale. All projects are subject to on-going or future planning, including environmental assessments, preliminary design, feasibility and business case analysis.
Committed Projects: a. Ontario Line; b. Line 2 Scarborough Extension; c. Line 1 Yonge North Extension; d. Line 4 Sheppard East Extension; e. Line 5 Eglinton (Crosstown); f. Line 5 Eglinton West Extension; g. Hamilton LRT; h. Hurontario LRT; i. Finch West LRT; j. GO Rail — 15 min Two-Way All Day Service (Union and Burlington, Oshawa, Aurora, Bramalea and Unionville); k. GO Rail — Two-Way All Day Service (Allandale Waterfront, Kitchener, Confederation, Mount Joy); l. Bowmanville GO Extension (Oshawa GO to Bowmanville GO)
New or Enhanced Higher Order Transit Connection: 1. Highway 7 East Extension; 2. Steeles; 3. Durham — Scarborough; 4. Simcoe; 5. Airport Rd; 6. Derry; 7. Dundas; 8. Erin Mills; 9. Trafalgar; 10. Downtown Mississauga Transitway & Terminal; 11. Yonge St; 12. Hamilton A-Line; 13. Hurontario North; 14. McCowan; 15. Waterloo ion Stage 3; 16. Gordon; 17. Queen/Highway 7 West; 18. Jane; 19. Major Mackenzie; 20. Leslie; 21. Sheppard East; 22. Waterfront East; 23. Waterfront West; 24. Hurontario LRT Extension; 25. Eglinton East; 26. Finch West LRT West Extension; 27. Finch West LRT East Extension; 28. Waterloo ion Stage 2; 29. East-West Cross-Regional Connection (Burlington — Pearson — Locust Hill — Oshawa); 30. Ontario Line Loop Connection (Kipling — Pearson — Hwy 404 — Eglinton); 31. Line 1 Capacity Expansion; 32. Milton GO Line Service Expansion; 33. Pearson Airport Kitchener Line Connection
4.3 Supporting a more sustainable and resilient region
The 2051 plan sets out a path toward a more sustainable and resilient region. This section contains policy directions that apply generally across the transportation system. Other sections of the 2051 plan contain policies that are focused on making certain modes more sustainable. The entire plan works together, and with other provincial plans and legislation to support healthy communities and resilient infrastructure.
A sustainable and resilient transportation system means using lower carbon solutions, planning and designing it with more low-carbon enabling and climate resilient infrastructure, and harnessing new technology and innovations that can be designed for an unknown future, ultimately giving users more choice for moving people and goods in the region.
New infrastructure and services:
- When complete, the new transit and highway improvements set out in this plan will result in a more sustainable and resilient transportation system. They include:
- The largest rapid transit expansion in Canadian history, including over 40 km of new subway, multiple new LRTs and two-way, all day service across the majority of the GO passenger rail network, will provide more convenient and sustainable choices to people across the region and beyond.
- New highways (e.g., Highway 413, Bradford Bypass, Morriston Bypass, and new Highway 7 from Kitchener to Guelph) and expanded highways in the GGH (e.g., Highways 401, 400, 403, 404 and the QEW) to combat gridlock and create a more resilient network for people and goods movement.
2051 Policy directions:
- Transit-oriented communities (TOCs) with compact, walkable and transit-oriented design reduce the distances travelled for daily needs and provide choice of mode, decreasing individual emissions.
- Active transportation, including walking and cycling, is an attractive and widely available choice for short trips.
- E-bikes, e-scooters and other single-rider vehicles provide a safe and convenient alternative to reduce gridlock, make small scale deliveries and connect to transit.
- The impact of Ontario’s transportation sector on GHG emissions and climate change is reduced through targeted actions to achieve a green transportation system.
- Ontario businesses are supported in developing new sustainable mobility technologies.
- New service delivery models and innovative technologies, such as automated, connected and electric vehicles, are more widely available to support sustainable mobility, improve road safety, and increase access to both transportation and information on travel options.
- Resiliency to the impacts of climate change, including extreme weather events and flooding, is prioritized in the planning, design, operation, and maintenance of the regional transportation system.
Reducing GHG Emissions from the Transportation Sector
The transportation sector continues to be Ontario’s largest source of GHG emissions, accounting for 36% of all emissions in 2019.
In the development of this plan, MTO analyzed the relative emissions impacts of potential future scenarios and combinations of infrastructure, policy, and technology solutions.
Many factors can contribute to reductions in GHG emissions, including increases in telecommuting, transit ridership, safe cycling infrastructure and more walkable communities. However, the single most important source of transportation emissions reductions potential in Ontario is from the widespread adoption of low and no emission vehicles such as electric vehicles as illustrated in Figure 6.
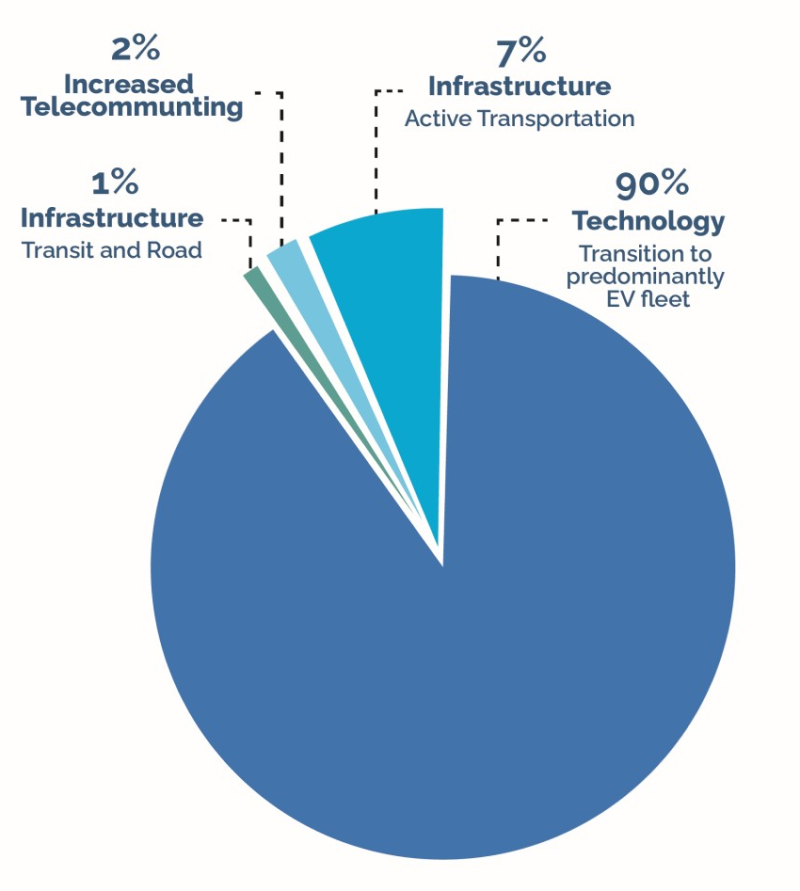
Figure 6: Relative long-term emissions reduction potential of solutions assessed through MTO modelling
Various scenarios tested include Technology — Transition to predominantly EV fleet which results in a 90% impact, Infrastructure — Transit and Road which results in a 1% impact, Increased telecommuting has a 2% impact, and Infrastructure — Active Transportation has a 7% impact.
Accelerating the adoption of technologies that help reduce GHG emissions in the transportation sector is a key aspect of moving forward with economic recovery and climate change mitigation. Through many of the near-term actions included in the GGH Transportation Plan (detailed in section 5.6), Ontario is taking steps to increase the availability of low-and zero-carbon mobility options for people and businesses throughout the region.
4.4 Efficiently moving goods
The 2051 plan includes an integrated, multimodal Strategic Goods Movement Network (SGMN) which identifies key corridors, facilities and connections for supporting freight movement across the GGH region.
The SGMN is intended to result in multi-jurisdictional awareness, collaboration and coordination across the goods movement sector. By identifying this network as a priority for movement of freight, the SGMN allows goods movement to be better integrated into the individual planning, prioritization, construction and maintenance programs of all levels of government and among facility owners. Over the long-term, these facilities and connections will be protected for freight movement to make sure that people can get the goods they need, and businesses can thrive as the region continues to grow.
The identified network and supporting policies are illustrated in Map 6 and detailed below:
2051 Strategic Goods Movement Network:
- A connected major highway network that facilitates freight movement at all times of day to, from and through the GGH, as the core of the SGMN.
- The region’s key multimodal freight nodes including existing and planned airports, ports, rail yards and border crossings.
- A supporting arterial road network that:
- connects major freight generators across the region to each other and to the highway network
- provides reliable access for freight to multimodal nodes
- maintains consistency with municipal goods movement networks
- balances the needs of both freight and transit by prioritizing corridors for each mode
2051 Policy directions:
The following long--term policy directions will contribute to achieving the vision of an effective goods movement network:
- Plan for and manage the movement of freight on the key routes and corridors and at facilities identified in the SGMN for all modes, including road, rail, air and marine, working in partnership with those who own, maintain and use the network, so that the region is economically competitive.
- Utilize consistent design, engineering, operations, maintenance, and rehabilitation standards across the SGMN corridors, and protect the corridors from adverse new development that undermines goods movement uses. This will build on best practices and well-established guidelines such as the “Freight-Supportive Guidelines” and the Railway Association of Canada’s “Guidelines for New Development in Proximity to Railway Operations”.
- Utilize a system of smart, connected corridors that enable real-time traffic management, improving safety, reliability, and efficiency for goods movement across the region.
- Monitor SGMN performance and utilize data-driven decision-making with freight partners to identify and address future needs and improvements.
- Utilize new logistics practices and technologies, including low- and zero-carbon urban goods delivery and use of off-peak delivery hours, to improve the environmental sustainability and efficiency of freight movement.
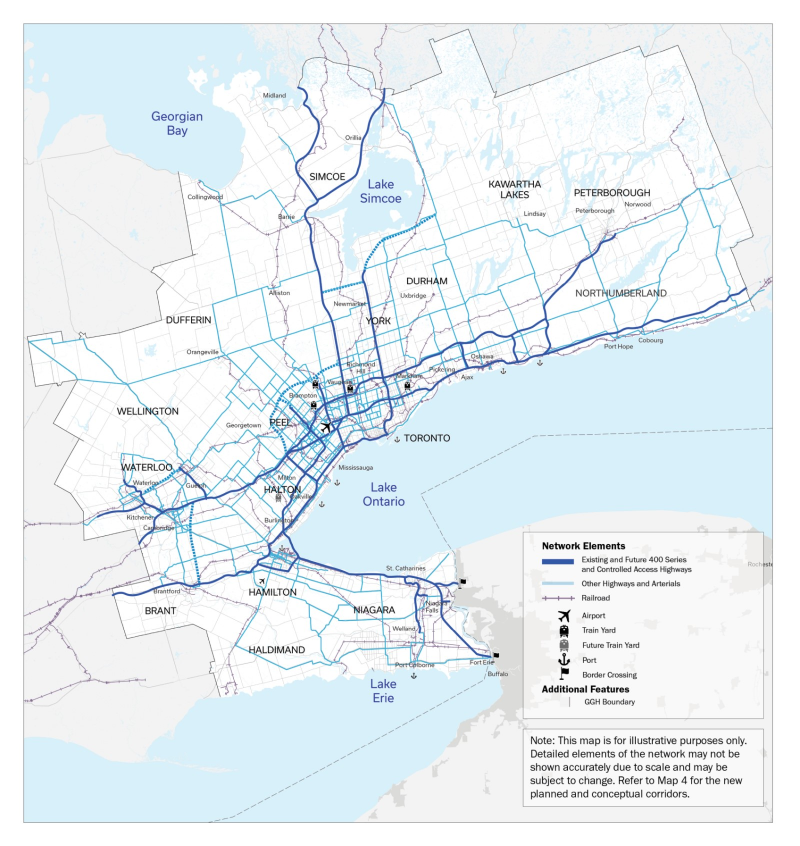
Map 6: Current, planned and conceptual Strategic Goods Movement Network elements. View a larger version of this map (jpg).
Legend:
Network Elements: Existing and Future 400 Series and Controlled Access Highways, Other Highways and Arterials, Railroad, Airport, Train Yard, Future Train Yard, Port, Border Crossing
Additional Features: GGH Boundary
Note: This map is for illustrative purposes only. Detailed elements of the network may not be shown accurately due to scale and may be subject to change. Refer to Map 4 for the new planned and conceptual corridors.
5.0 Building toward our vision: Taking action now
The previous chapter outlined a long-term vision for the transportation system. Progress is already being made towards this vision, with many actions underway. This chapter sets out over 100 actions, organized under seven goals, where meaningful improvements to infrastructure, services and policies will be made to help us move toward achieving the vision for 2051:
- Fight Gridlock
- Improve Transit Connectivity
- Give Users More Choice
- Keep Goods Moving
- Safe and Inclusive Transportation System
- Future Ready
- Connections Beyond the GGH
5.1 Actions to fight gridlock
Mounting gridlock is a significant drain on the region’s economy, and targeted highway expansions and improvements are a key part of the solution.
The province is taking action in the following key areas to fight gridlock: build new and faster route alternatives, expand and optimize existing corridors, provide alternative ways to travel or access services, support real-time management of the road network and incentivize more sustainable modes of travel.
Build new and faster route alternatives
- Complete route planning, preliminary design and environmental assessment work for Highway 413, which will provide new connections and options, and alternate routes in case of highway closures, between Halton, Peel and York regions for both passengers and goods.
- Advance engineering and environmental assessment work for the Bradford Bypass, a new controlled access freeway that will connect two busy Ontario highways — Highway 400 and Highway 404 — in Simcoe County and York Region.
Bradford Bypass
Simcoe County is expected to experience rapid population growth over the next 10 years, and York Region will grow to 1.79 million residents by 2041. The Bradford Bypass would relieve gridlock on existing east-west local roads between Highway 400 and Highway 404 and support development in Simcoe County and York Region. It would also provide a northern freeway connection between Highway 400 and Highway 404. Motorists and trucks are anticipated to see more than a 60% savings in travel time when using the new freeway compared to existing routes along local roads, saving up to 35 minutes.
- Continue to design and update the environmental assessment for Highway 6 between Hamilton and Guelph (Morriston Bypass) and advance part of the project by initiating construction procurement for the Highway 6/Hanlon Expressway Mid-block interchange to help ease gridlock in this area.
- Continue engineering and environmental planning work for a new Highway 7 between Kitchener and Guelph and advance part of the project by initiating construction procurement for the Frederick Street Bridge replacement.
- Continue pre-construction activities for the QEW Garden City Skyway Bridge Twinning and Rehabilitation project, including field investigations, property acquisition and utility relocations.
Expand and optimize existing corridors
- Expand highways and continue to build out the managed lanes network, including committed HOV lane expansions on:
- Highway 400 from Langstaff Road to Highway 9 in York Region
- Highway 401 between Milton and Mississauga
- Commence work towards a major gridlock relief solution to add lane capacity in the central Highway 401 corridor between Highway 427 and Highway 404.
- Implement bus bypass lanes on Highways 8 and 401, working with the Region of Waterloo, to provide more efficient local and regional bus services between Kitchener and Cambridge. The bypass lanes benefit local transit, GO buses, and private carriers.
Increased Speed Limits Pilot
In September 2019, the speed limit on 32 km of the Queen Elizabeth Way, from Hamilton to St. Catharines, was increased to 110 km/hr as a pilot initiative to assess the impact of raised speed limits on the safety and operations of 400-series highways. The pilot is now being extended. 80% of the over 8,300 respondents to a survey supported the raised speed limit pilot. Ontario’s highways are among the safest in North America and have ranked the lowest or second lowest in fatality rates among all jurisdictions for 18 consecutive years.
- Widen Highway 401 from Regional Road 24 (Hespeler Road) easterly to Townline Road in Cambridge.
- Continue construction of replacement of Grand River bridges on Highway 401 in Kitchener.
- Identify and implement operational and infrastructure improvements to rail corridors where conflicts exist between passenger and freight rail demands on the existing rail network, working with provincial agencies and rail owners/operators, as applicable.
Provide alternative ways to travel or access services
- Work with Infrastructure Ontario and Metrolinx to develop transit-oriented communities (TOCs) at new and existing transit stations to provide more options for people to live and work near transit, increase housing supply, including affordable housing, increase transit ridership, support economic development, and reduce gridlock.
Leveraging partnerships for transit-oriented communities
The province is working with Infrastructure Ontario and Metrolinx to consider TOC opportunities along the four priority subway projects and at new and existing GO and light rail transit stations.
The TOC approach leverages partnerships with the private sector, which saves taxpayers’ money and accelerates the delivery of transit infrastructure that is integrated into the structure of the development. It results in vibrant, higher density, mixed-use, walkable communities that are connected to transit stations. By creating complete communities based on good planning principles, TOCs will reduce gridlock and make it easier to get to where you need to go, whether you walk, cycle, take transit or drive.
As part of the program, Ontario is proposing two TOCs along the Yonge North Subway Extension at the Bridge and High Tech stations. The communities would include commercial, office and retail space to support new jobs in the region and improve housing supply. Ontario is also exploring TOCs along the future Ontario Line that would help bring more jobs and housing closer to transit.
- Continue recent progress made during the COVID‑19 pandemic in e-service delivery. Through MTO’s Digital First program, the ministry is enhancing the public and business experience for the most used services, such as moving from in-person channels to online, making services simpler, better, faster and more accessible.
- Develop alternative workplace models, government service delivery models and support enabling factors that reduce the need for travel such as expanding broadband internet, e-services, remote work and education and flexible work hours.
Support real-time management of the road network
- Implement operational improvements to traffic management technologies and practices, including:
- Implement signal timing and signal priority improvements that benefit active transportation and transit, where appropriate.
- Apply real-time traffic management technologies to optimize the capacity of the existing highway network, including ramp metering and variable speed limits on highways.
- Incorporate advanced traffic management system infrastructure in highway improvement projects.
- Modernize data collection and sharing, working in partnership with municipalities, Indigenous communities and transportation service providers across the region, including:
- Advance efforts to publish open data and information from a wide range of data sources, including transportation surveys and travel data.
- Improve transportation data collection practices to obtain more accurate and comprehensive data across the region to inform traffic management practices, including off-peak travel patterns, active transportation use, collision and safety incidents and supply chains and goods movement.
- Explore the creation of standards for transportation data sourcing, formatting, privacy, security, ownership and reporting.
Incentivize more sustainable modes of travel
- Work with municipalities, Indigenous communities, transit agencies, school boards and other community partners to increase the use of active transportation and low-carbon modes (such as transit) for trips to and from school.
- Explore strategies to encourage riders to take transit outside peak hours.
5.2 Actions to improve transit connectivity
Ontario is taking action now to make transit a more viable travel option for people throughout the region. Working closely with Metrolinx, an agency of the Government of Ontario, progress is being made toward an efficient, accessible, and reliable regional transit network in the GGH.
While the COVID‑19 pandemic has had a significant impact on transit systems, it is more important than ever to take a long-term view to building out and improving the transit network for the future.
The province is taking action in three key areas: transit connectivity, transit fare and service integration, and access to transit by active transportation.
Enhance and expand transit service connectivity
- Build the following new transit routes and stations as part of the largest transit expansion in Canadian history:
- Ontario Line Subway
- Eglinton Crosstown West Extension
- Yonge North Subway Extension
- Scarborough Subway Extension
- Finch West Light Rail Transit
- Hurontario Light Rail Transit
- Hamilton Light Rail Transit
Priority Transit Projects for the Greater Toronto Area
Ontario’s $28.5B subway program — the largest transit investment and expansion of its kind in Canadian history — will transform the GGH’s transit network into the modern, connected system that the region deserves. This includes the all new Ontario Line, three-stop Scarborough Subway Extension, the Eglinton Crosstown West Extension and the Yonge North Subway Extension. These four projects will grow Ontario’s subway network by more than 50%.
Through Ontario’s landmark partnerships with the Federal Government, City of Toronto and York Region, the province’s progress on transit is unprecedented. Work is advancing on all of the four priority subway projects in the Greater Toronto Area that will deliver convenient, reliable and efficient rapid transit that best serves the region for generations to come.
- Work to provide two-way, all-day service every 15 minutes across the GO Transit rail network.
GO Expansion Program
Since 2018 the number of GO train trips per day has increased by 27% on weekdays and 23% on weekends—bringing services to Niagara more than four years sooner and avoiding billions in capital costs expected under the previous government.
Metrolinx continues to steadily increase GO Train service in the GGH. And now, through the GO Rail Expansion program, the province is transforming the GO rail network into a comprehensive, all-day rapid transit network that will provide two-way, all-day service every 15 minutes over core segments of the GO Transit rail network, a faster and more efficient fleet, upgraded signalling that enhances safety and performance, more accessible stations and an expanded Union Station. The next stage of delivering the GO Rail Expansion program is underway through the On-Corridor Works project, a multi-year undertaking that will facilitate improved train service, including electrification infrastructure, as well as the operations and maintenance of the GO rail network. Service changes are already underway.
- Continue to work with freight rail partners to seek options to explore GO Rail service enhancements to Niagara Region, Waterloo Region, Milton and Bowmanville. In 2019, the Ontario government introduced weekday GO train service to Niagara Falls and St. Catharines on the Lakeshore West line, delivering this service four years sooner than originally promised.
- Advance preliminary design for future higher order transit corridors, including the Durham-Scarborough, Dundas-Toronto-Mississauga-Halton, and Brampton-Queen/Highway 7- York BRT corridors.
- Design high-quality transit hubs as part of each transit project that bring together local buses and rapid transit lines.
- Explore early corridor planning analysis for the Sheppard East subway extension, a new east-west cross-regional connection between Burlington and Oshawa, and a new transit loop that connects to the Ontario Line. The planning work will confirm feasibility, analyze project options, and network connectivity.
- Work with Metrolinx and the Town of Caledon to monitor transit demand and advance the business case for passenger rail service, and continue to protect for potential future rail service opportunities.
- Fund transportation programs and investments across all modes in collaboration with municipal and federal governments, including through existing programs such as Ontario’s Dedicated Gas Tax Funds for Public Transportation Program and Investing in Canada Infrastructure Program.
Improve the transit user experience with a more integrated region-wide transit network
- Work with local transit agencies to improve schedule and service integration and streamline fare structures in the region to improve transit and the rider experience.
- Establish a Fare and Service Integration Provincial — Municipal forum. The forum will support regional transit integration and COVID‑19 recovery by providing recommendations to the province on ways to improve transit and the rider experience in essential areas such as affordability, accessibility, mobility and access to key destinations including employment, health, social services, tourism and educational hubs.
- Provide more accessible scheduling and wayfinding information to transit and passenger transportation users, to support convenient, integrated and seamless travel across modes, service providers and boundaries.
- Expand access to open data and data exchange initiatives to facilitate more customizable, complete and accurate trip planning. Existing trip planning applications, such as the Metrolinx Triplinx trip planner, will continue to be advanced to reflect available trip data.
- Advance the use of smart phone applications, such as those enabled through presto, to integrate fare payment and trip planning, including partnerships with events and accommodations providers to encourage the use of transit.
- Identify priority bus corridor improvements to bring cost-effective, high-quality transit service to more people. Metrolinx will provide leadership and technical support, working with municipalities and Indigenous communities, to assess opportunities for implementation of measures like transit signal priority, queue jump lanes, all-door boarding, service improvements and enhanced stations and stops to improve the speed and reliability of priority bus services across the region.
- Develop, in consultation with municipalities, regional guidelines for planning and operating different transit technologies and modes such as BRT, LRT, subways, and regional rail, to deliver effective, reliable and connected local and regional transit services in different corridor contexts.
Access to transit by active transportation
- Make it easier to walk or cycle to or from transit stations by working with municipalities to prioritize and coordinate improvements to active transportation facilities, such as bike lanes, that connect to transit stations and stops, as well as improvements to transit stops, stations and vehicles, to accommodate secure bicycle transportation and storage, where feasible.
GO Transit currently provides three bike coaches on its Niagara Falls rail service, which operates from the May long weekend to Thanksgiving. As many as 100 or more riders use this very popular service on weekends to transport their bicycles. - Explore opportunities to provide better access to e-bikes, including cargo e-bikes, e-scooters and other single rider vehicles to make active transportation a more convenient alternative for shorter trips.
E-Scooter Pilot Project
In January 2020, the province launched a five-year pilot project allowing e-scooters on public roads, subject to municipal requirements. E-scooters can reduce traffic congestion, provide a way for residents to get around their communities, and provide first and last mile connections to transit.
- Continue to update Metrolinx’s 2016 GO Rail Station Access Plan to support long-term ridership growth through improved options for customers to access GO stations by walking, municipal transit, cycling, passenger pick-up and drop-off, and parking. The updated GO Rail Station Access Plan will seek to remove barriers to access the GO Rail network while prioritizing safety, customer experience, and quality of design. The plan will continue to identify station requirements that will improve pedestrian facilities, increase bike parking and improve transit access.
5.3 Actions to give users more choice
With more people walking and cycling than ever, the pandemic has highlighted the importance of providing safe travel options for everyone. Ontario is working to improve access and expand options, whether you are travelling a few blocks or across the region.
The province is taking action in four key areas to provide more transportation choice: transit availability, comprehensive active transportation network, barriers to transit access, and Mobility as a Service (MaaS).
Improve access to and availability of transit services
- Support community transportation in areas of Ontario that are unserved or underserved by transit services through the Ontario Community Transportation Grant Program. Seven municipalities in the GGH are receiving up to $6.4 million over seven years (2018-2025) to deliver local and intercommunity bus services, including some that have partnered with Indigenous communities and organizations.
The Link Bus Service
With up to $2.37 million in funding from the Ontario Community Transportation Grant Program, a new rural transportation pilot, the Link, was created through a partnership between Curve Lake First Nation, Selwyn Township, Community Care Peterborough, and the City of Peterborough. Beginning in May 2021, two routes (Route 31 and 32) are operated by Peterborough Transit on fully accessible buses. The service connects Curve Lake First Nation and Selwyn Township to the City of Peterborough via Trent University.
- Open up the intercommunity bus sector to improve transportation options, support economic recovery, and reduce red tape for business. As part of this initiative, the province is also enhancing the safety and insurance regime for bus carriers and implementing new safety requirements for vehicles with a capacity of up to nine passengers.
- Support the use of on-demand microtransit to better serve low-performing conventional routes or new routes, and to improve first-mile/last-mile connections to higher order public transit.
On-demand transit in Durham Region
In response to ridership changes during the pandemic, Durham Regional Transit launched an on-demand transit service in September 2020 on lower-frequency routes. Service areas include both urban and rural communities in the region. On-demand trips can be booked from a mobile application or by phone to travel stop-to-stop within a zone or connect to frequent routes and GO stations. Nine out of 10 riders that provided initial feedback rated their experience as positive
- Work with public transportation authorities, such as Metrolinx, to explore innovative service delivery models, working with private carriers, for the delivery of intercommunity passenger transportation services in the GGH.
- Pursue policies that prioritize transit and active transportation in development of communities and street networks.
Create a safe, connected, and comprehensive active transportation network
- Improve local and regional cycling linkages by working with municipalities, Indigenous communities, private landowners, conservation authorities and agencies such as Metrolinx to expand cycling routes, infrastructure and amenities identified in and connecting to the Province-wide Cycling Network.
- Explore opportunities to use linear corridors to expand sustainable transportation options, such as:
- Locating new active transportation and transit routes along electricity transmission and rail corridors that cross the region.
- Protecting abandoned, disused, or soon to be abandoned corridors for transportation use in the long-term.
Remove barriers to access within the transportation system
- Support accessibility improvements at regional transit facilities by convening accessible transit planning and design forums through Metrolinx, including an Accessibility Advisory Committee and an annual public regional accessibility consultation.
Metrolinx is also working with municipalities to develop standards that support customers with visible and invisible physical or mobility challenges by improving universal accessibility across the regional network and through a consistent application of Personal Assistance Intercom devices. - Prioritize active transportation and local transit improvements that connect the regional transit network with underserved communities, including Indigenous and racialized communities, low-income communities, rural communities and persons with disabilities, to make it safer, easier and faster for residents to access amenities, attractions, community destinations, employment opportunities, educational institutions and critical services.
- Establish bicycle parking provision standards that consider the number and location of parking spots and user convenience, ease of use and security for new high-rise and mid-rise development, and in proximity to transit stations.
- Establish system-wide accessible signage and wayfinding standards, in multiple languages, that recognize areas of cultural, ecological and spiritual significance, including Indigenous traditional territories, communities and place names.
- Explore strategies to advance the removal of barriers for low-income transit users, such as supports for low-income households, children or families.
- Explore policies and approaches to reduce displacement resulting from new higher order transit investments, including by ensuring existing levels of affordable housing are maintained or increased within the transit station area following the establishment of new transit service.
Support the development and effective implementation of Mobility as a Service (MaaS)
- Work with Metrolinx, presto and other partners to investigate opportunities for MaaS solutions in the GGH and beyond.
Mobility as a Service
MaaS could make getting around easier and more convenient by allowing you to plan, book and pay for your trip across multiple modes of travel through a single online platform. The key idea behind MaaS is to put the users at the centre of transportation. By bringing together transit, taxis, ride hailing, bike share, and intercity services, a MaaS platform could offer end-to-end trip information and allow you to choose the option that best suits your needs based on your preferences, such as price, mode type, travel time, and carbon footprint.
5.4 Actions to keep goods moving
The efficient movement of goods and cargo across the GGH is critical to supporting recovery and keeping the economy moving. Billions of dollars’ worth of goods move across the region by road, air, marine, and rail every day.
The province is working with its partners to ensure improved efficiency and integration across modes, taking action in three key areas: regional coordination, competitiveness, and sustainability and efficiency.
Regional coordination of freight planning and freight-supportive infrastructure
- Work with municipalities and Indigenous communities and organizations to integrate consideration of the Strategic Goods Movement Network (SGMN) into their municipal land use plans and transportation studies to plan for and protect the capacity of the routes, corridors and facilities identified in the SGMN.
- Develop and implement GGH-wide standards, criteria and thresholds for SGMN design, engineering, operations, maintenance and rehabilitation. This will include principles for balancing freight movement and passenger transportation on shared corridors with transit and active transportation.
- Explore opportunities to utilize provincial state of good repair, connecting link and emergency detour route activities to support improvements to municipal roads, where needed, to meet GGH-wide standards for the SGMN.
- Support the accommodation of trucks at strategic goods movement locations by expanding locations that can feature both truck parking and truck inspection, including through ongoing provincial and national truck rest area infrastructure work and development.
- Identify existing and new measures and data sources to support goods movement planning and implementation, including marine, airport and rail terminal capacity, working with academia, municipalities, Indigenous communities, facility owners and operators and private sector partners.
- Monitor SGMN use and performance to inform future updates of the SGMN and identify and prioritize infrastructure needs including capacity, signaling, alternative fueling stations, and operational improvements.
- Reduce barriers to cross-border goods movement. This may include addressing regulatory challenges, implementing required infrastructure improvements and streamlining processing while maintaining border security.
- Promote Ontario’s Freight-Supportive Guidelines, which provide municipalities with detailed guidance in planning for the vehicles that transport goods through their communities and related facilities and support the safe and efficient movement of goods.
Support Ontario’s competitiveness and reduce red tape
- Streamline inspection and administrative burdens on commercial vehicle operators to support the reduction of red tape and increase efficiencies for businesses through digital transformation of commercial carrier products.
- Improve MTO’s corridor control and permit process while maintaining safety and operational efficiency by working with municipalities to ensure MTO’s requirements are identified and addressed early in the planning process to expedite approval of development applications and permits, such as through municipal pre-consultation meetings and enhanced use of MTO’s innovative online Highway Corridor Management System.
- Review the rules around reduced load periods for the agriculture, agri-business and trucking industry to help cut red tape and support business, while protecting road infrastructure in cooperation with municipalities.
Improve the sustainability and efficiency of the freight sector
- Work with partners to encourage the use of Off-Peak Delivery (OPD) in municipalities across Ontario to reduce gridlock, reduce emissions, improve air quality, and provide benefits to business such as reduced truck travel time, and flexibility in delivery schedules.
- Improve the sustainability and efficiency of urban freight delivery and reduce conflicts with other road users, through planning, design, policy, program and operational measures, such as:
- Improved wayfinding and on-and off-street access and loading.
- Promotion of last-mile deliveries by fuel-efficient, zero- or low-carbon vehicles where appropriate such as through establishment of micro-delivery hubs, including facilities at rapid transit stations, multi-storey local distribution centres, and delivery consolidation hubs where appropriate.
5.5 Actions for a safe and inclusive transportation system
Ontario is a road safety leader in Canada and North America. User safety and security are fundamental to building a transportation system that is safe and inclusive for everyone to use, including children, youth, seniors and people with disabilities.
Action is being taken in five areas: user safety, improved safety for active transportation, emergency preparedness, equality of opportunity, and reduced conflicts.
Improve user safety and security
- Improve towing and storage industry safety and standards by developing regulations to support the implementation of the Towing and Storage Safety and Enforcement Act. These regulations will strengthen provincial oversight of the towing and storage sectors. The province is also establishing a tow zone pilot on designated sections of provincial highways and launching a Joint Forces Operation team to address violence in the towing industry, among other measures.
- Combat human trafficking through training to increase recognition and reporting, posting educational material with the Canadian Human Trafficking Hotline and working with key partners, including MTO agencies, to increase awareness of human trafficking. In addition, MTO is making transportation facilities such as rest areas safer through infrastructure upgrades such as site clearing, improved lighting and security cameras, where feasible.
- Apply an Indigenous inclusion lens when developing transportation actions and initiatives to combat human trafficking, in line with the Calls for Justice of the Final Report of the National Inquiry into Missing and Murdered Indigenous Women and Girls (MMIWG).
Improve safety for active transportation users
- Develop and implement approaches aimed at eliminating transportation-related fatalities and serious injuries, including:
- Using a complete-streets lens to evaluate the needs of all transportation users, particularly vulnerable road users, such as the design of safety improvements or modifications at bridges, highway interchanges (particularly in urban areas), under and overpasses, intersections and high-volume and high-speed roads.
- Improving public education and information for all road users and modes.
- Improve safe conditions for active transportation by seeking opportunities to expand the coverage and connectivity of purpose-built infrastructure, by prioritizing the integration of active transportation infrastructure like sidewalks and bike lanes along existing and planned BRT and surface-LRT corridors, where possible.
- Encourage all new municipal active transportation improvements to, at a minimum, align with the Ontario Traffic Manual to ensure a consistent and high-quality network.
Understand and manage potential future transportation system impacts and risks
- Develop and conduct coordinated emergency response plans and exercises to be prepared for a range of emergency situations, including extreme weather events, security and cybersecurity incidents, utility outages, pandemics and disease, among others.
Mitigate and remove physical and systemic barriers to access within the transportation system
- Develop a framework for transportation access and inclusion that will guide MTO in considering the experiences of underserved people or communities, such as racialized groups and Indigenous peoples, inclusive of age, gender, income and persons with disabilities, in its transportation decisions.
- A new funding program, the Transportation Initiatives Fund, was established to support Indigenous communities and organizations in pursuing transportation-related projects. This application-based funding program champions initiatives that will help meet the transportation needs of Indigenous communities, build capacity, and support economic development, recovery, and safety, now and in the future.
- Explore and implement opportunities to increase Indigenous people’s access to critical services, such as healthcare, employment, education, and places of cultural significance. This includes improving access to driver’s licensing and personal identification services to eliminate barriers for Indigenous people when accessing transportation services.
Reduce conflict between transportation modes
- Work with the federal government to identify and prioritize safety improvements for at-grade road crossings. Ontario is committed to working with municipalities, Indigenous communities and other partners to improve road and rail safety.
Metrolinx, in partnership with municipalities, is developing and implementing enhanced safety measures for at-grade road crossings through the GO Expansion program. - Work with municipalities to minimize and /or reconcile conflicts between on-street rapid transit corridors, passenger rail corridors, active transportation corridors and important freight corridors, through an approach that balances competing requirements and needs.
- Continue working with the Region of Waterloo to identify, provide and protect a corridor through the ministry’s Highway 8 and Highway 401 interchange rights-of-way to support the proposed extension of Grand River Transit’s ion LRT to Cambridge.
5.6 Actions to be future ready
To prepare for an uncertain future, Ontario is working to create a more resilient and environmentally sustainable transportation system, one that embraces innovation and technological change, adapts and responds to the potential risks associated with climate change, and protects the environment for future generations.
The province is taking action in the following key areas: environmental impact, resiliency, and emerging technologies.
Minimize the impact of the transportation system and users on the natural environment
- Reduce the impacts of transportation emissions on the environment by:
- Supporting the adoption of low- and zero-carbon modes, including active transportation and the adoption of electric and hydrogen-powered cars, trucks and transit vehicles.
- Developing a strategy for low- and zero-carbon charging and fueling stations.
- Working with stakeholders to identify barriers and opportunities to support the uptake of electric vehicles in Ontario across different sectors (personal, commercial, transit).
- Raise awareness of the benefits and opportunities associated with low- and zero-carbon transportation options, working with non-governmental organizations, Indigenous communities and municipalities.
- Establish energy efficiency standards for transit infrastructure consistent with the envision framework.
The envision framework was developed in joint collaboration between the Institute for Sustainable Infrastructure (ISI) and the Harvard University Graduate School of Design Zofnass Program for Sustainable Infrastructure. The framework is used by 200+ cities, towns, counties, public agencies, and academic institutions across the globe. This framework includes 64 sustainability and resilience indicators, grouped into five main categories which addresses several areas including mobility, community development, emissions and resiliency. - Work with partners to ensure a clean-generated electricity system is ready to accommodate electric and innovative transportation.
- Work with partner Ministries to develop a strategy to reduce emissions and support Made-in-Ontario vehicle manufacturing through the procurement and operation of low-carbon Ontario Government and Agency fleet vehicles, including exploring the use of alternative fuels, fuel additives and electric vehicles.
- Establish guidance, standards and/or minimum targets to support the implementation of green infrastructure and low impact development approaches, such as green roofs, green pavements, bioswales (channels designed to concentrate and move stormwater runoff while removing debris and pollution) and low-carbon energy technologies in the delivery of transportation infrastructure.
Build and manage the transportation system to be resilient in the face of climate change
- Utilize the most up-to-date climate change data and information, including findings from Ontario’s provincial level multi-sector Climate Change Impact Assessment, to help the province, municipalities, and Indigenous communities make informed decisions on planning and infrastructure investments.
- Encourage municipalities and Indigenous communities to assess climate change impacts associated with the transportation system, including approaches to mitigate the impacts of the transportation system on climate change and improve infrastructure resiliency in transportation master planning and asset management planning exercises.
Leverage electric, connected and automated vehicle technologies and other emerging mobility technologies
- The Driving Prosperity plan positions Ontario to become a North American hub for developing and building the next generation of electric, connected and automated vehicles through emerging technologies and advanced manufacturing processes.
Electric Vehicle Production
In October 2020, Ontario announced it is matching a $295 million investment with the federal government to retool the Ford Oakville Assembly Complex into a global hub for battery electric vehicle production. This $1.8 billion project represents one of the most significant investments in Ontario’s auto sector in a generation.
- Explore the creation of an innovation corridor by leveraging provincial highway infrastructure to provide a real-world opportunity for businesses to test and/or pilot advanced and connected mobility technologies.
- Ensure and encourage the safety and innovation of connected/automated vehicle (CV/AV) technology on our roads through Ontario’s AV Pilot Program. Ontario will be considering amendments to the AV Pilot Program, that will allow for further improvements to how Ontario monitors industry developments and evaluates the safety of AVs included in the pilot.
- Explore opportunities to make it easier to get to and from GO stations and other rapid transit stations using AV technologies. Metrolinx is supporting automated shuttle pilot programs that will improve our understanding of CV/AV technologies for transit and address any safety considerations before widespread deployment.
- Address challenges related to CV/AV adoption and readiness by connecting municipalities, transit agencies and other mobility service providers through the Ontario Smart Mobility Readiness Forum.
- Explore opportunities to collaborate with industry and public sector partners to support the development and adoption of emerging technologies and logistical practices that improve efficiency and resiliency of the multimodal freight system.
- Prepare for the safe introduction of advanced automotive technologies, such as CV/AVs, through active research, pilots and testing and, as necessary, developing legislation, standards and guidelines or other measures, including consideration for the following:
- Integration with public transit to provide first-mile/last-mile connections to major transit stations and meet the demands of underserved users and coverage.
- Public safety.
- Cybersecurity, including the protection of transportation user information and telecommunications systems.
- Potential road configuration, engineering, design and operations standards, such as enhanced road markings, signage and vehicle to infrastructure communication technologies.
- Management of low- and zero-occupancy CV/AV travel to mitigate unwanted gridlock and emissions.
- Support the use of different types and sizes of CV/AVs for different contexts, such as using smaller driverless shuttles to and from transit hubs as a first-mile/last-mile solution.
- Access to transportation among underserved and Indigenous communities.
- The launch of the Ontario Vehicle Innovation Network (OVIN) provides a $56.4M investment in Ontario’s automotive sector, building on the successful Autonomous Vehicle Innovation Network (AVIN) program. OVIN extends its focus beyond connected and automated mobility to other key next-generation mobility areas including electric vehicles (EVs) and related battery technologies and talent development.
- Continue to enable regional innovation by supporting OVIN’s Regional Technology Development Sites (RTDSs). These regional incubators and accelerators provide small- and medium-sized enterprises access to specialized equipment and a collaborative space to work with academia, municipalities and research centres to develop, test and commercialize new transportation technologies and support Ontario as a global leader in the auto tech sector. Ontario is currently supporting four RTDSs in the GGH, including:
- Toronto, specializing in artificial intelligence for CV/AVs.
- Durham, specializing in human machine interface and user experience.
- Hamilton, specializing in integrated mobility.
- Waterloo, specializing in high-definition 3D mapping and localization.
- Prepare for the use of commercial CV/AV platooning (i.e., a number of trucks equipped with driving support systems are driven close together, while cooperatively communicating with each other) and other emerging goods movement and vehicle technologies that encourage efficient and safe goods movement, including planning for coupling and decoupling areas at strategic locations in the goods movement network.
- Explore the potential of other emerging transportation technologies, such as remotely piloted aircraft systems (commonly referred to as drones), electric vertical takeoff and landing aircrafts, and micro-utility devices, such as sidewalk robots, to support greater options for the movement of people and goods in the GGH, while encouraging optimal use of its network.
5.7 Connections beyond the GGH
Ontario’s heritage, culture and tourism sectors are interconnected and contribute to a significant double bottom line — economic growth and supporting the cultural fabric of the province.
Ontario is the largest travel destination in Canada. With a number of municipal and international airports that welcome visitors, as well as major international road and rail border crossings, the GGH is a gateway for visitors and residents to access destinations across the province. The GGH is also a major tourism destination in itself, attracting millions of visitors each year. The tourism industry, however, has been one of the hardest hit sectors and is expected to be one of the last to recover from the pandemic.
Muskoka and Haliburton are uniquely situated directly north of the GGH, between the GGH and Northern Ontario. Actions to improve transportation connections to these municipalities and the rest of the province are critical to the tourism industry as well as local and business travel Ontario-wide. No region of the province exists in isolation, but this is particularly true of the GGH, which acts as a focal point for travel within and across the province.
Ontario is supporting post-pandemic recovery as well as local, business and tourist travel by taking action in two key areas: improved connections beyond the GGH and support for regional collaboration in air passenger and cargo transport.
Improve connections beyond the GGH and support local, business, and tourist travel
- Undertake focused technical analysis in the District of Muskoka, the County of Haliburton and across eastern Ontario, which will consider local travel need, tourism travel needs, and improved connections to the GGH and the rest of Ontario.
- Establish task forces made up of local leaders in each of the province’s regional transportation planning areas, to advise the Minister of Transportation on additional ways to improve connections between modes and communities and opportunities to better support tourism recovery from the impacts of the pandemic.
GO Rail Service Toronto-London
The Ontario government is expanding GO train service to southwestern Ontario with weekday trips between London and Toronto. Beginning October 18, 2021, Metrolinx started providing weekday GO train trips between London and Union Station in Toronto. The pilot project includes one trip leaving from London in the early morning, and one return trip in the evening. The province worked alongside via Rail for the use of their stations and CN for access to the corridor. The province continues to work closely with via Rail and CN to improve the speed and frequency of passenger rail service.
- Advance planning and design work for the re-introduction of passenger rail service connecting Toronto (Union Station) with northeastern Ontario (formerly known as the Northlander), as announced in the 2021 Budget.
Re-introducing Northeastern Passenger Rail
The Province has committed $5 million to support feasibility work for the re-introduction of the passenger rail service in northeastern Ontario, formerly known as the Northlander. Work is underway on an updated business case examining service to provide a safe, reliable and convenient travel option between Toronto and Timmins.
Support regional collaboration to optimize use of the air passenger and cargo transportation network
- Review at-grade intersections between Bracebridge and Huntsville on Highway 11 and identify improvements to make the highway safer.
- Advance highway rehabilitation projects in the District of Muskoka and County of Haliburton, such as road resurfacing on Highway 11, bridge rehabilitation on Highway 400 and paving shoulders on Highway 118.
- Address traffic and safety concerns in the Georgian Bay area, including connections between the GGH and southwestern Ontario. Work with municipalities to explore improvements along highways and county roads, such as the implementation of revised posted speed limits on Highway 26 in the Craigleith area, to better support tourism and local mobility in the Blue Mountain region and other key tourism destinations in the area.
- Advance engineering and preliminary design work for the replacement of highway infrastructure in the eastern GGH between Cobourg and Belleville along Highway 401.
- Review the effects of seasonality, road closures and restrictions on key connectors into the region to reduce gridlock on popular routes and improve the connectivity, accessibility and reliability of local roads and highways.
- Work with the federal government to advance planning for their High Frequency Rail proposal to provide frequent, electrified passenger rail service from Toronto to Peterborough, Ottawa, Montréal and Québec City.
- Develop an Ontario Marine Strategy, with private and public partners, to improve the performance and sustainability of the marine transport system.
- Explore opportunities to support additional marine freight in the Great Lakes — St. Lawrence Seaway, in collaboration with the federal government and private sector partners.
- Continue to work with stakeholders and operators to support the recovery and growth of the passenger cruise ship industry. This includes working with the federal government to resolve regulatory issues related to operating cruises in the Great Lakes.
Support regional collaboration to optimize use of the air passenger and cargo transportation network
108. Support regional collaboration among and between airports to prioritize infrastructure and operational improvements that optimize use of the air passenger and cargo transportation networks.
109. Work with the federal government and industry partners to advocate for municipal airport supports in providing critical services, connecting people and moving goods.
110. Conduct an airport activity and infrastructure survey to update data on the role of Ontario municipal airports in supporting economic development and public service delivery. This will help inform the province’s understanding of the current status of Ontario’s aviation sector and will inform its future role in supporting the sector.
6.0 Working together: Next steps
Close collaboration will be essential to implementing these actions and successfully achieving the 2051 vision for mobility in the GGH.
The development, maintenance and operation of the GGH’s complex transportation system is a joint responsibility among infrastructure and service providers, including the federal, provincial and municipal governments, Indigenous communities, transportation agencies such as Metrolinx and local transit operators, railway companies, port and airport authorities and border crossing agencies. Each of them will play an integral role in the implementation of the GGH Transportation Plan.
Significant investments are made in the transportation sector every year, building transportation infrastructure and providing mobility services. This plan is intended to optimize those investments by aligning them towards a common vision to realize greater benefits. While this plan addresses the regional network and focuses on regional mobility across the GGH, local networks and connections are also critical elements of the GGH transportation system. MTO is committed to ongoing collaboration and partnerships to deliver on our shared goals for the region.
Metrolinx Regional Transportation Plan
The GGH Transportation Plan provides a multimodal framework to align planning across the region, including Metrolinx’s role in coordinating, planning, financing, developing and implementing an integrated transit network. An important step towards implementation of the plan will be to bring the Metrolinx Regional Transportation Plan into alignment with the GGH Transportation Plan. This includes reviewing priority actions and preparing projects for the Metrolinx annual review of the frequent rapid transit network.
In addition, Metrolinx has a role in planning with municipalities for more local and detailed elements of the transit network in the region. Metrolinx will continue to plan and analyze elements of the transit network not shown in the GGH Transportation Plan, such as priority bus corridors in coordination with municipalities.
Coordination with municipal transportation planning
In order for the transportation system to function as a whole, local transportation planning needs to be coordinated with the regional elements in the GGH Transportation Plan. MTO will work with municipalities in the GGH to use this plan to guide and inform future reviews and updates of their transportation master plans, to ensure all plans and programs are coordinated and implemented towards the common transportation vision across the GGH region. This includes working with municipal transit agencies to improve service integration and streamline fare structures in the region to improve transit and the rider experience.
Multimodal collaboration
Throughout the development of the GGH Transportation Plan, collaboration and input from the owners and operators of the roads, railways, airports and ports in the GGH was important. It is equally important to continue this coordination through ongoing dialogue and alignment for the successful implementation of this plan.
MTO proposes to establish a GGH implementation forum that will convene on a regular basis to ensure continued coordination and monitor progress as the GGH Transportation Plan is implemented. The forum would include at minimum the municipal, rail, marine, and airport sectors.
Alignment with the land use planning framework
The GGH is also subject to land use planning policies set out in other provincial plans.
The land use planning and development process is an important avenue through which transportation objectives are achieved, and vice versa. Alongside the GGH Transportation Plan, the provincial land use plans are intended to work together to provide a unified vision and direction for the GGH. MTO will work with the Ministry of Municipal Affairs and Housing to coordinate the applicable elements of the GGH Transportation Plan with the land use planning framework, including, if necessary, strengthening corridor protection tools to ensure that future corridors identified in the plan, and opportunities for longer-term transportation needs beyond 2051, are properly protected.
The GGH Transportation Plan is not intended to limit or restrict the policies and intents laid out in A Place to Grow, Provincial Policy Statement, or any other applicable provincial land use planning documents.
MTO will continue to work with all levels of government, including municipal and Indigenous communities, in coordinating the implementation of the GGH Transportation Plan with regional land use planning and development.
Next steps
This plan will inform planning and program delivery processes for both MTO and Metrolinx, including multi-year and annual capital planning and prioritization, service planning and programming, policy development and analysis to make progress toward the 2051 vision. The plan and the analysis that underpins it will inform the need and justification when initiating subsequent environmental assessment processes for projects identified in the plan. For projects that are under the province’s responsibility, MTO will work with Infrastructure Ontario to explore project delivery and financing options to secure funding and to expedite the implementation of the plan.
The increasing complexity of the transportation system means that new implementation tools may be needed, for example to ensure coordination among service providers or across jurisdictional boundaries. MTO will continue to explore a wide range of implementation tools, including potential new legislative and/or regulatory frameworks, to ensure the GGH Transportation Plan is implemented and the region’s transportation system continues to support peoples’ mobility needs and economic prosperity.
We recognize the need to continue working closely with municipalities, Indigenous communities, transportation providers and users across the region as technology advances and the needs of people and businesses evolve. MTO will establish a clear and flexible process to monitor the implementation of the plan, including developing and issuing progress reports, and updating the plan as needed to ensure the plan remains relevant as the region grows and changes.
We are committed to improving the transportation system not just for the GGH, but across the province. This plan is the third of a series of regional transportation plans that address the unique needs of each region. In 2020, we released transportation plans for Southwestern and Northern Ontario. We are also developing a regional plan for Eastern Ontario. Together, these regional plans will form an integrated, long-term transportation plan for all of Ontario.
Technical appendix
- A. Objectives and Measures of Effectiveness
- B. Horizon scan and 2071 scenarios
- C. 2041 Gap analysis
- D. Evaluating infrastructure options
- E. Evaluating policy options
- F. Developing the Strategic Goods Movement Network
- G. Integration with land use
- H. Disruptors analysis
- I. Input from engagement
A. Objectives and Measures of Effectiveness
A series of objectives for the region and transportation network were developed through three rounds of public engagement and discussions with municipal and Indigenous partners, and stakeholders. These objectives provided the structure for measuring the performance of the transportation network options throughout plan development. For those objectives that could be quantified, corresponding Measures of Effectiveness (MOEs) were developed that enabled a comparison of how options performed.
The MOEs were used to evaluate options at each stage of the GGH Transportation Plan process. An abbreviated list was used to evaluate the performance of the 2071 scenarios using a sketch modelling tool. A similar list of indicators was used during the gap analysis, to compare network performance between existing (2016) and currently planned conditions (2041) and highlight areas that need to be addressed by the 2051 plan.
The main objectives that formed the basis for evaluation were: connected; integrated; equitable; environmentally sustainable; economically sustainable; active, safe, and healthy; and prosperous. Two further objectives developed for the overall study, resilient and smart and secure, were not included directly in the numerical evaluation, but the resilience tests (carried out at the short list stage) and the disruptor analysis (carried out in parallel to the development of options) considered the significance of resilience and the impacts of new technologies.
A total of 53 MOEs were identified to quantify the performance of the network options that were modelled. The full set of all MOEs was used for the final evaluation of shortlisted network options. Selected MOEs from this list were used, variously, for the gap analysis, disruptor analysis and long list assessment. The full list is provided in the following section.
As part of the evaluation, the network options were compared against each other using these MOEs, both for each of the eight sub-regional “sheds” (illustrated in Map A2) and at a GGH region-wide level. Using these metrics, each network option was ranked for each objective and geographic area, and the best performing option in each part of the GGH was noted. This helped to identify the projects that made the most significant impact to fulfilling the plan objectives, and which should thus be carried forward to the next phase of analysis or the preferred network.
List of MOEs
53 MOEs were used in the evaluation of options. Table A1 lists them below. While not all objectives have the same number of MOEs, in the evaluation the MOEs were weighted so that each objective would receive equal consideration. MOEs were evaluated by comparing their values (as percentage of change) against BAU results to evaluate network performance in each objective. To this end, whether it was positive for a MOE to be maximized or minimized was identified as well (e.g., transit mode share increase would be positive, but increase in average travel time is negative).
| Objective | Measure of Effectiveness |
|---|---|
| Connected |
|
| Integrated |
|
| Equitable |
|
| Environmentally Sustainable |
|
| Economically Responsible |
|
| Active, safe and healthy |
|
| Prosperous |
|
B. Horizon scan and 2071 scenario analysis
Recognizing that the GGH Transportation Plan is a long-term plan and that there are numerous factors that are beyond our control, the plan development process examined how a range of different potential futures may impact the needs of the transportation network. A horizon scan was completed to identify the biggest technological, societal and political trends likely to impact the way we move, trade and live in the region.
Various long-term (50-year, or 2071) scenarios were developed representing extreme land use, behavioural and infrastructure assumptions. Analysis of these scenarios revealed some key transportation corridors and growth clusters that will remain important to regional mobility, regardless of the scenario. The scenario analysis also indicated three directions that could enhance the resilience and performance of the future transportation system given the range of potential futures:
- Higher self-containment, reflected by the ability to meet most of one’s daily needs with less travel, was found to be the most significant contributor to meeting the objectives of the plan.
- In the absence of self-containment, maximizing mobility through significant infrastructure investment that enhanced connections between high-density communities was found to deliver significant benefit.
- In all cases, optimizing existing key corridors to move more people and goods (regardless of mode) remained critical to the functioning of the network.
The scenarios were compared with each other and a business as usual scenario representing an extrapolation of current growth, trends, and policies.
This analysis demonstrated that the east-west Lakeshore corridor and the north-to-Central Toronto corridor are and will continue to be important corridors, with parallel corridors and growth areas of significance in Peel and southern York Region. Maintaining mobility on these corridors is a core part of the plan. It should be noted that these do not specifically represent highways or transit routes, but rather corridors and areas of persistent demand independent of the mode of travel (and in need of multimodal connections).
A resilient transportation system for the GGH will need to be responsive to whichever future eventually results. Testing five very different scenarios and seeing which network characteristics performed most strongly regardless of the nature of the future provided insight into how to design a more resilient transportation system. The findings from the 2071 analysis were carried forward into the testing of options.
C. 2041 Gap analysis
The projected 2041 gaps in the transportation system were identified by means of a comprehensive “gap analysis” network review.
The gaps were quantified based on outputs from MTO’s Greater Golden Horseshoe Model (GGHM), a multimodal long-range travel behaviour simulation tool. Implementation of committed transportation improvements to 2041 across the region was assessed against the plan’s objectives to assess the evolution of system performance.
The resulting list of gaps from the simulation model were supplemented through the plan’s consultation and feedback process before the options development stage.
Many of these gaps recur in multiple locations across the region, as is shown in Map A1. Through the gap analysis, over 100 individual gaps, relating to specific corridors or municipalities, were identified. These were used in selecting projects for inclusion in the preliminary 2051 long list for the GGH Transportation Plan, based on their ability to address one or more gaps. The gaps highlight numerous places where sufficient network capacity and alternatives to personal auto use are not provided through existing and committed infrastructure.
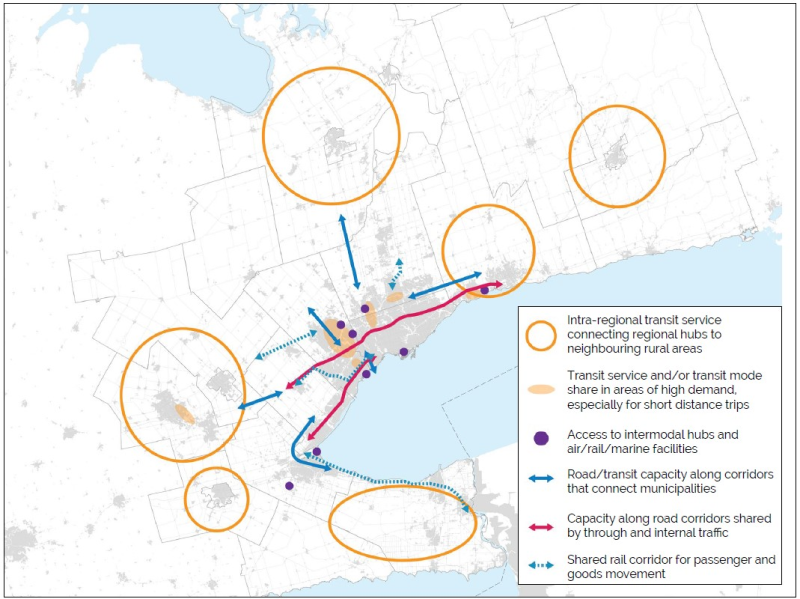
Map A1: Summary of gaps. View a larger version of this map (PNG).
Gaps identified include: Intra-regional transit service connecting regional hubs to neighbouring rural areas; Transit service and/or transit mode share in areas of high demand, especially for short distance trips; Access to intermodal hubs and air/rail/marine facilities; Road/transit capacity along corridors that connect municipalities; Capacity along road corridors shared by through and internal traffic; Shared rail corridor for passenger and goods movement
D. Evaluating infrastructure options
The development and evaluation of infrastructure options leading to a technically preferred network followed a multi-step path of building, testing and refining network options, modelling and analysing option performance under 2051 projected conditions, and carrying out consultation and receiving feedback.
The projects considered for inclusion were identified from a review of provincial, regional, and municipal plans, supplemented by a detailed analysis of gaps and opportunities in the region. The initial “long list” of projects was then filtered through multiple stages of evaluation, producing in sequence a “medium list”, “short list” and eventually the draft and final plan networks. At each stage, the option networks were compared against a business as usual network that included only committed infrastructure. All options were tested with population and employment projections for 2051 consistent with the province’s long-range growth plan forecasts. At the medium and short list stage, the options were also tested with land use variants to see how sensitive their performance was to shifts in population and employment growth centres.
The process, and the characteristics of the options at each step, are summarized in Figure A1.
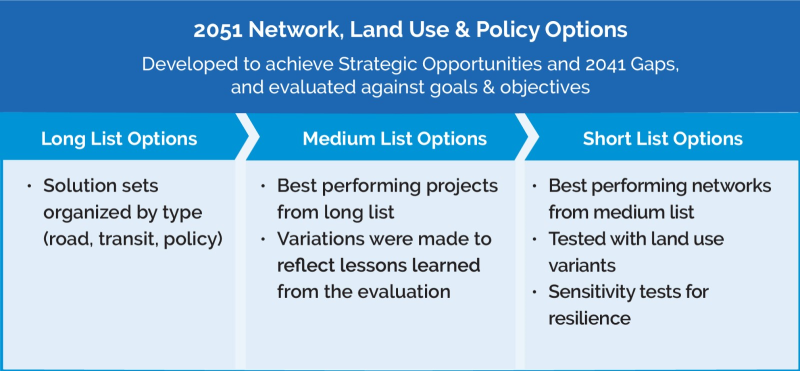
Figure A1: Long list to short list evaluation process
2051 Network, Land Use & Policy Options: Developed to achieve Strategic Opportunities and 2041 Gaps, and evaluated against goals & objectives
Long List Options
- Solution sets organized by type (road, transit, policy)
Medium List Options
- Best performing projects from long list
- Variations were made to reflect lessons learned from the evaluation
Short List Options
- Best performing networks from medium list
- Tested with land use variants
- Sensitivity test for resilience
From a starting point of three distinct strategies, increasingly similar network options were tested until converging at the preferred option stage. The network convergence process is illustrated in Figure A2.
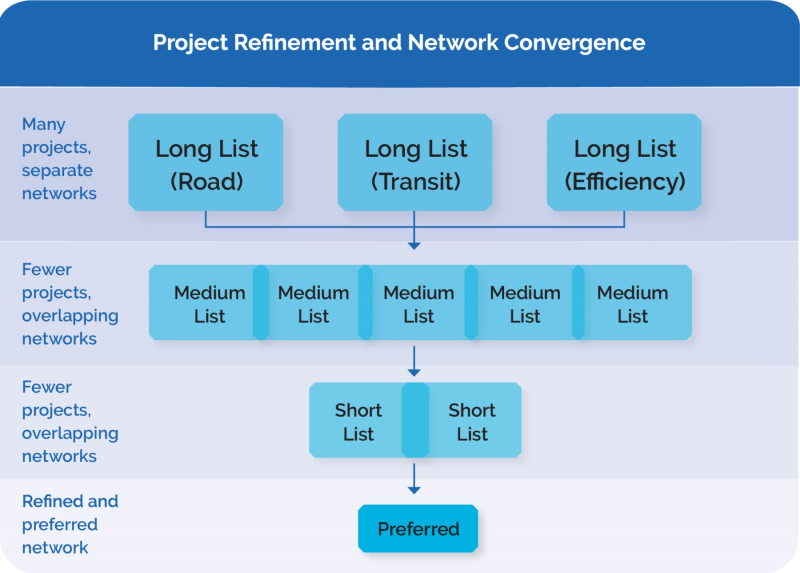
Figure A2: Developing the technically preferred network
Process map outlining the project refinement and network convergence process. Starting with many projects and separate networks including a long list of roads, transit and efficiency. Filtering down to fewer projects, overlapping networks including medium lists. Further filtering to fewer projects, overlapping networks with a short list and then refined to a preferred network.
Throughout the process feedback was sought and received through the engagement process, and some project definitions were refined over time to incorporate updated assumptions and priorities.
To analyze infrastructure options, the region was divided into eight, relatively self-contained, broad geographic areas that represent the context of the wider GGH.
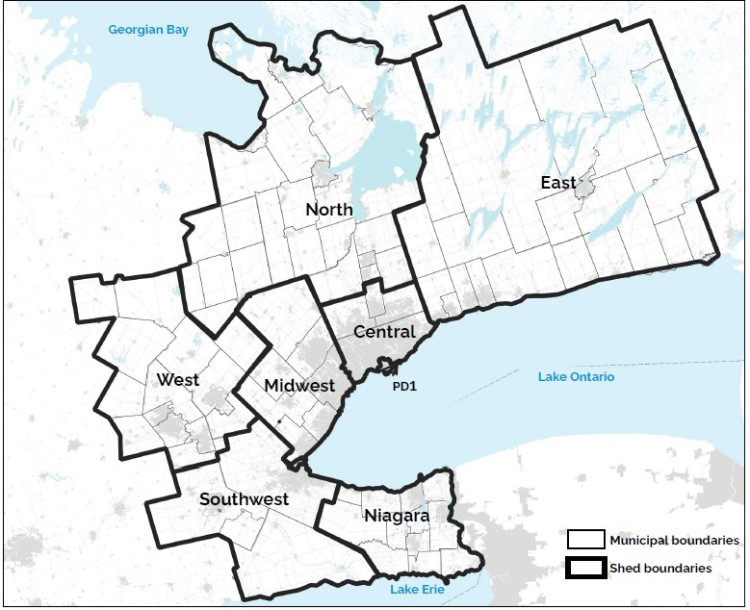
Map A2: The eight transportation sheds of the Greater Golden Horseshoe. View a larger version of this map (PNG).
Map illustrating the eight sheds in the GGH with their respective municipalities. The eight sheds include: Niagara, Southwest, West, Midwest, Central, PD1, North and East.
E. Evaluating policy options
The 2051 policy directions in the GGH Transportation Plan were developed and refined through an evaluation process that assessed a wide range of factors. In the early stages of plan development, a list of potential policies for inclusion in the GGH Transportation Plan was developed through a literature review and jurisdictional scan. The scan focused on policy solutions with the potential to address identified gaps or strategic opportunities identified through the network gap analysis and regional profiles. This list was revised with input from a Technical Advisory Committee (TAC), which included municipal partners.
A refined policy list was circulated to the project TAC (described in section I of this appendix) for commenting and confirmation. Lessons learned from the land use scenario testing were also considered to ensure policies reinforced the most positive scenario attributes while mitigating against adverse outcomes. These steps identified some policy gaps and revisions, which were then addressed in the final policy “short list,” used to develop the policies found in Chapter 4 of the plan.
F. Developing the Strategic Goods Movement Network
The GGH Transportation Plan includes a Strategic Goods Movement Network (SGMN), which is a multimodal network of routes and facilities, along with supporting policies for facilitating the movement of goods across the GGH region and beyond.
The SGMN development was carried out in parallel to the development of infrastructure, service and policy options for the GGH Transportation Plan, and included two stages: developing a preliminary, and then preferred, network.
Preliminary goods movement network
The development of a preliminary SGMN focused on addressing the gaps in the goods movement network identified in the gap analysis, recognizing the principal freight hubs and corridors, and defining segments of the committed transportation network as part of the SGMN. The network included corridors and links that provide routes for high volumes of freight, and supply access to key freight generators, intermodal and freight terminals, and higher order infrastructure. This was presented to the municipal TAC and the Freight Advisory Committee for their comments.
Preferred goods movement network
Refinements to the preliminary network to create a preferred network focused on:
- Incorporating feedback on the preliminary network, primarily focused on harmonizing the SGMN with municipal goods movement networks.
- Revising the networks to be consistent with the broader GGH Transportation Plan network and new infrastructure that this network included.
- Reviewing locations where major goods routes coincide with major transit routes, and identifying priorities for these corridors.
The refinement of the SGMN occurred concurrently with the evolution of the overall network options from the long list to short list stages of analysis. The prioritisation step, where the goods movement and passenger networks were synchronised prior to defining an overall preferred network, occurred at the short list stage of analysis. Goods movement policies, to be applied to the SGMN, were also developed as part of the policy options process described above.
A methodical approach to resolve potential conflicts between freight and passenger movement was applied, where higher order transit projects under evaluation overlapped with roads identified for the draft SGMN; with the corridors being identified for transit priority, freight priority, or mixed-use, depending on their relative levels of demand and the need to establish connected and continuous networks for both forms of transportation.
G. Integration with land use
Four land use scenarios were used for testing the performance and outcomes of the 2051 medium list network options. These included a business as usual (BAU) land use scenario based on compliance with the Growth Plan for the Greater Golden Horseshoe, and three land use variants, described below.
The three land use variants were developed to test whether strategic variations in land use could improve the network’s performance. All the land use scenarios adhered to the same overall control total for population and employment growth to 2051 and were based on the Growth Plan for the Greater Golden Horseshoe’s 2041 Schedule 3 forecast, extrapolated forward by ten years. The differences in how the four land use scenarios allocate growth is described below.
Business as usual (BAU) land use
The 2051 BAU land use scenario was the primary land use scenario used for testing network options at each evaluation stage. The scenario is compliant with the region’s land use plan, A Place to Grow: Growth Plan for the Greater Golden Horseshoe, and is based on Metrolinx’s Growth Plan-compliant forecast for 2041, extrapolated forward by ten years. The forecast was distributed to the Traffic Zone (TZ) level by MTO’s Land Use Allocation System (LUAS).
Distribution from upper-tier to lower-tier municipalities followed Official Plans and extrapolated currently planned patterns as best as possible. The allocation reflected the principal intensification goals of the Growth Plan, regional and local plans. It used the current urban area boundary, including Designated Greenfield Area (DGA) lands, as defined by regional and local Official Plans.
Land use variants
An important aspect of the GGH Transportation Plan is its integrated approach to transportation and land use. Testing reasonable variations in land use patterns made it possible to understand how land use could support the network’s performance and helped inform the development of policy recommendations for the plan.
The variations included:
- Variations to the location of population and population-based jobs across the GGH. As the location of population growth was changed, corresponding adjustments were made to the location of population-based jobs such as local retail and services, childcare and primary and secondary education to serve the shifting population.
- Variations to the location of office and export-based jobs across the GGH. Office and export-based jobs tend to cluster. The land use variants assumed that growth in core economic activities such as finance and business services, higher education and hospitals, culture and tourism, government, and research and innovation were most likely to occur in areas with a greater concentration of these uses. Variation in the concentration of export-based jobs without the potential for higher density formats, like agriculture and mining, were not tested.
- Variations to the location of logistics, warehousing and goods-movement-based activities across the GGH. These activities do not have high job densities but require specific locational characteristics to conveniently access the goods movement network. Variants assumed that these activities would cluster along 400-series highways and at key interchanges.
The land use variants analysis identified areas where land use variations could positively influence plan objectives and performance metrics. The analysis indicated that benefits in some instances were offset by other measures, which declined due to increased congestion resulting from the redistribution of growth. The following highlighted areas where changes could be made to the networks to address these issues. Key findings from this process included:
- The ratio of transit to auto time (transit competitiveness) and transit mode share was not significantly affected by land use variations. This outcome is most likely because transit competitiveness is impacted by a combination of land use, infrastructure and policy solutions rather than land use on its own.
- Even with transit, in the absence of policies to encourage a shift in modes/behaviour, adding density to already congested parts of the region would lead to increased gridlock, affecting the movement of people and goods.
- Increasing density in the core resulted in the most significant increases in accessibility, job access and non-auto-mode reliant equity measures. However, the added congestion impacted prosperity and emissions-based measures and low-income residents were particularly affected in terms of travel time, travel time to work and costs.
- Increased self-containment outside of the core resulted in a slight improvement of equity measures in the outer ring.
- Increased jobs in Pickering and Oshawa had a notable positive impact on connected, integrated, equitable and active health and safety measures in the east area of the GGH.
H. 2051 Disruptors analysis
An integral component of the plan involved evaluating the impact that potential disruptors (trends or technologies with the ability to change travel behaviour and affect transportation networks) may have on the future transportation network. Through the process of developing the GGH Transportation Plan, disruptors were identified at several separate stages. The disruptors that were originally identified include:
- The increasing proliferation of connected/automated vehicles (CV/AV). CV/AVs are anticipated to bring many benefits including safety improvements, reduction of emissions, and accessibility improvements. However, while the potential benefits are significant, there is also the potential for CV/AV technologies to be accompanied by increased demand for trips, increased trip lengths, or more dispersed land use patterns. Scenarios were developed to reflect and assess the potential consequences on the future regional transportation network. People may be encouraged to travel more and longer distances by the ready availability of CV/AVs and the ability to carry out other tasks without needing to focus on driving. In this scenario, the circulation of unoccupied vehicles could add significantly to urban gridlock. However, a policy, regulatory, and pricing environment that promotes shared CV/AVs and complements higher order transit, could provide significant benefits.
- Adoption of electric vehicles. Continuing technological improvements and growing consumer interest have led to an increase in electric vehicle sales over the past several years. Scenarios considering a continued shift from today’s vehicle fleet of predominantly internal combustion engine vehicles to one of low-carbon and electric vehicles were developed to assess future GHG emissions associated with the regional transportation network. The rate of this shift will depend on further technological advancement, cost of technology, consumer behaviour and government policy, such as the recent federal government mandate that by 2035 all new light-duty vehicle sales must be electric.
- Increased job automation. Job automation involves the use of technology such as robotics and artificial intelligence as a substitute for human labour to complete work tasks and processes. From the transportation perspective, increases in job automation could affect travel choices, commuting distances and times as some commutes to low-density industrial areas may be replaced by trips to denser knowledge-intensive hubs that may be easier to serve by transit, while people in rural areas, in contrast, may need to travel further for work in urban centres.
- Changes in marine freight patterns. Far sourcing of GGH aggregate resources, Panama Canal expansion, a longer ice-free shipping season on the Great Lakes/St Lawrence Seaway and through the Northwest Passage, and the potential for container vessel operation on the Great Lakes/St Lawrence Seaway are some of the marine disruptors that were investigated. Panama Canal expansion and container operation on the Great Lakes/St Lawrence Seaway could lead to a reduction in rail trips to and from the GGH with a corresponding increase in truck travel to the U.S. and Montréal (and on GGH highways leading to those gateways). The far-sourcing aggregate scenario could lead to an increase in rail and decrease in truck movements to the GGH’s northern gateways.
- Near-sourcing of goods. The return or transfer of manufacturing processes from remote sites to locations closer to the GGH could change goods movement patterns to/from and within the region. The investigation of this disruptor provided insights on which industries, as well as which modes and intermodal terminal locations would likely be impacted. An increase in near-sourcing may reduce traffic to and from intermodal gateways formerly supplying long-distance goods, but truck traffic on major routes in and out of the GGH may see a corresponding increase. The location and size of some major distribution centres may also evolve to accommodate convenient access for the new flows.
- Digitalization of the supply chain. Rapid expansion in computing and communications capabilities has greatly extended connectivity across all links in the supply chain, from the source of raw materials, to manufacturers, brokers and transporters, distributors, retailers and the end purchaser. E-commerce, the most visible form of this change, is growing quickly and has affected both consumers and businesses of all sizes and types. An increase in both local and regional distribution centres (DCs) could result in gridlock if these centres are not optimally located near intermodal centres or gateways for large regional DCs and near the provincial highway network for local DCs.
Disruptors Related to COVID‑19
In 2020, the COVID‑19 pandemic led to multiple changes in how and where people work and travel in the GGH. Recognizing the potential long-term impact of these shifts in travel patterns, the list of disruptors to analyse was expanded to include:
- Increased levels of telecommuting in certain sectors as people have adopted remote working practices, resulting in fewer trips to work.
- Reduced appeal of transit as observed through concerns about shared space and decreased ridership during the pandemic.
- Increased appeal of active transportation as observed through increased numbers of walking and cycling trips during the pandemic.
- Change in working hours as increased workplace flexibility has shifted travel away from the traditional peaks.
- Population and job dispersal as increased remote work incented some to move further away from their physical workplaces.
Process of Disruptor Analysis
The resilience of the short-listed network options was tested against the identified disruptors individually and in combination. The impact on the performance of the network options was measured using a select set of the same MOEs used to evaluate the full network options (as described in Table A1).
While existing research into these disruptors gives some indication of their impact on travel behaviour, there is considerable uncertainty involved with new trends and technologies, and often no consensus as to what the extent of the disruption would be (especially with regard to CV/AVs and the speed with which they will be adopted). Because of this uncertainty, the results represent a range of probabilities rather than a specific forecast. Testing covered a wide range of potential disruptions and combinations of disruptions, modelling nearly 200 separate scenarios. These enabled an analysis to gauge which disruptors would be likely to have the greatest impact (positive or negative), and how supporting policies, including pricing and regulation strategies, could assist in improving network performance.
The modeling tests that were carried out included the following:
- “Base case” runs with no disruptors were undertaken to verify that the disruptor modelling tool produced results consistent with the province’s Greater Golden Horseshoe model.
- “High” (full shift) scenarios were run to understand the maximum impact of individual disruptors relative to the base case.
- “Low” (25%) and “Medium” (50%) scenarios were run to evaluate shifts of lesser magnitude.
- Combination scenarios were run to identify the aggregate impact of multiple disruptors that could occur simultaneously, and the combined impact of disruptors and supporting policies.
Findings
The analysis indicated that CV/AVs (whether the vehicles are used collectively or individually) will be significant disruptors. They have the potential to reduce travel times and increase accessibility, but also decrease the popularity of transit and active transportation use and increase gridlock in urban areas by adding to the number of vehicles, if adopted without supporting policies and regulation.
Furthermore, without a significant proportion of zero emission vehicles, emissions are anticipated to continue to grow relative to the 2016 base year, despite the infrastructure enhancements included in the plan and potential disruptor impacts. Thus, a combination of infrastructure, policy, technology and behavioural changes will be needed to reach Canada’s goal of net-zero emissions by 2050.
Disruptors related to the COVID‑19 pandemic are also significant, as these trends would result in shifting of times when trips are taken, or changes in total demand. Increases in active transportation had the impact of reducing motorized vehicle kilometres travelled significantly and in a reduction in GHG per capita. Long-term continuation of the telecommuting trend would also significantly reduce gridlock.
I. Input from engagement
Throughout the process of developing the GGH Transportation Plan, MTO has engaged government and non-government stakeholders, Indigenous partners, the public, academia and thought leaders on urban and transportation issues.
This section provides an overview of the engagement processes and groups for the GGH Transportation Plan and the opportunities for input through the plan’s development.
The public
Online public engagement was carried out in the fall of 2017 on the draft objectives for the GGH Transportation Plan. An online survey on the project website was open for 60 days, during which time the public submitted 3,106 survey responses. The survey allowed people to provide feedback on the draft objectives, identify priorities, and highlight critical issues that the GGH Transportation Plan will need to address. A dedicated toll-free number and email address were set up to ask questions regarding the plan.
In the summer of 2020, 2,242 people shared feedback through a survey on their regional transportation priorities over the next 5 and 30 years and the impact of COVID‑19 on multimodal transportation behaviour. Some top priorities for the long-term that were identified included:
- Make transit as convenient as driving for getting where I need to go (66% of respondents).
- Make getting around healthier for me and for the planet (50% of respondents).
- Make better use of the roads, railways and other infrastructure we already have (40% of respondents).
- Make it easier to work and get what I need close to home (35% of respondents).
- Make it easier to get places by transit without going through Toronto (29% of respondents).
In summer 2021, MTO released a discussion paper — Towards a Greater Golden Horseshoe Transportation Plan — to share progress on the plan. Through a survey, 827 people shared feedback on the vision and actions in the discussion paper.
Indigenous and Métis communities
The project team has engaged Indigenous partners throughout the development of the GGH transportation plan through forums and one-on-one meetings to identify issues and gaps, refine the evaluation process, and validate results. Indigenous partners include individual First Nation communities, First Nation organizations, and the Métis Nation of Ontario (MNO).
Thought leaders
Thought leaders from across industry, government, academia and the non-profit sector were engaged. Interviews were conducted with 20 thought leaders with expertise in diverse areas, including automated vehicle technology, new mobility models, city building, employment geography, insurance, agriculture, public health and sustainability. Insights gained from the interviews were incorporated into the Horizon Scan materials. A Foresight Workshop was held with locally-based thought leaders as well as municipal and provincial representatives to confirm the most impactful trends. The outcome of the foresight work led to the development of a range of scenarios representing different land use, behavioural and infrastructure assumptions, as outlined in section B of this appendix.
Freight Advisory Committee (FAC)
A Freight Advisory Committee (FAC) contributed insight on moving goods to, from and through the GGH to support regional prosperity throughout the development of the plan. The FAC includes marine stakeholders (port authorities), rail stakeholders (rail companies), airport stakeholders (airport authorities), trucking organizations, federal transportation organizations, municipal freight organizations, supply chain/delivery providers, industry associations, and business representatives.
Municipal Technical Advisory Committee (TAC)
A Municipal Technical Advisory Committee (TAC) provided input from the municipal perspective at every stage of developing the GGH Transportation Plan. Municipalities are important partners as they own and maintain much of the region’s transportation infrastructure. Many have their own transit operators, and they are responsible for making land use decisions that impact the region’s transportation network.
The TAC was comprised of upper-tier municipalities, single-tier municipalities and large lower-tier municipalities within the GGH, and their role in the plan’s development included:
- Providing input at the outset of the plan process on the different transportation issues municipalities are experiencing today.
- Participating in a foresight process to give a regional perspective on the impact of future trends.
- Providing input and commenting on drafts of the objectives, vision, gap analysis, needs and opportunities.
- Reviewing the policy long list evaluation results, land use variants, and draft medium list network and policy options, medium list evaluation framework and results, and the preliminary short list of policy options.
Acknowledgements
Provincial government partners within MTO and across the government provided input on how they rely on transportation infrastructure and services to deliver their services to the public.
MTO worked closely with Metrolinx, an agency of the Government of Ontario, throughout the development of the GGH Transportation Plan to ensure that the transit components of the plan reflect the most up-to-date information on currently proposed transit projects in the region. The development of the plan has benefited from Metrolinx’s transit planning and delivery expertise.
MTO would also like to acknowledge the project team that led the engagement activities and undertook the technical analysis that underpins the GGH Transportation Plan. The project team included MTO staff, Metrolinx staff, and the consultant team of HDR, Urban Strategies Inc., David Kriger Consultants Inc., RWDI, KerrSmith and Metro Economics.
Footnotes
- footnote[1] Back to paragraph Calculated from Statistics Canada (Metropolitan Gross Domestic Product, 2014) and Conference Board of Canada (Metropolitan Outlook 1 & 2, 2014)
- footnote[2] Back to paragraph Transportation Tomorrow Survey (TTS), 2016. See Transportation Tomorrow Survey.
- footnote[3] Back to paragraph "Amendment 1 to the Growth Plan for the Greater Golden Horseshoe 2019”, Ministry of Municipal Affairs and Housing, 2020.
- footnote[4] Back to paragraph Cars, Congestion and Costs: A New Approach to Evaluating Government Infrastructure Investment”, Dachis, B., C.D. Howe Institute, 2013
- footnote[5] Back to paragraph TTS, 2011 and 2016
- footnote[6] Back to paragraph "Sustaining Canada’s Tourism Sector Through COVID‑19”, Destination Canada, March 2020
- footnote[7] Back to paragraph "COVID‑19’s Impact on Canada’s Tourism Industry”, Destination Canada, April 2020
- footnote[8] Back to paragraph Relative to 2051 business-as-usual (BAU) scenario which includes committed highway and transit projects but no other major investments
-
footnote[9]
Back to paragraph
All savings are relative to a 2051 “business as usual” scenario which considers a future with no new infrastructure investment and no change from today’s fleet of predominantly internal-combustion engine (ICE) vehicles.
Analysis only considers direct (tailpipe) emissions from transportation and not indirect sources of emissions (including electricity generation, vehicle manufacturing, new road construction). - footnote[10] Back to paragraph “On Demand is in demand; close to 6,000 trips booked in first month”, Durham Region Transit, October 29, 2020. Retrieved from: Durham Region Transit.
- footnote[11] Back to paragraph “Durham Region Transit celebrates 100,000 On Demand trips”, Durham Region Transit, September 22, 2021. Retrieved from: Durham Region Transit.
- footnote[12] Back to paragraph The main exception to the self-containment rule is downtown Toronto’s planning district 1 (PD1), which attracts travel from across the entire region and serves as the most significant employment hub. This was treated separately because of the different transportation issues and characteristics it faces compared with anywhere else in the GGH.