2014 Energy consumption and greenhouse gas emission report
The Ministry of Infrastructure’s provincewide, five year (2014-2018) energy conservation strategy and report on progress in meeting greenhouse gas emissions reduction targets for the government’s property portfolio.
Executive summary
Ontario is a Canadian leader in transparent reporting of energy consumption data, and is the first jurisdiction in Canada to publicly post information on a building by building basis, and by type of energy source. On January 1, 2013 the Ontario Facilities Energy Consumption Directive came into effect. The directive requires public reporting on how the government’s energy consumption is tracking against its energy conservation targets. The government had two public conservation targets:
- Electricity reduction - a 20% reduction by 2012 over 2002/03 baseline
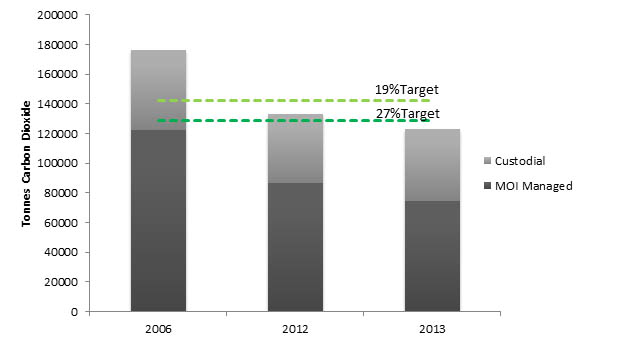
- Green House Gas emissions - 19% reduction by end of 2014 and 27% reduction by end of 2020 over 2006 baseline
The Ministry of Infrastructure is responsible for rolling-up all ministry specific information and reporting against government-wide energy conservation targets.
By end of 2012, the government achieved its 20% reduction in electricity consumption target. Provincial government-owned facilities have reduced greenhouse gas emissions by 30.2% at the end of 2013 over a baseline set in 2006.
The government is continuing to work towards reducing greenhouse gas emissions through energy conservation measures such as building retrofits, retro-commissioning and adoption of new standards and guidelines. These energy reduction programs, paired with cleaner electricity generation in Ontario (through phase out of coal and increased renewable energy), have provided an additional positive impact to targets.
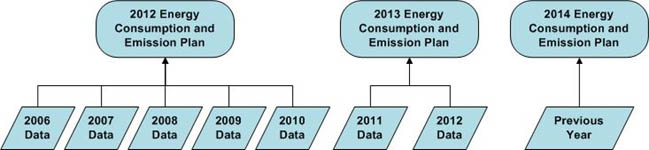
This is the third report that is moving Ontario to annual reporting of energy consumption. To date, eight years of data is now publicly available spanning 2006 to 2013. The first Energy Plan covered the 2006 baseline year through 2010. The second Energy Plan covered the 2011 & 2012 data. The third Energy Plan (current plan) will cover 2013 calendar year data. Subsequent reports will report data for the previous calendar year.
The government uses an internally developed methodology which incorporates elements of the World Resources Institute’s Greenhouse Gas Protocol. The protocol provides guidance for reporting greenhouse gases. Elements of the protocol were adapted into an internal methodology for applicability to the government’s realty portfolio.
Chart 1 – emissions reduction targets achieved
Overview
Ministries with operational control of government facilities are required to post an annual 5-Year Energy Plan and report on their energy consumption for the previous calendar year. Five provincial ministries are impacted: Ministry of Infrastructure (primary responsibility for most government facilities), Ministry of Natural Resources ( provincial parks), Ministry of Community Safety and Correctional Services (adult detention centres), Ministry of Children and Youth Services (youth detention centres), Ministry of Transportation (truck inspection stations).
Although each ministry is responsible for its own plan, the Ministry of Infrastructure has the responsibility to report on all government facilities. Ministries that directly operate government owned buildings and facilities (have day-to-day operational control) are defined as a Custodial Ministry.
The objective of this Energy Plan is to:
- report government’s progress in meeting greenhouse gas emissions reduction targets across all ministries within the government’s owned realty portfolio
- establish a baseline, methodology and a strategy to achieve energy conservation targets for the Ministry of Infrastructure owned realty portfolio that is directly managed by its service provider, Infrastructure Ontario.
The Ministry of Infrastructure is faced with the challenge of reducing emissions while maintaining performance and client satisfaction within the managed portfolio. The strategy will focus on activities and actions designed to improve operational efficiency that will result in reductions in electricity, fuel and steam consumption, which will ultimately lower greenhouse gas emissions and utility costs.
Timeline
The first Energy Plan covered the 2006 baseline year through 2010. The second Energy Plan covered the 2011 & 2012 data. The third Energy Plan (current plan) will cover 2013 calendar year data, and subsequent reports will report on data on the previous calendar year (Figure 1-1).
Figure 1 – five year energy plan
Target summary
Greenhouse gas emissions targets
In 2009, the government approved the Green Transformation Strategy that set greenhouse gas emissions reduction targets of a:
- 19% reduction by end of 2014 over 2006 baseline
- 27% reduction by end of 2020 over 2006 baseline
These reduction targets apply to government flight, fuel and facilities. Government facilities typically account for approximately 75% of provincial greenhouse gas emissions.
The government’s realty portfolio falls primarily within the responsibility of the Ministry of Infrastructure and its realty agent, Infrastructure Ontario. Five other ministries, Ministry of Community Safety and Correctional Services, Ministry of Community and Youth Services, Ministry of Education, Ministry of Transportation, and the Ministry of Natural Resources, have day to day operational control of certain types of facilities that they directly operate and are required to report separately on the energy consumption in those facilities. Within this group of Ministries, the Ministry of Infrastructure is responsible for base-building equipment (end of life replacements). The Ministry of Transportation and the Ministry of Natural Resources have complete building responsibilities including base-building equipment and operational control.
The Ministry of Infrastructure is also responsible for reporting government-wide progress to achieving the targets.
Electricity reduction targets
In response to the 2003 Northeast Blackout, the Ontario Government set targets to reduce electricity consumption by government, including government buildings. The initial target was a reduction of 10% by 2007 over a 2002/03 baseline. In 2007, the government established a more aggressive 20% reduction by 2012 over a 2002/03 baseline. The 20% electricity reduction target was achieved, and has been validated by an independent third party.
New equivalent kilowatt hour target
Going into fiscal year 2014/15 the Ministry of Infrastructure set a new internal target that encompasses all fuel types. The new target will be an annual 2% equivalent kilowatt hour reduction that better aligns with the overall greenhouse gas emissions reduction targets. A reduction in this target directly impacts the achievement of building related greenhouse gas emissions. This is an internal government target that has never been publically announced. This specific target provides an in-year energy reduction target as opposed to the broader greenhouse gas emissions targets for 2014, and 2020.
Portfolio description
The Ministry of Infrastructure realty portfolio that is operated by Infrastructure Ontario is spread throughout the province, consisting of various usage types; inclusive of, but not limited to the following:
- courthouses - Buildings consisting of courtrooms, holding cells and office space.
- detachments - Emergency operation’s home base facilities, also policing home base facilities.
- laboratories - Building used for experimental studies and/or testing and/or research requiring special purpose improvements
- offices - General administration of program delivery
- other - Example includes Ontario Science Centre
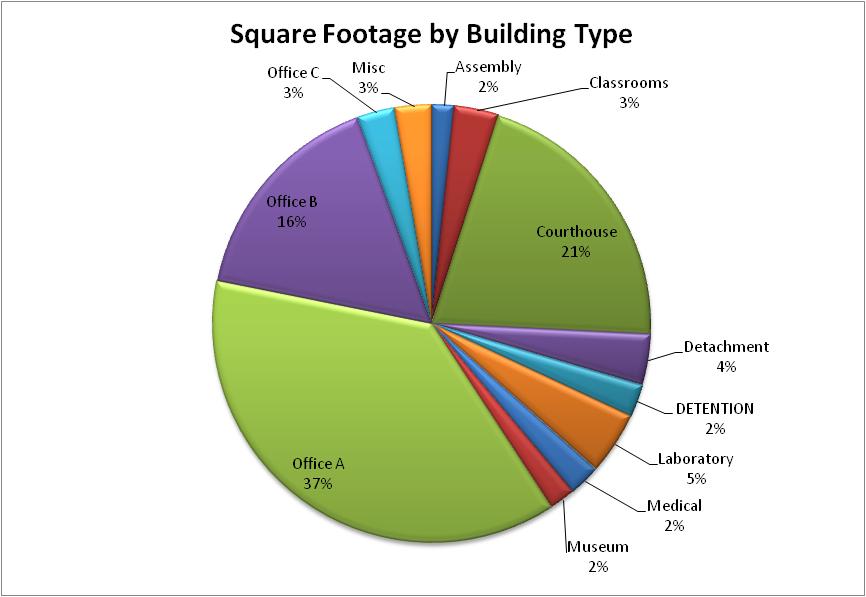
Infrastructure Ontario operates the real estate portfolio on behalf of the Ministry of Infrastructure. The portfolio consists of about 50 million square feet of buildings and structures, encompassing approximately 850 core buildings.
A breakdown of the portfolio square footage can be found in Figure 1-2 Portfolio Overview.
Figure 1-2 portfolio overview of square footage by building type
Challenges and opportunities
The average building age in the realty portfolio is 49 years. These facilities produce a unique set of challenges including aging structures, aging equipment and heritage considerations. Many times equipment such as boilers, chillers and building automation systems are dated and at the end of their useful life, and could now be replaced with modern and more efficient options.
Reporting boundaries, fuel types and calculations
Overview of the 2006 baseline
A full review of the realty portfolio was completed in 2009 to select which facilities and building types would be subject to energy conservation efforts and were appropriate to be included in the 2006 reporting baseline. Within the Ministry of Infrastructure portfolio, 455 baseline buildings were selected and classified as Target Class Facilities. There facilities include buildings where Infrastructure Ontario has a high level of operational control and could influence change. Buildings that were excluded are defined as Non-Target Class Facilities. Non-Target Class Facilities were identified where energy conservation could have a direct health and safety risk or negatively impact government program delivery. Further details can be found in the Section 5.0 of this report.
Overview of the 2013 data set
Infrastructure uses the World Resources Institute Corporate Reporting Standard as guidance for annual building selection and reporting. Through divestitures, acquisitions and new construction projects, the portfolio is constantly evolving and as such, the baseline evolves with it. The updated building count for the 2013 reporting year is 450.
Fuel types and scope
This report accounts for the following fuel types and scope emissions. Scope 1 emissions can be explained as fuel burned on-site (example: the operation of a boiler). Scope 2 emissions can be explained as a delivered fuel type where the energy was generated off-site and delivered to the building (example: electricity generated by a mixture of fuel types and delivered to the building). This report does not include any Scope 3 emissions (e.g. those found emitting from leased facilities) as they would be the responsibility of the private sector landlord to report, since MOI has no operational control of the buildings.
- electricity (Scope 2)
- natural gas (Scope 1)
- fuel oil (2) (Scope 1)
- propane (Scope 1)
- steam (Scope 2)
- hot water (Scope 2)
- chilled water (Scope 2)
Each fuel type results in different emissions. For example, electricity used to run a chiller during the summer will have much higher emissions than a comparable building cooled using chilled water from deep lake water cooling. Or, a boiler using fuel oil could potentially have higher emissions than a boiler using natural gas. Although certain fuel types can be more emission intensive than others, Infrastructure Ontario has to select the right fuel types for the right facilities. For instance, a building in Northern Ontario may not have natural gas infrastructure and it is the responsibility of Infrastructure Ontario to identify the best, most efficient, and energy conscious fuel types and systems to ensure continuation of program delivery.
Emissions calculations
Every building has associated fuels used to heat and cool it, and each fuel results in different emissions. Emissions captured under the scope of this report include Carbon Dioxide (CO2), Methane (CH4) and Nitrous Oxide (N2O). Factors considered when calculating GHG’s include emission factors, global warming potential (GWP), unit conversion factors and fuel consumption. Example 1.1 outlines a step by step walkthrough of how emissions would be calculated for a natural gas account.
Example 1.1 - a step by step walkthrough of how emissions would be calculated for a natural gas account.
Step 1 - annual Building Consumption: 136,331 m3
Step 2 - factors:
- CO2 - 1879 g/m3
- CH4 - .037 g/m3 with GWP = 21 (Second Assessment)
- N2O - .035 g/m3 with GWP = 310 (Second Assessment)
Step 3 – calculation:
136,331 x ((1879 + (.037 x 21 ) + ( .035 x 310 )) / 1,000,000 ) =257.75 tonnes CO2e
Emission factor risks
Cleaner electricity generation has positively impacted the reduction in emissions from provincial buildings. Reduced reliance on coal has reduced emissions factors, resulting in greater emissions savings in government buildings. Although this is a positive shift provincially, the government cannot continue to rely on reduced emission factors to help hit GHG targets.
From 2016-2032 the province will be undertaking a refurbishment of the nuclear power generators at the Bruce and Darlington power plants. During this time natural gas is going to be depended on to be a flexible swing resource, which will increase electricity generated by natural gas. Since nuclear power has relatively few attributable greenhouse gas emissions, increasing the natural gas production will increase emissions factors for the Province’s electricity sector. The challenge for the Ministry of Infrastructure is that the 2020 provincial greenhouse gas target ends at a time when there will be three large nuclear power generators down, and that, coupled with risks of atypical weather patterns, could increase the emissions factors considerably.
Portfolio performance
Tables 1.1 and 1.2 outline the equivalent kilowatt hour used and the associated tonnes CO2 emitted during calendar year 2013 in comparison to the 2006 baseline.
Table 1.1
This table outlines the equivalent kilowatt hour used and the associated tonnes CO2 emitted during calendar year 2013 in comparison to the 2006 baseline.
| Infrastructure Ontario | 2006 equivalent kilowatt hour |
2012 equivalent kilowatt hour |
2013 equivalent kilowatt hour |
2012 percentage change vs. 2006 | 2013 percentage change vs. 2006 |
|---|---|---|---|---|---|
| Electricity | 326,195,629 | 264,865,624 | 252,880,450 | (18.8) | (22.5) |
| Natural gas | 225,496,655 | 231,946,624 | 250,196,481 | 2.9 | 11.0 |
| Fuel oil | 3,282,168 | 3,544,902 | 3,858,930 | 8.0 | 17.6 |
| Chilled water | 1,956,641 | 2,902,929 | 2,409,688 | 48.4 | 23.2 |
| Propane | 3,061,507 | 2,086,053 | 2,840,429 | (31.9) | (7.2) |
| Steam | 68,300,283 | 67,701,999 | 62,662,912 | (0.9) | (8.3) |
| Hot water | 1,262,590 | 2,369,408 | 2,625,438 | 87.7 | 107.9 |
| Total | 629,555,472 | 576,059,853 | 577,474,328 | (8.5) | (8.3) |
Table 1.2
This table outlines the equivalent kilowatt hour used and the associated tonnes CO2 emitted during calendar year 2013 in comparison to the 2006 baseline. All values subject to change.
| Infrastructure Ontario | 2006 CO2e | 2012 CO2e | 2013 CO2e (estimated) | 2012 percentage change vs. 2006 | 2013 percentage change vs. 2006 |
|---|---|---|---|---|---|
| Electricity | 62,349 | 25,427 | 10,874 | (59.2) | (82.6) |
| Natural gas | 40,410 | 41,566 | 44,837 | 2.9 | 11.0 |
| Fuel oil | 830 | 896 | 976 | 8.0 | 17.6 |
| Chilled water | 15 | 22 | 19 | 48.6 | 26.7 |
| Propane | 638 | 435 | 592 | (31.8) | (7.2) |
| Steam | 18,131 | 17,972 | 16,635 | (0.9) | (8.3) |
| Hot water | 283 | 531 | 588 | 87.5 | 107.8 |
| Total | 122,657 | 86,850 | 74,520 | (29.2) | (39.2) |
Data analysis
The data presented in tables 1.1 and 1.2 above outline the energy consumption and emissions output for the applicable years shown. To better understand these tables, a few key points to consider are:
- Estimated emissions for 2013 are drastically reduced due to the coal phase out in 2013. Electricity emissions for 2013 are estimated based on projections from the 2013 Ontario Long Term Energy Plan
- 2013 data will be re-reported in 2014 with emission factors updated in the Environment Canada National Inventory Report
- Electricity was still a key focus in 2013 as seen in a 3.7% reduction over 2012
- November and December of 2013 were colder than a typical year thus driving up natural gas and propane consumption and emissions
Water
2014 is the first year that water use is being reported. Although no targets have been set for water, the province is gathering and analyzing data in anticipation of a water reduction program. Preliminary datasets by building type are outlined in table 1.3. This analysis will allow IO to set a baseline for water use and evaluate where the portfolio performance stands in comparison to peers.
Table 1.3
This table outlines preliminary datasets for Annual Water Consumption by building type, results for 2013 annual water consumption and intensity.
| Infrastructure Ontario | 2013 annual water consumption (m3) | 2013 annual water intensity (100 m3/ft2) |
|---|---|---|
| Agriculture | 4,589 | 26.51 |
| Assembly | 41,072 | 12.49 |
| Classrooms | 60,378 | 9.17 |
| Courthouse | 203,263 | 4.85 |
| Detachment (OPP) | 70,761 | 11.15 |
| Detention | 13,127 | 4.01 |
| Garage - vehicle | 8,971 | 5.64 |
| Laboratory | 210,289 | 24.15 |
| Medical | 24,793 | 16.69 |
| Museum | 8,553 | 2.22 |
| Office A | 458,469 | 6.14 |
| Office B | 109,938 | 4.23 |
| Office C | 20,033 | 4.21 |
| Public Info | 13,771 | 50.26 |
| Storage A | 5,500 | 2.44 |
| Warehouses | 153 | 3.21 |
Energy reduction strategies
The Ministry of Infrastructure Energy Program will change focus beginning in 2014/15 where fiscal restraints have pulled back funding. The focus will now be to optimize the existing portfolio and revisit past energy projects to draw on lessons learned.
Since 2004, the energy program has had dedicated funding to implement energy conservation measures in government buildings. The main focus till 2012 was on electricity reduction, which has resulted in the province saving $11 million in avoided electricity costs annually. Where the electricity target focused on primarily electricity, the new all fuel type (equivalent kilowatt hour) target changes the focus of the energy program by looking at all building systems and fuel types in a holistic manner to ensure that all buildings are operating as efficiently as possible. The holistic view encourages the overall analyses of buildings as a single system and allows for investigation into how systems like lighting and heating and ventilation interact with each other and how the tenants interact with the building. Also, various internal guides and standards continue to be applied to project and operations schedules to bring buildings up to efficiency standards. Furthermore, a retro-commissioning program is underway which identifies opportunities for energy reduction as well as generates information that can be fed into the capital repair program – intended to keep the Ministry of Infrastructure realty assets in a state of good repair.
Energy conservation measures
With the removal of dedicated funding for energy conservation, the Ministry of Infrastructure continues to work to achieve the annual 2% equivalent kilowatt hour reduction target in support of province-wide greenhouse gas emissions reduction targets. The following initiatives and programs will help to achieve this target.
Retro-commissioning
This program began in 2012 and has since been implemented in 16 government facilities. The program is a three step process that reports on the operation of buildings and identifies opportunities for improvements. The process is summarized as follows:
- report – Conduct a full building analysis of all building systems (boilers, chillers, building automation systems, lighting, etc.). Once the investigation is completed a report is compiled with an outline of each system, as well as any opportunity for improvements or potential capital projects.
- low cost/no cost measures – These measures are identified in the report and are easy fixes such as schedule changes and system maintenance. Typical energy savings from these measures are 5%.
- capital projects – These measures are identified in the report and would require considerable capital to implement. Considerations are given to end of life equipment as well as projects that make financial sense (good simple payback, internal rate of return, life cycle costing etc.). Previously these projects would have been funded by an energy specific Ministry of Infrastructure budget, however in these times of fiscal restraint, capital projects generated from retro-commissioning reports will be pulled into the capital repair project queue.
Capital repair program and standards integration
The Capital Repair Program is used to organize and set out all repairs to government buildings. It encompasses everything from boilers to windows to leaky roofs. There are two streams in which this program operates:
- Imminent Breakdown – a database generates projects based on the end of useful life (as defined by industry standards) equipment. By tracking and identifying projects, Infrastructure Ontario can get ahead of potential breakdowns that could affect service program delivery.
- Reactive – because of the nature and age of government facilities the program needs to react to unforeseen failures. For example, a roof starts leaking before the end of its useful life, and it needs to be repaired to avoid affecting service program delivery.
The Infrastructure Ontario energy team’s goal is to ensure the adoption of energy standards and guidelines into the Capital Repair Program processes. For example, a replaced boiler must meet efficiency standards, or a newly-installed roof must be insulated to a certain standard. Previously, energy initiatives were treated separately and had a separate decision-making process. Now, the new standards and guidelines require incorporating energy savings potential into day-to-day operations. The three main guidelines under development are outlined below.
- Design Guideline: a project based guideline for setting energy standards for new projects.
- Commissioning Guideline: a project based guideline that ensures that systems have been installed per manufacturers’ specifications, and ensures that systems run as efficiently as possible.
- Building Performance Optimization Guideline: An operational based guideline to set standards for efficient building operation.
Smart green portfolio
A smart green portfolio is a key performance initiative that utilizes advanced automation and integration to measure, monitor, control and optimize operations and maintenance at the lowest cost and environmental impact over the building lifecycle.
The program takes a holistic approach to energy conservation while incorporating other important building systems. The vision of the program (for its larger buildings) is to integrate its control systems for lighting, security, heating/ventilation/air conditioning into one enhanced building automation system. The integration of systems allows for improved automation interaction, occupant comfort and overall building performance.
New technology
The province has been progressively looking at new technology as a way to curb energy consumption. The province has installed a number of solar projects as well as ground source heat pumps. More aggressively, IO has recently completed a feasibility study with Queen’s University to investigate the potential of fuel cells and their applicability for use in government buildings.
Energy services company
The government is investigating the viability of leveraging an Energy Service Agreement structure as a means to renew building assets that will be funded from the energy consumption savings. Energy efficiency service providers could design, install, maintain and finance the cost of energy efficient retrofits for select buildings. The government would avoid upfront capital costs as 100% of the project cost is financed by the Energy Service Agreement. These innovative agreements are distinct from traditional Energy Services performance contracting in multiple respects, including: (1) energy efficiency service providers assume ownership and maintenance responsibility for project assets over the lifetime of the project; (2) building owners are not required to arrange their own financing and do not assume responsibility for principal and interest payments; and (3) building owners do not bear the risk of whether an Energy services Company is willing and able to stand behind its performance guarantee – energy efficiency service providers are compensated only if energy savings are realized. The Ministry of Infrastructure is exploring the feasibility of this type of model within the context of the government’s existing realty funding model.
Measurement and verification
Infrastructure Ontario has established Measurement and Verification requirements for its energy projects in order that it can substantiate savings from energy conservation measures, and differentiate these savings from other factors that would affect energy demand in the portfolio (e.g. weather variation or changes in usage).
The purpose is to verify the energy savings resulting from activities that influence the energy consumption of a facility. This verified information will be used to improve the business models of future proposed projects. The objective is to:
- Facilitate economic analysis of implementing energy saving measures by establishing a high confidence level in reported energy savings that are obtained through energy related projects.
- Establish a process to ensure that all significant project activities related to energy undergo an appropriate level of measurement and verification.
- Provide a method for improving accuracy of reported progress toward energy goals on a portfolio wide basis.
The process for implementing measurement and verification across the portfolio will be developed over the course of the next 5 years, with an increasing number of projects being targeted for this process over time. The delivery model for these services is being developed by service providers, and will explore opportunities to synchronize with equipment commissioning and other quality control initiatives to get improved value for money.
Sub metering
Project (dollar) decisions are based on the benchmarking and consumption trends available within a building. A sub-metering program allows for real-time usage vs. a monthly utility bill and can provide a better understanding of how the building/equipment operates. Using Ministry of Infrastructure funding, Infrastructure Ontario has put in place more than 80 building level electricity sub-meters. When additional funding becomes available, this program will expand natural gas and water real-time meters (and further electricity meters).
Benchmarking
In 2013 the energy team undertook a market evaluation of benchmarking systems and how to best use benchmarking for government buildings. The approach taken was to have an internal system to benchmark building types within the portfolio and use external systems to benchmark to industry. Through each of these systems Infrastructure Ontario can now better evaluate performance and identify opportunities for energy conservation measures.
Internal benchmarking uses basic statistical analysis to evaluate how each building type performs against other similar building types in its group. Because of the nature of government operations, internal benchmarking allows for comparison of building types (labs, hangars, etc.) not typically found in external benchmarking programs such as Energy Star Portfolio Manager.
The Federal Government has adopted the Energy Star Portfolio Manager as its primary benchmarking system and Ontario has followed suit. In support of this program, Infrastructure Ontario has uploaded three years of energy data for 49 office buildings representing 9 million square feet. The Energy Star Portfolio Manager is currently being evaluated by the energy team for its applicability to the portfolio.
Enterprise – wide summary
Overview
In the Green Energy Act, 2009, the Government of Ontario committed to ensuring that the Government conserve energy and use energy efficiently in conducting its affairs. In addition, it highlights governments role promoting and expanding energy conservation by all Ontarians and in encouraging all Ontarians to use energy efficiently.
To address these commitments, the Green Energy Act sets out a number of principles, including:
- Requiring ministries responsible for government owned facilities to report to the Minister of Infrastructure on energy consumption and GHG emissions associated with the facilities; and
- Specifying other requirements as the Minister considers appropriate relating to energy and water conservation, energy efficiency, the adoption of renewable energy technologies and the adoption of technologies and services that promote the efficient use of water and reduce negative impacts on Ontario’s water resources.
Greenhouse gas emission reporting
On January 1, 2013 the Ontario Facilities Energy Consumption Directive (the Directive) came into effect.
The requirements of the Directive demonstrate the following fundamental principles:
- ministries make accountable choices for energy use, ensuring value for money;
- ministries conserve energy and use energy efficiently; and
- information is managed efficiently and effectively across ministries.
Enterprise Progress Report – greenhouse gas emissions
Greenhouse gas emissions from 2006 -2013
The table below shows Greenhouse Gas Emissions from 2006 -2013 and the comparisons of the percentage of change from 2012 and 2013 versus 2006. All values subject to change.
| Reporting entity | 2006 tonnes CO2e | 2012 tonnes CO2e | 2013 tonnes CO2e | 2012 percentage change vs. 2006 | 2013 percentage change vs. 2006 |
|---|---|---|---|---|---|
| IO | 122,657 | 86,850 | 74,520 | (29.2) | (39.2) |
| MCSCS | 34,394 | 25,195 | 22,722 | (26.7) | (33.9) |
| EDU | 9,477 | 8,440 | 7,783 | (10.9) | (17.9) |
| MCYS | 5,411 | 5,020 | 4,662 | (7.2) | (13.8) |
| MNR | 3,750 | 3,139 | 2,165 | (16.3) | (42.3) |
| MTO | 302 | 282 | 134 | (6.6) | (55.6) |
| AFP (IO) | - | 4,031 | 10,958 | N/A | N/A |
| Total | 175,991 | 132,957 | 122,944 | (24.5) | (30.1) |
Roles and responsibilities
Most government operations are accommodated in facilities which are comprised of land, parking areas, landscaping, structures and buildings. For the purpose of the Directive, all energy consumption utilized at a facility level will be allocated to buildings with the exception of provincial parks which will be tracked at the facility (or park) level. This will be reported on an annual basis.
A rolling five year Energy Consumption and Greenhouse Gas Emissions Report will be required from Infrastructure Ontario and each custodial ministry related to the government-owned facilities over which they have direct operational control.
Infrastructure Ontario
Infrastructure Ontario is a crown agency that oversees the day-to-day operations of the Ministry of Infrastructure real estate portfolio and implements Ministry policies for buildings, lands, and leases.
Infrastructure Ontario has three separate responsibilities outlined within the Directive:
- reporting emissions publicly for Ministry of Infrastructure-owned facilities, this includes:
- Infrastructure Ontario -managed
- Alternative Financing Procurement facilities
- reporting on government-wide energy conservation status
- a five year energy conservation strategy for Infrastructure Ontario managed facilities
Infrastructure Ontario – alternative financing procurement
This model brings together private and public sector expertise in a unique structure that transfers the risk of project cost increases and scheduling delays typically associated with traditional project delivery.
For the Directive, these sites are required to report their greenhouse gas emissions; however, Infrastructure Ontario does not have direct operational control of the facilities (managed by private service providers). The reporting result is included as a separate line item to track this sector progress.
Custodial ministries
Custodial ministries have day-to-day operational control over their own facilities. These ministries include:
- Ministry of Transportation
- Ministry of Education
- Ministry of Child and Youth Services
- Ministry of Community Safety and Correctional Services
- Ministry of Natural Resources
Custodial Ministries have two primary responsibilities outlined within the Directive:
- reporting emissions publicly for facilities managed on a day-to-day basis
- a five year energy conservation strategy (for each Custodial Ministry)
Methodology
World Resource Institute protocol
This is an international protocol for greenhouse gas emissions accounting. Infrastructure Ontario will follow this accounting standard as a guideline in its reporting of the enterprise greenhouse gas baseline. Examples of applied principles outlined within this protocol include: tracking inventories, buying, selling, demolishing, and adding buildings.
Target class vs. non-target class facilities
Target Class Facilities are a subset of all government-owned facilities that have been identified as having energy conservation potential. Energy consumption at Target Class Facilities is required to be reported to both the Ministry of Infrastructure and publicly as a requirement of the Directive. Reporting is to be done at the building level within each facility. This accounts for 96% of the total energy consumed by government-owned facilities.
Non-Target Class Facilities include other government-owned facilities where is does not make sense to conserve energy due to safety considerations or programmatic impacts and constraints. Although energy consumption associated with these facilities/buildings are not required to be reported, ministries are encouraged to include any success stories associated with conservation efforts at Non-Target Class facilities through annual reporting cycles, where appropriate.
Target class and non-target class facilities by ministry
This table shows Custodial target class facilities versus non-target class facilities for the Ministries of Transportation, Natural Resources, Education, Community Safety Correctional Services and Child Youth Services.
| Ministry | Custodial target class facilities | Custodial non-target class facilities |
|---|---|---|
| Ministry Transportation | Truck Inspection Stations | Patrol Yards, Remote Airports, Street Lights |
| Ministry Natural Resources | Parks | Fish Hatcheries, Ranger Camps, Forward Fire Stations |
| Ministry Education | Provincial Schools | all facilities included |
| Ministry Community Safety Correctional Services | Adult Detention Centres | all facilities included |
| Ministry Child Youth Services | Youth Detention Centres | all facilities included |
Data reporting purpose
Preparation of Energy Consumption and greenhouse gas emissions plans will help articulate the government’s energy conservation progress. Publication of the reports will provide a model and benchmark for the broader public sector. Reports also facilitate sharing of best practices and continuous improvement. Reports will include energy consumption in government-owned facilities, proposed measures to increase conservation efforts and progress since the previous Report.
The ministries that are impacted by the Directive are ministries that have direct operational control over government owned facilities.
Data set: notes and comments by Ministry for 2013 reporting period
Ministry of Community Safety and Correctional Services- 54 facilities reported.
Ministry of Child and Youth Services - 27 facilities reported.
Ministry of Education - 65 facilities reported.
Ministry of Natural Resources -75 parks reported.
Ministry of Transportation - 29 sites reported.
Infrastructure Ontario/Alternative Procurement - 24 sites reported.
Infrastructure Ontario does not have operational control of these buildings, but maintains a responsibility to report on them. Alternative Procurement sites are not required to report emissions on its hospitals.
- For the 2013 report, only fully operational facilities are being reported. There are 24 facilities reporting in 2013.
- These sites will register zero consumption for the 2006 Baseline year and will only add to the Enterprise-wide emission inventories as more sites are added (regardless of how energy efficient).
Infrastructure Ontario-managed: 450 buildings are reported which range from large laboratories to small office buildings. All data post-2009 are tracked and supported by CB Richard Ellis. CB Richard Ellis is the property management, and land service provider. The CB Richard Ellis responsibilities include capturing and tracking inventories which directly supports greenhouse gas reporting requirements.