2016-17 First Quarter Finances
August 2016
The First Quarter Finances report contains information about Ontario’s 2016–2017 fiscal outlook as of June 30, 2016.
Introduction
The Ontario Quarterly Finances contains updated information about Ontario's 2016–17 fiscal outlook, including updated information about the major components of revenue and expense as set out in the 2016 Budget.
Section A: 2016–17 Fiscal Outlook
The government is projecting a deficit of $4.3 billion in 2016–17, unchanged from the 2016 Budget forecast.
As outlined in the 2016 Budget, the government is on track to balance the budget by 2017–18 and is projecting to remain balanced in 2018–19. The government's path to a balanced budget is being achieved through responsible fiscal management, which involves managing growth in program spending and maintaining the integrity of Provincial revenues. At the same time, the government continues to make investments in the economy, its people, and a healthy, clean and prosperous low-carbon future.
Relatively strong economic growth recorded in Ontario over the second half of 2015 and early 2016 has helped increase private-sector forecasts for real GDP growth in 2016. The Ontario economy is benefiting from steady economic growth in the United States, low oil prices and a more competitive Canadian dollar.
However, weaker-than-expected global growth and low commodity prices have led to increased volatility in global financial and currency markets, and weakened confidence in the overall Canadian economy. Uncertainty in the global economy has increased, reflecting the United Kingdom's recent vote to leave the European Union. As a result, global growth expectations will likely be revised lower over the near term, which would adversely affect Ontario's economic outlook. However, Ontario's diversified economy means the Province is well positioned to respond to changing global economic conditions.
Given the high degree of uncertainty regarding the economic growth outlook and forthcoming revenue information, the government is maintaining the 2016 Budget revenue forecast.
2016–17 In-Year Fiscal Performance
| Item | 2016–17 Budget Plan |
2016–17 Current Outlook |
2016–17 In-Year Change |
|---|---|---|---|
| Revenue | 130,589 | 130,590 | 1 |
| Expense - Programs | 122,139 | 122,140 | 1 |
| Expense - Interest on Debt | 11,756 | 11,756 | – |
| Total Expense | 133,895 | 133,896 | 1 |
| Surplus/(Deficit) Before Reserve | (3,306) | (3,306) | – |
| Reserve | 1,000 | 1,000 | – |
| Surplus/(Deficit) | (4,306) | (4,306) | – |
Note: Numbers may not add due to rounding.
Total revenue is projected to be $130.6 billion, essentially unchanged from the 2016 Budget plan.
The outlook for Provincial program expense, at $122.1 billion, is unchanged from the 2016 Budget plan — reflecting the government's commitment to manage growth in spending.
The Province's interest on debt expense forecast, at $11.8 billion, is unchanged from the 2016 Budget forecast.
The 2016–17 outlook also maintains a $1.0 billion reserve to protect the fiscal outlook against unforeseen adverse changes in the Province's revenue and expense, including those resulting from changes in Ontario's economic performance or the impact of natural disasters.
As outlined in the 2016 Budget, Ontario's net debt-to-GDP ratio is expected to peak at 39.6 per cent in 2015–16, remain level in 2016–17 and begin to decline in 2017–18.
Further details on the Province's fiscal plan, including final results for 2015–16, will be provided in future fiscal updates.
Section B: Details of In-Year Changes
Revenue
The 2016–17 revenue outlook, at $130.6 billion, remains essentially unchanged from the 2016 Budget forecast. Since the 2016 Budget, there is one change to the revenue outlook for 2016–17:
- An increase of $0.9 million in federal revenue through the National Disaster Mitigation Program, to offset the expense increase to support flood mitigation measures across Ontario.
Risks to the 2016–17 revenue outlook are anticipated to be positive, reflecting a moderate improvement in 2016 economic growth. However, economic and revenue information still to be received over the coming months could significantly affect the revenue outlook. This includes personal and corporate income tax assessments for past years, Harmonized Sales Tax entitlements, Ontario-administered tax receipts in 2016–17 and ongoing economic developments. The government will continue to monitor economic and revenue developments and will provide further details in future fiscal updates.
Expense
The 2016–17 total expense outlook, at $133.9 billion, is on track with the projection in the 2016 Budget. The government continues to manage spending within the fiscal plan. Since the 2016 Budget, the following expense changes have occurred and have been accommodated within the fiscal plan.
Key changes to expense projections with offsets from the contingency funds include:
- An increase of $91.3 million for more supports for children and youth with autism, including an accelerated implementation of the new Ontario Autism Program.
- An increase of $40.4 million to address urgent health care needs and improve access to care for First Nations peoples primarily focused in the North.
- An increase of $3.1 million to support the Ontario Cattle Feeders' Association's three-year strategic marketing initiative to promote Ontario Corn-Fed Beef to help increase its domestic market share, and grow global exports.
- An increase of $2.9 million to enable the Anti-Racism Directorate to deliver on its core mandate and priorities.
- An increase of $2.7 million to build on the government's commitment to support vulnerable families by fully exempting child support payments as income received by social assistance clients.
- An increase of $1.8 million to support Ontario's Indigenous communities, including funding to the Ontario Native Women's Association.
- An increase of $1.0 million to support disaster relief efforts for both the Fort McMurray, Alberta wildfires and the Ecuador earthquake. The government also provided emergency management personnel to support local firefighting efforts in Fort McMurray.
- An operating increase of $0.4 million and the transfer of land associated with the Chapleau Cree First Nation Treaty Land Entitlement Claim Settlement Agreement.
Other key changes to expense projections include:
- A transfer of $116.4 million in capital funding from the Ministry of Economic Development, Employment and Infrastructure to the Ministry of Agriculture, Food, and Rural Affairs for the delivery of municipal infrastructure projects under the 2014 Building Canada Fund.
- A transfer totaling $26.8 million from the Ministry of Citizenship, Immigration and International Trade to the Ministry of Tourism, Culture and Sport, the Ministry of Children and Youth Services, and Treasury Board Secretariat to revitalize communities and celebrate Ontario's 150th birthday.
- An increase of $0.9 million, fully offset by increased federal revenue through the National Disaster Mitigation Program, to support flood mitigation measures across Ontario.
The outlook for interest on debt expense is unchanged from the 2016 Budget plan. The projected cost of borrowing is consistent with the 2016 Budget, as interest rates remain in line with the Budget forecast.
Asset Optimization
The Province is making progress on its asset optimization strategy.
Since the release of the 2016 Budget, the government completed a secondary offering of 14 per cent of Hydro One common shares in April 2016 and closed the sale of the LCBO head office lands in June 2016.
The government remains on track to generate $5.7 billion in net revenue gains over time from its asset optimization initiative. All net revenue gains from the sale of qualifying assets will be dedicated to the Trillium Trust to help fund investments in transit, transportation and other priority infrastructure under Moving Ontario Forward.
This asset optimization target will help support the single largest infrastructure investment program in the province's history.
Fiscal Prudence
The 2016 Budget included a $1.0 billion reserve in 2016–17 to protect the fiscal outlook against unforeseen adverse changes in the Province's revenue and expense, including those resulting from changes in Ontario's economic performance or the impact of natural disasters. The current fiscal outlook maintains the full reserve.
The current outlook also maintains contingency funds to help mitigate expense risks — particularly in cases where health and safety may be compromised or services to the most vulnerable are jeopardized — that may otherwise adversely affect Ontario's fiscal performance.
Section C: Ontario's Economic Outlook
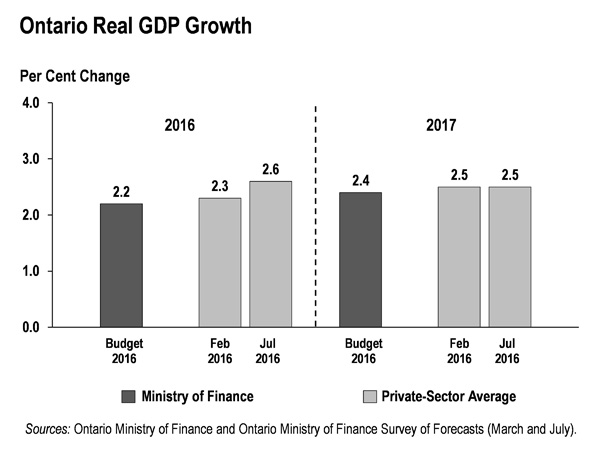
As of July 5, 2016, private-sector forecasters, on average, project Ontario real GDP to increase by 2.6 per cent in 2016, up from the 2.3 per cent increase expected at the time of the 2016 Budget. Growth in 2017 is unchanged at 2.5 per cent.
Expectations for global economic growth in 2016 have been lowered since the 2016 Budget. The International Monetary Fund lowered their 2016 global growth forecast from 3.4 per cent at the time of the Budget to 3.1 per cent in July due to weakness in advanced and emerging economies, and the potential impact of United Kingdom's recent vote to leave the European Union. The average forecast for 2016 real GDP growth in the United States, Ontario's largest trading partner, has declined from 2.1 per cent at the time of the 2016 Budget to 1.9 per cent in July.
Section D: Economic Performance
The Ontario economy continues to grow in a challenging global environment, with real GDP rising by a solid 0.8 per cent (3.0 per cent at annual rates) in the first quarter of 2016. This follows a similar increase in the fourth quarter of 2015. Ontario posted higher real GDP growth in the first quarter than Canada, the U.S. and all other G7 countries.
The strength in Ontario's economy has supported steady employment gains. Ontario's employment increased by 85,100 jobs over the first six months of 2016, compared to the same period in 2015. As of June 2016, employment increased by 625,100 net jobs, or 9.8 per cent, above the recessionary low of June 2009, and the unemployment rate declined to 6.4 per cent, below the national average and the lowest rate since September 2008..
Major economic indicators of business-sector activity have advanced strongly during the first half of 2016. On a year-to-date basis, Ontario's international merchandise exports increased 12.6 per cent, compared to the first five months of 2015. During the same period, manufacturing sales advanced 7.6 per cent, led by the auto sector. Similarly, consumers have recorded strong year-to-date gains in retail sales, home resale activity and housing starts.
| Item | Monthly 2016 April |
Monthly 2016 May |
Monthly 2016 June |
Quarterly 2016Q1 |
Quarterly 2016Q2 |
Annual 2015 |
|---|---|---|---|---|---|---|
| Gross Domestic Product - Real GDP | N/A | N/A | N/A | 0.8 | N/A | 2.6 |
| Gross Domestic Product - Nominal GDP | N/A | N/A | N/A | 0.7 | N/A | 3.5 |
| Labour Market - Labour Force (Change in 000s) | 13.7 | -10.1 | -20.1 | 36.8 | 7.5 | 7.5 |
| Labour Market - Employment (Change in 000s) | -3.3 | 21.6 | -4.2 | 36.1 | 15.2 | 45.3 |
| Labour Market - Unemployment Rate (%) | 7.0 | 6.6 | 6.4 | 6.8 | 6.7 | 6.8 |
| Household Sector - Retail Sales | 0.4 | N/A | N/A | 1.5 | N/A | 4.2 |
| Household Sector - Housing Starts | -25.9 | 5.6 | 25.8 | 6.5 | -4.7 | 18.6 |
| Household Sector - MLS Home Resales | 2.8 | -0.1 | 0.2 | 2.3 | 4.5 | 9.6 |
| Manufacturing Sales - Transportation Equipment | 0.6 | -3.6 | N/A | 7.1 | N/A | 8.6 |
| Consumer Price Index1 | 2.1 | 1.9 | N/A | 1.7 | N/A | 1.2 |
[1] Per cent change from a year earlier, data not seasonally adjusted.
N/A = Data not available.
Sources: Statistics Canada, Ontario Ministry of Finance, Canada Mortgage and Housing Corporation, and Canadian Real Estate Association.
Section E: Details of Ontario's Finances
Revenue
| Item | 2016–17 Budget Plan |
2016–17 Current Outlook |
2016–17 In-Year Change |
|---|---|---|---|
| Taxation Revenue - Personal Income Tax | 32,167 | 32,167 | – |
| Taxation Revenue - Sales Tax2 | 23,976 | 23,976 | – |
| Taxation Revenue - Corporations Tax | 12,050 | 12,050 | – |
| Taxation Revenue - Education Property Tax3 | 5,834 | 5,834 | – |
| Taxation Revenue - Employer Health Tax | 6,007 | 6,007 | – |
| Taxation Revenue - Ontario Health Premium | 3,604 | 3,604 | – |
| Taxation Revenue - Gasoline Tax | 2,522 | 2,522 | – |
| Taxation Revenue - Land Transfer Tax | 2,051 | 2,051 | – |
| Taxation Revenue - Tobacco Tax | 1,221 | 1,221 | – |
| Taxation Revenue - Fuel Tax | 790 | 790 | – |
| Taxation Revenue - Beer and Wine Tax | 611 | 611 | – |
| Taxation Revenue - Electricity Payments-In-Lieu of Taxes | 515 | 515 | – |
| Taxation Revenue - Other Taxes | 471 | 471 | – |
| Total Taxation Revenue | 91,819 | 91,819 | – |
| Government of Canada - Canada Health Transfer | 13,858 | 13,858 | – |
| Government of Canada - Canada Social Transfer | 5,128 | 5,128 | – |
| Government of Canada - Equalization | 2,304 | 2,304 | – |
| Government of Canada - Infrastructure Programs | 1,017 | 1,017 | – |
| Government of Canada - Labour Market Programs | 989 | 989 | – |
| Government of Canada - Social Housing | 434 | 434 | – |
| Other Federal Payments | 914 | 915 | 1 |
| Total Government of Canada | 24,644 | 24,645 | 1 |
| Government Business Enterprises - Ontario Lottery and Gaming Corporation | 1,953 | 1,953 | – |
| Government Business Enterprises - Liquor Control Board of Ontario | 2,025 | 2,025 | – |
| Government Business Enterprises - Ontario Power Generation Inc./Hydro One Ltd./ Brampton Distribution Holdco Inc. | 1,049 | 1,049 | – |
| Total Government Business Enterprises | 5,027 | 5,027 | – |
| Other Non-Tax Revenue - Reimbursements | 983 | 983 | – |
| Other Non-Tax Revenue - Vehicle and Driver Registration Fees | 1,751 | 1,751 | – |
| Other Non-Tax Revenue - Electricity Debt Retirement Charge | 625 | 625 | – |
| Other Non-Tax Revenue - Power Supply Contract Recoveries | 643 | 643 | – |
| Other Non-Tax Revenue - Sales and Rentals | 2,421 | 2,421 | – |
| Other Non-Tax Revenue - Cap-and-Trade Proceeds | 478 | 478 | – |
| Other Non-Tax Revenue - Other Fees and Licences | 987 | 987 | – |
| Other Non-Tax Revenue - Net Reduction of Power Purchase Contract Liability | 129 | 129 | – |
| Other Non-Tax Revenue - Royalties | 287 | 287 | – |
| Other Non-Tax Revenue - Miscellaneous Other Non-Tax Revenue | 795 | 795 | – |
| Total Other Non-Tax Revenue | 9,099 | 9,099 | – |
| Total Revenue | 130,589 | 130,590 | 1 |
[2] Sales Tax revenue is net of the Ontario Sales Tax Credit and the energy component of the Ontario Energy and Property Tax Credit.
[3] Education Property Tax revenue is net of the property tax credit component of the Ontario Energy and Property Tax Credit and the Ontario Senior Homeowners' Property Tax Grant.
Note: Numbers may not add due to rounding.
Total Expense
| Item | 2016–17 Budget Plan |
2016–17 Current Outlook |
2016–17 In-Year Change |
|---|---|---|---|
| Aboriginal Affairs4 | 77.0 | 78.8 | 1.8 |
| Agriculture, Food and Rural Affairs5 | 915.9 | 919.0 | 3.1 |
| Attorney General | 1,867.8 | 1,867.8 | – |
| Board of Internal Economy | 219.9 | 219.9 | – |
| Children and Youth Services | 4,346.1 | 4,448.1 | 102.0 |
| Citizenship, Immigration and International Trade | 220.8 | 194.0 | (26.8) |
| Community and Social Services | 11,467.5 | 11,470.2 | 2.7 |
| Community Safety and Correctional Services | 2,649.5 | 2,649.5 | – |
| Economic Development, Employment and Infrastructure / Research and Innovation6 | 1,177.0 | 1,177.0 | – |
| Education7 | 25,635.8 | 25,635.8 | – |
| Energy8 | 322.1 | 322.1 | – |
| Environment and Climate Change | 531.4 | 531.4 | – |
| Executive Offices | 44.0 | 47.9 | 3.9 |
| Finance9 | 963.1 | 963.1 | – |
| Francophone Affairs, Office of | 5.7 | 5.7 | – |
| Government and Consumer Services | 607.6 | 607.6 | – |
| Health and Long-Term Care | 51,785.2 | 51,815.6 | 30.4 |
| Labour | 309.5 | 309.5 | – |
| Municipal Affairs and Housing10 | 900.0 | 900.0 | – |
| Natural Resources and Forestry11 | 750.6 | 750.6 | – |
| Northern Development and Mines | 790.7 | 790.7 | – |
| Tourism, Culture and Sport12 | 1,250.8 | 1,273.5 | 22.7 |
| Training, Colleges and Universities | 7,876.8 | 7,876.8 | – |
| Transportation | 3,850.9 | 3,850.9 | – |
| Treasury Board Secretariat13 | 316.9 | 320.3 | 3.4 |
| Interest on Debt14 | 11,756.0 | 11,756.0 | – |
| Other Expense15 | 4,056.8 | 3,914.5 | (142.3) |
| Year-End Savings16 | (800.0) | (800.0) | – |
| Total Expense | 133,895.4 | 133,896.3 | 0.9 |
[4], [5], [6], [7], [8], [9], [10], [11], [12], [13], [15] Details on other ministry expense can be found in the Details of Other Expense table.
[14] Interest on debt is net of interest capitalized during construction of tangible capital assets of $183 million in 2016–17.
[16] As in past years, the Year-End Savings provision reflects efficiencies through in-year expenditure management and underspending due to factors such as program management, and changes in project startups and implementation plans.
Notes: Numbers may not add due to rounding.
The impact of recently announced ministry restructuring will be reflected in future updates.
Details of Other Expense
| Item | 2016–17 Budget Plan |
2016–17 Current Outlook |
2016–17 In-Year Change |
|---|---|---|---|
| Aboriginal Affairs - One-Time Investments including Settlements | – | 0.4 | 0.4 |
| Agriculture, Food and Rural Affairs - Time-Limited Investments in Infrastructure | – | 116.4 | 116.4 |
| Economic Development, Employment and Infrastructure / Research and Innovation - Federal-Provincial Infrastructure Programs | 618.7 | 502.2 | (116.4) |
| Education - Teachers' Pension Plan17 | (452.0) | (452.0) | – |
| Energy - Strategic Asset Management and Transformation Related to Hydro One | 70.9 | 70.9 | – |
| Finance - Ontario Municipal Partnership Fund | 505.0 | 505.0 | – |
| Finance - Power Supply Contract Costs | 643.1 | 643.1 | – |
| Municipal Affairs and Housing - Time-Limited Investments in Municipal, Social and Affordable Housing | 160.3 | 160.3 | – |
| Municipal Affairs and Housing - Other Time-Limited Investments | – | 0.9 | 0.9 |
| Natural Resources and Forestry - Emergency Forest Firefighting | 69.8 | 69.8 | – |
| Tourism, Culture and Sport - Time-Limited Investments to Support 2015 Pan/Parapan American Games | 88.6 | 88.6 | – |
| Treasury Board Secretariat - Capital Contingency Fund | 100.0 | 100.0 | – |
| Treasury Board Secretariat - Operating Contingency Fund | 1,100.0 | 956.4 | (143.6) |
| Treasury Board Secretariat - Employee and Pensioner Benefits | 1,152.5 | 1,152.5 | – |
| Total Other Expense | 4,056.8 | 3,914.5 | (142.3) |
[17] Numbers reflect Public Sector Accounting Board pension expense. Ontario's matching contributions to the plan is $1,664 million in 2016–17.
Notes: Numbers may not add due to rounding.
The impact of recently announced ministry restructuring will be reflected in future updates.
2016–17 Infrastructure Expenditures
| Sector | 2016–17 Current Outlook Investment in Capital Assets18 |
2016–17 Current Outlook Transfers and Other Infrastructure Expenditures19 |
2016–17 Current Outlook Total Infrastructure Expenditures20 |
|---|---|---|---|
| Transportation - Transit | 4,701 | 688 | 5,389 |
| Transportation - Provincial Highways | 2,108 | 43 | 2,150 |
| Transportation - Other Transportation, Property and Planning | 603 | 166 | 768 |
| Health - Hospitals | 2,621 | 263 | 2,884 |
| Health - Other Health | 60 | 248 | 308 |
| Education | 1,834 | 171 | 2,005 |
| Postsecondary - Colleges and Other | 608 | 4 | 613 |
| Postsecondary - Universities | – | 187 | 187 |
| Social | 8 | 304 | 311 |
| Justice | 58 | 197 | 255 |
| Other Sectors21 | 436 | 934 | 1,370 |
| Total | 13,038 | 3,202 | 16,240 |
[18] Includes $183 million in interest capitalized during construction.
[19] Includes transfers to municipalities, universities and non-consolidated agencies.
[20] Includes third party investments in hospitals, colleges and schools; and provisional federal contributions to provincial infrastructure investments.
[21] Includes government administration, natural resources, culture and tourism sectors.
Note: Numbers may not add due to rounding.
Review of Selected Financial and Economic Statistics
| Item | 2012–13 | 2013–14 | 2014–15 | Interim 2015–16 |
Current Outlook 2016–17 |
|---|---|---|---|---|---|
| Revenue | 113,369 | 115,911 | 118,546 | 126,547 | 130,590 |
| Expense - Programs | 112,248 | 115,792 | 118,225 | 120,883 | 122,140 |
| Expense - Interest on Debt22 | 10,341 | 10,572 | 10,635 | 11,200 | 11,756 |
| Total Expense | 122,589 | 126,364 | 128,860 | 132,083 | 133,896 |
| Surplus/(Deficit) Before Reserve | (9,220) | (10,453) | (10,314) | (5,536) | (3,306) |
| Reserve | – | – | – | 150 | 1,000 |
| Surplus/(Deficit) | (9,220) | (10,453) | (10,314) | (5,686) | (4,306) |
| Net Debt | 252,088 | 267,190 | 284,576 | 296,109 | 308,315 |
| Accumulated Deficit | 167,132 | 176,634 | 187,511 | 193,447 | 197,753 |
| Gross Domestic Product (GDP) at Market Prices | 680,084 | 693,210 | 721,970 | 747,101 | 779,407 |
| Primary Household Income | 459,111 | 473,905 | 490,412 | 508,714 | 531,151 |
| Population – July (000s) | 13,410 | 13,551 | 13,678 | 13,792 | 13,960 |
| Net Debt per Capita (dollars) | 18,798 | 19,717 | 20,806 | 21,470 | 22,086 |
| Household Income per Capita (dollars) | 34,236 | 34,972 | 35,855 | 36,885 | 38,048 |
| Interest on Debt as a Per Cent of Revenue | 9.1 | 9.1 | 9.0 | 8.9 | 9.0 |
| Net Debt as a Per Cent of GDP | 37.1 | 38.5 | 39.4 | 39.6 | 39.6 |
| Accumulated Deficit as a Per Cent of GDP | 24.6 | 25.5 | 26.0 | 25.9 | 25.4 |
[22] Interest on debt is net of interest capitalized during construction of tangible capital assets of $134 million in 2013–14, $202 million in 2014–15, $131 million in 2015–16, and $183 million in 2016–17.
Sources: Ontario Ministry of Finance and Statistics Canada.
Section F: Ontario's 2016–17 Financing Program
Province and Ontario Electricity Financial Corporation
| Item | 2016–17 Budget Plan |
2016–17 Current Outlook |
2016–17 In-Year Change |
|---|---|---|---|
| Deficit/(Surplus) | 4.3 | 4.3 | – |
| Investment in Capital Assets | 11.2 | 11.2 | – |
| Non-Cash Adjustments | (5.8) | (5.8) | – |
| Other Net Loans/Investments | (0.9) | (1.1) | (0.2) |
| Debt Maturities | 21.5 | 21.2 | (0.2) |
| Debt Redemptions | 0.1 | 0.1 | – |
| Total Funding Requirement | 30.3 | 29.8 | (0.4) |
| Canada Pension Plan Borrowing | (0.1) | (0.1) | – |
| Decrease/(Increase) in Short-Term Borrowing | (1.0) | (1.0) | – |
| Increase/(Decrease) in Cash and Cash Equivalents | (2.7) | (2.3) | 0.4 |
| Preborrowing from 2015–16 | – | (2.0) | (2.0) |
| Total Long-Term Public Borrowing Requirement | 26.4 | 24.4 | (2.0) |
Note: Numbers may not add due to rounding.
Borrowing Program Status (as at June 30, 2016)
| Item | Completed | Remaining | Total |
|---|---|---|---|
| Province | 8.1 | 16.3 | 24.4 |
| Ontario Electricity Financial Corporation | 0.0 | 0.0 | 0.0 |
| Total | 8.1 | 16.3 | 24.4 |
Note: Numbers may not add due to rounding.
Long-Term Public Borrowing completed as at June 30, 2016 totalled $8.1 billion, as follows:
| Item | ($ Billions) |
|---|---|
| Domestic Issues | 4.5 |
| Global/US Dollar/Other Issues | 3.6 |
| Total | 8.1 |
As of June 30, 2016, approximately 55 per cent of this year's borrowing was completed in Canadian dollars. The Province may revise its Canadian dollar borrowing target of 75 per cent published in the 2016 Budget if international demand for Ontario bonds outpaces domestic demand.
Ministry of Finance
For general inquiries regarding the 2016–17 First Quarter Finances, please call:
Toll-free English & French inquiries:
Teletypewriter:
© Queen's Printer for Ontario, 2016
Chart description
Chart: Ontario Real GDP Growth
This bar chart shows 2016 Budget forecast and private-sector average forecast for Ontario real GDP growth in 2016 and 2017. The 2016 Budget projected Ontario real GDP to rise by 2.2 per cent in 2016 and 2.4 per cent in 2017. As of July 5, 2016, private-sector forecasters, on average, project Ontario real GDP to increase by 2.6 per cent in 2016, up from the 2.3 per cent increase expected at the time of the 2016 Budget. Private-sector forecasts for Ontario real GDP growth in 2017 are unchanged at 2.5 per cent since the time of the Budget.