2019-20 First Quarter Finances
August 2019
The First Quarter Finances report contains information about Ontario’s 2019–20 fiscal outlook as of June 30, 2019.
Highlights
- Ontario’s economy has continued to grow despite global uncertainty. In the first quarter of 2019 (January, February, March), Ontario’s real GDP increased 0.1 per cent, matching the national average. Growth in the first quarter was supported by consumer spending and business investment in machinery and equipment.
- Employment in Ontario is growing strongly and the unemployment rate remains low. Since June 2018, 173,500 net new jobs have been created, while the unemployment rate has been trending downward, reaching 5.2 per cent in May 2019, the lowest rate in nearly three decades.
- As of June 30, 2019, the government is projecting a deficit of $10.3 billion in 2019–20, unchanged from the outlook presented in the 2019 Budget.
- Since the release of the 2019 Budget, credit rating agencies — Moody’s, DBRS Limited (DBRS), and Fitch — confirmed the Province’s current credit ratings and Fitch improved the outlook on Ontario’s rating to Stable from Negative in response to the 2019 Budget Plan.
- Interest rates have dropped substantially since the time of the 2019 Budget. This has allowed the Province to project interest on debt savings of $220 million relative to the Budget forecast while completing $14 billion of its $36 billion total borrowing requirement for 2019–20, as of August 9, 2019.
- While Ontario’s economy was negatively impacted by harsh winter weather in early 2019, many key economic indicators point to stronger growth in the following months. Indicators such as manufacturing sales, retail sales, and wholesale trade have all posted gains on a year-to-date basis. In addition, housing activity has rebounded in the second quarter of 2019.
Introduction
The government has taken important steps in providing relief for families and businesses while charting a path to a balanced budget. Over the last year, steady progress has been made to reduce the Provincial deficit from the inherited $15.0 billion identified by the Independent Financial Commission of Inquiry in 2018–19.
At the same time, the government continues to listen to the people of Ontario while ensuring that critical public services, including Ontario’s world-class health care and education systems, are protected.
As of the first quarter of 2019–20, the government is projecting a deficit of $10.3 billion, unchanged from the outlook published in the 2019 Budget.
The measures implemented by the government to restore fiscal health to the Province’s books are paying off. Moody’s, DBRS, and Fitch have confirmed the Province’s current credit ratings and Fitch improved the outlook on Ontario’s rating to Stable from Negative in response to the 2019 Budget Plan.
The government has taken steps to help grow the economy by making Ontario open for business and establishing an environment where businesses can thrive, grow and create good jobs for the people of Ontario. Since June 2018, 173,500 net new jobs have been created, while the unemployment rate has been trending downward, reaching 5.2 per cent in May 2019, the lowest rate since March 1990.
The 2019–20 First Quarter Finances is the first fiscal update since the 2019 Budget and the first under Ontario’s new fiscal legislation, the Fiscal Sustainability, Transparency and Accountability Act, 2019 (FSTAA). The FSTAA features critical improvements that put fiscal sustainability at the centre of Ontario’s fiscal planning, enhances transparency and public reporting, and includes provisions that bolster oversight and compliance.
The FSTAA requires the government to publicly report on its fiscal plan through the following publications that must be released by the prescribed deadlines:
| Report | Deadline |
|---|---|
| Budget* | March 31 |
| First Quarter Finances | August 15 |
| Mid-Year Review (Fall Economic Statement) | November 15 |
| Third Quarter Finances | February 15 |
[*] Except in the fiscal year of a general election.
Section A: 2019–20 Ontario’s fiscal outlook
The Province’s 2019–20 deficit is projected to be $10.3 billion — unchanged from the outlook published in the 2019 Budget.
Total revenue is projected to be $154.2 billion, slightly lower than the 2019 Budget projection by $11 million, largely reflecting the government’s decision to freeze some driver and vehicle fees.
Total expense is projected to be $163.4 billion, $38 million lower than the 2019 Budget projections. This reflects a projected increase to program expense of $182 million for additional investments primarily in health care and education programs and a lower projected interest on debt expense of $220 million.
Ontario’s net debt-to-GDP ratio is unchanged from the 2019 Budget forecast of 40.7 per cent in 2019–20.
The 2019–20 outlook also maintains a $1.0 billion reserve to protect the fiscal outlook against unforeseen adverse changes that could impact the Ontario’s revenue and expense forecasts.
2019–20 In-year fiscal performance
| Item | 2019–20 Budget Plan |
2019–20 Current Outlook1 |
2019–20 In-Year Change |
|---|---|---|---|
| Revenue | 154,165 | 154,154 | (11) |
| Expense — Programs | 150,109 | 150,291 | 182 |
| Expense — Interest on Debt | 13,335 | 13,115 | (220) |
| Total Expense | 163,444 | 163,406 | (38) |
| Surplus/(Deficit) Before Reserve | (9,279) | (9,252) | 27 |
| Reserve | 1,000 | 1,000 | - |
| Surplus/(Deficit) | (10,279) | (10,252) | 27 |
[1] Current outlook reflects government decisions and information available as of June 30, 2019.
Note: Numbers may not add due to rounding.
Revenue
The 2019–20 revenue outlook is projected to be $154.2 billion, $11 million lower than forecast in the 2019 Budget, as a result of relief from previously scheduled fee increases. This fee relief includes freezing key driver, vehicle and commercial fees until July 1, 2020, and the impact of an extension of the fee waiver for a change-of-sex designation on birth registrations.
The revenue changes outlined above are based on information available at the end of the first quarter. There are further upside and downside risks that could materially affect the 2019–20 revenue outlook. These include changes to the economic growth outlook, new information on tax assessments, and collections. The government will monitor these economic and revenue developments and will provide further details in future fiscal updates.
Expense
Total expense is projected to be $163.4 billion, $38 million lower than the 2019 Budget projections due to lower interest on debt expense of $220 million, which is partially offset by additional investments primarily in health care and education programs.
| Item | 2019–20 |
|---|---|
| Key Changes to Program Expense Projections — Child Care | 100.5 |
| Key Changes to Program Expense Projections — Land Ambulance | 35.7 |
| Key Changes to Program Expense Projections — Public Health Units | 33.4 |
| Key Changes to Program Expense Projections — Ontario Wine Fund, the Small Cidery and Small Distillery Support Program | 12.4 |
| Total Change to Program Expense Projections | 182.0 |
| Key Changes to Program Expense Projections Offset by Contingency Fund — Audit and Accountability Fund | 7.4 |
| Total Change to Contingency Fund | (7.4) |
| Interest on Debt Change | (220.0) |
| Net In-Year Expense Changes | (38.0) |
[1] Changes are shown since the 2019 Budget.
Note: Numbers may not add due to rounding.
The outlook for program expense in 2019–20 is projected to be $150.3 billion, a projected increase of approximately $182 million compared to the 2019 Budget.
Key changes to program expense projections include:
- $100.5 million to help municipal partners provide child care programs;
- $35.7 million for Land Ambulance;
- $33.4 million for Public Health Units; and
- $12.4 million for the Ontario Wine Fund, the Small Cidery and Small Distillery Support Program, and the Vineyard Improvement Program to support Ontario grape growers, wineries, small distilleries and craft cideries.
Other changes to program expense projections offset by the contingency fund include:
- $7.4 million for the creation of a one-time, centrally administered Audit and Accountability Fund to allow municipal and school board partners to access funding to undertake independent reviews of operations and service delivery with a goal of finding administrative efficiencies.
Ontario’s interest on debt expense is forecast to be $13,115 million, a decrease of $220 million from the 2019 Budget due to lower than projected cost of borrowing in the first quarter and lower than forecast interest rates for future borrowing.
Fiscal prudence
The Fiscal Sustainability, Transparency and Accountability Act, 2019, requires Ontario’s fiscal plan to incorporate prudence in the form of a reserve to protect the fiscal outlook against unforeseen adverse changes in the Province’s revenue and expense, including those resulting from changes in Ontario’s economic performance. The 2019 Budget included a reserve of $1.0 billion in 2019–20, which has been maintained as part of the current fiscal outlook.
Contingency funds are also maintained to help mitigate expense risks — for example, in cases where health and safety may be compromised — that may otherwise adversely affect Ontario’s fiscal performance.
Section B: Ontario’s economic outlook
Ontario’s economy has continued to grow despite global uncertainty. In the first quarter of 2019 (January, February, March), Ontario’s real GDP increased 0.1 per cent, matching the national average. Growth in the first quarter was supported by consumer spending and business investment in machinery and equipment. However, growth was moderated by international net trade and residential construction investment.
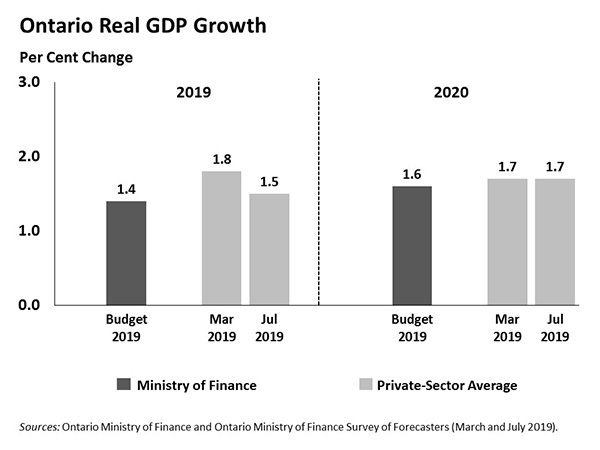
As of July 25, 2019, private-sector forecasters, on average, project Ontario’s real GDP to increase by 1.5 per cent in 2019. This is down from the 1.8 per cent average private-sector projection at the time of the 2019 Budget, but remains above the Budget planning assumption of 1.4 per cent. The private-sector outlook for real GDP growth in 2020 is unchanged at 1.7 per cent.
There are a broad range of risks surrounding the economic outlook. One of the key risks is heightened uncertainty around global trade which has affected exports, confidence, and business investment. Trade uncertainty, along with geopolitical tensions, have contributed to increased volatility in financial markets. Another risk is elevated household debt levels, which could dampen housing market activity and consumer spending.
Section C: Ontario’s economic performance
Employment in Ontario is growing strongly and the unemployment rate remains low. Since June 2018, 173,500 net new jobs have been created, while the unemployment rate has been trending downward, reaching 5.2 per cent in May 2019, the lowest rate since March 1990.
While Ontario’s economy was negatively impacted by harsh winter weather in early 2019, many key economic indicators point to stronger growth in the following months. Indicators such as manufacturing sales, retail sales and wholesale trade have all posted gains on a year-to-date basis. In addition, housing activity has rebounded in the second quarter of 2019.
Ontario key economic indicators
| Item | Monthly 2019 Apr |
Monthly 2019 May |
Monthly 2019 June |
Quarterly 2019Q1 |
Quarterly 2019Q2 |
Annual 2018 |
Year-to-date 2019 |
|---|---|---|---|---|---|---|---|
| Gross Domestic Product — Real GDP | N/A | N/A | N/A | 0.1 | N/A | 2.3 | N/A |
| Gross Domestic Product — Nominal GDP | N/A | N/A | N/A | 0.6 | N/A | 3.5 | N/A |
| Labour Market — Employment (Change in 000s) | 47.1 | 20.9 | (7.0) | 79.4 | 65.1 | 114.4 | 194.4 |
| Labour Market — Unemployment Rate (%) | 6.0 | 5.2 | 5.4 | 5.8 | 5.5 | 5.6 | 5.8 |
| Other Key Economic Indicators — Retail Sales | 1.2 | 0.5 | N/A | (1.0) | N/A | 4.4 | 3.5 |
| Other Key Economic Indicators — Housing Starts | 36.6 | (41.6) | 35.3 | (24.8) | 10.0 | (0.5) | (19.5) |
| Other Key Economic Indicators — MLS Home Resales | 5.6 | 3.1 | 0.8 | (3.0) | 6.5 | (12.9) | 6.1 |
| Other Key Economic Indicators — Manufacturing Sales | (1.8) | 2.7 | N/A | (0.2) | N/A | 3.9 | 1.8 |
| Other Key Economic Indicators — Wholesale Trade | 0.5 | (1.0) | N/A | 1.2 | N/A | 2.5 | 2.2 |
| Other Key Economic Indicators — Consumer Price Index1 | 1.9 | 2.4 | 2.0 | 1.6 | 2.1 | 2.4 | 1.8 |
[1] Per cent change from a year earlier, data not seasonally adjusted.
N/A = Data not available.
Sources: Statistics Canada, Ontario Ministry of Finance, Canada Mortgage and Housing Corporation, and Canadian Real Estate Association.
Section D: Details of Ontario’s finances
Revenue
| Item | 2019–20 Budget Plan |
2019–20 Current Outlook |
2019–20 In-Year Change |
|---|---|---|---|
| Taxation Revenue — Personal Income Tax | 36,600 | 36,600 | - |
| Taxation Revenue — Sales Tax | 28,076 | 28,076 | - |
| Taxation Revenue — Corporations Tax | 15,171 | 15,171 | - |
| Taxation Revenue — Education Property Tax | 6,085 | 6,085 | - |
| Taxation Revenue — Employer Health Tax | 6,837 | 6,837 | - |
| Taxation Revenue — Ontario Health Premium | 4,021 | 4,021 | - |
| Taxation Revenue — Gasoline Tax | 2,766 | 2,766 | - |
| Taxation Revenue — Land Transfer Tax | 2,877 | 2,877 | - |
| Taxation Revenue — Tobacco Tax | 1,213 | 1,213 | - |
| Taxation Revenue — Fuel Tax | 776 | 776 | - |
| Taxation Revenue — Beer, Wine and Spirits Taxes | 618 | 618 | - |
| Taxation Revenue — Ontario Portion of the Federal Cannabis Excise Duty | 70 | 70 | - |
| Taxation Revenue — Electricity Payments In Lieu of Taxes | 488 | 488 | - |
| Taxation Revenue — Other Taxes | 540 | 540 | - |
| Taxation Revenue — Total | 106,138 | 106,138 | - |
| Government of Canada — Canada Health Transfer | 15,646 | 15,646 | - |
| Government of Canada — Canada Social Transfer | 5,653 | 5,653 | - |
| Government of Canada — Equalization | - | - | - |
| Government of Canada — Infrastructure Programs | 1,043 | 1,043 | - |
| Government of Canada — Labour Market Programs | 1,036 | 1,036 | - |
| Government of Canada — Social Housing Agreement | 359 | 359 | - |
| Government of Canada — Other Federal Payments | 1,386 | 1,386 | - |
| Government of Canada — Direct Transfers to Broader Public-Sector Organizations | 330 | 330 | - |
| Government of Canada — Total | 25,453 | 25,453 | - |
| Income from Government Business Enterprises — Ontario Lottery and Gaming Corporation | 2,414 | 2,414 | - |
| Income from Government Business Enterprises — Liquor Control Board of Ontario | 2,339 | 2,339 | - |
| Income from Government Business Enterprises — Ontario Cannabis Store | 10 | 10 | - |
| Income from Government Business Enterprises — Ontario Power Generation Inc./Hydro One Ltd. | 1,058 | 1,058 | - |
| Income from Government Business Enterprises — Total | 5,821 | 5,821 | - |
| Other Non-Tax Revenue — Reimbursements | 981 | 981 | - |
| Other Non-Tax Revenue — Vehicle and Driver Registration Fees | 2,066 | 2,055 | (11) |
| Other Non-Tax Revenue — Electricity Debt Retirement Charge | - | - | - |
| Other Non-Tax Revenue — Power Supply Contract Recoveries | 125 | 125 | - |
| Other Non-Tax Revenue — Sales and Rentals | 1,590 | 1,590 | - |
| Other Non-Tax Revenue — Carbon Allowance Proceeds | - | - | - |
| Other Non-Tax Revenue — Other Fees and Licences | 1,080 | 1,080 | (0) |
| Other Non-Tax Revenue — Net Reduction of Power Purchase Contracts | 30 | 30 | - |
| Other Non-Tax Revenue — Royalties | 287 | 287 | - |
| Other Non-Tax Revenue — Fees, Donations and Other Revenues from Hospitals, School Boards and Colleges | 9,364 | 9,364 | - |
| Other Non-Tax Revenue — Miscellaneous Other Non-Tax Revenue | 1,230 | 1,230 | - |
| Other Non-Tax Revenue — Total | 16,753 | 16,742 | (11) |
| Total Revenue | 154,165 | 154,154 | (11) |
Note: Numbers may not add due to rounding.
Total expense
| Ministry Expense1 | 2019–20 Budget Plan |
2019–20 Current Outlook |
2019–20 In-Year Change |
|---|---|---|---|
| Agriculture, Food and Rural Affairs (Base) | 839.7 | 852.1 | 12.4 |
| Agriculture, Food and Rural Affairs — Time-Limited Investments in Infrastructure | 38.5 | 38.5 | - |
| Agriculture, Food and Rural Affairs (Total) | 878.2 | 890.6 | 12.4 |
| Attorney General (Total) | 1,933.7 | 1,933.7 | - |
| Board of Internal Economy (Total) | 294.7 | 294.7 | - |
| Children, Community and Social Services (Total) | 16,666.3 | 16,666.3 | - |
| Economic Development, Job Creation and Trade (Total) | 782.2 | 782.2 | - |
| Education (Base) | 29,818.3 | 29,918.8 | 100.5 |
| Education — Teachers’ Pension Plan2 | 1,732.0 | 1,732.0 | - |
| Education (Total) | 31,550.3 | 31,650.8 | 100.5 |
| Energy, Northern Development and Mines (Base) | 1,172.5 | 1,172.5 | - |
| Energy, Northern Development and Mines — Electricity Cost Relief Programs | 4,012.7 | 4,012.7 | - |
| Energy, Northern Development and Mines (Total) | 5,185.2 | 5,185.2 | - |
| Environment, Conservation and Parks (Total) | 631.2 | 631.2 | - |
| Executive Offices (Total) | 40.3 | 40.3 | - |
| Finance (Base) | 833.2 | 833.2 | - |
| Finance — Ontario Municipal Partnership Fund | 505.0 | 505.0 | - |
| Finance — Power Supply Contract Costs | 125.1 | 125.1 | - |
| Finance (Total) | 1,463.3 | 1,463.3 | - |
| Francophone Affairs (Total) | 5.8 | 5.8 | - |
| Government and Consumer Services (Total) | 666.5 | 666.5 | - |
| Health and Long-Term Care (Total) | 63,510.5 | 63,579.5 | 69.1 |
| Indigenous Affairs (Total) | 74.4 | 74.4 | - |
| Infrastructure (Base) | 390.1 | 390.1 | - |
| Infrastructure — Federal-Provincial Infrastructure Programs | 133.7 | 133.7 | - |
| Infrastructure (Total) | 523.8 | 523.8 | - |
| Labour (Total) | 306.1 | 306.1 | - |
| Municipal Affairs and Housing (Base) | 846.6 | 846.6 | - |
| Municipal Affairs and Housing — Time-Limited Investments | 270.9 | 270.9 | - |
| Municipal Affairs and Housing (Total) | 1,117.6 | 1,117.6 | - |
| Natural Resources and Forestry (Base) | 602.4 | 602.4 | - |
| Natural Resources and Forestry — Emergency Forest Firefighting | 69.8 | 69.8 | - |
| Natural Resources and Forestry (Total) | 672.3 | 672.3 | - |
| Seniors and Accessibility (Total) | 51.1 | 51.1 | - |
| Solicitor General (Total) | 2,965.1 | 2,965.1 | - |
| Tourism, Culture and Sport (Total) | 1,493.4 | 1,493.4 | - |
| Training, Colleges and Universities (Base) | 9,998.6 | 9,998.6 | - |
| Training, Colleges and Universities — Student Financial Assistance | 1,372.2 | 1,372.2 | - |
| Training, Colleges and Universities (Total) | 11,370.8 | 11,370.8 | - |
| Transportation (Base) | 4,549.0 | 4,549.0 | - |
| Transportation — Federal-Provincial Infrastructure Programs | 638.5 | 638.5 | - |
| Transportation (Total) | 5,187.5 | 5,187.5 | - |
| Treasury Board Secretariat (Base) | 286.9 | 294.2 | 7.4 |
| Treasury Board Secretariat — Employee and Pensioner Benefits3 | 1,352.0 | 1,352.0 | - |
| Treasury Board Secretariat — Operating Contingency Fund | 775.0 | 767.7 | (7.4) |
| Treasury Board Secretariat — Capital Contingency Fund | 325.0 | 325.0 | - |
| Treasury Board Secretariat (Total) | 2,738.9 | 2,738.9 | - |
| Interest on Debt4 | 13,335.0 | 13,115.0 | (220.0) |
| Year-End Savings | - | - | - |
| Total Expense | 163,444.1 | 163,406.1 | (38.0) |
[1] Numbers reflect current ministry structure as of the release of the 2019 Budget.
[2], [3] Numbers reflect the pension expense that was calculated based on recommendations of the Independent Financial Commission of Inquiry, as described in Note 19 to the Consolidated Financial Statements in Public Accounts of Ontario 2017–2018.
[4] Interest on debt is net of interest capitalized during construction of tangible capital assets of $475 million in 2019–20.
Note: Numbers may not add due to rounding.
2019–20 Infrastructure expenditures
| Sector | 2019–20 Investment in Capital Assets1 |
2019–20 Transfers and Other Infrastructure Expenditures2 |
2019–20 Total Infrastructure Expenditures |
|---|---|---|---|
| Transportation — Transit | 4,294 | 1,234 | 5,527 |
| Transportation — Provincial Highways | 2,577 | 177 | 2,754 |
| Transportation — Other Transportation, Property and Planning | 189 | 96 | 284 |
| Health — Hospitals | 2,354 | 3 | 2,357 |
| Health — Other Health | 78 | 176 | 255 |
| Education | 2,416 | 19 | 2,435 |
| Postsecondary — Colleges and Other | 297 | 2 | 299 |
| Postsecondary — Universities | – | 52 | 52 |
| Social | 25 | 274 | 299 |
| Justice | 487 | 275 | 762 |
| Other Sectors3 | 850 | 749 | 1,599 |
| Total Infrastructure Expenditures | 13,566 | 3,056 | 16,623 |
| Less: Other Partner Funding4 | 1,891 | – | 1,891 |
| Total5 | 11,675 | 3,056 | 14,732 |
[1] Includes interest capitalized during construction of $475 million.
[2] Includes transfers to municipalities, universities and non-consolidated agencies.
[3] Includes government administration, natural resources, and culture and tourism sectors.
[4] Other Partner Funding refers to third-party investments in hospitals, colleges and schools.
[5] Includes Federal/Municipal contributions to provincial infrastructure investments.
Note: Numbers may not add due to rounding.
Review of selected financial and economic statistics1, 2
| Item | 2015–16 | 2016–17 | Actual 2017–18 |
Interim3 2018–19 |
Current Outlook 2019–20 |
|---|---|---|---|---|---|
| Revenue | 136,148 | 140,734 | 150,594 | 150,782 | 154,154 |
| Expense — Programs | 129,905 | 131,460 | 142,363 | 149,984 | 150,291 |
| Expense — Interest on Debt4 | 11,589 | 11,709 | 11,903 | 12,534 | 13,115 |
| Total Expense | 141,494 | 143,169 | 154,266 | 162,518 | 163,406 |
| Reserve | - | - | - | - | 1,000 |
| Surplus/(Deficit) | (5,346) | (2,435) | (3,672) | (11,736) | (10,252) |
| Net Debt | 306,357 | 314,077 | 323,834 | 343,441 | 359,916 |
| Accumulated Deficit | 203,014 | 205,939 | 209,023 | 220,759 | 230,011 |
| Gross Domestic Product (GDP) at Market Prices | 759,440 | 792,932 | 825,805 | 854,742 | 883,969 |
| Primary Household Income | 511,577 | 519,413 | 544,062 | 570,072 | 589,837 |
| Population – July (000s)5 | 13,707 | 13,875 | 14,071 | 14,323 | 14,660 |
| Net Debt per Capita (dollars) | 22,350 | 22,636 | 23,014 | 23,979 | 24,551 |
| Household Income per Capita (dollars) | 37,322 | 37,434 | 38,664 | 39,802 | 40,234 |
| Interest on Debt as a Per Cent of Revenue | 8.5% | 8.3% | 7.9% | 8.3% | 8.5% |
| Net Debt as a Per Cent of GDP | 40.3% | 39.6% | 39.2% | 40.2% | 40.7% |
| Accumulated Deficit as a Per Cent of GDP | 26.7% | 26.0% | 25.3% | 25.8% | 26.0% |
[1] Amounts reflect a change in pension expense that was calculated based on recommendations of the Independent Financial Commission of Inquiry, as described in Note 19 to the Consolidated Financial Statements, in Public Accounts of Ontario 2017–2018. Amounts for net debt and accumulated deficit also reflect this change.
[2] Revenues and expenses have been restated to reflect fiscally neutral changes in the presentation of third-party revenue for hospitals, school boards and colleges to be reported as revenue.
[3] Interim represents the 2019 Ontario Budget projection for the 2018–19 fiscal year.
[4] Interest on debt is net of interest capitalized during construction of tangible capital assets of $165 million in 2015–16, $159 million in 2016–17, $157 million in 2017–18, $325 million in 2018–19 and $475 million in 2019–20.
[5] Population figures are for July 1 of the fiscal year indicated (i.e., for 2015–16, the population on July 1, 2015 is shown).
Note: Numbers may not add due to rounding.
Sources: Statistics Canada, Ontario Ministry of Finance and Treasury Board Secretariat.
Section E: Ontario’s 2019–20 borrowing program
The forecast for the Province’s 2019–20 long-term public borrowing program remains at $36.0 billion, in line with the forecast in the 2019 Budget.
Ontario’s 2019–20 borrowing program
| Item | 2019–20 2019 Budget |
2019–20 Current Outlook |
2019–20 In-Year Change |
|---|---|---|---|
| Deficit/(Surplus) | 10.3 | 10.3 | - |
| Investment in Capital Assets | 11.6 | 11.6 | - |
| Non-Cash Adjustments | (7.7) | (7.7) | - |
| Loans to Infrastructure Ontario | 0.2 | 0.2 | - |
| Other Net Loans/Investments | 0.7 | 0.7 | - |
| Debt Maturities/Redemptions | 27.5 | 27.5 | - |
| Total Funding Requirement | 42.5 | 42.5 | - |
| Decrease/(Increase) in Short-Term Borrowing | (1.2) | (1.2) | - |
| Increase/(Decrease) in Cash and Cash Equivalents | (5.3) | (5.3) | - |
| Total Long-Term Public Borrowing | 36.0 | 36.0 | - |
Note: Numbers may not add due to rounding.
Source: Ontario Financing Authority.
Interest rates have dropped substantially since the time of the 2019 Budget. This has allowed the Province to project interest on debt savings of $220 million relative to the Budget forecast while completing $14.0 billion of its $36.0 billion total borrowing requirement for 2019–20, as of August 9, 2019. Approximately 66 per cent of this year’s borrowing has been completed in Canadian dollars, with the remainder issued in U.S. dollars and Australian dollars.
| Item | ($ Billions) |
|---|---|
| Canadian Dollar Issues | 9.2 |
| Foreign Currency Issues | 4.7 |
| Total | 14.0 |
Ministry of Finance
For general inquiries regarding the 2019–20 First Quarter Finances, please call:
Toll-free English and French inquiries:
Teletypewriter (TTY):
© Queen’s Printer for Ontario, 2019
Chart description
Chart: Ontario Real GDP Growth
This bar chart shows the 2019 Budget forecast and private-sector average forecast for Ontario real GDP growth in 2019 and 2020. In the 2019 Budget, the Ministry of Finance projected Ontario’s real GDP to rise by 1.4 per cent in 2019 and 1.6 per cent in 2020. Private-sector forecasters, on average, currently project growth of 1.5 per cent in 2019, down from the 1.8 per cent increase expected at the time of the 2019 Budget, and 1.7 per cent in 2020, unchanged from the time of the Budget.