2019 Energy Consumption and Greenhouse Gas (GHG) Emission Report
Learn about our progress meeting energy conservation targets and reducing greenhouse-gas emissions.
Executive summary
This report explains the progress of the Ontario Government’s commitment to reducing greenhouse gas emissions. It documents greenhouse gas emissions associated with the Ontario Ministry of Government and Consumer Services’ building portfolio, managed by Infrastructure Ontario, Public-Private Partnership facilities, and facilities operated by five Custodial Ministries. Data in this report covers the 2019 calendar year. Since last year’s 2018 (calendar year 2017) greenhouse gas emissions report the Ministry of Government and Consumer Services’ portfolio has seen an increase in its overall emissions, over the 2006 baseline, from 54% to 52%. While enterprise-wide (Ministry of Government and Consumer Services -managed, Public Private Partnership, and Custodial) facilities also saw an increase in emissions moving from 43% to 41%. These increases are primarily attributable the electricity grid emission factor increasing from 17 gCO2e/kwh in 2017 to 20.30 gCO2e/kwh in 2018.
Ministry of Government and Consumer Services reports greenhouse gas emissions annually according to the Ontario Facilities Energy Reporting Directive (2013), and the GHG Protocol Corporate Accounting and Reporting Standard (2015). Because of the nature of government facilities, elements of the GHG protocol were adapted into an internal methodology (see section 9) for applicability to the managed portfolio. In 2015 a verification of Infrastructure Ontario’s carbon accounting practices was performed by a certified International Standards Organization 14065 third party organization to assure that reductions in the managed portfolio were real, while also providing invaluable feedback for improvements, so as to stay on track for future greenhouse gas emissions reductions.
Key drivers for reductions since 2006 have been energy conservation measures taken across government buildings, and the closing of the last coal-fired generators in Ontario in 2014, drastically reducing the electricity emission factor. An analysis of CY2017 data showed that since 2006, energy consumption reductions accounted for 40% of emissions reductions, while a reduced electricity emission factor accounted for 60% of emissions reductions. To continue to move the emissions profile of government facilities downward will require a greater focus on reducing natural gas consumption, through greater thermal efficiencies of building envelopes, and investment in enhanced heating and cooling technologies, as well as operational expertise and innovation.
Introduction
The Ontario Ministry of Government and Consumer Services is responsible for maintaining the safety and sustainability of provincially-owned buildings and structures, which are managed on behalf of Ministry of Government and Consumer Services by Infrastructure Ontario, a crown agency. Buildings contributed 85 megatonnes of carbon dioxide equivalent, 12% of Canada’s greenhouse gas emissions in 2017. While in Ontario buildings contributed 35 megatonnes of carbon dioxide equivalent or 22% of the province’s greenhouse gas emissions in 2017. Reducing energy consumption has been a significant concern in the provincial real estate portfolio for a number of years. In 2003, following the Northeast electricity blackout, the Ministry of Infrastructure enacted a mandate to reduce overall electricity consumption in government-owned and -operated buildings. Moving forward, the Ministry of Government and Consumer Services has given Infrastructure Ontario direction to reduce energy consumption by 2% year-over-year for all fuel types.
This 2019 Energy Consumption and Greenhouse Gas Emission Report provides an Enterprise-wide summary of greenhouse gas emissions from Target Class Facilities over a 2006 baseline for the reporting years 2017 and 2018. Enterprise-wide Target Class Facilities include Ministry of Government and Consumer Services and Infrastructure Ontario managed facilities, Public Private Partnership facilities managed by private-sector service providers, as well as facilities managed by Custodial Ministries including: Ministry of Transportation, Ministry of Natural Resources and Forestry, Ministry of Education, Ministry of Children and Youth Services and Ministry of the Solicitor General. The emissions inventory data for 2017 was finalized in spring 2019 with the release of the confirmed emission factors in Canada’s National Inventory Report (NIR), by Environment and Climate Change Canada. There is a 2 two-year lag in getting confirmed emission factors and thus in finalizing greenhouse gas emissions for government facilities.
Energy reduction programs have reduced emissions through a variety of initiatives including major building retrofits, retro-commissioning and implementation of design guidelines and standards. Managed facilities are heading in the right direction, but only due to continuous efforts in the areas of energy efficiency and conservation. With aging buildings, investment in new technologies and operational expertise will be required to not only reduce, but also maintain current levels of building energy consumption and emissions production.
Reporting requirements
This annual report follows the Ontario Facilities Energy Reporting Directive (2013), herein referred to as the Directive, which mandates that all Custodial Ministries (those with day-to-day operational control of government facilities) produce an annual energy consumption and greenhouse gas emissions report for subsequent public posting on ministry websites. Report content includes, but is not limited to, building-level consumption data across energy types (electricity, natural gas, purchased steam, propane, heating oil, diesel fuels; and if applicable, municipally supplied water), greenhouse gas emissions by building and progress against targets as well as previous reports, and an overview of energy conservation programs and progress. The Green Facilities Procedural Manual (draft 2012) provides a further implementation framework for energy reporting by providing details on matters such as energy consumption metering and monitoring, units of measurement for various utility types, determining energy intensity, updating emissions factors, and report timing, posting and formatting.
Energy consumption reporting is the responsibility of the ministry that has operational control (management of day-to-day operations) of the facility. Ministry of Government and Consumer Services, through Infrastructure Ontario, is responsible for reporting on all facilities where it has full operational control of the facility. Although each ministry is responsible for its own plan, Ministry of Government and Consumer Services has the responsibility to report on all government owned facilities regardless of whether or not they operate within Infrastructure Ontario's control. Ministry buildings that do not fall under the day-to-day operational purview are defined as a Custodial Ministry, while Public Private Partnership facilities which are government-owned, but operated by private service providers represent a third accounting category within this report.
The reporting Directive requires that for Target Class Facilities (explained in section 10.6), ministries produce a five-year conservation strategy that is updated annually and with each annual report offer a summary on progress made. Infrastructure Ontario, under the Directive is responsible for reporting on enterprise-wide — that is, both Custodial Ministry and Ministry of Government and Consumer Services facilities - energy and water consumption.
Following the building energy, greenhouse gas emission and water reporting requirements outlined in the Ontario Facilities Energy Reporting Directive, this report is broken into two key sections:
- The 5-Year Energy Plan reporting on target buildings and initiatives progress for Ministry of Government and Consumer Services buildings
- The Enterprise Wide greenhouse gas emission summary which includes the managed portfolio as well as custodial ministries. Custodial ministries have buildings that are managed by the ministry directly and fall outside of the scope of Ministry of Government and Consumer Services management
Reporting scope
The greenhouse gas emissions reporting period is from January 1st 2018 to December 31st 2018 (inclusive). The Made-In-Ontario Environment Plan (2018) and the Directive call for reporting of emissions associated with government owned facilities. Currently, based on the guidance found in the Ontario Facilities Energy Reporting Directive (2013) and the GHG Protocol Corporate Accounting and Reporting Standard (2004), government reports on scope 1 and 2 emissions for assets it wholly owns (see section 9.1 organizational boundaries).
The report accounts for the following fuel types and emission scopes. Scope 1 emissions can be explained as fuel burned directly on-site (example: the operation of a boiler). Scope 2 emissions can be explained as a delivered fuel type where the energy was generated off-site and delivered to the building (example: electricity generated by a mixture of fuel types and delivered to the building).
Table 1 — Emissions by scope for managed facilities
| Scope 1 | Scope 2 | ||
|---|---|---|---|
| Natural gas | 63.58% | Electricity | 8.12% |
| Fuel oil | 1.12% | District chilled water | 0.44% |
| Propane | 1.19% | District steam | 25.4% |
| Diesel | 0.1% | District hot water | 0.08% |
Exclusions
Within government owned facilities government has identified a subset called Target Class facilities that are the focus of its greenhouse gas emissions accounting (see section 9.1 for a description of Target Class facilities). Target Class facilities make-up the majority of Ministry of Government and Consumer Services building portfolio at roughly 90% of overall gross square footage owned.
The inventory excludes scope 3 greenhouse gas emissions as they are not outlined within the Directive. Leased assets are treated as scope 3 emissions, as the Directive does not apply to facilities leased by government from third party owners. The GHG Protocol states that the building owner retains emission reporting responsibility, if they retain the financial risks and rewards associated with the operation of that facility.
Infrastructure Ontario began receiving data on greenhouse gas emissions associated with backup diesel generation in 2017. However due to current deficiencies and inconsistencies in the data collection process they are being reported separately as they are under the Other Energy and Emissions Data section 4.3 in this report and not accounted for in the overall inventory totals. Infrastructure Ontario continues to develop a data collection process for future monitoring of this emission source for future reports.
The inventory currently does not include Scope 1 fugitive emissions, mainly from the unintentional release of gases from equipment leaks such as refrigerant in refrigeration and air conditioning equipment and carbon dioxide emissions from fire suppressing equipment. Infrastructure Ontario began receiving data on incident reports related to refrigerant systems in 2017, which are being reported as they are under the Other Energy and Emissions Data section 4.3 of this report. Infrastructure Ontario is developing a data collection process for future monitoring of these emission sources.
Ministry of Government and Consumer Services portfolio overview
The Infrastructure Ontario-managed portfolio is spread throughout the province and includes approximately 43 million square feet of buildings and structures, including approximately 29.5 million square feet of owned facilities, 10 million square feet which are leased from third parties, and 3.7 million square feet that are Public-Private Partnership facilities. This report includes emissions data for 401 managed facilities representing approximately 18 million square feet. These are designated as Target Class Facilities and are buildings where Ministry of Government and Consumer Services has a level of control that allows energy conservation measures to be implemented. Graph 1 provides an overview of the reported portfolio.
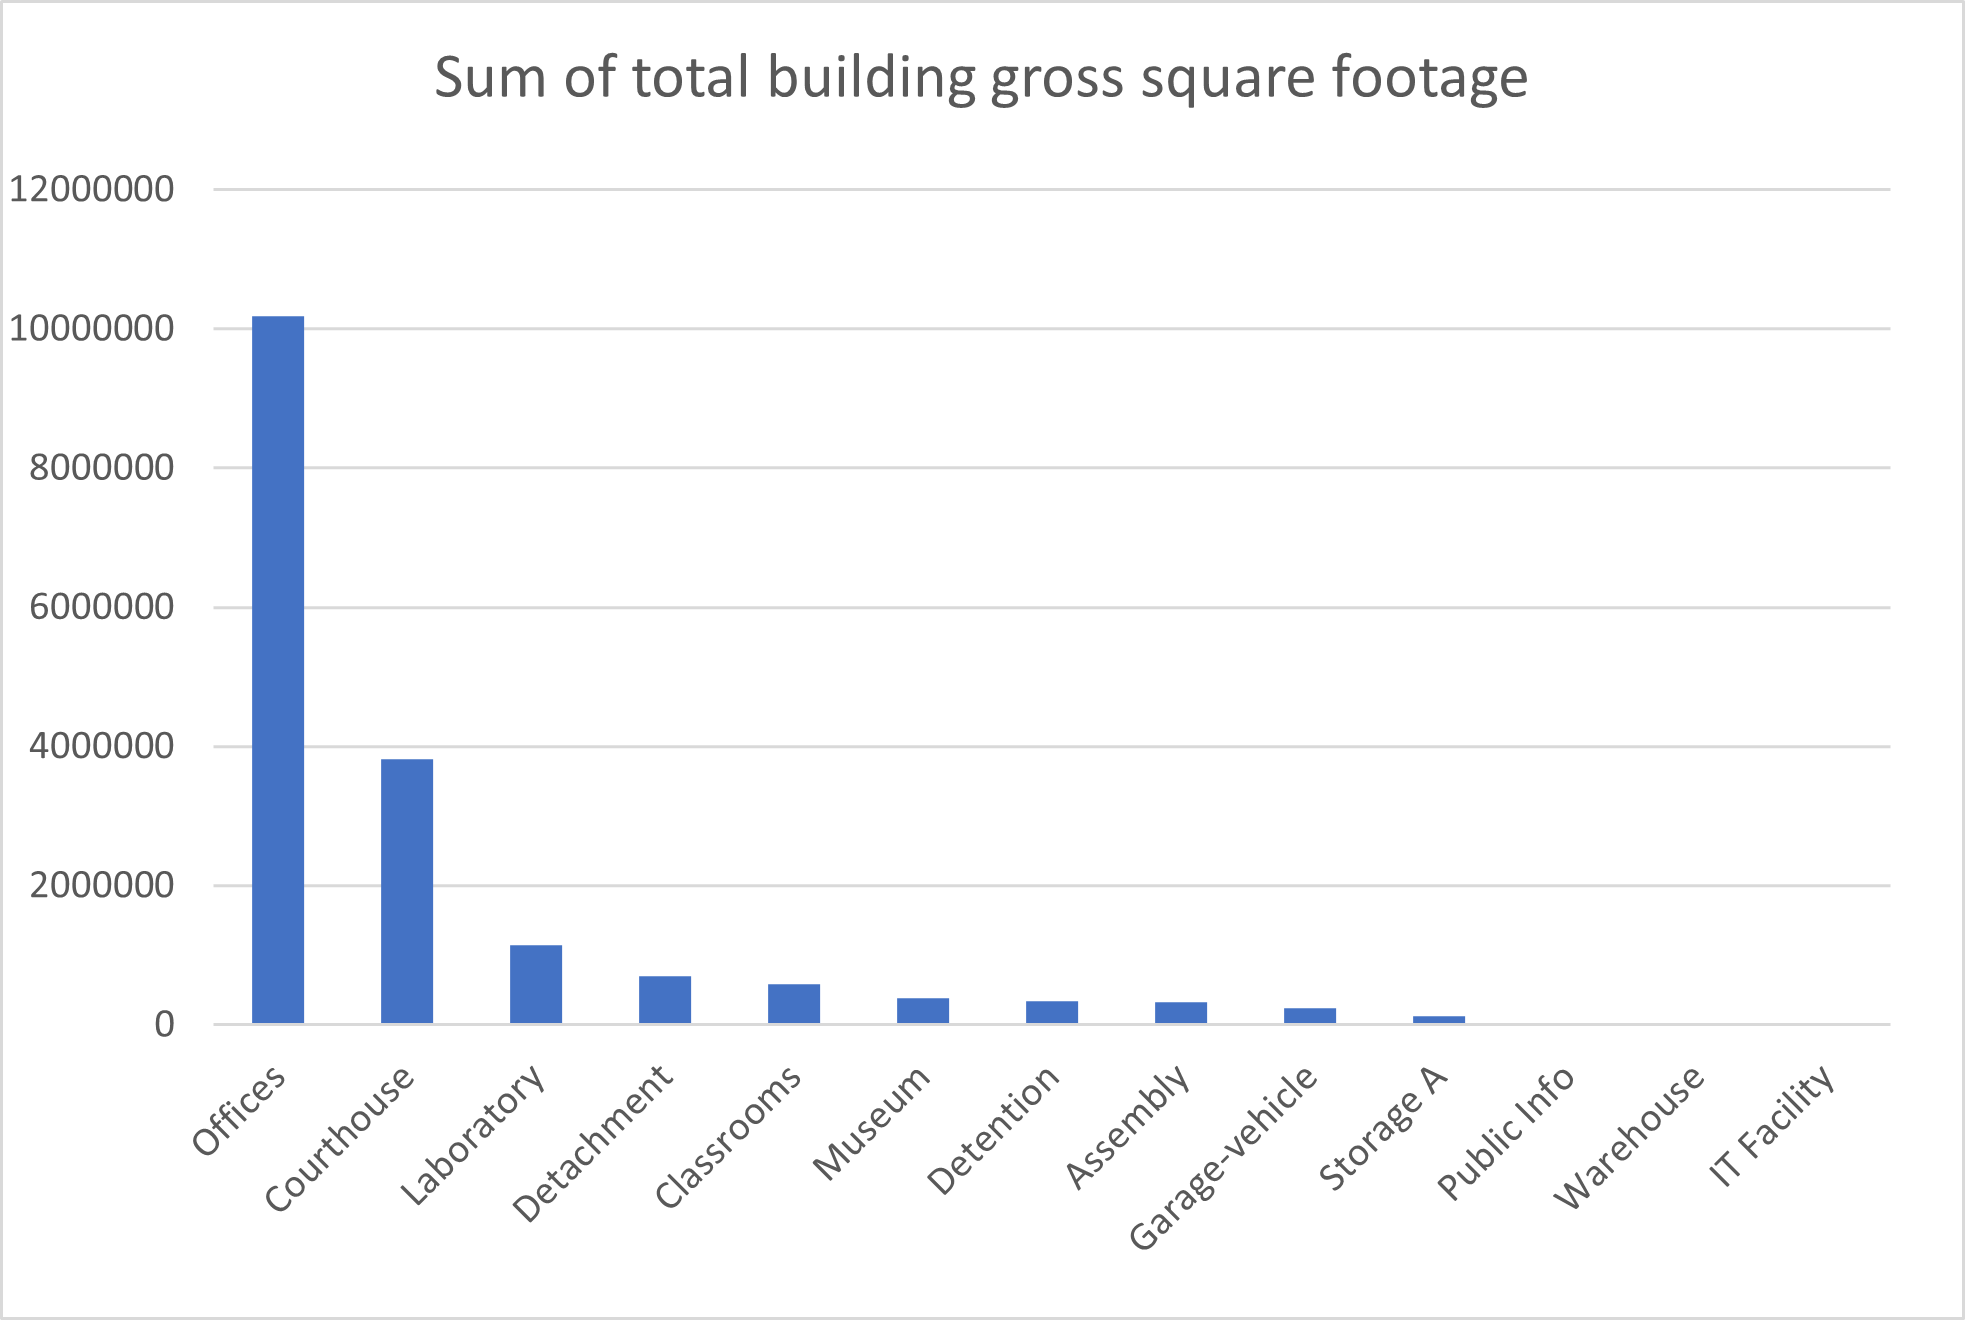
Graph 1 — Gross square feet from the managed portfolio for 2018
Of the owned assets in the managed portfolio 66% were built between 1950 and 1980 (Source: 2018 General Real Estate Portfolio Inventory). These assets require significant capital investment in order to adequately maintain operations. In addition, these assets are more likely to be high energy users, with aging structures and equipment, employing outdated materials, methods and technologies. Many of older buildings are important for heritage and cultural reasons, adding additional layers of complexity to their management.
Energy performance
Energy consumption within the managed portfolio has continued to decrease steadily, due to the impacts of ongoing building energy reduction programs and initiatives, as outlined in section 5 of this report. Since 2006 electricity use has decreased by 88 million equivalent kilowatt hours, or 28%. Year-over-year electricity performance went from a 4.5% reduction in 2017 over 2016, to 4.2% increase in 2018 over 2017. The Independ Electricity System Operator noted in 2017 that energy efficiency is Ontario’s most cost-effective energy resource at 1.69 cents per kWh. Reductions in building energy consumption are attributable to multiple factors, including capital repair projects with energy impacts, heating and cooling demand variances due to seasonal weather patterns, and changes in building occupancy or use. The year-over-year increase in electricity consumption between 2018 and 2017 is attributable to the hot summer weather experienced in 2018 compared to a milder summer experienced in 2017. Hotter weather means more demand at the facility level for air conditioning, which is powered by electricity. Reducing the run-times of heating, ventilation, and air conditioning (HVAC) equipment is an ongoing source of operational energy savings.
While lighting offers cost-effective energy savings to be captured at end-of-life replacement. IO’s capital repair program and project teams conduct dozens of lighting projects annually within IO-managed facilities. Ongoing LED replacements have achieved notable savings in recent years. The Independent Electricity System Operator’s data (2016) shows that lighting at 36% is the single largest consumer of electricity among commercial building systems.
2018 brought hotter than average summer temperatures and cooler than average winter temperatures across the province; the Toronto area experienced a 7% increase in heating degree days and a 49% increase in cooling degree days compared to 2017. As reporting data is not weather normalized, increased cooling degree days experienced in 2018, as compared to 2017, contributed to greater year-over-year electricity consumption. Peak demand data from the Independ Electricity System Operator show Toronto accounted for 4559.5 MW of Ontario’s peak summer electricity demand of 23,240 MW in 2018.
| 2006 | 2017 | 2018 | 2006 vs. 2017 percent | 2006 vs. 2017 percent | 2017 vs. 2018 percent | |
|---|---|---|---|---|---|---|
| Electricity | 311,664,899 | 214,571,618 | 223,559,212 | (31.15%) | (28.27%) | 4.19% |
| Natural gas | 214,457,387 | 205,779,343 | 197,283,215 | (4.05%) | (8.01%) | (4.13%) |
| Fuel oil | 3,184,901 | 2,305,423 | 2,445,764 | (27.61%) | (23.21%) | 6.09% |
| District chilled water | 0 | 1,658,995 | 2,068,109 | N/A | N/A | 24.66% |
| Propane | 3,061,507 | 2,867,985 | 3,184,833 | (6.32%) | 4.03% | 11.05% |
| District steam | 92,054,844 | 65,659,352 | 77,103,461 | (28.67%) | (16.24%) | 17.43% |
| District hot water | 0 | 221,908 | 190,831 | N/A | N/A | (14%) |
| Total | 624,423,538 | 493,064,624 | 505,835,426 | (21.04%) | (18.99%) | 2.59% |
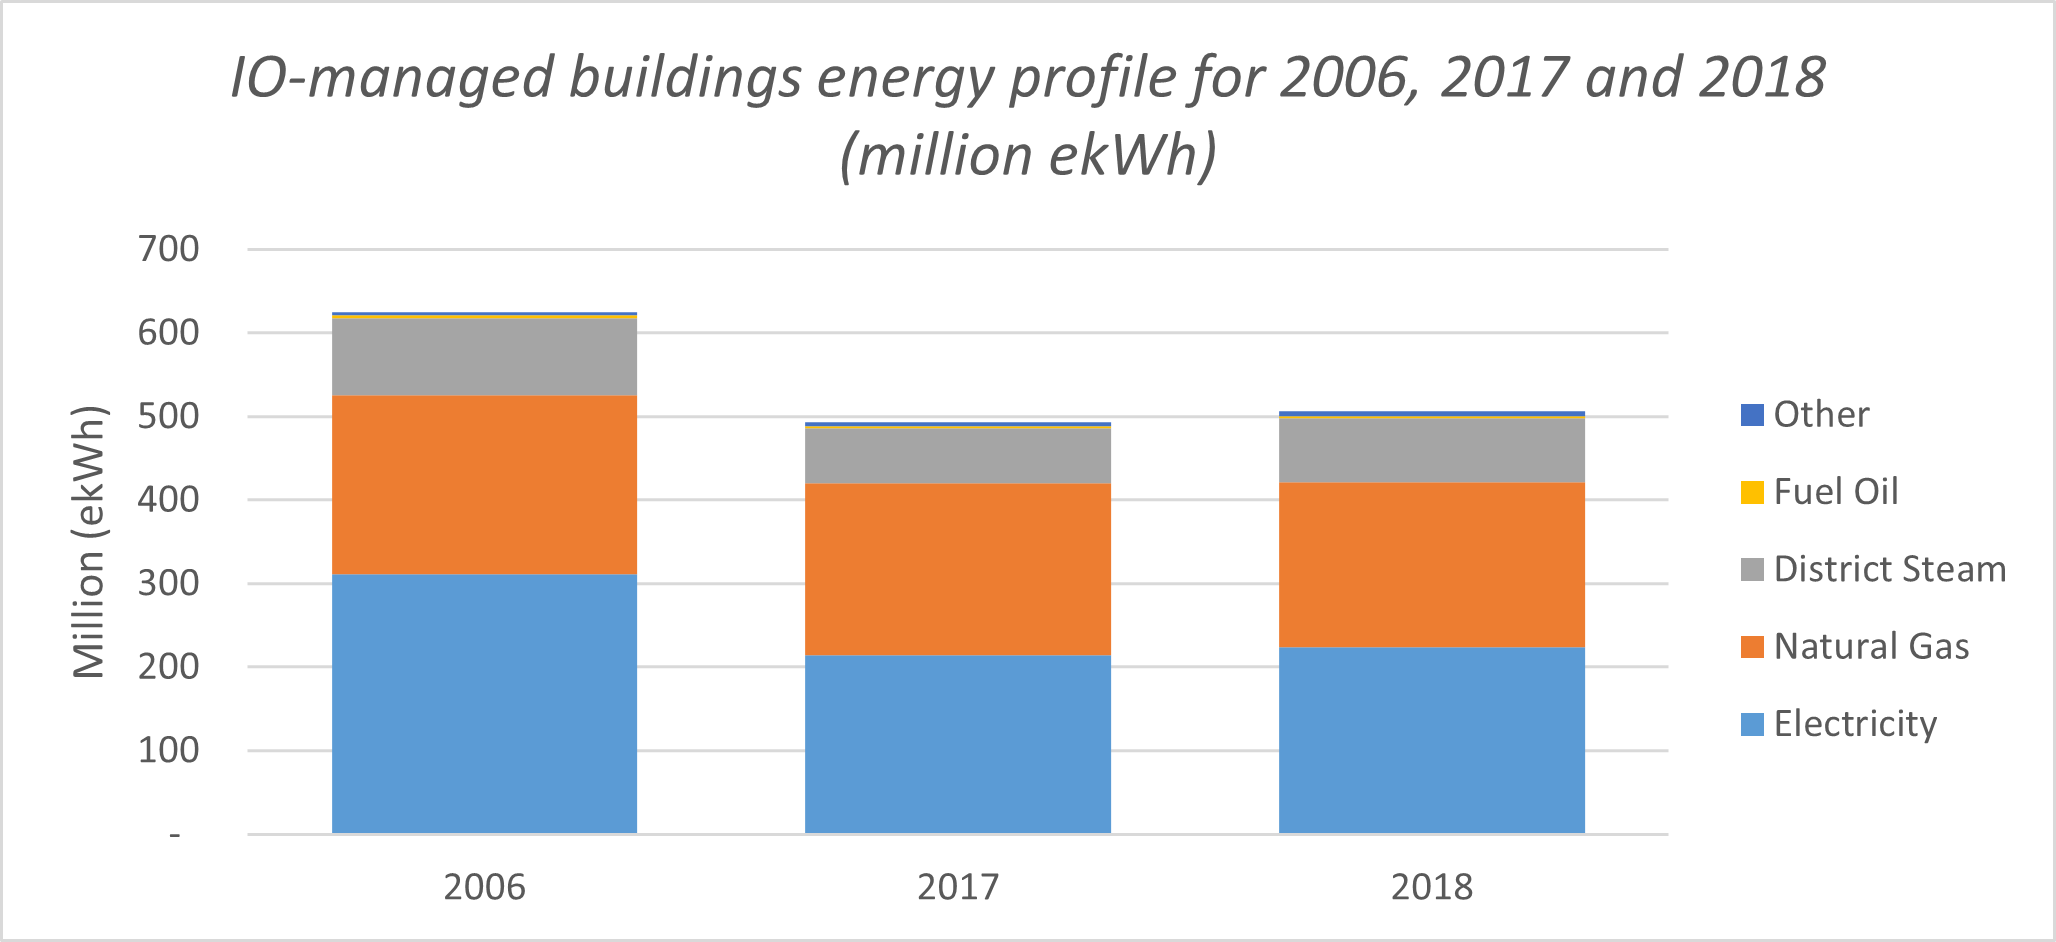
Graph 2 — Managed buildings energy profile from 2006, 2017 and 2018 (million equivalent kilowatt hours)
Emissions performance
The Ministry of Government and Consumer Services owned real estate portfolio, managed by Infrastructure Ontario, makes up the majority of the targeted provincial government greenhouse gas emissions, and as such, assumes a significant responsibility in achieving emissions reductions. For calendar year 2018, there was a 52% reduction in emissions compared to the base year in 2006. Similar to calendar year 2017 a large portion of year-over-year emissions reductions are attributable to changes in energy consumption patterns at a few large sites. The remainder of year-over-year emissions reductions are being attributed to building demolitions, vacancy due to disposal, and other changes in occupancy or use.
Fossil fuels (district steam, natural gas, fuel oil and propane) are the main heating sources for the portfolio and fluctuate heavily depending on winter weather severity. This dependency on fossil fuels for heating has not declined since the 2006 base year (see graph 3). This makes the managed portfolio particularly vulnerable to sharp greenhouse gas emission increases depending on the severity of winter weather.
Due to the electricity emission factor going down by 86%, while the natural gas emission factor has remained the same, the relative drivers of the managed portfolio’s emissions have changed considerably since 2006. When comparing calendar year 2018 with the base year in 2006, emissions attributed to electricity use in the managed portfolio have gone from 51% to 8%, while emissions contributed from the use of natural gas have gone from 33% to 64%.
A 4% decrease in natural gas consumption in 2018 over 2017 is not consistent with the cooler weather experienced and resulting increase in demand for heating. Analysis of portfolio energy data shows that this decrease in year-over-year natural gas consumption can be partially attributed to a few large facilities changing their operational or occupancy patterns. For instance three facilities that are collectively over 1 million sq. ft decreased use of their cogeneration plants that produce electricity from natural gas, one because the plant was out of service and the other two because they were participating in the Industrial Conservation Initiative offered by Ontario’s Independent Electricity System Operator (see section 5.10). While other large facilities transitioned from occupied to vacant in preparation for disposal.
Otherwise greenhouse gas emission associated with natural gas consumption have remained relatively static for IO-managed buildings with an 8% reduction in emissions since the 2006 base year, compared to a 92% emissions reduction electricity and 23% reduction in fuel oil consumption Static natural gas consumption can be attributed to the Ministry of Government and Consumer Services building portfolio existing in a northern climate where heating degree days far outweigh cooling degree days (by 10 times to 30 times depending on region), to boilers having reached combustion efficiencies of 85–95% already by the end of the 1900s, and to fewer cost-effective like-replacements being available for heating technologies. However options for lower emissions heating are improving. For instance, a government study on low-grade heating technologies has found that pathways to reducing building emissions include: improvements to the building code; high performance envelope retrofits; installation of ground, air and water-sourced heat pumps; and greater use of renewable natural gas, solid biomass, liquid biofuels and hydrogen.
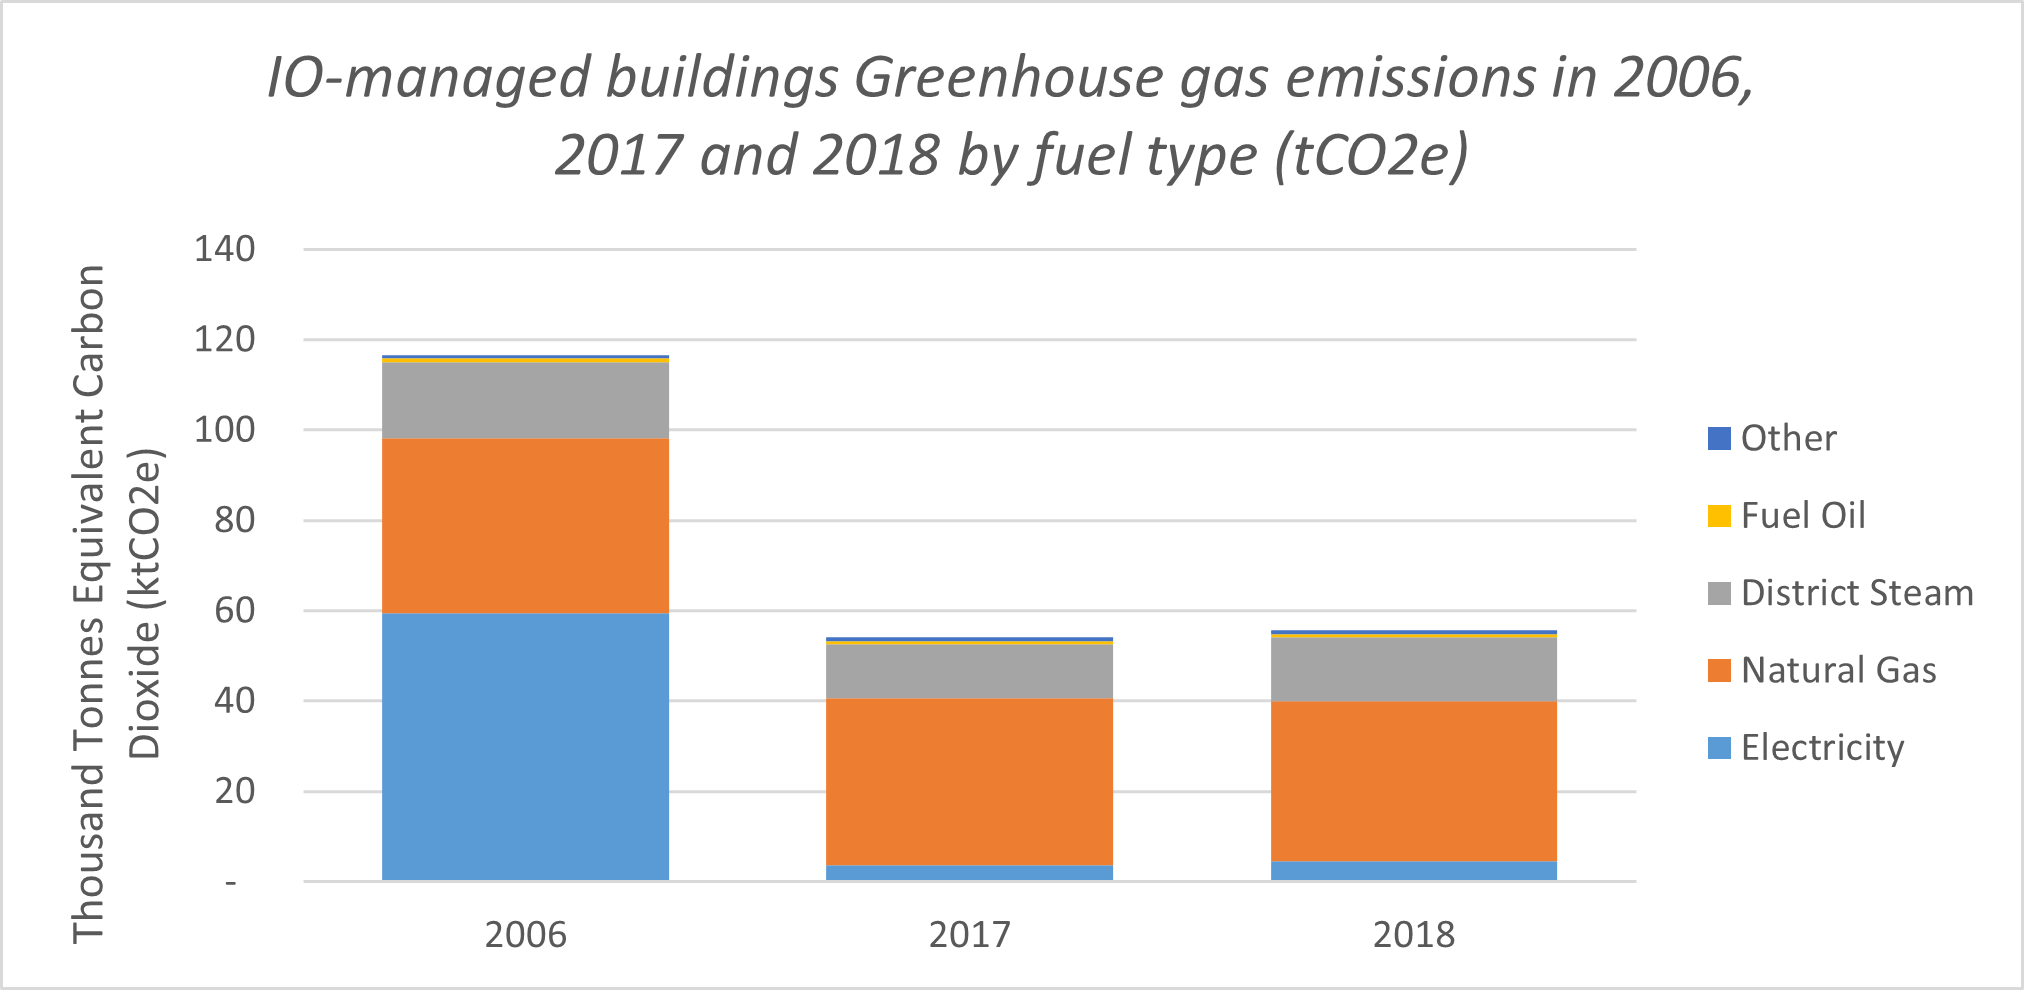
Graph 3 — Managed buildings Greenhouse gas emissions in 2006, 2017 and 2018 by fuel type
| 2006 | 2017 | 2018 | 2006 vs. 2017 percent | 2006 vs. 2017 percent | 2017 vs. 2018 percent | |
|---|---|---|---|---|---|---|
| Electricity | 59,572 | 3,648 | 4,538 | (93.88%) | (92.38%) | 24.41% |
| Natural gas | 38,610 | 37,047 | 35,518 | (4.05%) | (8.01%) | (4.13%) |
| Fuel oil | 813 | 588 | 624 | (27.61%) | (23.21%) | 6.09% |
| District chilled water | 0 | 179 | 245 | N/A | N/A | 36.84% |
| Propane | 641 | 601 | 667 | (6.32%) | 4.03% | 11.05% |
| District steam | 16,943 | 11,994 | 14,191 | (29.21%) | (16.24%) | 18.31% |
| District hot water | 0 | 50 | 43 | N/A | N/A | (14%) |
| Total | 116,578 | 54,107 | 55,826 | (53.59%) | (52.11%) | 3.18% |
Other energy and emissions data
Infrastructure Ontario has in recent years been seeking to capture the energy and emissions data associated with diesel backup generators, refrigerants from cooling systems, and its renewable power generation systems. In calendar year 2017 we received our first datasets on these topics. As data quality remains variable for these datasets, they will be reported on but not included in overall emissions and energy tracking. Thus they remain noted in the report’s exclusion section.
Diesel — 14 sites were reported as consuming 13,757 litres of diesel fuel contributing 39 tonnes of carbon dioxide equivalent to calendar year 2018 emissions
Refrigerants — 2 incidents were tracked, which released 619 pounds of refrigerants contributing 1.08 tonnes of carbon dioxide equivalent to calendar year 2018 emissions
Solar Photo-Voltaic — 7 solar installations generated 131758 ekWh of power avoiding
Water performance
In Ontario ministries responsible for government owned facilities are mandated to report on water use associated with those facilities. Principles are also outlines around the efficient use of water in technologies, services, and practices, and in the planning and designing of government-owned facilities.
As of CY2018 over the 2006 base year, water use intensity at IO-managed facilities has gone down by 30%, as can be seen in Table 4. The overall downward trend in water consumption since baseline in 2006 is in part attributable to Infrastructure Ontario’s Energy Programs and Initiatives (see section 5), which work to support water conservation within the managed portfolio. For instance, the Design Guidelines call for the use of low-flow water fixtures. The Smart Building Program uses building automation to measure, monitor, and control energy and water consumption at the site level. The Building Optimization Process identifies measures within buildings to reduce energy and water consumption, while Measurement and Verification can track the results of reduction measures taken to identify those that are most energy and cost effective.
Water rates are increasing across the province as municipalities upgrade their water servicing infrastructure: Toronto has seen an increase of over 8% (2016), 5% (2017); Sudbury 9% (2016); North Bay 50% (2016), and thus operational costs related to water are increasing.
Currently water represents a significant utility cost within the portfolio, roughly equivalent to natural gas. Available data shows water consumption is highest in the South and Central Regions of the Portfolio, and annually peaks in the summer months by as much as 40%. This indicates that the majority of water consumption is going towards cooling. In order to reduce operational costs, sources of high water and cost intensity within the portfolio need to be identified and mitigated. Currently across Ontario municipalities there are a variety of billing methods and fee allocations being used to charge for water and water related services. This variability makes it more difficult to track water usage and plan for cost-effective water conservation actions when managing a portfolio of buildings across different jurisdictions.
In 2018, through its service provider CB Richard Ellis, Infrastructure Ontario launched the IO Water Portfolio Report. This is an internal water benchmarking report that allows us to better understand consumption patterns across the portfolio, which can in turn inform more targeted water reduction measures, and the development of a water reduction program.
Table 4 — Managed building water consumption per gross square feet from 2006, 2017 and 2018 (100 cubic meter per gross square foot)
| Building type | Percentage of total water consumption in 2018 | 2006 | 2017 | 2018 | Baseline reductions 2006 vs. 2018 | Year over year reduction 2017 vs. 2018 |
|---|---|---|---|---|---|---|
| Offices | 48.6% | 8.3 | 5.3 | 5.3 | 36% | 0% |
| Laboratory | 17.06% | 15.8 | 17.8 | 17.2 | (9%) | 4% |
| Courthouse | 15.64% | 6.1 | 4 | 4.5 | 27% | (10%) |
| Classrooms | 6.17% | 10.6 | 11 | 11.6 | (10%) | (5%) |
| Detachments | 5.75% | 15.2 | 10.7 | 10.4 | 32% | 4% |
| Assembly | 3.92% | 19 | 12 | 13 | 31% | (8%) |
| Detention | 0.97% | 5.4 | 4.3 | 3.1 | 42% | 27% |
| Garage | 0.77% | 8.2 | 5.7 | 5.5 | 32% | 3% |
| Public info | 0.49% | 87.7 | 23.6 | 19.2 | 78% | 19% |
| Museum | 0.32% | 14.9 | 1 | 0.9 | 94% | 13% |
| Storage | 0.3% | 0.8 | 2 | 3.1 | (279%) | (52%) |
| Warehouse | 0.01% | 0 | 7.6 | 2.3 | N/A | 69% |
| IT facility | 0.01% | 0 | 3.1 | 3.2 | N/A | (4%) |
| Grand total | 100% | 9 | 6.2 | 6.2 | 30% | (1%) |
Ministry of Government and Consumer Services energy programs and initiatives
The Infrastructure Ontario Energy Team is responsible for building energy management deliverables, and has developed a comprehensive strategy, programs and initiatives that link together to form a high performing integrated energy management approach. The programs and initiatives outlined in this section can operate as both singular and integrated entities. Together, they work together to achieve the greater goal of energy conservation, building related greenhouse gas reductions, and utility cost avoidance.
Chart 1 outlines how this process works and shows how each of the components support one another.

Chart 1 — Energy strategy workflow
Benchmarking
Measuring performance is an important foundation to any organization’s energy strategy. Quantifying energy use then comparing it to past performance and peer industries helps establish the framework for decisions to guide Infrastructure Ontario’s energy programs.
Internal benchmarking
Infrastructure Ontario, in collaboration with their service provider CB Richard Ellis, has developed an extensive internal benchmarking program. A data visualization interface compares and maps building groups based on their energy performance and building type. The program was developed in-house and draws on the expertise of both the Infrastructure Ontario and CB Richard Ellis analytics teams. The benchmarking program is tracks building energy performance, normalizes energy use to account for impacts from weather, helps identify anomalies, and prioritizes those that need further improvement. Consumption data is updated quarterly and used by CB Richard Ellis’ staff, particularly Regional Energy Managers for ongoing building specific engagement with regional Asset Management teams. The benchmarking results are brought forward to CB Richard Ellis facility managers as part of the Regional Engagement Strategy (section 5.3) as further investigation and technical review is assigned. Investigations often result in energy saving operational changes or proposals for capital project upgrades.
External benchmarking
Due to the unique asset types and operations in the Provincial real estate portfolio, such as detention centres and courthouses currently Infrastructure Ontario’s internal benchmarking program is used as a primary benchmarking resource. However benchmarking reports from Energy Star Portfolio Manager, BOMA and REALPAC are also used as a secondary perspective (primarily for office buildings) that provides additional support in prioritizing candidates for Infrastructure Ontario's Building Optimization process. Also as one of the largest building portfolios in Canada, anonymized data from the managed portfolio is from time to time upon request shared with third parties as a building energy benchmarking reference to support best practice in the field.
Building Optimization Process
The Building Optimization Process documents the process developed to help Infrastructure Ontario improve energy and water performance for buildings owned and managed by the Ontario Government. This helps service providers and the Infrastructure Ontario Technical Services team identify improvement measures and projects. Working together, this process improves the performance of the buildings, and continues Infrastructure Ontario's recognized leadership in high-performance building operations. This process applies to all managed buildings and covers all building sizes and types. Buildings are selected through a site-by-site review process analyzing energy, project, client satisfaction and occupancy data among many other factors. A list of scheduled buildings for Building Optimization Process implementation are selected and presented to Infrastructure Ontario on an annual basis. Starting 2017 and 2018 fiscal year, a dedicated a Key Performance Indicator for tracking the progress of the BOP program was implemented, locations selected will be audited throughout the year and results will be reviewed for final approval. The Key Performance Indicator will track the energy audits and go beyond to review and approve the recommendations implemented out of the reviews.
Regional engagement strategy
Engagement of regional facilities staff is crucial to understanding what is actually happening at the building level. Longstanding quarterly meetings have been held for the purpose of discussing policy and long-term strategy, between regional facility managers, service providers, and the Infrastructure Ontario Energy Team. Additionally, monthly meetings are held between energy managers and building operators to discuss equipment and operational savings. By including staff who are working in the buildings, it opens up the opportunity to discuss what is actually happening inside each facility. Facilities staff are encouraged to have their voices heard and are given the opportunity to put forth ideas on best energy management practices for their buildings. Through these discussions program opportunities such as the Building Optimization Process are identified, which result in operational or capital building improvements.
Capital projects
Capital projects are run through the capital repair program. This program develops projects to ensure health and safety, code compliance and imminent equipment breakdown are addressed. Historically energy projects were run through a separate funding stream which ran in parallel with the capital repair program. Due to funding restraints in 2014 and 2015, energy-specific funding was put on hold. Every capital repair program project is an opportunity to improve the performance of managed portfolio, applying the Design and Commissioning Guidelines to all projects captures these opportunities and participates in the enhancement of managed portfolio. Starting 2017 and 2018 fiscal year, Infrastructure Ontario applied more precise technical reviews for all technical capital repair program projects in order to ensure all projects follow the standardized guidelines. The Infrastructure Ontario and CB Richard Ellis Technical Services team review all design phases of the projects, participate in reviewing equipment submittals and support the substantial completion along with reviewing the change orders.
Smart Building Program
The Smart Green Portfolio Strategy is a high performance building management and analytics program. The program utilizes advanced automation and integration to measure, monitor, and control operations and maintenance at the lowest cost and environmental impact during day-to-day building operations. The program involves integrating relevant building systems to improve client satisfaction, equipment performance and lifetime and to reduce energy consumption in a facility. Smart Building Program includes the infrastructure required for centralized remote monitoring and controlling of building systems. The combination of upgrade, integrated automation with centralized monitoring allows for all relevant building system information to be available to a team of supervisors for:
- alarm and event management
- troubleshooting, dispatch for service or repair
- historical record keeping
- utility metering including sub-metering.
Design guidelines
The purpose of Infrastructure Ontario Building Systems Design Guidelines is to standardize design and construction objectives and technical requirements across the full portfolio of managed buildings to ensure higher performing building systems are designed and constructed in accordance with the Smart Green Portfolio strategy. Project Managers and service providers use the guideline to ensure consistency and unity of managed sites and to integrate all relevant guidelines and systems, in order to achieve increased occupant comfort and satisfaction, improved operational performance, improved energy efficiency, and the provision of technologies and tools to efficiently monitor, control and manage building systems. The guidelines include all lessons learned from previous Building System Upgrades in Infrastructure Ontario. The guidelines are updated every two years, new version of the guidelines was released in May 2017.
Commissioning guideline
The intent of the Commissioning guideline is to ensure:
- building equipment performs as specified and originally intended as per the Design Guidelines
- installation of equipment meets contract specifications
- the commissioning of building systems/equipment and sequence of operations have been verified to on-site conditions
- the total performance/integration of new equipment/systems are fully commissioned.
A new version of the Commissioning Guideline was released in 2017 with process enhancements to better suit the portfolio of projects.
Measurement and Verification
Measurement and Verification plays a key role in quantifying savings from energy conservation projects. In the 2016 and 2017 fiscal year, Infrastructure Ontario performed measurement and verification on a variety of projects and undertook a refocusing and revision of the program. The program has become more refined and has been integrated into the Design Guidelines as a requirement. Infrastructure Ontario has also leveraged support from Toronto Hydro to have specific project carried out for managed buildings throughout the Greater Toronto Area. Results from the measurement and verification program are used to help better inform operational decisions and future capital projects.
Asset management planning tool
Infrastructure Ontario has developed a data processing tool which integrates property and project data from the capital planning software with energy data on building systems and components. The tool is able to generate values for energy and emission reductions, avoided utility costs, and year-over-year life-cycle costs associated with different building system replacements. This information can then be used to facilitate the planning and prioritization of capital repair projects to achieve greater costs benefits. In the event dedicated energy funding is provided to Capital Planning, this tool can effectively identify the best return on investment projects for reducing utility costs or greenhouse gas emissions.
Class A initiative
In July 2017, Infrastructure Ontario opted 16 facilities into the Industrial Conservation Initiative offered by Ontario’s Independent Electricity System Operator. This program allows customers with a peak electricity demand greater than 1 megawatt but less than or equal to 5 megawatt to pay the global adjustment portion of their electricity bill based on their percentage contribution to the top five peak Ontario demand hours over a 12-month period. Customers participating in this initiative are referred to as Class A. Infrastructure Ontario’s Class A facilities in this program will curtail their electricity consumption during a period of peak demand for Ontario and thereby assist in balancing the grid’s supply and demand for electricity. These curtailment activities provide an awareness of energy consumption and scheduling that can have trickle impacts on overall energy consumption reduction.
Challenges, risks and opportunities
Energy program funding
Infrastructure Ontario continues to maximize operational opportunities and utilize alternate funding sources to ensure continued energy cost control in the absence of dedicated energy program funding.
Aside from energy project funds received through energy utility programs, and Ontario cap and trade revenues, the energy management program operates in a no-funding scenario by leveraging partnerships. The Infrastructure Ontario Energy team in Asset Management works to reduce energy consumption and utility costs by working with Capital Planning and other departments to optimize energy impacting designs and equipment on capital repair projects and by implementing operational efficiency measures. Within Asset Management the Infrastructure Ontario Energy team works to stabilize and maintain past successes, so as not to let a lack of funding erode past achievements. Because as discussed in section 4.2, keeping building systems in a good state of repair is key to preventing spikes in energy consumption. Although some alternate funding streams exist for energy system upgrades, this funding is restrictive. Thus Infrastructure Ontario continues to work to mitigate energy related risks with the funding and tools available.
Electricity generation mix
In CY2018, nuclear electricity generation supplied 61% of Ontario’s electricity demand with the remainder made up of large-scale hydro (25%) and gas/oil (6%), wind (7%) and biofuel and solar (<1%) (Ontario’s Independent Electricity System Operator, 2019). Nuclear, along with hydro, generation are essentially emissions neutral electricity sources, whereas natural gas has associated emissions due to burning of fuel. From an emissions perspective the province is benefitting from the phase out of coal in its greenhouse gas reduction performance.
Ontario began the 10-year process of refurbishing the Darlington Nuclear Generating Station in October 2016, which supplies approximately 20% of the province’s electricity. When more power on the grid is needed or when nuclear plants are out of service, natural gas-fired generation stands by to be used as a swing resource, this leads to a more greenhouse gas intensive or “dirty” electricity grid. To keep the grid “clean,” energy conservation programs, use of renewable energy sources, as well as the option of purchasing cleaner hydro-electric power through agreements with neighbouring provinces Quebec and Manitoba, can help to offset gas-fired power in Ontario. Thus the greenhouse gas intensity of future Ontario electricity grid emission factors will depend on how the Province chooses to manage its electricity generation mix.
New buildings
Ontario’s infrastructure is constantly being renewed and as new facilities are being built they are added to the province’s greenhouse gas emissions accounting. As per the Greenhouse Gas Protocol, base year emissions are not recalculated for new facilities that did not exist in the base year. Thus each of these new builds is accounted for with a value of zero in the base year and their energy and emissions are reported annually following their date of construction. For example, a courthouse built in 2012 would not show any savings as the 2006 baseline would be zero. So although new builds are built to the highest Leadership in Energy and Environmental Design standards and utilize the most modern energy management practices, the greenhouse gas reduction target is negatively impacted as each new build is net new added energy and emissions. New buildings are listed in this report as Public Private Partnership.
Enterprise wide summary
Enterprise-wide greenhouse gas emissions for calendar year 2018 were 41% reduced compared to the 2006 base year emissions, while year-over-year emissions from 2017 to 2018 increased by 5%. All reporting ministries, except for the Ministry of Education, increased slightly in their total annual energy consumption, meaning this 5% increase in emission is not solely due to an increase in the carbon intensity of the emission factor in 2018. The preliminary estimated electricity emission factor for 2018 is 20.3 grams of carbon dioxide equivalent per kilowatt hour.
The 2017 electricity emission factor released in the National Inventory Report by the Federal Government was finalized at 17 grams of carbon dioxide equivalent per kilowatt hour, rather than 27.3 grams of carbon dioxide equivalent per kilowatt hour as was first estimated for calendar year 2017 and published in this report in 2018. Thus we have seen enterprise wide greenhouse gas emissions for calendar year 2017 go from a 41% reduction based on a preliminary 2016 emission factor of 27.3 grams of carbon dioxide equivalent per kilowatt hour to a 43% reduction based on the final NIR emission factor of 17 grams of carbon dioxide equivalent per kilowatt hour.
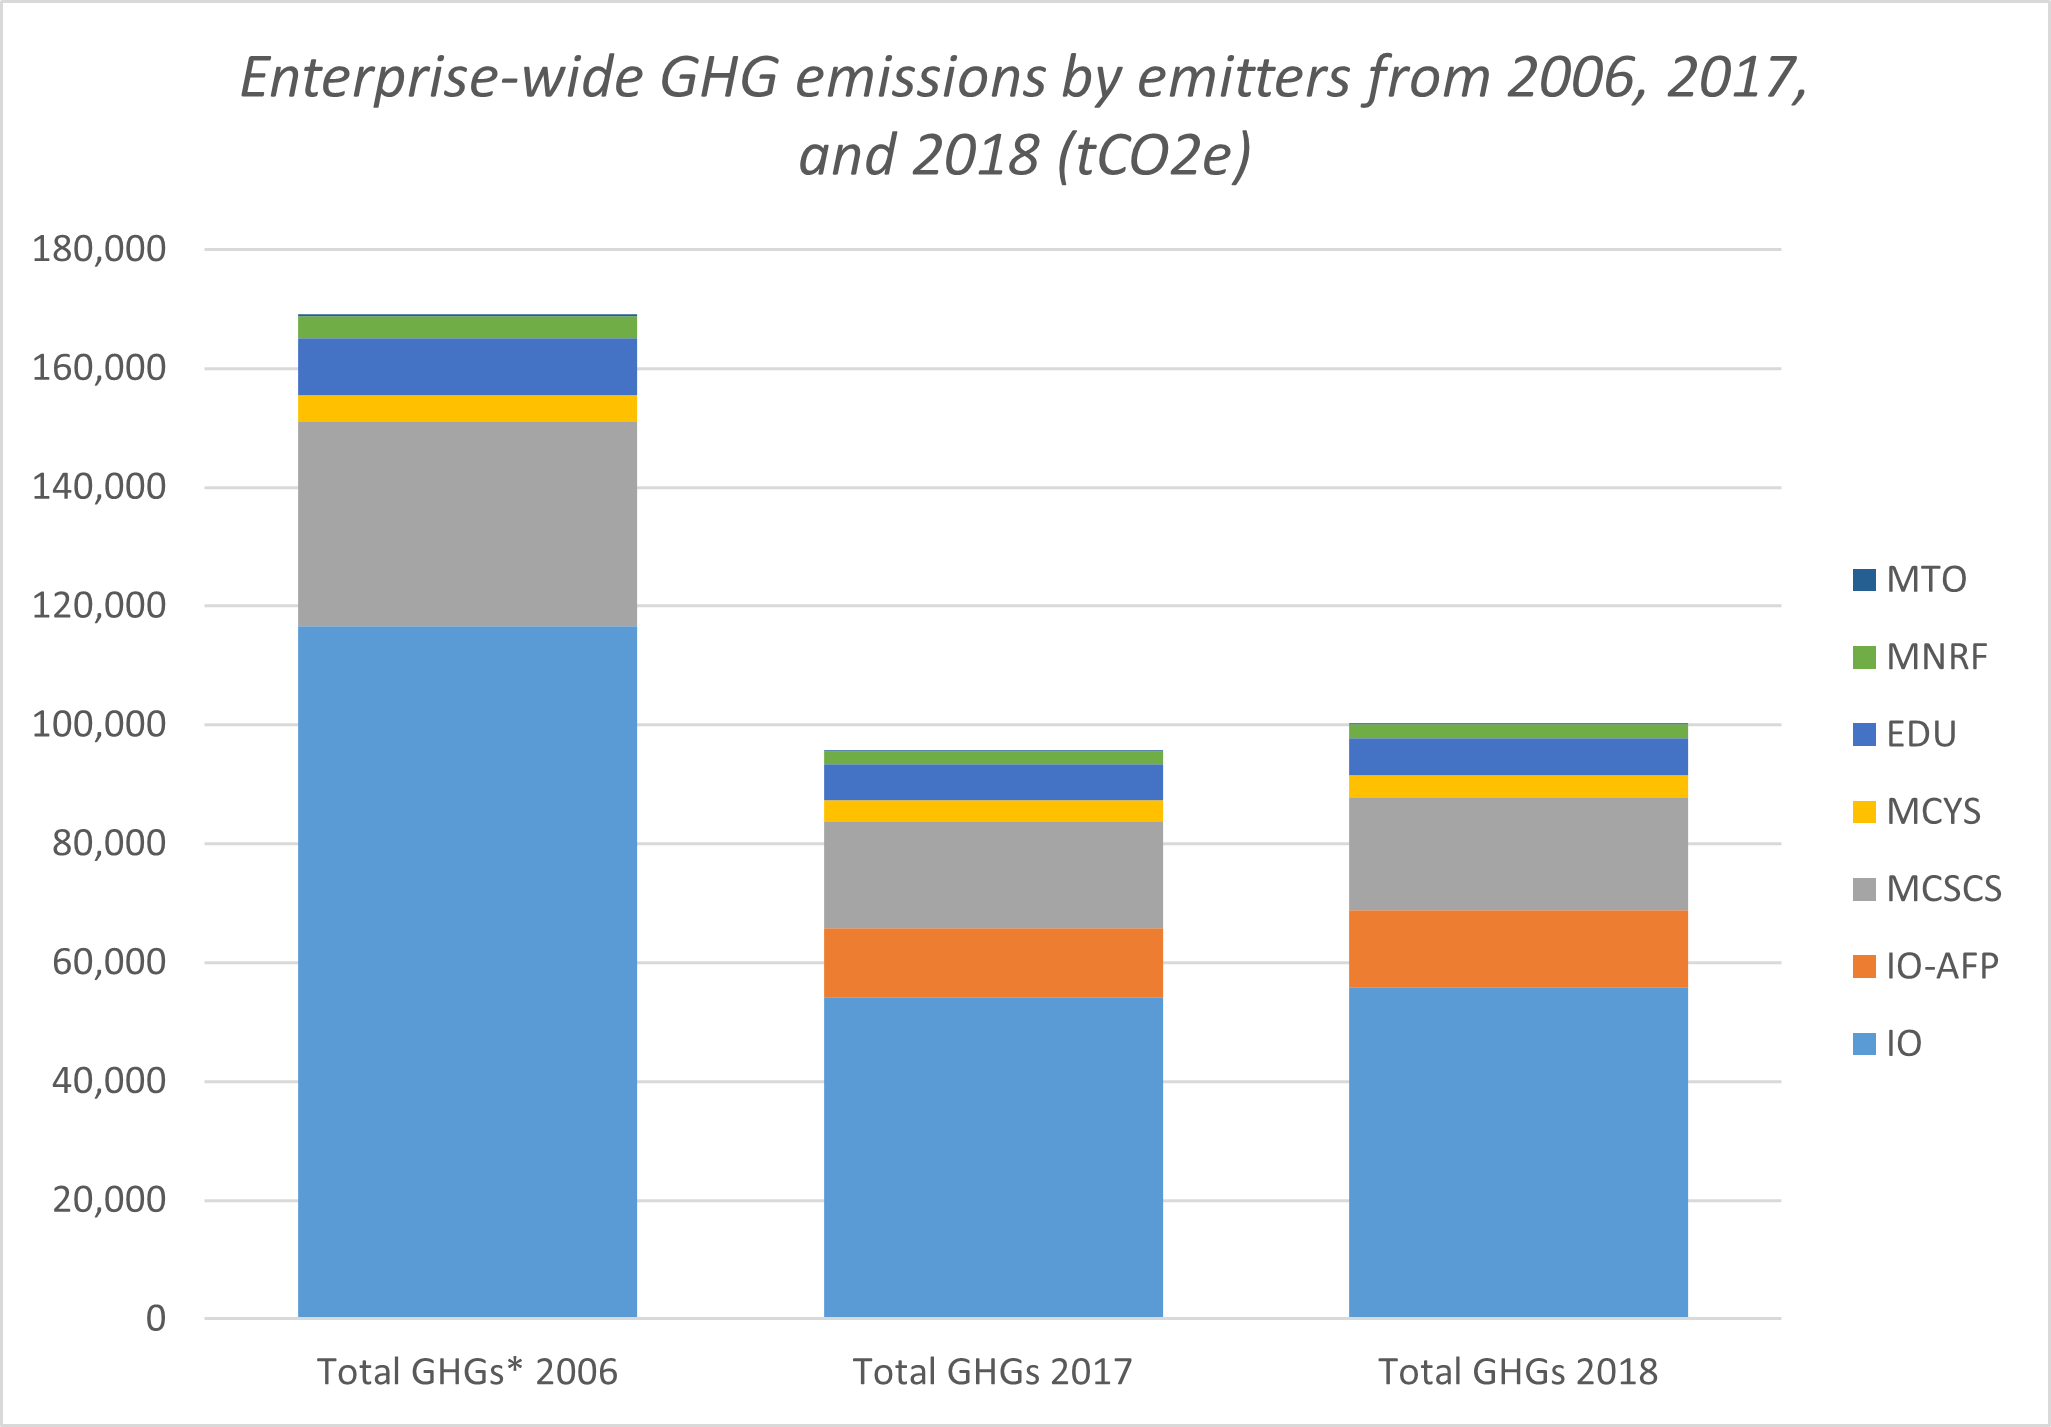
Graph 4 — Enterprise-wide greenhouse gas emissions by emitters from 2006, 2017 and 2018 (tonnes of equivalent carbon dioxide)
Scope 1 emissions from direct fossil fuel combustion is the most significant source of Greenhouse gases enterprise-wide. These are emissions due to heating needs, mainly from the combustion of natural gas, fuel oil and propane. Scope 2 emissions are from the purchase of energy generated offsite, mainly from: electricity and district energy sources (steam, hot water and chilled water).
| Total greenhouse gases | Total greenhouse gases 2017 | Total greenhouse gases 2018 | 2006 to 2017 Greenhouse gases reductions percent | 2006 to 2018 Greenhouse gases reductions percent | 2017 to 2018 Greenhouse gases reductions percent | |
|---|---|---|---|---|---|---|
| IO | 116,578 | 54,107 | 55,826 | 54% | 52% | (3%) |
| IO-AFP | 0 | 11,628 | 12,960 | N/A | N/A | (11%) |
| SOLGEN | 34,515 | 18,062 | 19,082 | 48% | 45% | (6%) |
| MCCSS | 4,452 | 3,491 | 3,626 | 22% | 19% | (4%) |
| EDU | 9,486 | 6,162 | 6,231 | 35% | 34% | (1%) |
| MNRF | 3,770 | 2,188 | 2,409 | 42% | 36% | (10%) |
| MTO | 255 | 59 | 78 | 77% | 70% | (31%) |
| Total | 169,055 | 95,697 | 100,211 | 43% | 41% | (5%) |
Roles and responsibilities
Infrastructure Ontario
Infrastructure Ontario manages the majority of the province’s portfolio on behalf of Ministry of Government and Consumer Services. Infrastructure Ontario is a crown agency that oversees the day-to-day operations of the real-estate portfolio and implements ministry policies for buildings, lands, and leases.
Infrastructure Ontario has three separate greenhouse gas emission reporting responsibilities:
- Reporting emissions publicly for Ministry of Government and Consumer Services-owned facilities building by building, this includes: Infrastructure Ontario managed and, Public Private Partnership sites
- Reporting on Ontario Public Service and Enterprise-wide summary status
- A 5-year energy conservation strategy
Public Private Partnerships
The Public Private Partnership model brings together private and public sector expertise in a unique structure that transfers the risk of project cost increases and scheduling delays, typically associated with traditional project delivery.
Public Private Partnership sites are required to report their greenhouse gas emissions; however Infrastructure Ontario does not have direct operational control of the facilities (managed by private service providers). As a result, reporting is presented in a separate line item to track Public Private Partnership sector progress.
Custodial ministries
Custodial ministries have day-to-day operational control over their own facilities. For the calendar year 2016, these ministries include:
- Ministry of Transportation
- Ministry of Education
- Ministry of Children, Community and Social Services
- Ministry of the Solicitor General
- The Ministry of Natural Resources and Forestry
Custodial Ministries have two primary responsibilities:
- Reporting emissions publicly for facilities managed on a day-to-day basis and,
- A 5-year energy conservation strategy (for each Custodial ministry)
Methodology
Infrastructure Ontario follows the direction from the Ontario Facilities Energy Reporting Directive (2013), which outlines the Target and Non-target Facilities required for reporting, and the sources for emission factors. Infrastructure Ontario follows the Greenhouse Gas Protocol for the emission calculation method. The Greenhouse Gas Protocol was developed by World Resources Institute and World Business Council on Sustainable Development. The GHG Protocol is the most commonly used carbon accounting tool for government and business leaders to quantify, and manage greenhouse gas emissions. Infrastructure Ontario follows this accounting standard as a guideline in its reporting of the enterprise emissions but sets the Directive as its primary guide.
For the calendar year 2018 reporting year, the following emission factors sources are used:
- Federal Government National Inventory Report 2019 (calendar year 2017 grid electricity and fossil fuels)
- Ontario Ministry of Energy, Northern Development and Mines (calendar year 2018 preliminary grid electricity emission factor)
- Enwave (for district steam and chilled water — all years)
- Infrastructure Ontario internal calculation (for district hot water based on National Inventory Report natural gas values — all years)
- Ontario Government (all equivalent kilowatt hours conversion factors)
In accordance with the latest Federal government's National Inventory Report (2019), the 100-year Global Warming Potential values are applied in this report, based on the second commitment period (2013 to 2020) from the Kyoto Protocol.
In-line with the principle of continuous improvement, the underlying data and methodology for estimating emissions are revised over time; hence, total emissions in all years are subject to change as both data and methods are improved. Improvements include:
- Applying more up-to-date and accurate emission factors retroactively to previous years’ data. The Canadian Federal Government releases its National Inventory Report annually, with a two-year lag of data. These figures are seen as the most accurate. This inventory thus updated the calendar year 2017 data to apply the latest emission factors for fuel and grid electricity for Ontario. Since the national report does not provide calendar year 2018 emission factors, the Ontario Ministry of Energy provides a preliminary value in the meantime. Next year's report will update the calendar year 2018 data to include the National Inventory Report's official value at that time.
- Updating utility data (energy and water) based on delayed invoicing. Due to the nature of utility billing, there are sometimes delays in receiving the energy and water data in time for the greenhouse gas Inventory release. A small amount of data is thus estimated, but is corrected later in the year. Small differences from the previous year's report data could change due to this correction.
Organizational boundary
An equity approach for the greenhouse gas emission inventory is used for all government-owned facilities. All of the real estate portfolio is owned by the Province of Ontario and the Ministry of Government and Consumer Services manages the bulk of the portfolio through Infrastructure Ontario, while Custodial Ministries and Public Private Partnership service providers manage the remainder. This is reflected in Infrastructure Ontario’s carbon accounting methodology that follows Ministry of Government and Consumer Services’ Directive in that emissions from all government owned facilities are accounted for, while the responsibility to track, report upon, and implement the 5-year energy conservation strategy for each facility rests with the ministry that has day-to-day operational control over that facility.
Within these upper level organizational boundaries, different accounting and reporting requirements apply to two separate classes of government-owned facilities: Target Class Facilities and Non-Target Class Facilities.
Target Class Facilities are a subset of all government-owned facilities that have been identified as having energy conservation potential that does not adversely affect operations. For Ministry of Government and Consumer Services they represent about 90% of the overall portfolio’s gross square feet, and for the majority of Custodial Ministries all their buildings are considered Target Class (see table 7). Target Class facilities energy and water consumption must be tracked at the building level within each facility and reported to both Ministry of Government and Consumer Services and the public as a requirement of the Directive.
Non-Target Class Facilities are facilities where Ministry of Government and Consumer Services does not have direct operational control or it may be difficult to conserve energy due to safety considerations or programmatic impacts and constraints. Energy and water consumption associated with these facilities/buildings are not required to be reported.
Leased Facilities are not subject to the Directive and thus facilities leased by government from third parties are not within the boundary of this inventory. Further Government does not have ownership or financial control of leased facilities, and thus emissions associated with their fuel combustion and purchased electricity are categorized as scope 3.
| Custodial Target Class Facilities | Custodial Non-Target Class Facilities | |
|---|---|---|
| Ministry of Transportation | Truck inspection stations | Patrol yards, remote airports, street lights |
| Ministry of Natural Resources and Forestry | Parks | Fish hatcheries, ranger camps, forward fire stations |
| Ministry of Education | Provincial schools | All facilities included |
| Ministry of the Solicitor General | Adult detention centres | All facilities included |
| Ministry of Children, Community and Social Services | Youth detention centres | All facilities included |
The following facilities are included in this report:
- Ministry of the Solicitor General: 28 facilities
- Ministry of Children, Community and Social Services: 11 facilities
- Ministry of Education: 78 facilities
- Ministry of Natural Resources and Forestry: 84 parks
- Ministry of Transportation: 34 facilities
- Public Private Partnership: 27 sites. Infrastructure Ontario does not have operational control of these buildings, but maintains a responsibility to report on them. Public Private Partnership hospitals are not required to report their emissions, and only fully operational facilities are being reported upon. Public Private Partnership sites register zero consumption for the 2006 base year and will only add to the Enterprise-wide emission inventories as more sites are added (regardless of their level of energy efficiency).
- Infrastructure Ontario - Managed: 401 facilities
The sources of greenhouse gas emissions from the portfolio includes:
| Scope 1 | Scope 2 |
|---|---|
| Production of heat from boilers, steam and electricity on-site from the combustion of: fuel oil, natural gas and propane | Purchased electricity, district hot water, district chilled water and district steam |
The Ontario Government uses a fixed target Base Year — which is 2006. The Ontario Government measures its reductions using “absolute” emissions over time. The baseline emissions are as follows:
| Total | Managed | Public Private Partnership | Ministry of Children and Youth Services | Ministry of the Solicitor General | Ministry of Transportation | Ministry of Education | Ministry of Natural Resources and Forestry | |
|---|---|---|---|---|---|---|---|---|
| Total | 169,055 | 116,578 | 0 | 4,452 | 34,515 | 255 | 9,486 | 3,770 |
Datasets
2019 Energy Consumption and Greenhouse Gas (GHG) Emission Report
Learn more about accessing data using different formats.
Footnotes
- footnote[1] Back to paragraph There were no managed buildings consuming district chilled water in the base year.
- footnote[2] Back to paragraph Other fuels include: district chilled water, district hot water and propane.
- footnote[3] Back to paragraph Previously reported data (i.e. calendar year 2018) is reviewed and retroactively corrected based on reporting improvements and confirmed in the Canada National Inventory Report emissions factors, so data reported for the previous year will reflect these updates.
- footnote[4] Back to paragraph Calculated using average 2018 interim electricity emission factor.
- footnote[5] Back to paragraph GHGs listed in tonnes of equivalent carbon dioxide (tCO2e).
- footnote[6] Back to paragraph The Public Private Partnership portfolio are new buildings whose greenhouse gas emissions did not exist in the base year.
- footnote[7] Back to paragraph The Public Private Partnership portfolio are new buildings whose emissions did not exist in the base year.