2023–24 First Quarter Finances
The First Quarter Finances report contains information about Ontario’s 2023–24 fiscal outlook, primarily as of June 30, 2023.
Highlights
- Ontario’s real gross domestic product (GDP) increased by 1.0 per cent in the first calendar quarter of 2023, following a 0.2 per cent decline in the fourth quarter of 2022. Real GDP growth in the first quarter was supported by higher exports and household spending.
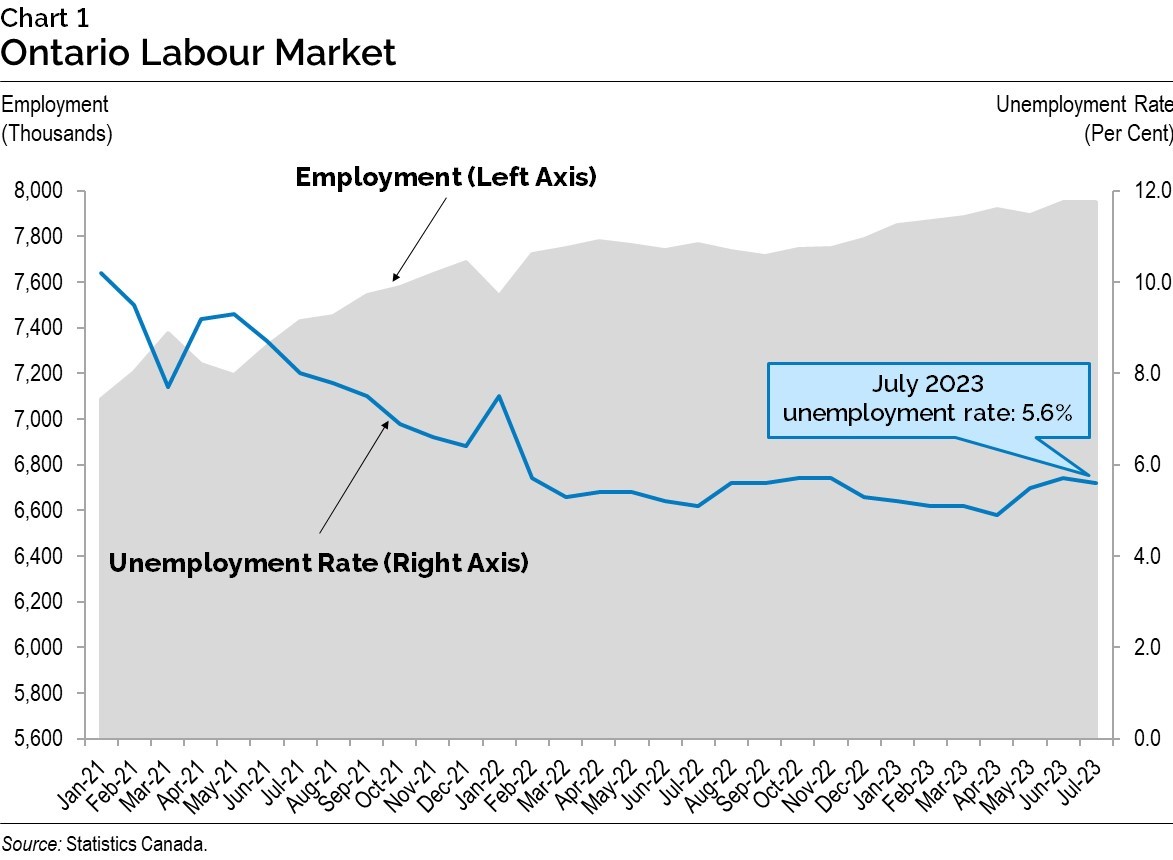
- Ontario’s labour market has remained strong, with employment increasing by over 230,000 net jobs between September 2022 and July 2023. In addition, Ontario’s unemployment rate of 5.6 per cent in July 2023 is near historic lows.
- Since the 2023 Ontario Budget, expectations by private-sector forecasters for GDP growth have improved for 2023, reflecting better-than-expected economic performance so far this year. However, expectations for GDP growth have declined for 2024, reflecting the impact of Bank of Canada policy interest rate increases — the fastest rise in the key policy interest rate since 1981.
- Ontario’s Consumer Price Index (CPI) inflation has moderated for 12 consecutive months, from 7.9 per cent in June 2022 to 2.6 per cent in June 2023. The Bank of Canada projects that Canadian inflation will stay around 3 per cent for the next year, returning to the 2 per cent target by the middle of 2025.
- Economic uncertainty remains elevated. High interest rates and inflation persistently above the Bank of Canada’s 2 per cent target remain key downside risks for the economic outlook.
- As of the 2023–24 First Quarter Finances, the province’s 2023–24 deficit is projected to be $1.3 billion — unchanged from the outlook published in the 2023 Ontario Budget.
- Revenues in 2023–24 are projected to be $204.4 billion, largely unchanged compared to the forecast in the 2023 Ontario Budget.
- Overall program expense in 2023–24 is projected to be $190.6 billion, largely unchanged from the outlook presented in the 2023 Ontario Budget. New commitments announced since the release of the 2023 Ontario Budget are primarily funded through existing contingencies within the fiscal plan.
- Following the 2023 Ontario Budget, Standard & Poor’s, Moody’s and DBRS Morningstar have all placed Ontario’s credit ratings on positive outlook, while Fitch confirmed Ontario’s credit rating with a stable outlook.
Introduction
Ontario’s economy has shown resiliency in 2023 in the face of elevated economic and geopolitical uncertainties. While inflationary pressure has eased following a rapid series of interest rate increases by the Bank of Canada, the impact of higher interest rates weighs on the economic outlook for the remainder of the year and into 2024.
The 2023 Ontario Budget: Building a Strong Ontario, released in March, maintained a prudent and responsible fiscal plan that would balance the budget in 2024–25 — three years earlier than forecast in the last Budget — and targeted supports to help people and businesses. Ontario’s fiscal policy aligns with the Bank of Canada’s goal to restore price stability, and will support the economy while laying a strong fiscal foundation.
Despite the resiliency of Ontario’s economy so far in 2023, the province is not immune to any potential economic slowdown, which is why the government will continue with its responsible, targeted approach to support people and businesses through these uncertain times, while building a strong fiscal foundation for future generations.
Ontario’s balanced approach has not gone unnoticed. Following the 2023 Ontario Budget, Standard & Poor’s, Moody’s and DBRS Morningstar have all placed Ontario’s credit ratings on positive outlook, while Fitch confirmed Ontario’s credit rating with a stable outlook.
Against this backdrop, the government is releasing the 2023–24 First Quarter Finances, which provides updated information about the evolution of Ontario’s economic and fiscal outlook since the 2023 Ontario Budget.
The government plans to provide its next economic and fiscal update as part of the 2023 Ontario Economic Outlook and Fiscal Review, to be released by November 15, 2023.
Section A: Ontario’s 2023–24 Fiscal Outlook
The province’s 2023–24 deficit is projected to be unchanged from the outlook of $1.3 billion published in the 2023 Ontario Budget.
Revenues in 2023–24 are projected to be $204.4 billion, largely unchanged from the forecast in the 2023 Ontario Budget.
Overall program expense in 2023–24 is projected to be $190.6 billion, also largely unchanged from the outlook presented in the 2023 Ontario Budget. New investments announced since the release of the 2023 Ontario Budget are primarily funded through existing contingencies within the fiscal plan.
Interest on debt in 2023–24 is projected to remain unchanged from the $14.1 billion forecast in the 2023 Ontario Budget.
As of the 2023–24 First Quarter Finances, the net debt-to-GDP ratio is projected to be 37.6 per cent in 2023–24, 0.2 percentage points lower than the 37.8 per cent forecast in the 2023 Ontario Budget.
The 2023 Ontario Budget included a $1.0 billion reserve in 2023–24 to protect the fiscal outlook against any unforeseen changes in the province’s revenue and expense forecasts. The $1.0 billion reserve has been maintained as part of the current fiscal outlook. The reserve provides additional prudence in the government’s fiscal framework and is distinct from the Contingency Fund that sets aside dedicated funding to be allocated in response to emerging needs throughout the year. The government has allocated $0.8 billion of this year’s Contingency Fund as of the end of the first quarter.
| Item | 2023 Budget | Current Outlook | In-Year Change |
|---|---|---|---|
| Revenue | 204,367.4 | 204,367.5 | 0.2 |
| Expense — Programs | 190,622.0 | 190,622.1 | 0.2 |
| Expense — Interest on Debt | 14,058.0 | 14,058.0 | – |
| Total Expense | 204,680.0 | 204,680.1 | 0.2 |
| Surplus/(Deficit) Before Reserve | (312.6) | (312.6) | – |
| Reserve | 1,000.0 | 1,000.0 | – |
| Surplus/(Deficit) | (1,312.6) | (1,312.6) | – |
Notes: Numbers may not add due to rounding. Current outlook primarily reflects information available as of June 30, 2023.
Sources: Ontario Treasury Board Secretariat and Ontario Ministry of Finance.
Revenue
The 2023–24 revenue outlook is projected to be $204.4 billion, largely unchanged compared to the forecast in the 2023 Ontario Budget. The forecast has increased by $0.2 million, reflecting funding from the federal government to build capacity for First Nations policing.
The revenue change outlined above is based on information available at the end of the first quarter. There are further upside and downside risks that could materially affect the 2023–24 revenue outlook. These include changes to the economic growth outlook, new information on tax assessments based on 2022 and prior year tax return filings throughout the spring and summer, and collections. The government will monitor these economic and revenue developments, and will provide further details in future fiscal updates as new information becomes available.
| Item | 2023–24 |
|---|---|
| 2023 Budget Total Revenue Outlook | 204,367.4 |
| Revenue Changes Since the 2023 Budget — Government of Canada Transfers | 0.2 |
| Total Revenue Changes Since the 2023 Budget | 0.2 |
| 2023–24 First Quarter Finances Total Revenue Outlook | 204,367.5 |
Notes: Numbers may not add due to rounding. Current outlook primarily reflects information available as of June 30, 2023.
Source: Ontario Ministry of Finance.
Expense
Total expense is projected to be $204.7 billion, largely unchanged from the 2023 Ontario Budget projection. New investments include supports for Ontario’s manufacturing sector, funding for policing and anti-crime initiatives, and municipal infrastructure investments.
| Item | 2023–24 |
|---|---|
| 2023 Budget Total Expense Outlook | 204,680.0 |
| Program Expense Changes Since the 2023 Budget — Developing Industrial Land for Large-Scale Manufacturing Investments | 357.8 |
| Program Expense Changes Since the 2023 Budget — Supporting Front-Line Police Operations | 75.0 |
| Program Expense Changes Since the 2023 Budget — Funding to Support the Delivery of Transit-Oriented Communities | 50.0 |
| Program Expense Changes Since the 2023 Budget — Addressing Auto Theft Crime and Bail Violations | 49.7 |
| Program Expense Changes Since the 2023 Budget — Funding to Build Capacity for First Nations Policing | 26.6 |
| Program Expense Changes Since the 2023 Budget — Funding for Waterfront Toronto’s Port Lands Flood Protection Project | 25.0 |
| Program Expense Changes Since the 2023 Budget — Funding for Supportive and Affordable Housing in the City of Ottawa | 24.2 |
| Program Expense Changes Since the 2023 Budget — Enhancing Supports for Ontario’s Wine Sector | 10.0 |
| Program Expense Changes Since the 2023 Budget — Enhancing the Northern Fire Protection Program and Fire Training and Certification | 1.9 |
| Program Expense Changes Since the 2023 Budget — All Other Changes | 146.5 |
| Total Program Expense Changes | 766.6 |
| Net Drawdown of the Contingency Fund | (766.4) |
| Total Net Program Expense Changes Since the 2023 Budget | 0.2 |
| Interest on Debt Change Since the 2023 Budget | – |
| Total Expense Changes Since the 2023 Budget | 0.2 |
| 2023–24 First Quarter Finances Total Expense Outlook | 204,680.1 |
Notes: Numbers may not add due to rounding. Current outlook primarily reflects information available as of June 30, 2023.
Sources: Ontario Treasury Board Secretariat and Ontario Ministry of Finance.
Program Expense Update
The outlook for program expense in 2023–24 is projected to be $190.6 billion, largely unchanged from the projection in the 2023 Ontario Budget.
Key changes to program expense projections, primarily offset by the Contingency Fund, include:
- $357.8 million to develop industrial land for large-scale manufacturing investments;
- $75.0 million to support front-line operations of the Ontario Provincial Police, including investing in new technologies, equipment and services;
- $50.0 million to support the delivery of Transit-Oriented Communities;
- $49.7 million to help police identify and dismantle organized auto theft crime, strengthen the province’s bail system and ensure that offenders comply with their bail conditions;
- $26.6 million for the First Nations and Inuit Policing Program, to increase policing capacity and support the repair and replacement of policing facilities, with $0.2 million offset through federal transfers;
- $25.0 million for the provincial share of cost increases for Waterfront Toronto’s Port Lands Flood Protection Project;
- $24.2 million to support the development of affordable and supportive housing units in the City of Ottawa;
- $10.0 million for a new Winery Agri-Tourism Economic Relief Grant program, to provide continued support to eligible wineries and cideries with on-site stores;
- $1.9 million to enhance the Northern Fire Protection Program and modernize the delivery of fire training and certification; and
- $146.5 million for all other changes, including funding for existing collective agreements with Ontario Public Service employees.
Interest on Debt Expense Update
Interest on debt expense is projected to be $14.1 billion, unchanged from the forecast in the 2023 Ontario Budget. Despite the overnight rate increasing, Ontario’s projected cost of borrowing for this fiscal year remains at 4.6 per cent, as long-term rates have remained within the range forecasted in the 2023 Ontario Budget through the first quarter.
Fiscal Prudence
The Fiscal Sustainability, Transparency and Accountability Act, 2019 requires Ontario’s fiscal plan to incorporate prudence in the form of a reserve to protect the fiscal outlook against unforeseen changes in the province’s revenue and expense, including those resulting from Ontario’s economic performance. The 2023 Ontario Budget included a reserve of $1.0 billion in 2023–24, which has been maintained as part of the current fiscal outlook. In addition, the Contingency Fund is maintained to help mitigate expense risks — for example, in cases where health and safety may be compromised, or unforeseen events which may otherwise adversely affect Ontario’s fiscal performance. The remaining balance of the Contingency Fund is projected to be $3.2 billion for 2023–24.
Section B: Ontario’s Recent Economic Performance and Outlook
Recent Economic Performance
In the first calendar quarter of 2023, Ontario’s real gross domestic product (GDP) increased by 1.0 per cent, following a decline of 0.2 per cent in the fourth quarter of 2022. Real GDP growth in the first quarter was supported by higher exports and household spending. As of the first quarter, Ontario’s real GDP was 4.9 per cent above the pre-pandemic level in the fourth quarter of 2019.
Ontario’s labour market has remained strong over the first seven months of 2023, following record net job gains in 2021 and 2022. Ontario’s employment increased by over 230,000 net jobs between September 2022 and July 2023. The majority of jobs created have been full-time and in the private sector. The unemployment rate was 5.6 per cent as of July 2023, and remains low compared to historical standards.
Ontario’s Consumer Price Index (CPI) increased 2.6 per cent in June 2023 compared to a year earlier, moderating for the 12th consecutive month and down from a recent peak of 7.9 per cent in June 2022. Much of the decline in headline inflation can be attributed to lower energy prices and, in particular, gasoline prices.
Economic Outlook
Global economic growth has remained resilient in 2023, as consumer spending has been strong despite tightening monetary policy in many economies to address elevated price inflation. The International Monetary Fund projects global real GDP to rise by 3.0 per cent in 2023, up from a projected increase of 2.9 per cent at the time of the 2023 Ontario Budget. In the U.S., resilient labour markets and consumer demand have continued to support economic growth. According to the Blue Chip Economic Indicators July survey, forecasters anticipate U.S. real GDP to increase by 1.6 per cent in 2023, compared to 0.5 per cent growth at the time of the 2023 Ontario Budget.
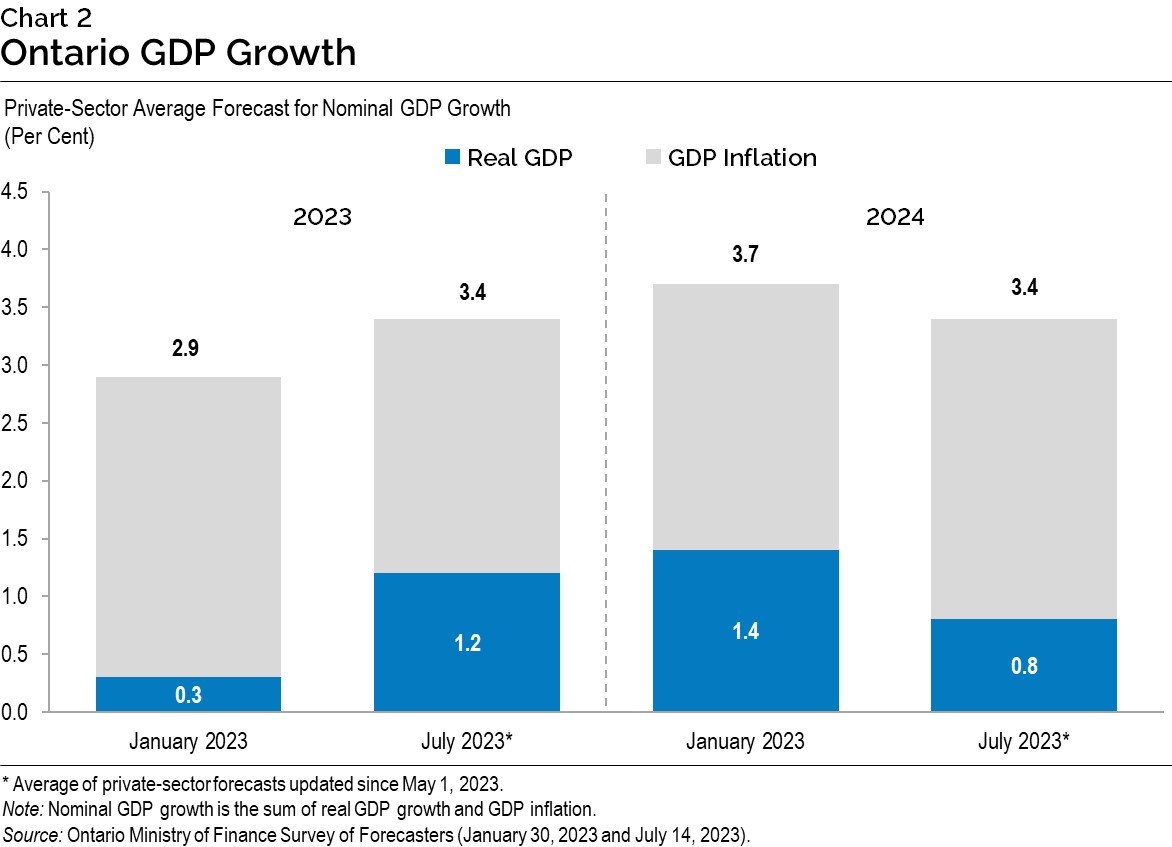
Since the release of the 2023 Ontario Budget, Ontario real GDP growth expectations have been revised higher for 2023, reflecting stronger-than-expected economic performance so far this year. Among recent private-sector forecasts, the average projected Ontario real GDP growth for 2023 is 1.2 per cent, higher than the average increase of 0.3 per cent at the time of the 2023 Ontario Budget. However, Bank of Canada interest rate increases and economic uncertainty continue to weigh on the outlook for the remainder of the year and into 2024. The private-sector average forecast for 2024 has declined from 1.4 per cent at the time of the 2023 Ontario Budget to 0.8 per cent.
Since the 2023 Ontario Budget, Ontario nominal GDP growth expectations have been revised higher for 2023, but lower for 2024. Among recently updated private-sector forecasts, the average projected nominal GDP growth for 2023 is 3.4 per cent, above the average increase of 2.9 per cent in the 2023 Ontario Budget. The private-sector average forecast for 2024 has declined from 3.7 per cent at the time of the 2023 Ontario Budget to 3.4 per cent.
Despite easing supply chain disruptions, high interest rates and inflation persistently above the Bank of Canada’s 2 per cent target remain key downside risks for the economic outlook. Economic activity has been stronger than expected in many jurisdictions. Robust household spending has been supported by strong labour markets and accumulated savings. Continued employment gains and low unemployment, both in Ontario and abroad, may continue to intensify price pressures.
In response to elevated inflation, the Bank of Canada has continued to raise policy interest rates to the highest rate in over twenty years. If price pressures remain elevated, interest rates may increase further and remain high for a longer period. This could negatively impact interest-rate-sensitive sectors such as housing, as well as consumer and business spending.
In turn, continued consumer and labour market resiliency, as well as faster-than-expected easing of inflation, are upside risks to the economic outlook.
Section C: Details of Ontario’s Finances
| Item | 2023–24 2023 Budget | 2023–24 Current Outlook | 2023–24 In-Year Change |
|---|---|---|---|
| Taxation Revenue — Personal Income Tax | 55,982 | 55,982 | – |
| Taxation Revenue — Sales Tax | 35,350 | 35,350 | – |
| Taxation Revenue — Corporations Tax | 24,668 | 24,668 | – |
| Taxation Revenue — Education Property Tax | 5,725 | 5,725 | – |
| Taxation Revenue — Employer Health Tax | 8,215 | 8,215 | – |
| Taxation Revenue — Ontario Health Premium | 4,896 | 4,896 | – |
| Taxation Revenue — Gasoline Tax | 2,222 | 2,222 | – |
| Taxation Revenue — Land Transfer Tax | 3,529 | 3,529 | – |
| Taxation Revenue — Tobacco Tax | 840 | 840 | – |
| Taxation Revenue — Fuel Tax | 635 | 635 | – |
| Taxation Revenue — Beer, Wine and Spirits Taxes | 617 | 617 | – |
| Taxation Revenue — Electricity Payments in Lieu of Taxes | 538 | 538 | – |
| Taxation Revenue — Ontario Portion of the Federal Cannabis Excise Duty | 269 | 269 | – |
| Taxation Revenue — Other Taxes | 735 | 735 | – |
| Taxation Revenue — Total | 144,222 | 144,222 | – |
| Government of Canada — Canada Health Transfer | 19,218 | 19,218 | – |
| Government of Canada — Canada Social Transfer | 6,384 | 6,384 | – |
| Government of Canada — Equalization | 421 | 421 | – |
| Government of Canada — Infrastructure Programs | 1,206 | 1,206 | – |
| Government of Canada — Labour Market Programs | 931 | 931 | – |
| Government of Canada — Social Housing Agreement | 218 | 218 | – |
| Government of Canada — Other Federal Payments | 5,996 | 5,997 | 0.2 |
| Government of Canada — Direct Transfers to Broader Public Sector Organizations | 470 | 470 | – |
| Government of Canada — Total | 34,844 | 34,844 | 0.2 |
| Income from Government Business Enterprises — Liquor Control Board of Ontario | 2,452 | 2,452 | – |
| Income from Government Business Enterprises — Ontario Power Generation Inc./Hydro One Ltd. | 1,126 | 1,126 | – |
| Income from Government Business Enterprises — Ontario Lottery and Gaming Corporation | 2,574 | 2,574 | – |
| Income from Government Business Enterprises — Ontario Cannabis Store | 194 | 194 | – |
| Income from Government Business Enterprises — Total | 6,345 | 6,345 | – |
| Other Non-Tax Revenue — Fees, Donations and Other Revenues from Hospitals, School Boards and Colleges | 11,104 | 11,104 | – |
| Other Non-Tax Revenue — Vehicle and Driver Registration Fees | 1,131 | 1,131 | – |
| Other Non-Tax Revenue — Miscellaneous Other Non-Tax Revenue | 1,943 | 1,943 | – |
| Other Non-Tax Revenue — Other Fees and Licences | 1,518 | 1,518 | – |
| Other Non-Tax Revenue — Sales and Rentals | 1,847 | 1,847 | – |
| Other Non-Tax Revenue — Reimbursements | 1,048 | 1,048 | – |
| Other Non-Tax Revenue — Royalties | 322 | 322 | – |
| Other Non-Tax Revenue — Power Supply Contract Recoveries | 43 | 43 | – |
| Other Non-Tax Revenue — Net Reduction of Power Purchase Contracts | – | – | – |
| Other Non-Tax Revenue — Total | 18,956 | 18,956 | – |
| Total Revenue | 204,367 | 204,368 | 0.2 |
Notes: Numbers may not add due to rounding. Current outlook primarily reflects information available as of June 30, 2023.
Source: Ontario Ministry of Finance.
| Ministry Expense | 2023–24 2023 Budget | 2023–24 Current Outlook | 2023–24 In-Year Change |
|---|---|---|---|
| Agriculture, Food and Rural Affairs (Base) | 350.3 | 361.4 | 11.2 |
| Agriculture, Food and Rural Affairs — Demand-Driven Risk Management and Time-Limited Programs | 472.1 | 472.1 | – |
| Agriculture, Food and Rural Affairs (Total) | 822.4 | 833.6 | 11.2 |
| Attorney General (Total) | 1,919.2 | 1,941.9 | 22.8 |
| Board of Internal Economy (Total) | 304.8 | 304.8 | – |
| Children, Community and Social Services (Total) | 19,360.8 | 19,394.0 | 33.2 |
| Citizenship and Multiculturalism (Total) | 64.1 | 67.7 | 3.6 |
| Colleges and Universities (Base) | 10,757.2 | 10,758.4 | 1.3 |
| Colleges and Universities — Student Financial Assistance | 1,357.7 | 1,357.7 | – |
| Colleges and Universities (Total) | 12,114.8 | 12,116.1 | 1.3 |
| Economic Development, Job Creation and Trade (Base) | 188.9 | 189.5 | 0.6 |
| Economic Development, Job Creation and Trade — Tax Credits for Research and Development and Regional Investment | 299.2 | 299.2 | – |
| Economic Development, Job Creation and Trade — Ontario Made Manufacturing Investment Tax Credit | 215.0 | 215.0 | – |
| Economic Development, Job Creation and Trade — Time-Limited Investments | 606.8 | 964.6 | 357.8 |
| Economic Development, Job Creation and Trade (Total) | 1,309.8 | 1,668.2 | 358.4 |
| Education (Base) | 34,712.1 | 34,714.1 | 2.0 |
| Education — Teachers’ Pension Plan | 1,711.0 | 1,711.0 | – |
| Education (Total) | 36,423.1 | 36,425.1 | 2.0 |
| Energy (Base) | 281.8 | 284.8 | 3.0 |
| Energy — Electricity Cost-Relief Programs | 6,516.8 | 6,514.2 | (2.7) |
| Energy (Total) | 6,798.6 | 6,799.0 | 0.4 |
| Environment, Conservation and Parks (Total) | 782.6 | 785.7 | 3.1 |
| Executive Offices (Total) | 60.8 | 66.2 | 5.4 |
| Finance (Base) | 1,006.0 | 1,007.8 | 1.8 |
| Finance — Investment Management Corporation of Ontario | 298.8 | 298.8 | – |
| Finance — Ontario Municipal Partnership Fund | 501.9 | 501.9 | – |
| Finance — Temporary and Other Local Assistance | 81.0 | 81.0 | – |
| Finance — Power Supply Contract Costs | 42.9 | 42.9 | – |
| Finance (Total) | 1,930.6 | 1,932.4 | 1.8 |
| Francophone Affairs (Total) | 7.7 | 7.9 | 0.2 |
| Health (Total) | 72,709.6 | 72,688.7 | (20.9) |
| Indigenous Affairs (Total) | 133.2 | 136.0 | 2.8 |
| Infrastructure (Base) | 601.8 | 657.3 | 55.6 |
| Infrastructure — Federal–Provincial Infrastructure Programs | 492.2 | 491.6 | (0.7) |
| Infrastructure — Broadband | 783.2 | 783.2 | – |
| Infrastructure — Waterfront Toronto Revitalization (Port Lands Flood Protection) | – | 25.0 | 25.0 |
| Infrastructure — Municipal Infrastructure Program Investments | 398.4 | 397.0 | (1.4) |
| Infrastructure — Realty | 1,194.3 | 1,195.2 | 1.0 |
| Infrastructure (Total) | 3,469.8 | 3,549.4 | 79.5 |
| Labour, Immigration, Training and Skills Development (Base) | 236.4 | 241.0 | 4.6 |
| Labour, Immigration, Training and Skills Development — Training Tax Credits (Co-operative Education and Apprenticeship Training) | 93.5 | 93.5 | – |
| Labour, Immigration, Training and Skills Development — Demand-Driven Employment and Training Programs | 1,454.2 | 1,454.2 | – |
| Labour, Immigration, Training and Skills Development (Total) | 1,784.1 | 1,788.6 | 4.6 |
| Long-Term Care (Total) | 8,299.7 | 8,306.4 | 6.8 |
| Mines (Total) | 172.3 | 172.8 | 0.5 |
| Municipal Affairs and Housing (Base) | 767.5 | 771.2 | 3.7 |
| Municipal Affairs and Housing — Time-Limited Investments | 480.0 | 504.1 | 24.2 |
| Municipal Affairs and Housing — Social Housing Agreement – Payments to Service Managers | 198.2 | 198.2 | – |
| Municipal Affairs and Housing (Total) | 1,445.6 | 1,473.5 | 27.8 |
| Natural Resources (Base) | 688.3 | 691.6 | 3.4 |
| Natural Resources — Emergency Forest Firefighting | 135.0 | 135.0 | – |
| Natural Resources (Total) | 823.2 | 826.6 | 3.4 |
| Northern Development (Total) | 725.3 | 725.6 | 0.3 |
| Public and Business Service Delivery (Total) | 1,130.6 | 1,144.1 | 13.4 |
| Seniors and Accessibility (Base) | 64.9 | 66.4 | 1.5 |
| Seniors and Accessibility — Seniors Tax Credits (Home Safety and Care at Home) | 120.0 | 120.0 | – |
| Seniors and Accessibility (Total) | 184.9 | 186.4 | 1.5 |
| Solicitor General (Total) | 3,431.1 | 3,598.6 | 167.5 |
| Tourism, Culture and Sport (Base) | 840.2 | 844.2 | 4.0 |
| Tourism, Culture and Sport — Ontario Cultural Media Tax Credits | 906.1 | 906.1 | – |
| Tourism, Culture and Sport (Total) | 1,746.3 | 1,750.3 | 4.0 |
| Transportation (Base) | 6,179.5 | 6,183.8 | 4.3 |
| Transportation — Federal–Provincial Infrastructure Programs | 729.2 | 729.2 | – |
| Transportation (Total) | 6,908.7 | 6,913.0 | 4.3 |
| Treasury Board Secretariat (Base) | 497.4 | 525.3 | 27.9 |
| Treasury Board Secretariat — Employee and Pensioner Benefits | 1,260.7 | 1,260.7 | – |
| Treasury Board Secretariat — Operating Contingency Fund | 3,893.7 | 3,176.4 | (717.3) |
| Treasury Board Secretariat — Capital Contingency Fund | 106.3 | 57.2 | (49.2) |
| Treasury Board Secretariat (Total) | 5,758.1 | 5,019.5 | (738.6) |
| Interest on Debt | 14,058.0 | 14,058.0 | – |
| Total Expense | 204,680.0 | 204,680.1 | 0.2 |
Notes: Numbers may not add due to rounding.Current outlook primarily reflects information available as of June 30, 2023.
Sources: Ontario Treasury Board Secretariat and Ontario Ministry of Finance.
| Sector | 2023–24 Current Outlook Investment in Capital Assets | 2023–24 Current Outlook Transfers and Other Infrastructure Expenditures | 2023–24 Current Outlook Total Infrastructure Expenditures | 2023 Budget Total Infrastructure Expenditures | In-Year Change Total Infrastructure Expenditures |
|---|---|---|---|---|---|
| Transportation — Transit | 6,195 | 1,276 | 7,471 | 7,471 | – |
| Transportation — Provincial Highways | 3,098 | 95 | 3,193 | 3,193 | – |
| Transportation — Other Transportation, Property and Planning | 157 | 79 | 236 | 236 | – |
| Health — Hospitals | 3,348 | 1 | 3,349 | 3,349 | – |
| Health — Other Health | 77 | 496 | 573 | 581 | (8) |
| Education | 2,777 | 226 | 3,003 | 3,003 | – |
| Postsecondary Education — Colleges and Other | 614 | 90 | 705 | 705 | – |
| Postsecondary Education — Universities | – | 124 | 124 | 124 | – |
| Social | 32 | 361 | 394 | 369 | 24 |
| Justice | 824 | 27 | 851 | 801 | 49 |
| Other Sectors | 1,121 | 2,522 | 3,643 | 3,667 | (24) |
| Total Infrastructure Expenditures | 18,243 | 5,298 | 23,541 | 23,499 | 42 |
| Less: Other Partner Funding | 2,560 | 304 | 2,864 | 2,864 | – |
| Total | 15,683 | 4,993 | 20,677 | 20,635 | 42 |
Notes: Numbers may not add due to rounding.Current outlook primarily reflects information available as of June 30, 2023.
Source: Ontario Treasury Board Secretariat.
| Item | 2019–20 | 2020–21 | Actual 2021–22 | Interim 2022–23 | Current Outlook 2023–24 |
|---|---|---|---|---|---|
| Revenue | 156,096 | 164,893 | 185,062 | 200,402 | 204,368 |
| Expense — Programs | 152,253 | 168,989 | 170,424 | 189,148 | 190,622 |
| Expense — Interest on Debt | 12,515 | 12,308 | 12,587 | 13,424 | 14,058 |
| Total Expense | 164,768 | 181,297 | 183,011 | 202,572 | 204,680 |
| Reserve | – | – | – | – | 1,000 |
| Surplus/(Deficit) | (8,672) | (16,404) | 2,051 | (2,170) | (1,313) |
| Net Debt | 353,332 | 373,564 | 380,415 | 395,785 | 406,443 |
| Accumulated Deficit | 225,764 | 239,294 | 236,857 | 242,763 | 243,438 |
| Gross Domestic Product (GDP) at Market Prices | 893,224 | 866,981 | 956,707 | 1,044,670 | 1,080,189 |
| Primary Household Income | 593,065 | 592,460 | 644,263 | 704,510 | 739,736 |
| Population — July (000s) | 14,545 | 14,726 | 14,809 | 15,109 | 15,593 |
| Net Debt Per Capita (dollars) | 24,293 | 25,368 | 25,688 | 26,195 | 26,066 |
| Household Income Per Capita (dollars) | 40,775 | 40,232 | 43,504 | 46,627 | 47,440 |
| Net Debt as a Per Cent of Revenue | 226.4% | 226.5% | 205.6% | 197.5% | 198.9% |
| Interest on Debt as a Per Cent of Revenue | 8.0% | 7.5% | 6.8% | 6.7% | 6.9% |
| Net Debt as a Per Cent of GDP | 39.6% | 43.1% | 39.8% | 37.9% | 37.6% |
| Accumulated Deficit as a Per Cent of GDP | 25.3% | 27.6% | 24.8% | 23.2% | 22.5% |
Notes: Numbers may not add due to rounding. Current outlook primarily reflects information available as of June 30, 2023.
Sources: Statistics Canada, Ontario Treasury Board Secretariat and Ontario Ministry of Finance.
Section D: Ontario’s 2023–24 Borrowing Program
| Item | 2023–24 2023 Budget | 2023–24 Current Outlook | 2023–24 Change from 2023 Budget |
|---|---|---|---|
| Deficit/(Surplus) | 1.3 | 1.3 | – |
| Investment in Capital Assets | 13.6 | 13.6 | – |
| Non-Cash and Cash Timing Adjustments | (9.2) | (9.2) | – |
| Loans to Infrastructure Ontario | 0.1 | 0.1 | – |
| Other Net Loans/Investments | 0.1 | 0.1 | – |
| Debt Maturities/Redemptions | 31.2 | 31.2 | – |
| Total Funding Requirement | 37.0 | 37.0 | – |
| Decrease/(Increase) in Short-Term Borrowing | – | – | – |
| Increase/(Decrease) in Cash and Cash Equivalents | 5.0 | 5.0 | – |
| Pre-Borrowing in 2022–23 for 2023–24 | (14.5) | (14.5) | – |
| Total Long-Term Public Borrowing | 27.5 | 27.5 | – |
Note: Numbers may not add due to rounding.
Source: Ontario Financing Authority.
Ontario’s current funding requirements for 2023–24 are projected to remain unchanged from the forecast in the 2023 Ontario Budget. As a result, both the province’s long-term borrowing program and short-term borrowing for 2023–24 are forecast to remain unchanged.
As of August 2, 2023, Ontario had completed $10.0 billion or 36.3 per cent of its $27.5 billion 2023–24 long‑term borrowing program, with the majority completed in Canadian dollars and an A$35 million Australian dollar bond.
Green Bonds remain a core component of Ontario’s borrowing program and are an important tool to help finance public transit initiatives, extreme weather-resistant infrastructure, as well as energy efficiency and conservation projects. Ontario remains the largest issuer of Canadian dollar Green Bonds, totalling $15.0 billion issued since 2014–15, with $13.0 billion outstanding.
Ontario is updating its Green Bond Framework. The update may include better alignment of framework categories with the Green Bond Principles through standardized wording, as well as the possible expansion from green to sustainable to allow for a greater breadth of potential bond offerings in the future.
Ontario plans to continue its leadership in the Canadian dollar Green Bond market and, subject to market conditions, will issue multiple Green Bonds each fiscal year, including in 2023–24.
Despite the further increases to the overnight rate since the 2023 Ontario Budget, Ontario’s cost of borrowing for 2023–24 remains at 4.6 per cent, as long-term rates have remained within the range forecasted in the 2023 Ontario Budget through the first quarter. The province will continue to monitor movements in long-term interest rates and provide regular updates on interest on debt costs in future fiscal updates.
2023–24 Long-Term Borrowing
| Item | Amount |
|---|---|
| Canadian dollar issues | 10.0 |
| Foreign currency issues | 0.03 |
| Total | 10.0 |
Note: Numbers may not add due to rounding.
Source: Ontario Financing Authority.
Ministry of Finance: www.ontario.ca/finance
For general inquiries regarding the 2023–24 First Quarter Finances, please call or email:
Toll-free English and French inquiries:
Teletypewriter (TTY):
Email: FinanceCommunications.fin@ontario.ca
© King’s Printer for Ontario, 2023
Chart Descriptions: Alternative Text for Web Accessibility
Chart 1: Ontario Labour Market
The chart shows Ontario’s monthly employment level as a shaded area and unemployment rate as a line, from January 2021 to July 2023. The unemployment rate has trended down over the period, from 10.2 per cent in January 2021 to a low of 4.9 per cent in April 2023. The unemployment rate was 5.6 per cent in July 2023. Employment trended up over the period, from 7.1 million in January 2021 to 7.9 million in July 2023. There is a call-out box that states “July 2023 unemployment rate: 5.6 per cent”.
Source: Statistics Canada.
Chart 2: Ontario GDP Growth
This stacked bar chart shows private-sector average forecasts for Ontario real GDP growth, GDP inflation and nominal GDP growth in 2023 and 2024. Note that nominal GDP growth is the sum of real GDP growth and GDP inflation.
At the time of the 2023 Ontario Budget, the average of private-sector forecasts was for Ontario’s real GDP to rise by 0.3 per cent in 2023, with GDP inflation of 2.6 per cent and nominal GDP growth of 2.9 per cent. For 2024, real GDP was projected to rise by 1.4 per cent, with GDP inflation of 2.3 per cent and nominal GDP growth of 3.7 per cent.
In July 2023, the average of private-sector forecasts updated since May 1, 2023 is for Ontario’s real GDP to rise by 1.2 per cent in 2023, with GDP inflation of 2.2 per cent and nominal GDP growth of 3.4 per cent. For 2024, real GDP is projected to rise by 0.8 per cent, with GDP inflation of 2.6 per cent and nominal GDP growth of 3.4 per cent.
Source: Ontario Ministry of Finance Survey of Forecasters (January 30, 2023 and July 14, 2023).
Footnotes
- footnote[1] Back to paragraph Reflects $0.2 million in Government of Canada Transfers for Ontario’s First Nations and Inuit Policing Program.
- footnote[2] Back to paragraph Numbers reflect current ministry structure as presented in the 2023 Budget.
- footnote[3] Back to paragraph Includes an interministry transfer from the Ministry of Health to the Ministry of Children, Community and Social Services for paediatric recovery investment.
- footnote[4] Back to paragraph Includes the estimated cost of tax credit claims for the Ontario Innovation Tax Credit, the Ontario Business-Research Institute Tax Credit and the Regional Opportunities Investment Tax Credit (ROITC).
- footnote[5] Back to paragraph Based on the requirements of Public Sector Accounting Standards, the province consolidates the financial results of the Investment Management Corporation of Ontario.
- footnote[6] Back to paragraph The Co-operative Education Tax Credit remains in effect. The Apprenticeship Training Tax Credit was eliminated for eligible apprenticeship programs that commenced on or after November 15, 2017.
- footnote[7] Back to paragraph The Ontario Ministry of Long-Term Care total includes expenses incurred by Ontario Health for funding for long-term care. These amounts will be consolidated in the total expense of the Ontario Ministry of Health, including $5.2 billion in 2023–24.
- footnote[8] Back to paragraph Interest on debt is net of interest capitalized during construction of tangible capital assets of $573 million in 2023–24.
- footnote[9] Back to paragraph Includes $573 million in interest capitalized during construction.
- footnote[10] Back to paragraph Includes provincial investment in capital assets of $13.6 billion.
- footnote[11] Back to paragraph Includes transfers to municipalities, universities and non-consolidated agencies.
- footnote[12] Back to paragraph Includes broadband infrastructure, government administration, natural resources and the culture and tourism industries.
- footnote[13] Back to paragraph Other Partner Funding refers to third-party investments, primarily in hospitals, colleges and schools.
- footnote[14] Back to paragraph Includes Federal/Municipal contributions to provincial infrastructure investments.
- footnote[15] Back to paragraph Interim represents the 2023 Budget projection for the 2022–23 fiscal year, updated for the latest available information for GDP, household income and population.
- footnote[16] Back to paragraph Interest on debt is net of interest capitalized during construction of tangible capital assets of $245 million in 2019–20, $230 million in 2020–21, $321 million in 2021–22, $479 million in 2022–23 and $573 million in 2023–24.
- footnote[17] Back to paragraph Population figures are for July 1 of the fiscal year indicated (i.e., for 2019–20, the population on July 1, 2019 is shown).