Air Quality in Ontario 2014 Report
This annual report, the 44th in a series, summarizes the state of ambient air quality in Ontario during 2014 and examines 10-year trends. It reports on the measured levels of six common air pollutants: ground-level ozone (O3), fine particulate matter (PM2.5), nitrogen dioxide (NO2), carbon monoxide (CO), sulphur dioxide (SO2) and total reduced sulphur (TRS) compounds. The report also summarizes the results from the Air Quality Index (AQI) and Smog Alert programs.
Final Draft
December 4, 2015
2014 Air Quality Report Highlights
- The 2014 air quality report marks 44 years of long-term reporting on the state of air quality in Ontario. This report summarizes province-wide trends for key airborne pollutants affecting Ontario’s air quality.
- Overall, air quality has improved significantly over the past 10 years, especially for nitrogen dioxide (NO2), sulphur dioxide (SO2) and carbon monoxide (CO) – pollutants emitted by vehicles and industry, as well as fine particulate matter (PM2.5) which may be emitted directly into the atmosphere as a by-product of fuel combustion or it may be formed indirectly in the atmosphere through a series of complex chemical reactions.
- Ozone is a secondary pollutant formed when nitrogen oxides (NOX) and volatile organic compounds (VOCs) react in the presence of sunlight. Ozone annual means have increased by 3 per cent from 2005 to 2014; however, ozone summer means have decreased by 8 per cent over the same period.
- Emissions of nitrogen oxides (NOX), CO and SO2 continue to decrease due in part to Ontario’s air quality initiatives such as the phase-out of coal-fired generating stations, emissions trading regulations (O. Reg. 397/01 and O. Reg. 194/05), emissions controls at Ontario smelters, and Drive Clean emissions testing, which supports the federal vehicle emission standards and lower sulphur content in transportation fuels.
| Pollutant | Change Over Time |
|---|---|
| NO2 | ↓ 42% |
| SO2 | ↓ 49% |
| CO | ↓ 40% |
| PM2.5 | ↓ 31% |
| Pollutant | Change Over Time |
|---|---|
| NOX | ↓ 41% |
| SO2 | ↓ 50% |
| CO | ↓ 38% |
| PM2.5 | ↓ 22% |
For more information on Ontario’s air quality, visit the Air Quality Ontario website
Introduction
This annual report, the 44th in a series, summarizes the state of ambient air quality in Ontario during 2014 and examines 10-year trends. It reports on the measured levels of six common air pollutants: ground-level ozone (O3), fine particulate matter (PM2.5), nitrogen dioxide (NO2), carbon monoxide (CO), sulphur dioxide (SO2) and total reduced sulphur (TRS) compounds, and how Ontario is performing compared to the province’s Ambient Air Quality Criteria (AAQC). This report also provides an overview of the Ministry of the Environment & Climate Change’s Air Quality Index (AQI) and Smog Alert programs in addition to the federal Air Quality Health Index (AQHI). Annual statistics, as well as 10 and 20-year trends of ambient air quality data are provided in the attached Appendix.
Fact: An AAQC is a desirable concentration of a contaminant in air, based on protection against adverse effects on health or the environment. The term “ambient” is used to reflect general air quality independent of location or source of a contaminant. AAQCs are most commonly used in environmental assessments, special studies using ambient air monitoring data, assessment of general air quality in a community and annual reporting on air quality across the province. AAQCs are set with different averaging times appropriate for the effect they are intended to protect against.
| Contaminant | 1-hour AAQC | 8-hour AAQC | 24-hour AAQC | Annual AAQC |
|---|---|---|---|---|
| O3 | 80 ppb | n/a | n/a | n/a |
| PM2.5 | n/a | n/a | 28 μg/m3(1) | n/a |
| NO2 | 200 ppb | n/a | 100 ppb | n/a |
| SO2 | 250 ppb | n/a | 100 ppb | 20 ppb |
| CO | 30 ppm | 13 ppm | n/a | n/a |
(1) Reference level based on Canadian Ambient Air Quality Standard (CAAQS).
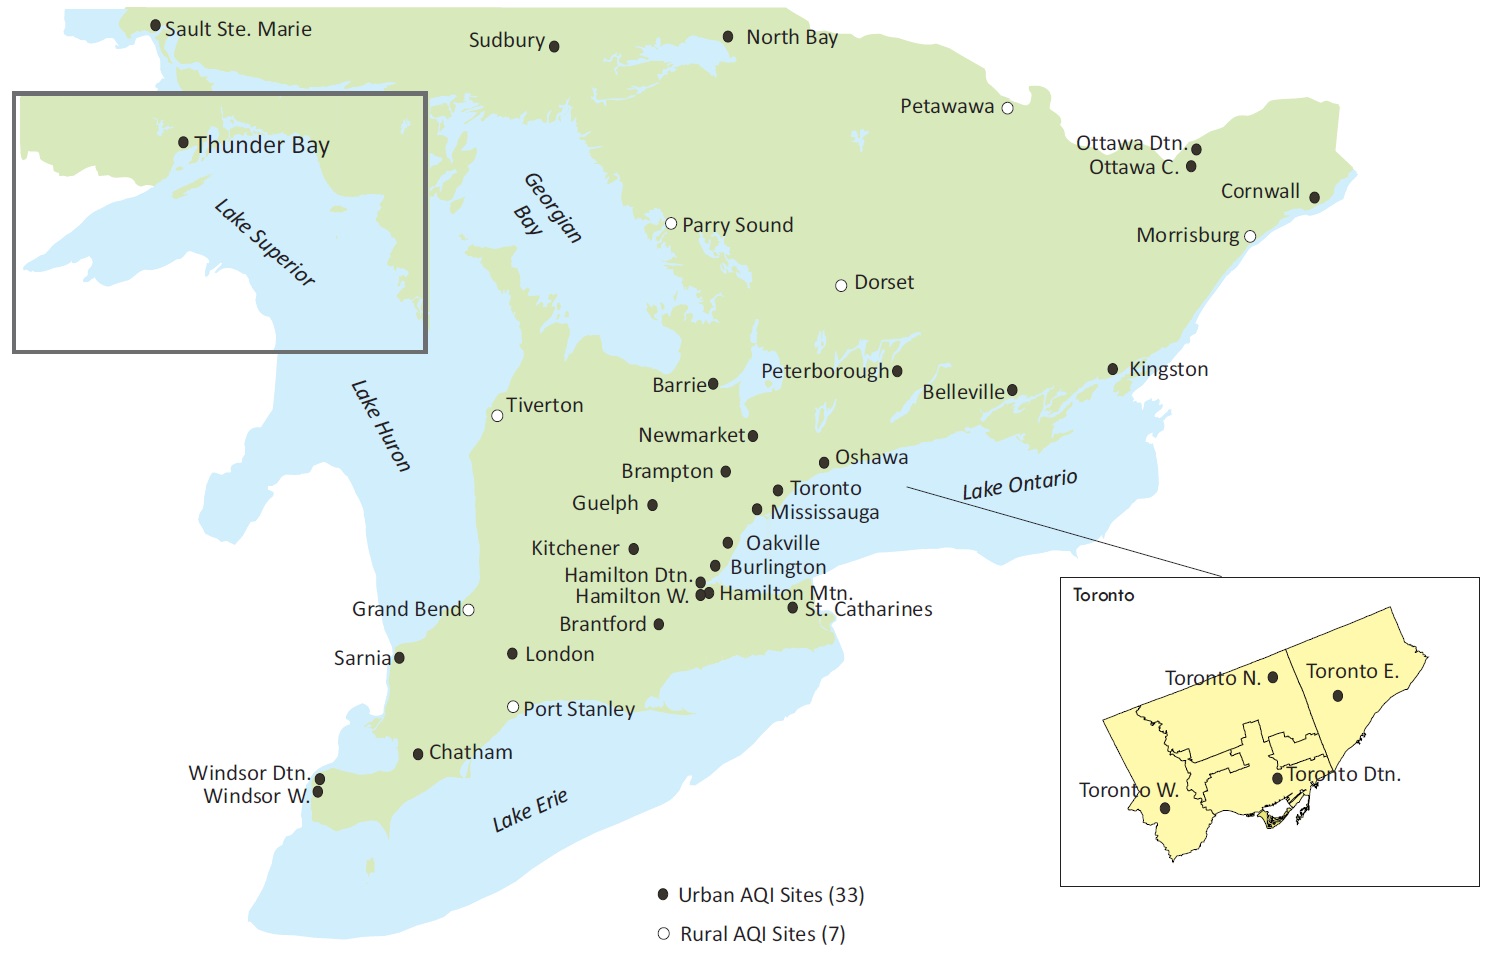
Ontario continues to benefit from one of the most comprehensive air monitoring systems in North America, comprised of 40 monitoring sites across the province that undergo regularly scheduled maintenance and strict data quality assurance and quality control (QA/QC) procedures to ensure a high standard of data quality and data completeness. The data, which are collected continuously at these sites, are used to determine the current state of ambient air quality and are reported every hour on the Air Quality Ontario website.
Ground-Level Ozone (O3)
Ground-level ozone is a gas formed when nitrogen oxides (NOX) and volatile organic compounds (VOCs) react in the presence of sunlight. While ozone at ground level is a significant environmental and health concern, the naturally occurring ozone in the stratosphere, 10 to 40 kilometres above the earth’s surface, is beneficial as it shields the earth from harmful ultraviolet radiation.
Ozone is a colourless, odourless gas at typical ambient concentrations, and is a major component of smog. Ozone is not generally emitted directly into the atmosphere; the formation and transport of ozone is strongly dependent on meteorological conditions and emissions of chemical precursors, particularly NOX and VOCs. Changing weather patterns contribute to differences in ozone concentrations hour-to-hour, day-to-day, season-to-season, and year-to-year. In Ontario, the highest concentrations of ground-level ozone are typically recorded on hot and sunny days from mainly May to September, between noon and early evening.
Ozone irritates the respiratory tract and eyes. Exposure to ozone in sensitive people can result in chest tightness, coughing and wheezing. Children who are active outdoors during the summer, when ozone levels are highest, are particularly at risk. Individuals with pre-existing respiratory disorders, such as asthma and chronic obstructive pulmonary disease (COPD), are also at risk. Ozone is associated with increased hospital admissions and premature deaths. Ozone also causes many losses in agricultural crops each year in Ontario, with visible leaf damage in many crops, garden plants and trees, especially during the summer months.
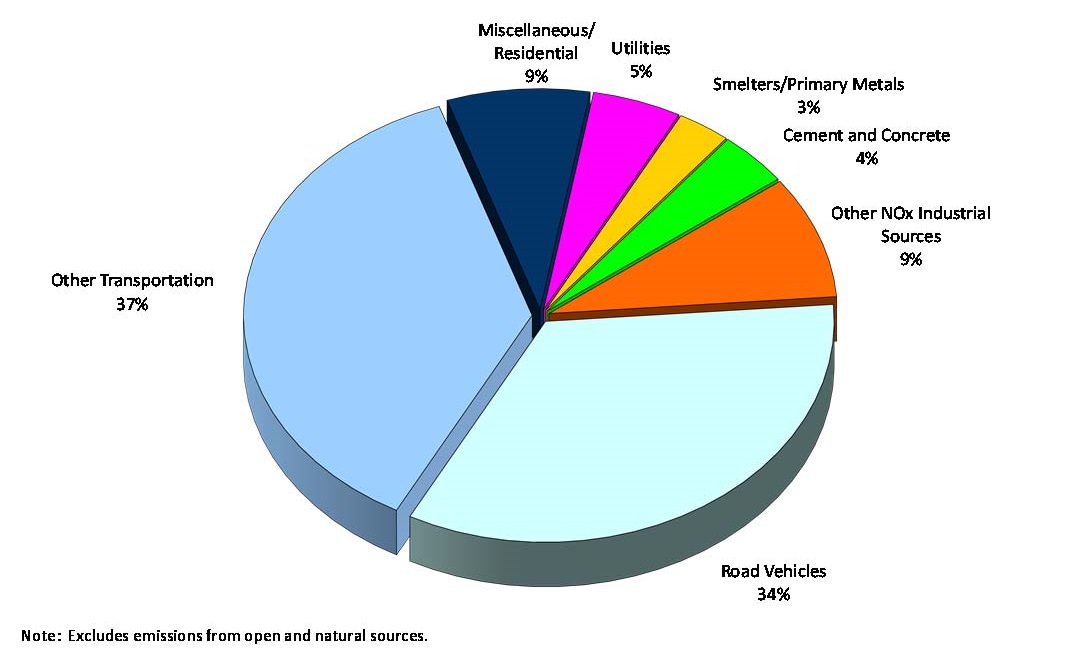
Figure 1 shows the estimates of Ontario’s VOCs emissions from point, area and transportation sources. Transportation sectors accounted for approximately 28 per cent of VOCs emissions and the second largest source was general solvent use accounting for approximately 24 per cent. Figure 2 shows the estimates for Ontario’s NOX emissions from point, area and transportation sources. The transportation sectors accounted for approximately 71 per cent of NOX emissions (NPRI, 2015).
Figure 1: Ontario VOCs emissions by sector (2013 estimates for point/area/transportation sources)
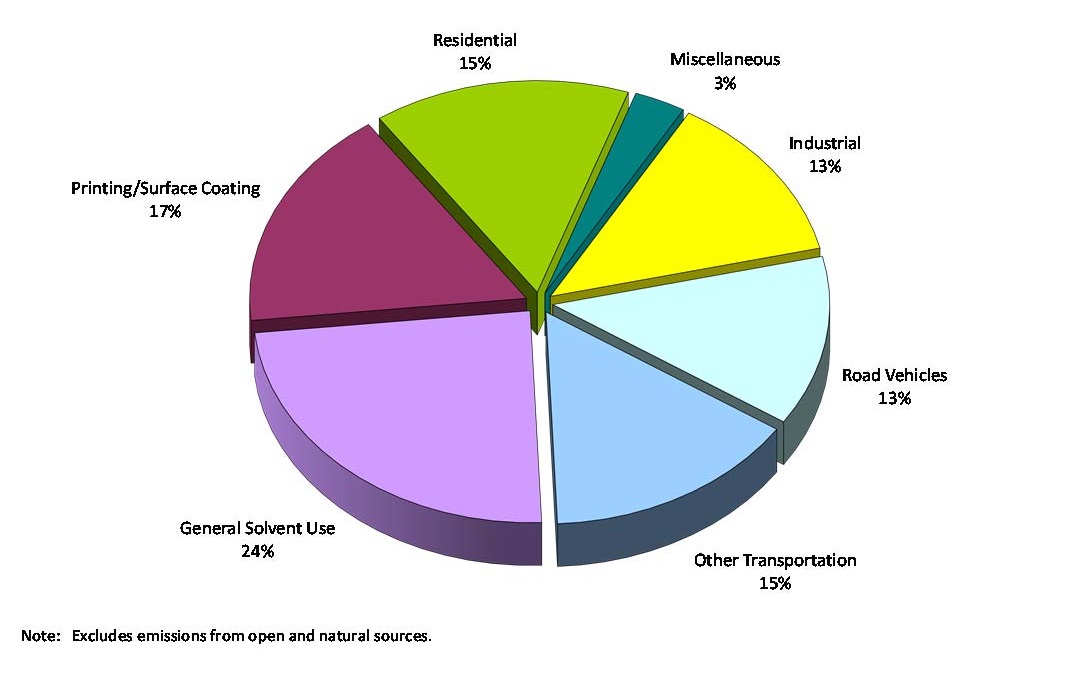
Figure 2: Ontario NOX emissions by sector (2013 estimates for point/area/transportation sources)
In 2014, ozone was monitored at the ministry’s 40 AQI sites. The highest annual mean was 32.3 parts per billion (ppb), measured at Port Stanley, a transboundary-influenced site on the northern shore of Lake Erie. The lowest annual mean, 21.1 ppb, was measured at Toronto West, an urban site located near a major transportation corridor, Highway 401, and directly impacted by local nitric oxide (NO) emissions from vehicles. Generally, ozone concentrations are lower in urban areas because ozone is depleted by reacting with NO emitted by vehicles and other local combustion sources.
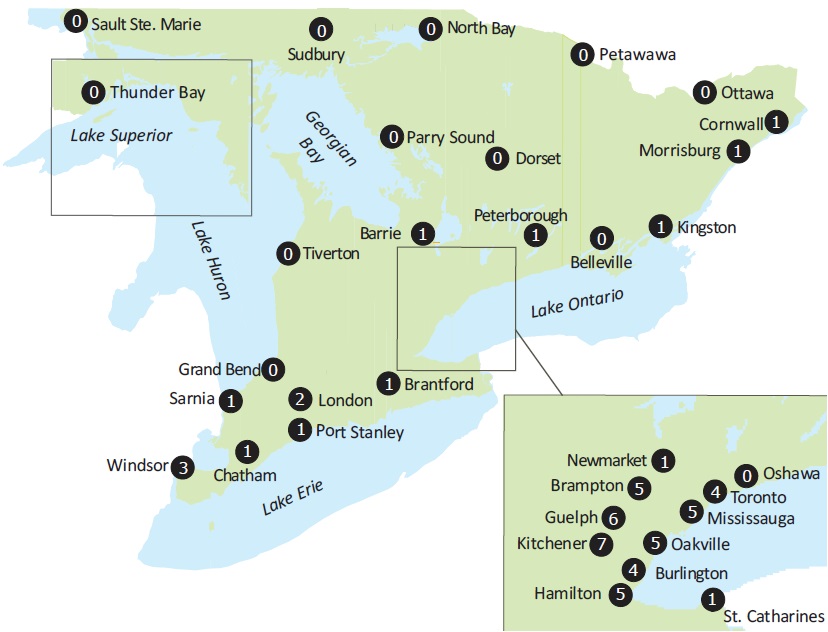
Ground-level ozone concentrations exceeded the provincial one-hour Ambient Air Quality Criterion (AAQC) of 80 ppb at 8 sites in 2014. These 8 sites measured ozone levels above 80 ppb for at least one hour in 2014. The maximum one-hour ozone concentrations ranged from 63 ppb recorded at Ottawa Central, to 90 ppb recorded in Grand Bend. Ontario’s one- hour AAQC for ozone was exceeded the most often at Grand Bend on 4 occasions. The geographical distribution of one-hour ozone exceedances across the province is shown in Figure 3.
Figure 3: Geographical Distribution of the # of Hours Above the One‐Hour Ozone AAQC Across Ontario in 2014

The ozone exceedances reported in southwestern Ontario, on the eastern shore of Lake Huron and on the northern shore of Lake Erie, are typically resulting from transboundary flow of pollutants. As stated in the Transboundary Air Pollution in Ontario report, elevated ozone levels in southwestern Ontario are generally attributed to the long-range transport of pollutants from the United States (Yap et al, 2005).
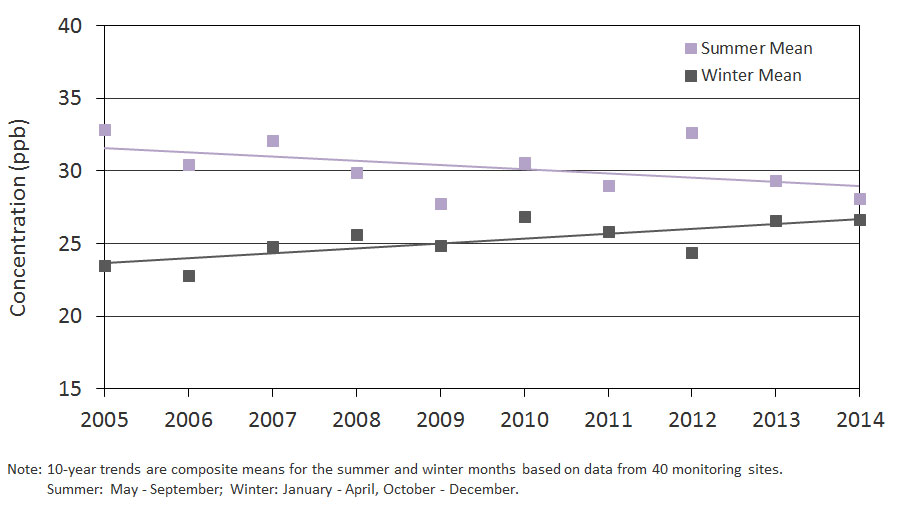
The ozone annual means in Figure 4 display an increasing trend of 3 per cent for the 10-year period from 2005 to 2014. The trend of ozone summer means and ozone winter means are shown in Figure 5. The ozone summer means trend decreased by 8 per cent from 2005 to 2014, whereas the ozone winter means have increased by 13 per cent over the same 10- year period. The decrease in summer means over the past 10 years is largely due to the progressive reductions of NOX emissions in Ontario and the U.S. resulting in the decrease in local ozone formation and transboundary influences especially during the summer months. The increase in the ozone winter means are mainly attributed to the rising global background concentrations which in turn drives the increasing trend of ozone annual means (Reid et al, 2008). In general, even with the increase in ozone winter means, ozone concentrations during the winter months continue to remain well below the Ontario AAQC of 80 ppb.
Figure 4: Trend of Ozone Annual Means Across Ontario (2005‐2014)
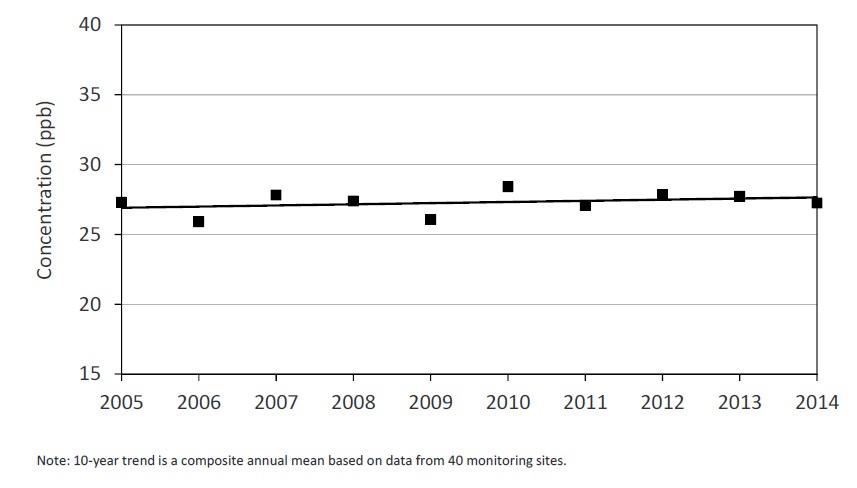
Figure 5: Trend of Ozone Summer and Winter Means Across Ontario (2005‐2014)
Fine Particulate Matter (PM2.5)
Airborne particulate is the general term used to describe a mixture of microscopic solid particles and liquid droplets suspended in air. Particulate matter is classified according to its aerodynamic size, mainly due to the different health effects associated with particles of different diameters. Fine particulate matter, denoted as PM2.5, refers to respirable particles that are less than 2.5 micrometres in diameter, approximately 30 times smaller than the average diameter of a human hair. Due to their small size, they can penetrate deep into the lungs.
Particulate matter includes aerosols, smoke, fumes, dust, fly ash and pollen. Its composition is complex and varies with origin, residence time in the atmosphere, time of year and environmental conditions. Major components of PM2.5 in Ontario are typically nitrates, sulphates, organic matter and particle-bound water. Higher nitrate levels are common in the cooler months whereas sulphates are more elevated during warm temperatures. Fine particulate matter may be emitted directly into the atmosphere as a by-product of fuel combustion or it may be formed indirectly in the atmosphere through a series of complex chemical reactions. Major sources of PM2.5 include motor vehicles, smelters, power plants, industrial facilities, residential fireplaces and wood stoves, agricultural burning and forest fires.
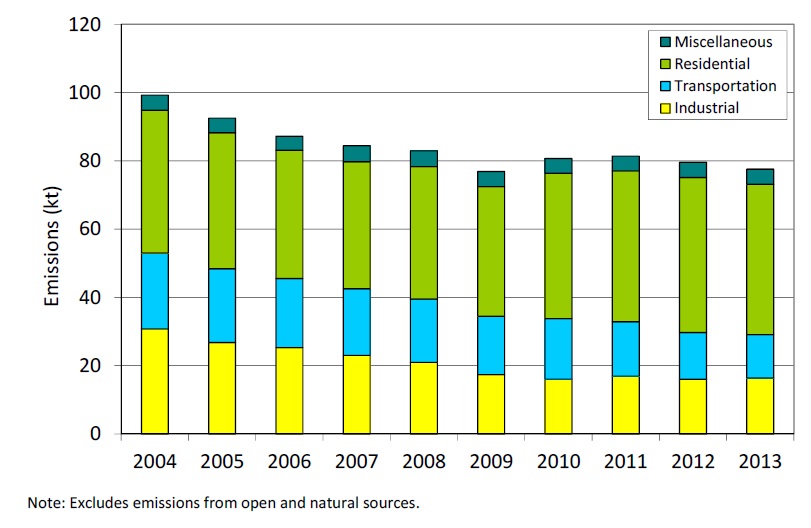
The 2013 estimates for Ontario’s PM2.5 emissions from point, area and transportation sources (excluding emissions from open and natural sources) indicate residential fuel combustion accounted for 57 per cent. The major contributor to residential emissions is fuel wood combustion in fireplaces and wood stoves. Industrial processes and transportation sectors accounted for 21 per cent and 16 per cent, respectively (NPRI, 2015).
In 2013, as part of a national initiative funded by Environment Canada, Ontario upgraded all PM2.5 monitors across the ambient air monitoring network and started reporting with this new technology. While annual means and maximums are reported for 2014, 10-year trends for the entire ambient air monitoring network cannot be determined since the 2013 and 2014 PM2.5 data set is not directly comparable to data collected using the older technology. Ontario’s new PM2.5 measurement technology and 10-year trends are discussed further in Technical Discussion - New PM2.5 Measurement Technology in Ontario.
In 2014, 27 of the 40 AQI sites exceeded Ontario’s 24-hour PM2.5 reference level of 28 μg/m3 on at least one occasion. The PM2.5 24-hour maximum concentrations ranged from 17 μg/m3 in both Petawawa and Sault Ste. Marie to 46 μg/m3 recorded at Hamilton West. The 2014 PM2.5 annual mean concentrations ranged from 4.7 μg/m3 in Petawawa to 10.8 μg/m3 in downtown Hamilton. The geographical distribution of 24-hour PM2.5 exceedances above the 28 μg/m3 reference level across the province is shown in Figure 6.
Figure 6: Geographical Distribution of the # of Days Above the 24‐Hour PM2.5 Reference Level Across Ontario in 2014
The number of days above the 28 μg/m3 reference level is generally highest in border communities that are affected by transboundary pollutants, and in urban areas. During periods of elevated concentrations of PM2.5 in Ontario, notwithstanding forest fires, it is estimated that there are significant contributions from the U.S., specifically affecting border communities (Yap et al, 2005). Higher PM2.5 concentrations are often observed in urban areas during the winter months and are typically associated with relatively stagnant conditions and the development of strong temperature inversion conditions overnight, which can lead to pollutants being trapped at the surface.
Provincial PM2.5 emissions have decreased approximately 22 per cent from 2004 to 2013 as shown in Figure 7. Fine particulate matter emissions from electric utilities and industrial processes have been reduced approximately 47 per cent during this period. Emissions from the transportation sector decreased 43 per cent with the phase-in of new vehicles/engines having more stringent emission standards over the same period.
Figure 7: Ontario PM2.5 Emissions Trend (2004‐2013)
Technical Discussion
New PM2.5 Measurement Technology in Ontario
In 2002 Ontario became the first province in Canada to report hourly PM2.5 concentrations to the public under the AQI program utilizing Tapered Element Oscillating Microbalance (TEOM) instruments that provided continuous particulate matter (PM) monitoring. Continuous PM monitoring is essential for reporting hourly ambient concentrations. The TEOM was the most innovative method at the time for continuous real-time PM2.5 monitoring (Patashnick and Rupprecht, 1991), and continues to be used by many jurisdictions across North America.
Over the last decade, continuous PM2.5 monitoring technologies have evolved dramatically to address the technical issues associated with cold weather PM2.5 measurements. After extensive evaluation of four new PM2.5 monitors, it was determined that Ontario’s TEOM instruments did not perform as well as these new PM2.5 monitors, particularly during the winter. Ontario selected the Synchronized Hybrid Ambient Real-time Particulate (SHARP) 5030 to replace the aging TEOM monitors deployed in the AQI network. As part of a national initiative funded by Environment Canada, Ontario deployed the SHARP 5030 monitors in 2012 across the ambient air monitoring network for testing. In January 2013, Ontario commenced public reporting with the new SHARP 5030 instruments. The SHARP 5030 reports higher PM2.5 concentrations than the TEOM analyzer during cold weather due to the improved performance of the SHARP 5030 (Sofowote et al, 2014). This has resulted in an increase in Ontario’s PM2.5 annual mean in 2013 and 2014, however this is not an indication that the air quality has changed; only that the measurement is more accurate.
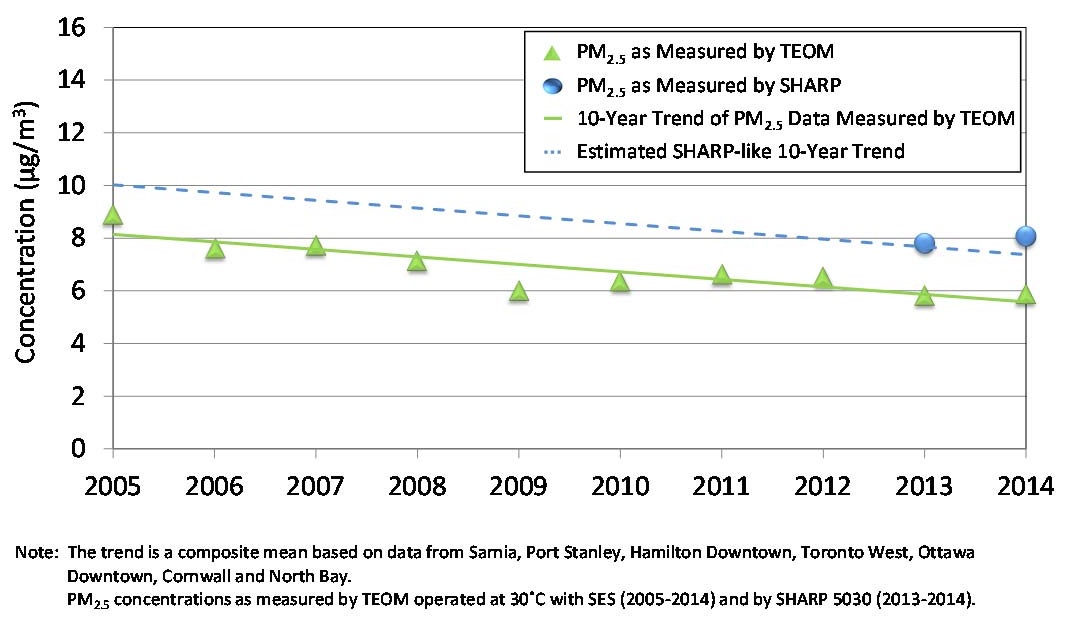
A network-wide trend using historical TEOM and 2013/2014 SHARP data cannot be determined as the two datasets are not directly comparable. In anticipation of this, TEOM and SHARP monitors were collocated at a sub-set of the air monitoring network to continue reporting annual trends and work towards making the new PM2.5 measurements comparable to historical data. Seven sites including Sarnia, Port Stanley, Hamilton Downtown, Toronto West, Ottawa Downtown, Cornwall and North Bay, were selected to be representative of Ontario’s PM2.5 network, taking into consideration the differences in air quality across the province. The 10-year PM2.5 trend for these sites, using TEOM technology, continues to show a decrease of PM2.5 levels. For the period of 2005 to 2014 a decrease of 31 per cent was observed (Figure 8). Additionally, Ontario developed corrections for historical TEOM measurements, for the fall and winter seasons, for the purpose of making them more comparable to SHARP measurements through a multiple linear regression analysis. This analysis, using collocated TEOM and SHARP instruments, showed that on average, annual SHARP measurements were 25 per cent higher than TEOM measurements (Sofowote et al, 2014). Using this as an approximate correction factor, Figure 8 displays an estimated SHARP-like 10-year trend that parallels the TEOM trend, and illustrates that Ontario’s air quality is still improving based on measurements using the new technology.
Figure 8: Trend of PM2.5 Annual Means at Select Sites Across Ontario (2005 - 2014)
With more accurate, but higher, reported PM2.5 values resulting from the implementation of SHARP instruments, achievement of PM2.5 reference levels and standards may be more challenging. In 2014, Kitchener exceeded the 24h PM2.5 reference level of 28 μg/m3 on 7 occasions, more than any other station in Ontario. Most of these days at Kitchener were marginally above the 28 μg/m3 reference level.
Other Air Pollutants
Nitrogen Dioxide (NO2)
Nitrogen dioxide is a reddish-brown gas with a pungent odour, which transforms in the atmosphere to form gaseous nitric acid and nitrates. It plays a major role in atmospheric reactions that produce ground-level ozone, a major component of smog. Nitrogen dioxide also reacts in the air and contributes to the formation of PM2.5 (Seinfeld & Pandis, 2006). All combustion in air produces NOX, of which NO2 is a component. Major sources of NOX emissions include the transportation sector, industrial processes and utilities.
Nitrogen dioxide can irritate the lungs and lower their resistance to respiratory infection. People with asthma and bronchitis have increased sensitivity to NO2. Nitrogen dioxide chemically transforms into nitric acid in the atmosphere and, when deposited, contributes to the acidification of lakes and soils in Ontario. Nitric acid can also corrode metals, fade fabrics, degrade rubber, and damage trees and crops.
There were no exceedances of the provincial one-hour and 24-hour AAQC for NO2, 200 ppb and 100 ppb, respectively, at any of the monitoring locations in Ontario during 2014. The Toronto West air monitoring station, located in an area of Toronto influenced by significant vehicular traffic, recorded the highest NO2 annual mean (17.1 ppb) during 2014; whereas Tiverton, a rural site, recorded the lowest NO2 annual mean (2.7 ppb). The highest NO2 means were recorded in large urbanized areas, such as the Greater Toronto Area of southern Ontario. The Toronto East station recorded the highest one-hour NO2 concentration (89 ppb), and Toronto West recorded the highest 24-hour NO2 concentration (51 ppb). Both of these stations are located in close proximity to major roadways, and are designated as road-side monitoring stations.
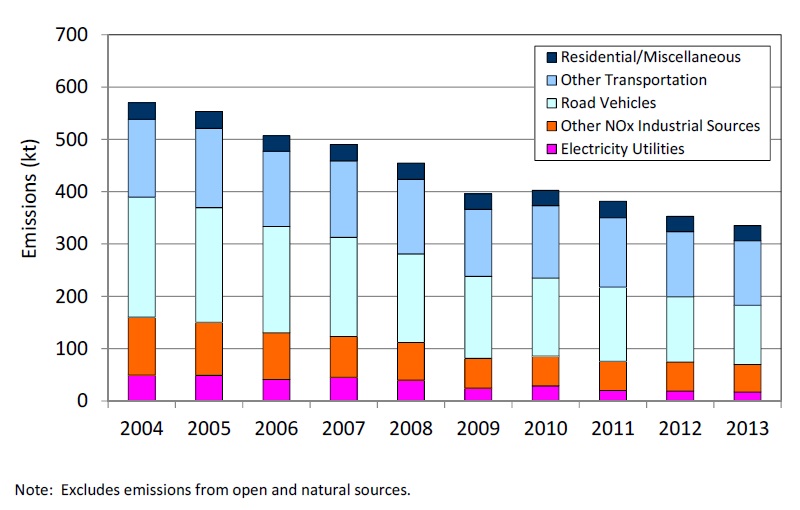
The NO2 annual mean concentrations across Ontario have decreased 42 per cent from 2005 to 2014, as displayed in Figure 9. The NOX emission trend from 2004 to 2013 indicates a decrease of approximately 41 per cent as shown in Figure 10 (NPRI, 2015). Ontario’s emissions trading regulations on sulphur dioxide and nitrogen oxides (O. Reg. 397/01 and O. Reg. 194/05) have contributed to the reduction in nitrogen oxides emissions in recent years. Nitrogen oxides emissions from on-road vehicles have also decreased due to the phase-in of new vehicles having more stringent emission standards. The implementation of the Ontario Drive Clean program in southern Ontario in 1999 has also helped further reduce the NOX emissions from light duty gasoline vehicles.
Figure 9: Trend of NO2 Annual Means Across Ontario (2005‐2014)
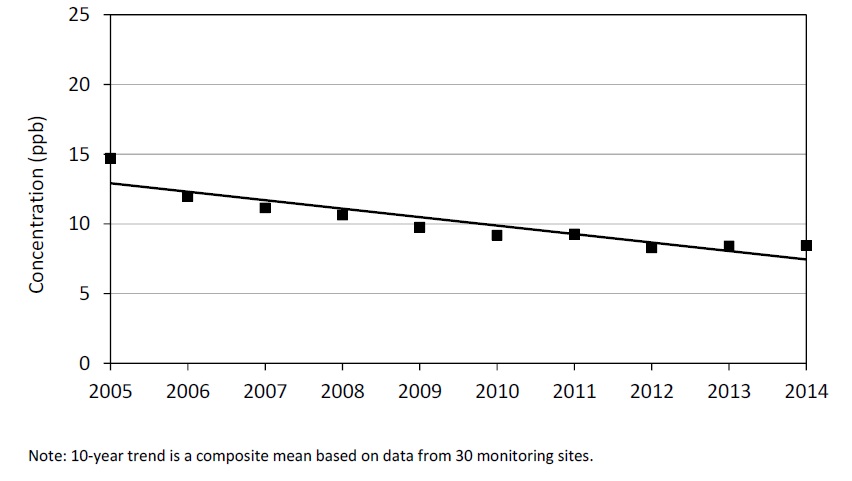
Figure 10: Ontario NOX Emissions Trend (2004 to 2013)
Sulphur Dioxide (SO2)
Sulphur dioxide is a colourless gas that smells like burnt matches. It can also be oxidized in the atmosphere to form sulphuric acid aerosols. In addition, sulphur dioxide is a precursor to sulphates, one of the main components of airborne secondary PM2.5. Major sources of SO2 include smelters, industrial processes and electric utilities.
Health effects caused by exposure to high levels of SO2 include breathing problems, respiratory illness, and the exacerbation of respiratory and cardiovascular disease. People with asthma, chronic lung disease or heart disease are the most sensitive to SO2. Sulphur dioxide damages trees and crops. Similar to NO2, SO2 leads to the formation of PM2.5 and is also a precursor to acid rain, which contributes to the acidification of soils, lakes and streams, accelerated corrosion of buildings, and reduced visibility.
Smelters in central Ontario are the major sources of SO2 emissions in Ontario, accounting for approximately 68 per cent of the provincial SO2 emissions according to 2013 estimates for point, area and transportation sources (excluding emissions from open and natural sources). Electric utilities and other industrial processes (e.g. petroleum refining, cement and concrete manufacturing) accounted for an additional 29 per cent. The transportation sector and miscellaneous sources accounted for the remaining 3 per cent of all SO2 emissions in the province (NPRI, 2015).
There were no exceedances of the provincial 24-hour and annual AAQC for SO2 of 100 ppb and 20 ppb, respectively, at any of the monitoring locations in Ontario during 2014. There was one exceedance of the provincial one-hour AAQC for SO2 of 250 ppb in Sudbury. Hamilton Downtown recorded the highest SO2 annual mean (5.1 ppb) during 2014, and the highest 24-hour maximum concentration (40 ppb) was recorded at both Hamilton Downtown and Sarnia. Sudbury recorded the highest one-hour maximum concentration (297 ppb) during 2014.
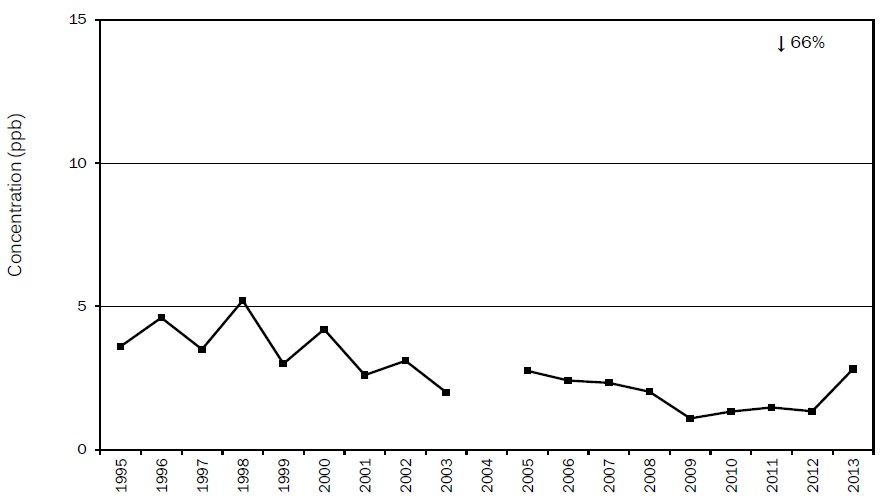
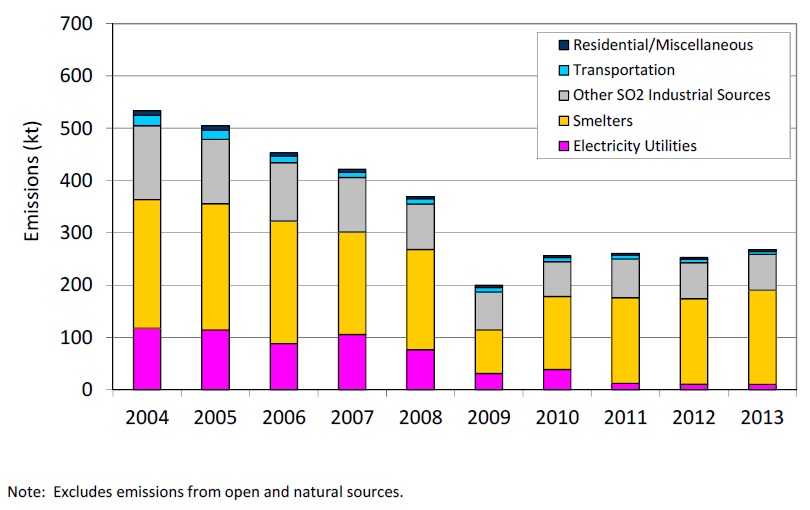
The SO2 annual mean concentrations from 2005 to 2014 show a decreasing trend of 49 per cent across Ontario in Figure 11. Overall, provincial SO2 emissions have decreased by approximately 50 per cent from 2004 to 2013 as shown in Figure 12 (NPRI, 2015). The reduction of SO2 emissions over the years is the result of various initiatives, which include, but are not limited to,
- Control orders for Ontario smelters;
- Countdown Acid Rain program and Canada-wide Acid Rain Strategy;
- Ontario emissions trading regulations on sulphur dioxide and nitrogen oxides (O. Reg. 397/01 and O. Reg. 194/05);
- Cessation of coal use in electricity generation; and
- Low sulphur content in transportation fuels.
NOX and SO2 electricity sector emissions trading regulation (O. Reg. 397/01) placed limits on Ontario Power Generation’s (OPG) fossil fuel-fired generating stations starting 2002. Effective January 1, 2004 the program also applied to independent power producers (IPPs). The trading program was expanded in 2006 to include thirty facilities from seven industrial sectors. NOX and SO2 for electricity generators covered under the trading program have fallen by approximately 80% and 98% respectively between 2004 and 2014, largely because of coal closure. NOX and SO2 emissions for the industrial facilities regulated under the program have fallen by approximately 29% and 26% between 2006 and 2014. This decline is the result of a combination of factors including emissions reduction initiatives undertaken by facilities covered by the program and industry restructuring.
Figure 11: Trend of SO2 Annual Means Across Ontario (2005‐2014)
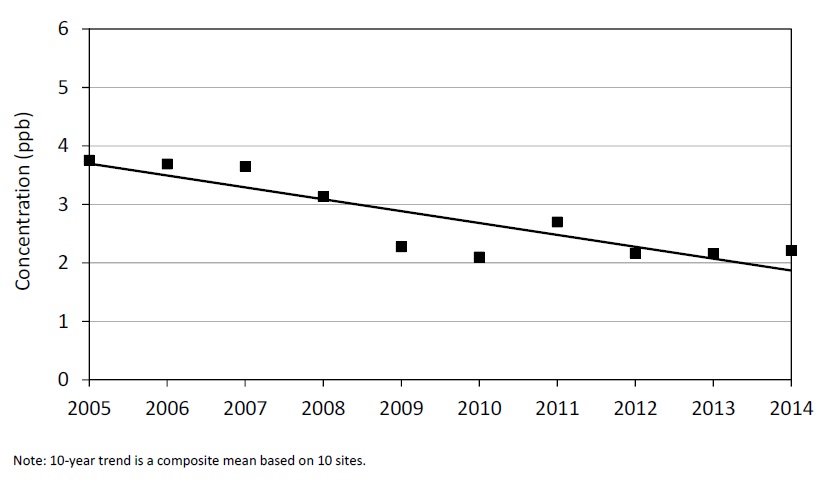
Figure 12: Ontario SO2 Emissions Trend (2004‐2013)
Carbon Monoxide (CO)
Carbon monoxide is a colourless, odourless, tasteless and, at high concentrations, poisonous gas. This gas can enter the bloodstream and reduce oxygen delivery to the organs and tissues. People with heart disease are particularly sensitive to CO. Exposure to high CO levels is associated with the impairment of vision, work capacity, learning ability and performance of complex tasks. Carbon monoxide is produced primarily by the incomplete combustion of fossil fuels. The 2013 estimates for point, area and transportation sources (excluding emissions from open and natural sources) indicate that the transportation sector accounted for 70 per cent of all CO emissions (NPRI, 2015).
In 2014 there were no exceedances of the provincial one-hour and eight-hour AAQC of 30 ppm and 13 ppm, respectively, at any of the monitoring locations in Ontario. Hamilton Downtown recorded the highest one-hour CO maximum of 2.88 parts per million (ppm) and Toronto West recorded the highest eight-hour maximum (1.07 ppm). Typically, higher CO concentrations are recorded in urban centres attributable to vehicle emissions.
The composite means of the one-hour and eight-hour CO maximums have decreased 40 per cent and 42 per cent, respectively, across the province from 2005 to 2014. Carbon monoxide emissions have been reduced by approximately 38 per cent from 2004 to 2013 (NPRI, 2015).
Canadian Ambient Air Quality Standards
In May of 2013 the federal government published the Canadian Ambient Air Quality Standards (CAAQS) as non-binding objectives under the Canadian Environmental Protection Act. The CAAQS were developed under the auspices of the Canadian Council of Ministers of the Environment (CCME) as outdoor air quality targets that “set the bar” for air quality actions across the country.
The CAAQS replaced the existing Canada-wide Standards (CWS) for ozone and PM2.5 in 2013 by setting stricter targets, and introducing an annual standard for PM2.5. An annual standard helps protect human health from long-term or chronic exposure to fine particles. The purpose of the CAAQS is to drive continuous improvement in air quality. Ontario’s ambient air quality will be compared to the new standards for the first time in 2015. Table 5.1 shows the standards for the 2015 target date for achieving the CAAQS.
| Type | Ozone 8h | PM2.5 24h | PM2.5 Annual |
|---|---|---|---|
| CAAQS | 63 ppb(1) | 28 μg/m3(2) | 10 μg/m3(3) |
(1) based on the annual 4th highest daily maximum eight-hour running average, averaged over three consecutive years.
(2) based on the 98th percentile measurement annually, averaged over three consecutive years.
(3) based on the annual mean averaged over three consecutive years.
Table 5.2 displays the ozone and PM2.5 CAAQS metric values for CAAQS designated Ontario sites for 2014 (based on a three-year average, 2012-2014). The 2014 ozone CAAQS metric values ranged from 54 ppb reported for Thunder Bay to 73 ppb reported for Windsor Downtown. Only two of the 21 designated sites, Ottawa and Thunder Bay, met the CAAQS of 63 ppb for ozone in 2014. The 2014 24-hour PM2.5 CAAQS metric values ranged from 14 μg/m3 reported for both Sudbury and Thunder Bay to 25 μg/m3 reported for Hamilton Downtown. The 2014 annual PM2.5 CAAQS metric concentrations ranged from 5.2 μg/m3 reported for Sudbury to 9.7 μg/m3 reported for Hamilton Downtown. There were no exceedances of either PM2.5 CAAQS in 2014 at any of the 21 CAAQS designated sites.
| City/Town | 8h Ozone (ppb) | 24h PM2.5 μg/m3 | Annual PM2.5 μg/m3 |
|---|---|---|---|
| Windsor Downtown | 73* | 21 | 8.9 |
| Chatham | 71* | 18 | 7.6 |
| London | 71* | 21 | 8.1 |
| Brantford | 70* | 21 | 8.0 |
| Kitchener | 68* | 22 | 8.0 |
| Guelph | 69* | 20 | 7.6 |
| St. Catharines | 67* | 19 | 7.9 |
| Hamilton Downtown | 65* | 25 | 9.7 |
| Hamilton Mountain | 69* | 22 | 8.4 |
| Burlington | 68* | 22 | 8.2 |
| Oakville | 68* | 20 | 7.5 |
| Mississauga | 66* | 21 | 7.5 |
| Brampton | 68* | 21 | 7.7 |
| Toronto | 69* | 21 | 8.1 |
| Oshawa | 65* | 18 | 6.9 |
| Barrie | 64* | 19 | 6.9 |
| Peterborough | 67* | 17 | 6.4 |
| Kingston | 70* | 19 | 6.7 |
| Ottawa Downtown | 59 | 18 | 6.3 |
| Sudbury | 64* | 14 | 5.2 |
| Thunder Bay | 54 | 14 | 5.7 |
Note:
Designated sites include communities with populations greater than 100,000.
The CAAQS for ozone is based on the consecutive three year average of the annual 4th highest daily maximum eight-hour running average.
The CAAQS for 24h PM2.5 is based on the 98th percentile measurement annually, averaged over three consecutive years.
The CAAQS for annual PM2.5 is based on the annual mean averaged over three consecutive years. Toronto reporting is based on Toronto Downtown, Toronto North, Toronto East and Toronto West stations.
*Indicates an exceedance of the CAAQS
Outdoor concentrations of ozone and PM2.5 can be influenced by emission sources that are outside the control of provinces and territories, such as transboundary flows and exceptional events including forest fires. The Guidance Document on Achievement Determination for the Canadian Ambient Air Quality Standards for Fine Particulate Matter and Ozone (2012) guides provinces and territories in the consideration of transboundary flows and exceptional events when implementing management actions, and in conveying to the public that a standard was not achieved as a result of these influences.
To demonstrate the influence of transboundary flows, a preliminary weight of evidence (WOE) analysis was conducted for selected sites, Windsor Downtown, Toronto, Sudbury and Kitchener, where the ozone CAAQS was exceeded in 2014. A comprehensive network-wide assessment of transboundary influence using WOE will be completed for 2015, the first year that achievement will be assessed relative to the CAAQS. The WOE approach consists of performing, evaluating and documenting a series of technical analyses that collectively support the conclusion that exceedances of the standard using WOE on a given day were influenced by, in this case, transboundary flows. Table 5.3a shows the 2014 ozone CAAQS metric values including and excluding transboundary flow days for Windsor Downtown, Toronto, Sudbury and Kitchener. The WOE approach confirms that these four Ontario cities listed in Table 5.3a would have met the ozone CAAQS if they had not been influenced by days with transboundary flow. Table 5.3b displays the number of transboundary flow days that were removed for each of the four sites using WOE.
| City | Transboundary Flow Days | 4th Highest Daily Max 8h Running Average | 3y CAAQS Metric Value | ||
|---|---|---|---|---|---|
| 2012 | 2013 | 2014 | |||
| Windsor Downtown | included | 82.9 | 68.0 | 69.3 | 73* |
| Windsor Downtown | excluded | 62.3 | 57.4 | 60.0 | 60 |
| Toronto | included | 76.3 | 67.2 | 64.0 | 69* |
| Toronto | excluded | 53.8 | 62.0 | 57.4 | 58 |
| Sudbury | included | 72.8 | 60.8 | 59.0 | 64* |
| Sudbury | excluded | 52.3 | 60.8 | 59.0 | 57 |
| Kitchener | included | 73.5 | 65.6 | 64.9 | 68* |
| Kitchener | excluded | 58.5 | 54.6 | 55.8 | 56 |
Note: Ozone concentrations reported in ppb.
*Indicates an exceedance of the CAAQS
| City/Town | 2012 | 2013 | 2014 |
|---|---|---|---|
| Windsor Downtown | 40 | 17 | 15 |
| Toronto | 43 | 4 | 7 |
| Sudbury | 27 | 0 | 0 |
| Kitchener | 30 | 19 | 15 |
Transboundary influences, mainly from the U.S., account for approximately half of Ontario’s smog on high concentration days. Emission reductions in Ontario and the U.S. have contributed to decreases in PM2.5 and ozone precursors. However, while outdoor concentrations have improved, the province continues to experience high levels of ozone due to transboundary air pollution which can result in exceedances of the ozone standard. It is therefore important to consider the influence of transboundary flows using WOE for each CAAQS designated monitoring station when reporting on achievement of the CAAQS.
Air Quality Index and Smog Advisories
Ontario Air Quality Index (AQI)
The Air Quality Office of the Environmental Monitoring and Reporting Branch continuously collects near real-time data for criteria pollutants from 40 AQI sites as displayed in Map A1 of the Appendix. The AQI, based on pollutants that have adverse effects on human health and the environment, includes O3, PM2.5, NO2, SO2, CO and TRS compounds. At the end of each hour, the concentration of each pollutant measured at each site is converted into a number ranging from zero upwards using a common scale or index. The calculated number for each pollutant is a sub-index value. At a given air monitoring site, the highest sub-index value for any given hour becomes the reporting AQI for that hour. The index is a relative scale, in that the lower the index, the better the air quality. Index values between 0 and 15 are very good, 16-31 good, 32-49 moderate, 50-99 poor, and 100+ are very poor. The Air Quality Ontario website provides index values, corresponding categories, and potential health and environmental effects.
Based on the AQI categories, in 2014, Ontario reported very good to good air quality 94 per cent of the time, and moderate to poor air quality 6 per cent of the time. Table A19 of the Appendix provides the percentage distribution of hourly AQI readings for each of the 40 monitoring sites by AQI category and the number of poor air quality days.
Smog Advisories
Smog advisories are issued to the public in advance when AQI values are expected to be in the poor category due to elevated, widespread and persistent levels, generally 3 or more hours in duration. Smog advisories are typically issued for elevated levels of O3 and/or PM2.5 but can be issued for other pollutants. Smog advisories are usually issued 24 hours in advance; however, if elevated smog conditions occur suddenly, and weather conditions conducive to elevated smog levels are expected to continue for several hours, a smog advisory is issued effective immediately. Note that a smog advisory is a forecast and does not necessarily mean elevated smog is a certainty since it is based on weather forecasts.
Smog advisories are issued via the Air Quality Ontario website, and through email notification as per the Smog Alert Network. (To receive a direct email notification of a smog advisory, visit the ministry web site and subscribe to the Smog Alert Network).
2014 was the first time since the start of the program in 1993 that no smog advisories were issued in Ontario. This can be attributed to reductions in both emissions and pollutant concentrations, along with a relatively cool summer in 2014. Table A20 of the Appendix summarizes the number of smog advisories issued for Ontario from 2005 to 2014.
Access to air quality information
Near real-time and historic pollutant concentration data and index values are available to the public (24 hours per day, 7 days a week) from across the province on the ministry’s web site. The public can also access index values via the Interactive Voice Response (IVR) system. (To access an English recording, call 1.800.387.7768, or in Toronto, call 416.246.0411. For a French recording, call 1.800.221.8852). The ministry’s web site also provides daily air quality forecasts, based on regional meteorological conditions and current pollution levels in Ontario and bordering U.S. states.
Federal air quality health index (AQHI)
In September 2006, Health Canada proposed the AQHI, an air quality health index that derives a value based on the cumulative health effects of three pollutants – O3, PM2.5 and NO2. It is being developed and implemented by Health Canada with the assistance of Environment Canada and all provinces. The AQHI for Canada informs the public about health risks associated with air quality and encourages the public to make their own decisions or modify their behaviour depending on how they are individually affected by air quality. In 2007, the ministry began participating in the development of the national AQHI by providing Environment Canada with air quality data for a pilot program taking place in the Greater Toronto Area (GTA) including Burlington, Oakville, Mississauga, Brampton, Newmarket, Toronto and Oshawa. This pilot program was then expanded over the years to include Windsor, London, Hamilton, St. Catharines, Peterborough, Kingston, Ottawa, Barrie, Dorset and Sault Ste. Marie.
In 2014, the ministry established an AQHI Steering Committee, which includes representatives from the Ministry of Health and Long-Term Care (MOHLTC) and the federal government (Health Canada and Environment Canada), to determine the best path forward for reporting air quality in the province. The ministry intends to implement the AQHI across Ontario in 2015 by combining the best features of the AQI and the federal AQHI to report on air quality and associated health information for Ontarians. For more information on the federal AQHI, please visit the Air Quality Health Index website.
Glossary
- Air Quality Index
- real-time information system that provides the public with an indication of air quality in cities, towns and in rural areas across Ontario.
- AQI station
- continuous monitoring station used to inform the public of general ambient air quality levels over an entire region (not a localized area) on a real-time basis; station reports on criteria pollutant levels that are not unduly influenced by a single emission source, but rather are the result of emissions from multiple sources, including those in neighbouring provinces and states.
- Ambient air
- outdoor or open air.
- Annual mean
- the average value of hourly data for a given year.
- Carbon monoxide
- a colourless, odourless, tasteless, and at high concentrations, poisonous gas.
- Continuous pollutants
- pollutants for which a continuous record exists; effectively, pollutants that have hourly data (maximum 8,760 values per year except leap year – e.g. 2004 where maximum values for the year are 8,784).
- Continuous station
- where pollutants are measured on a real-time basis and data determined hourly (for example ozone, sulphur dioxide).
- Criterion
- maximum concentration or level (based on potential effects) of pollutant that is desirable or considered acceptable in ambient air.
- Exceedance
- violation of the air pollutant concentration levels established by environmental protection criteria or other environmental standards.
- Fine Particulate Matter
- particles smaller than 2.5 micrometres in aerodynamic diameter, which arise mainly from fuel combustion, condensation of hot vapours and chemically-driven gas-to-particle conversion processes; also referred to as PM2.5 or respirable particles. These are fine enough to penetrate deep into the lungs.
- Fossil fuels
- natural gas, petroleum, coal and any form of solid, liquid or gaseous fuel derived from organic materials for the purpose of generating heat.
- Ground-level ozone
- colourless gas formed from chemical reactions between nitrogen oxides and volatile organic compounds (VOCs) in the presence of sunlight near the Earth’s surface.
- Micrometre
- a millionth of a metre.
- Nitrogen dioxide
- a reddish-brown gas with a pungent and irritating odour.
- Oxidation
- a chemical reaction where a substance gains an oxygen; for example, in the atmosphere, sulphur dioxide is oxidized by hydroxyl radicals to form sulphate.
- Particulate matter
- The general term used to describe a mixture of microscopic solid particles and liquid droplets suspended in air.
- Percentile value
- percentage of the data set that is equal to or lies below the stated value; if the 70 percentile value is 0.10 ppm, then 70 per cent of the data are equal to or below 0.10 ppm.
- Primary pollutant
- pollutant emitted directly to the atmosphere.
- Secondary pollutant
- pollutant formed from other pollutants in the atmosphere.
- Smog
- a contraction of smoke and fog; colloquial term used for photochemical smog, which includes ozone, and may include fine particulate matter, and other contaminants; tends to be a brownish haze.
- Smog advisory
- smog advisories are issued to the public when there is a strong likelihood that widespread, elevated and persistent smog levels are expected.
- Stratosphere
- atmosphere 10 to 40 kilometres above the Earth’s surface.
- Stratospheric ozone
- ozone formed in the stratosphere from the conversion of oxygen molecules by solar radiation; ozone found there absorbs some of the sun’s ultraviolet radiation and prevents it from reaching the Earth.
- Sulphur dioxide
- a colourless gas that smells like burnt matches.
- Troposphere
- atmospheric layer extending from the surface up to about 10 kilometres above the Earth’s surface.
Acronyms
- AAQC
- Ambient Air Quality Criteria (Ontario)
- AQI
- Air Quality Index
- CO
- carbon monoxide
- CAAQS
- Canadian Ambient Air Quality Standard
- IVR
- Interactive Voice Response
- NO
- nitric oxide
- NO2
- nitrogen dioxide
- NOX
- nitrogen oxides
- O3
- ozone
- PM2.5
- fine particulate matter
- SES (TEOM)
- Sample Equilibration System
- SHARP
- Synchronized Hybrid Ambient Real-time Particulate
- SO2
- sulphur dioxide
- TEOM
- Tapered Element Oscillating Microbalance
- TRS
- total reduced sulphur
- VOCs
- volatile organic compounds
- WOE
- weight of evidence
- kt
- kilotonnes
- µg/m3
- micrograms (of contaminant) per cubic metre (of air) – by weight
- ppb
- parts (of contaminant) per billion (parts of air) – by volume
- ppm
- parts (of contaminant) per million (parts of air) – by volume
References
- Canadian Council of Ministers of the Environment, 2012. Guidance Document on Achievement Determination: Canadian Ambient Air Quality Standards for Particulate Matter and Ozone.
- Federal Register. 2006. 40 CFR Parts 53 and 58: Revisions to Ambient Air Monitoring Regulations; Final Rule. 71 (200), 61236-61328. October 17, 2006.
- NPRI, 2014. National Pollutant Release Inventory (NPRI) Downloadable Datasets. Environment Canada.
- Ontario Ministry of the Environment and Climate Change. 2015. Air Quality in Ontario 2013 Report.
- Patashnick, H. and E.G. Rupprecht. 1991. Continuous PM-10 Measurements Using the Tapered Element Oscillating Microbalance. Journal of the Air & Waste Management Association, Vol. 41, pp. 1079-1083.
- Seinfeld, J.H. and S.N. Pandis. 2006. Atmospheric chemistry and physics: From air pollution to climate change. (2nd ed.) New Jersey: John Wiley & Sons Inc.
- Sofowote, U. and F. Dempsey. 2015. Impacts of Forest Fires on Ambient near Real- Time PM2.5 in Ontario, Canada: Meteorological Analyses and Source Apportionment of the July 2011-2013 Episodes. Atmospheric Pollution Research, doi: 10.5094/APR.2015.001.
- Sofowote, U., Su, Y., Bitzos, M.M., and Munoz, A. 2014. Improving the Correlations of Ambient TEOM PM2.5 Data and SHARP 5030 FEM in Ontario: a Multiple Linear Regression Analysis. Journal of the Air & Waste Management Association, 64:1, 104- 114.
- United States Environmental Protection Agency (USEPA). 2011. List of Designated Reference and Equivalent Methods. Issue Date: October 12, 2011.
- Yap, D., Reid, N., De Brou, G. and R. Bloxam. 2005. Transboundary Air Pollution in Ontario. Ontario Ministry of the Environment.
Resources
- Brook, J.R., Dann, T. and R.T. Burnett. 1997. The Relationship among TSP, PM10, PM2.5 and Inorganic Constituents of Atmospheric Particulate Matter at Multiple Canadian Locations. Journal of Air and Waste Management Association, Vol 46, pp. 2- 18.
- Burnett, R.T., Dales, R.E., Krewski, D., Vincent, R., Dann, T., and J.R. Brook. 1995. Associations between Ambient Particulate Sulphate and Admissions to Ontario Hospitals for Cardiac and Respiratory Diseases. American Journal of Epidemiology, Vol 142, pp. 15-22.
- Fraser, D., Yap, D., Kiely, P. and D. Mignacca. 1991. Analysis of Persistent Ozone Episodes in Southern Ontario 1980-1991. Technology Transfer Conference, Toronto, 1991. Proceedings AP14, pp. 222-227.
- Geddes, J.A., Murphy, J.G. and D.K.Wang. 2009. Long term changes in nitrogen oxides and volatile organic compounds in Toronto and the challenges facing local ozone control. Atmospheric Environment, Vol. 43, pp. 3407-3415.
- Itano, Y., Bandow, H., Takenaka, N., Saitoh, Y., Asayama, A. and J. Fukuyama. 2007. Impact of NOX reduction on long-term ozone trends in an urban atmosphere. Science of the Total Environment, Vol. 379, pp. 46-55.
- Lin, C.C.-Y., Jacob, D.J., Munger, J.W., and A.M. Fiore. 2000. Increasing Background Ozone in Surface Air Over the United States. Geophysical Research Letters, Vol. 27 (21), pp. 3465-3468.
- Lioy, P., 1991. Assessing Human Exposure to Airborne Pollutants. Environmental Science and Technology, Vol. 25, pp. 1360.
- Lipfert, F.W. and T. Hammerstrom. 1992. Temporal Patterns in Air Pollution and Hospital Admissions. Environmental Research, Vol. 59, pp. 374-399.
- Lippmann, M. 1991. Health Effects of Tropospheric Ozone. Environmental Science and Technology, Vol. 25, No. 12, pp. 1954-1962.
- Logan, J. A., Staehelin, J., Megretskaia, I. A., Cammas, J.-P., Thouret, V., Claude, H., Backer, H. D., Steinbacher, M., Scheel, H.-E., Stubi, R., Frohlich, M., and R. G. Derwent. 2012. Changes in ozone over Europe: Analysis of ozone measurements from sondes, regular aircraft (MOZAIC) and alpine surface sites. Journal of Geophysical Research, 117, D09301, doi:10.1029/2011JD016952.
- Ontario Ministry of the Environment, 2011. Air Quality Publications. Ontario Ministry of the Environment.
- Pengelly, L.D., Silverman, F. and C.H. Goldsmith. 1992. Health Effects of Air Pollution Assessed Using Ontario Health Survey Data. Urban Air Group, McMaster University.Air Quality in Ontario, 2014 Report 24 | P a g e RESOURCES
- Reid, N., Yap, D. and R. Bloxam. 2008. The potential role of background ozone on current and emerging air issues: An overview. Air Quality, Atmosphere & Health, Vol. 1, pp. 19-29.
- Rethinking the Ozone Problem in Urban and Regional Air Pollution. National Academy Press, Washington, D.C., 1991.
- United States Environmental Protection Agency. 2003. Latest Findings on National Air Quality, 2002 Status and Trends.
- United States Environmental Protection Agency. 2003. National Air Quality and Emission Trends, 2003 Special Studies Edition.
- United States Environmental Protection Agency. 2004. Particle Pollution Report, Current Understanding of Air Quality and Emissions through 2003.
- Vingarzan, R. 2004. A review of surface ozone background levels and trends. Atmospheric Environment, Vol. 38, pp. 3431-42.
- Wolff, G.T., Kelley, N.A. and M.A. Ferman. 1982. Source Regions of Summertime Ozone and Haze Episodes in the Eastern U.S. Water, Air and Soil Pollution, 18: pp. 65- 81.
- Yap, D., Ning, D.T. and W. Dong. 1988. An Assessment of Source Contribution to the Ozone Concentrations in Southern Ontario. Atmospheric Environment, Vol. 22, No. 6, pp. 1161-1168.
Acknowledgements
This report has been prepared by the staff of the Environmental Monitoring and Reporting Branch of the Ontario Ministry of the Environment and Climate Change. Environment Canada’s National Air Pollution Surveillance program is acknowledged for providing air monitoring instrumentation to the province of Ontario.
For more information:
Ministry of the Environment and Climate Change Public Information Centre
Telephone: 416-325-4000
Toll free: 1-800-565-4923
Ministry of the environment email
Ministry of the environment website
© Queen’s Printer for Ontario, 2015
PIBS# 9795e
Appendix
The Appendix is intended for use in conjunction with the 2014 Annual Air Quality in Ontario Report. The Appendix briefly describes the provincial Air Quality Index (AQI) network, quality assurance and quality control procedures, and the Ministry of the Environment and Climate Change’s air quality database. It also includes a series of tables displaying station locations and a listing of the summary statistics including means, maximums, percentile values and the number of exceedances of the Ontario Ambient Air Quality Criteria (AAQC) for each pollutant. In addition, trends for select pollutants are displayed for 10- and 20-year periods.
Monitoring network operations
Network Description
In 2014, the Environmental Monitoring and Reporting Branch (EMRB) operated 40 ambient air monitoring sites across Ontario as part of the AQI network. Monitoring site locations for the AQI network are illustrated in Map A1. The AQI network was comprised of 134 continuous monitoring instruments at 40 sites. These instruments have the capability of recording minute data (approximately 70 million data points per year) that are used to scan and validate the continuous hourly data.
Quality Assurance and Quality Control
Day-to-day maintenance and support of the instruments are administered by EMRB staff. Instrumentation precision is verified by daily automatic internal zero and span checks. Data analysts and station operators review span control charts to confirm instrument precision using a telemetry system. A quarterly quality assurance and quality control (QA/QC) review is performed on the ambient data set in order to highlight anomalies and administer corrective action in a timely manner.
The air monitoring station operators routinely inspect and maintain monitoring equipment and stations with mandatory bi-monthly on-site visits where secondary transfer standards are used to calibrate instrumentation. Station maintenance activities are recorded using FieldWorker Inc. software, an electronic documentation solution; this information is transferred directly to the ministry’s database. The instrumentation used throughout the provincial air monitoring network has been standardized to Thermo Electron Corporation analyzers in an effort to streamline parts inventory and leverage common hardware used within each analyzer. The following is a summary of the instrumentation deployed within the network and are all US EPA designated equivalent methods:
- Ozone – TE49C/I
- Fine Particulate Matter – SHARP 5030
- Nitrogen Oxides – TE42C/I
- Carbon Monoxide – TE48C/I
- Total Reduced Sulphur – TE43C/CDN101
- Sulphur Dioxide – TE43C/I
EMRB operates a laboratory with gas reference standards that adhere to those of the U.S. National Institute of Standards and Technology (NIST) and the Air Quality Research Division of Environment Canada. The secondary transfer standards used by station operators are referenced and certified to EMRB’s NIST primary standards on a quarterly basis.
The Ontario ambient air quality monitoring network undergoes constant maintenance to ensure a high standard of quality control. Continuous real-time data are consistently reviewed, assessed and validated by EMRB staff. Immediate actions are taken to correct any inconsistencies that may affect the validity of the data. These measures ensure ambient air monitoring data are valid, complete, comparable, representative and accurate. As a result, the 2014 ambient air quality monitoring network had greater than 98 per cent valid data from over one million hourly data points.
Data Base
The ambient air quality data used in this report are stored in the ministry’s air quality information system (AQUIS). A statistical pattern test is used to identify data anomalies, such as unusual pollutant concentrations. Each pollutant has a predetermined concentration range based on historical data. Values outside this range are flagged for further investigation.
Data obtained from automated ambient air monitoring instruments that operate continuously to produce an average measurement for every hour for a possible total of 8,760 measurements in a given year. Hourly parameters measured include O3, PM2.5, NO/NO2/NOX , CO, SO2 and TRS compounds. A valid annual mean requires at least 6,570 hourly readings. In addition, the 2nd and 3rd quarters of the year should have 75 per cent valid data for ozone, whereas for PM2.5, each quarter of the year should have 75 per cent valid data.
Network descriptive table, annual statistics and trends
The AQI network for 2014 is summarized in Table A1. The table displays the station name, numerical identifier and pollutants measured. The numerical identifier is the station (ID) number, the first digit of which identifies the geographic region in which the station is located.
Table A1 also identifies the type of air monitoring site: ambient, road-side, Canadian Ambient Air Quality Standard (CAAQS), and/or National Air Pollution Surveillance (NAPS). Ambient sites represent the general air quality of an area without any direct influence of local industrial sources. Road-side sites are within approximately 100 m of a major roadway with daily traffic volumes greater than 10,000 vehicles per day.
The 2014 statistical data and 10-year trends for various continuous pollutants are provided in Tables A2-A9, and Tables A10-A18, respectively. To be included in the 10-year trend analysis, a site must have valid annual means for a minimum of 8 years over the 10-year period from 2005-2014. The 20-year trends for ozone, NO2 and SO2 are provided in Figures A1-A27, Figures A28-A43, and Figures A44-A51, respectively. To be included in the 20-year trend analysis, a site must have valid annual means for a minimum of 15 years over the 20-year period from 1995-2014. A linear regression was applied to each of the 20-year trends presented to calculate the per cent change in concentrations over time.
Map A1: Air Quality Index (AQI) Monitoring Sites Across Ontario in 2014
| ID | Station Name | Station Location | Year | Latitude (D:M:S) | Longitude (D:M:S) | Air Intake (AGL) | Type | AQI | O3 | PM2.5 | NO2 | SO2 | CO | TRS |
|---|---|---|---|---|---|---|---|---|---|---|---|---|---|---|
| 12008 | Windsor Downtown | 467 University Ave. W. | 1969 | 42°18'56.8" | -83°02'37.2" | 8 | A/RS/C/N | Y | T | T | T | T | T | . |
| 12016 | Windsor West | College Ave./South St. | 1975 | 42°17'34.4" | -83°04'23.3" | 4 | A/N | Y | T | T | T | T | . | T |
| 13001 | Chatham | 435 Grand Ave. W. | 2005 | 42°24'13.3" | -82°12'29.9" | 15 | A/C/N | Y | T | T | T | . | . | . |
| 14064 | Sarnia | Front St. N./CN Tracks, Centennial Park | 1978 | 42°58'56.2" | -82°24'18.3" | 3 | A/N | Y | T | T | T | T | . | T |
| 15020 | Grand Bend | Point Blake Conservation Area | 1991 | 43°19'59.1" | -81°44'34.4" | 5 | A/N | Y | T | T | T | . | . | . |
| 15026 | London | 42 St. Julien St. | 2013 | 42°58'28.1" | -81°12'03.1" | 5 | A/C/N | Y | T | T | T | . | . | . |
| 16015 | Port Stanley | 43665 Dexter Line, Elgin Water T. Plant | 2002 | 42°40'19.5" | -81°09'46.4" | 5 | A/N | Y | T | T | . | . | . | . |
| 18007 | Tiverton | 4th Concession/Bruce Rd. 23 | 1979 | 44°18'52.1" | -81°32'59.0" | 4 | A/N | Y | T | T | T | . | . | . |
| 21005 | Brantford | 324 Grand River Ave. | 2004 | 43°08'19.0" | -80°17'33.5" | 5 | A/C/N | Y | T | T | T | . | . | . |
| 26060 | Kitchener | West Ave./Homewood Ave. | 1990 | 43°26'37.8" | -80°30'13.7" | 5 | A/C/N | Y | T | T | T | . | . | . |
| 27067 | St. Catharines | Argyle Cres., Pump Stn. | 1987 | 43°09'36.2" | -79°14'05.1" | 4 | A/C/N | Y | T | T | T | . | . | . |
| 28028 | Guelph | Exhibition St./Clark St. W. | 2000 | 43°33'05.8" | -80°15'51.0" | 4 | A/C/N | Y | T | T | T | . | . | . |
| 29000 | Hamilton Downtown | Elgin St./Kelly St. | 1987 | 43°15'28.0" | -79°51'42.0" | 4 | A/RS/C/N | Y | T | T | T | T | T | T |
| 29114 | Hamilton Mountain | Vickers Rd./E. 18th St. | 1985 | 43°13'45.9" | -79°51'46.0" | 3 | A/C/N | Y | T | T | T | T | . | . |
| 29118 | Hamilton West | Main St. W./Hwy 403 | 1985 | 43°15'26.8" | -79°54'27.9" | 3 | A/RS | Y | T | T | T | . | . | . |
| 31103 | Toronto Downtown | Bay St./Wellesley St. W. | 2000 | 43°39'46.7" | -79°23'17.2" | 10 | A/RS/C/N | Y | T | T | T | . | . | . |
| 33003 | Toronto East | Kennedy Rd./Lawrence Ave. E. | 1970 | 43°44'52.5" | -79°16'26.6" | 4 | A/RS/C/N | Y | T | T | T | . | . | . |
| 34020 | Toronto North | Hendon Ave./Yonge St. | 1988 | 43°46'53.8" | -79°25'03.8" | 5 | A/RS/C/N | Y | T | T | T | . | . | . |
| 35125 | Toronto West | 125 Resources Rd. | 2003 | 43°42'34.0" | -79°32'36.6" | 8 | A/RS/C/N | Y | T | T | T | T | T | . |
| 44008 | Burlington | North Shore Blvd. E./Lakeshore Rd. | 1979 | 43°18'54.4" | -79°48'09.5" | 5 | A/C/N | Y | T | T | T | . | . | . |
| 44017 | Oakville | Eighth Line/Glenashton Dr., Halton Reservoir | 2003 | 43°29'12.9" | -79°42'08.2" | 12 | A/C/N | Y | T | T | T | . | . | . |
| 45026 | Oshawa | 2000 Simcoe St. N., Durham College | 2005 | 43°56'45.4" | -78°53'41.7" | 7 | A/RS/C/N | Y | T | T | T | . | . | . |
| 46089 | Brampton | 525 Main St. N., Peel Manor | 2000 | 43°41'55.5" | -79°46'51.3" | 5 | A/C/N | Y | T | T | T | . | . | . |
| 46108 | Mississauga | 3359 Mississauga Rd. N., U of T Mississauga | 2007 | 43°32'49.1" | -79°39'31.3" | 5 | A/C/N | Y | T | T | T | T | . | . |
| 47045 | Barrie | 83 Perry St. | 2001 | 44°22'56.5" | -79°42'08.3" | 5 | A/C/N | Y | T | T | T | . | . | . |
| 48006 | Newmarket | Eagle St. W./McCaffrey Rd. | 2001 | 44°02'39.5" | -79°28'59.7" | 5 | A/N | Y | T | T | T | . | . | . |
| 49005 | Parry Sound | 7 Bay St. | 2001 | 45°20'16.3" | -80°02'17.4" | 5 | A/N | Y | T | T | T | . | . | . |
| 49010 | Dorset | 1026 Bellwood Acres Rd. | 1981 | 45°13'27.4" | -78°55'58.6" | 3 | A/N | Y | T | T | . | . | . | . |
| 51001 | Ottawa Downtown | Rideau St./Wurtemburg St. | 1971 | 45°26'03.6" | -75°40'33.6" | 4 | A/C/N | Y | T | T | T | T | T | . |
| 51002 | Ottawa Central | 960 Carling Ave. | 2007 | 45°22'57.1" | -75°42'51.1" | 5 | A/N | Y | T | T | T | . | . | . |
| 51010 | Petawawa | Petawawa Research Forest Facility | 2007 | 45°59'48.2" | -77°26'28.3" | 6 | A/N | Y | T | T | . | . | . | . |
| 52023 | Kingston | 23 Beechgrove Lane | 2014 | 44°13'11.5" | -76°31'16.1" | 5 | A/C/N | Y | T | T | T | . | . | . |
| 54012 | Belleville | 2 Sidney St., Water Treatment Plant | 2002 | 44°09'01.9" | -77°23'43.8" | 10 | A/N | Y | T | T | T | . | . | . |
| 56010 | Morrisburg | County Rd. 2, Morrisburg Water Tower | 2005 | 44°53'59.1" | -75°11'23.8" | 5 | A/N | Y | T | T | . | . | . | . |
| 56051 | Cornwall | Bedford St./3rd St. W. | 1970 | 45°01'04.7" | -74°44'06.8" | 4 | A/N | Y | T | T | T | . | . | . |
| 59006 | Peterborough | 10 Hospital Dr. | 1998 | 44°18'06.9" | -78°20'46.4" | 10 | A/C/N | Y | T | T | T | . | . | . |
| 63203 | Thunder Bay | 421 James St. S. | 2004 | 48°22'45.8" | -89°17'24.6" | 15 | A/RS/C/N | Y | T | T | T | . | . | . |
| 71078 | Sault Ste. Marie | Sault College | 2004 | 46°31'59.5" | -84°18'35.7" | 8 | A/N | Y | T | T | T | T | . | T |
| 75010 | North Bay | Chippewa St. W., Dept. National Defence | 1979 | 46°19'23.5" | -79°26'57.4" | 4 | A/RS/N | Y | T | T | T | . | . | . |
| 77233 | Sudbury | 155 Elm St. | 2013 | 46°29'31.0" | -81°00'11.2" | 3 | A/C/N | Y | T | T | T | T | . | . |
| Total | 40 | 40 | 40 | 36 | 10 | 4 | 4 | |||||||
Notes:
- ID
- station identfication number
- Year
- year station began monitoring
- Air intake
- height of air intake above ground (m)
- Type
- type of monitoring site: A = ambient, RS = road-side, C = CAAQS, N = NAPS
- AQI
- Air Quality Index site
- T
- telemetry
- O3
- ground-level ozone
- PM2.5
- fine particulate matter
- NO2
- nitrogen dioxide
- CO
- carbon monoxide
- SO2
- sulphur dioxide
- TRS
- total reduced sulphur
| ID | City | Location | Valid h | Percentiles | Mean | Maximum 1h | Maximum 24h | No. of Times Above Criterion 1h | |||||
|---|---|---|---|---|---|---|---|---|---|---|---|---|---|
| 10% | 30% | 50% | 70% | 90% | 99% | ||||||||
| 12008 | Windsor Downtown | 467 University Ave. W. | 8568 | 8 | 18 | 25 | 33 | 44 | 65 | 26.0 | 78 | 53 | 0 |
| 12016 | Windsor West | College Ave./South St. | 8490 | 8 | 19 | 26 | 34 | 46 | 66 | 27.2 | 86 | 52 | 3 |
| 13001 | Chatham | 435 Grand Ave. W. | 8745 | 14 | 22 | 28 | 35 | 46 | 62 | 29.3 | 78 | 53 | 0 |
| 14064 | Sarnia | Front St. N./CN Tracks, Centennial Park | 8649 | 11 | 20 | 27 | 33 | 43 | 61 | 27.1 | 79 | 49 | 0 |
| 15020 | Grand Bend | Point Blake Conservation Area | 8664 | 16 | 25 | 31 | 37 | 45 | 64 | 31.0 | 90 | 57 | 4 |
| 15026 | London | 42 St. Julien St. | 8663 | 9 | 21 | 28 | 35 | 45 | 62 | 28.1 | 82 | 61 | 1 |
| 16015 | Port Stanley | 43665 Dexter Line, Elgin Water T. Plant | 8696 | 17 | 26 | 32 | 38 | 48 | 64 | 32.3 | 87 | 60 | 3 |
| 18007 | Tiverton | 4th Concession/Bruce Rd. 23 | 8599 | 18 | 26 | 32 | 37 | 44 | 61 | 31.8 | 86 | 60 | 1 |
| 21005 | Brantford | 324 Grand River Ave. | 8499 | 10 | 22 | 30 | 36 | 47 | 62 | 29.4 | 80 | 59 | 0 |
| 26060 | Kitchener | West Ave./Homewood Ave. | 8728 | 11 | 21 | 28 | 34 | 43 | 59 | 27.3 | 76 | 57 | 0 |
| 27067 | St. Catharines | Argyle Cres., Pump Stn. | 8674 | 11 | 23 | 29 | 35 | 43 | 58 | 28.5 | 70 | 55 | 0 |
| 28028 | Guelph | Exhibition St./Clark St. W. | 8626 | 11 | 21 | 28 | 34 | 44 | 60 | 27.8 | 79 | 57 | 0 |
| 29000 | Hamilton Downtown | Elgin St./Kelly St. | 8671 | 9 | 19 | 25 | 31 | 41 | 59 | 25.3 | 74 | 56 | 0 |
| 29114 | Hamilton Mountain | Vickers Rd./E. 18th St. | 8656 | 13 | 23 | 29 | 35 | 45 | 61 | 29.1 | 79 | 61 | 0 |
| 29118 | Hamilton West | Main St. W./Hwy 403 | 8739 | 4 | 16 | 24 | 30 | 38 | 52 | 22.7 | 70 | 52 | 0 |
| 31103 | Toronto Downtown | Bay St./Wellesley St. W. | 8710 | 10 | 19 | 25 | 32 | 42 | 57 | 25.7 | 80 | 55 | 0 |
| 33003 | Toronto East | Kennedy Rd./Lawrence Ave. E. | 8660 | 6 | 17 | 23 | 30 | 40 | 55 | 23.4 | 73 | 52 | 0 |
| 34020 | Toronto North | Hendon Ave./Yonge St. | 8696 | 9 | 18 | 25 | 31 | 41 | 58 | 25.3 | 82 | 57 | 1 |
| 35125 | Toronto West | 125 Resources Rd. | 8673 | 3 | 13 | 20 | 27 | 39 | 56 | 21.1 | 72 | 48 | 0 |
| 44008 | Burlington | North Shore Blvd. E./Lakeshore Rd. | 8679 | 9 | 19 | 26 | 32 | 41 | 57 | 25.5 | 73 | 50 | 0 |
| 44017 | Oakville | Eighth Line/Glenashton Dr., Halton Res. | 8736 | 11 | 21 | 27 | 34 | 43 | 57 | 27.2 | 72 | 56 | 0 |
| 45026 | Oshawa | 2000 Simcoe St. N., Durham College | 8664 | 11 | 20 | 27 | 34 | 42 | 57 | 27.2 | 73 | 46 | 0 |
| 46089 | Brampton | 525 Main St. N., Peel Manor | 8657 | 8 | 19 | 27 | 34 | 43 | 58 | 26.5 | 80 | 60 | 0 |
| 46108 | Mississauga | 3359 Mississauga Rd. N., U of T Campus | 8653 | 7 | 18 | 26 | 32 | 42 | 57 | 25.4 | 76 | 58 | 0 |
| 47045 | Barrie | 83 Perry St. | 8733 | 9 | 19 | 25 | 32 | 41 | 53 | 25.6 | 68 | 49 | 0 |
| 48006 | Newmarket | Eagle St. W./McCaffrey Rd. | 8690 | 13 | 22 | 29 | 35 | 44 | 58 | 28.6 | 87 | 59 | 3 |
| 49005 | Parry Sound | 7 Bay St. | 8740 | 15 | 24 | 30 | 35 | 43 | 56 | 29.6 | 74 | 60 | 0 |
| 49010 | Dorset | 1026 Bellwood Acres Rd. | 8728 | 11 | 22 | 28 | 34 | 43 | 54 | 27.7 | 79 | 56 | 0 |
| 51001 | Ottawa Downtown | Rideau St./Wurtemburg St. | 8541 | 10 | 18 | 25 | 31 | 40 | 50 | 24.8 | 64 | 50 | 0 |
| 51002 | Ottawa Central | 960 Carling Ave. | 8683 | 11 | 20 | 27 | 33 | 41 | 53 | 26.6 | 63 | 48 | 0 |
| 51010 | Petawawa | Petawawa Research Forest Facility | 8733 | 11 | 21 | 28 | 33 | 41 | 52 | 26.8 | 68 | 50 | 0 |
| 52023 | Kingston | 23 Beechgrove Lane | 8686 | 16 | 26 | 31 | 37 | 46 | 61 | 31.4 | 81 | 57 | 1 |
| 54012 | Belleville | 2 Sidney St., Water Treatment Plant | 8746 | 14 | 24 | 29 | 36 | 45 | 60 | 29.6 | 80 | 57 | 0 |
| 56010 | Morrisburg | County Rd. 2, Morrisburg Water Tower | 8750 | 12 | 22 | 29 | 34 | 42 | 53 | 27.9 | 74 | 48 | 0 |
| 56051 | Cornwall | Bedford St./3rd St. W. | 8646 | 12 | 21 | 28 | 33 | 42 | 52 | 27.3 | 70 | 49 | 0 |
| 59006 | Peterborough | 10 Hospital Dr. | 8708 | 14 | 23 | 29 | 35 | 44 | 59 | 29.2 | 74 | 60 | 0 |
| 63203 | Thunder Bay | 421 James St. S. | 8442 | 7 | 18 | 25 | 30 | 36 | 46 | 23.4 | 70 | 47 | 0 |
| 71078 | Sault Ste. Marie | Sault College | 8676 | 14 | 22 | 28 | 34 | 43 | 55 | 28.4 | 73 | 54 | 0 |
| 75010 | North Bay | Chippewa St. W., Dept. National Defence | 8575 | 10 | 20 | 28 | 33 | 41 | 54 | 26.7 | 71 | 53 | 0 |
| 77233 | Sudbury | 155 Elm St. | 8671 | 11 | 20 | 27 | 32 | 41 | 55 | 26.3 | 73 | 56 | 0 |
| ID | City | Location | Valid h | Percentiles | Mean | Maximum 1h | Maximum 24h | No. of Times Above Reference Level 24h | |||||
|---|---|---|---|---|---|---|---|---|---|---|---|---|---|
| 10% | 30% | 50% | 70% | 90% | 99% | ||||||||
| 12008 | Windsor Downtown | 467 University Ave. W. | 8624 | 4 | 6 | 9 | 12 | 19 | 31 | 10.1 | 71 | 29 | 1 |
| 12016 | Windsor West | College Ave./South St. | 8726 | 4 | 6 | 9 | 13 | 20 | 34 | 10.7 | 84 | 31 | 3 |
| 13001 | Chatham | 435 Grand Ave. W. | 8562 | 3 | 5 | 7 | 10 | 16 | 28 | 8.6 | 51 | 34 | 1 |
| 14064 | Sarnia | Front St. N./CN Tracks, Centennial Park | 8653 | 3 | 5 | 7 | 10 | 18 | 33 | 9.0 | 105 | 41 | 1 |
| 15020 | Grand Bend | Point Blake Conservation Area | 8654 | 2 | 4 | 6 | 9 | 17 | 31 | 8.1 | 72 | 28 | 0 |
| 15026 | London | 42 St. Julien St. | 8581 | 3 | 5 | 7 | 10 | 16 | 34 | 8.8 | 58 | 30 | 2 |
| 16015 | Port Stanley | 43665 Dexter Line, Elgin Water T. Plant | 8182 | 2 | 5 | 7 | 10 | 16 | 29 | 8.2 | 48 | 34 | 1 |
| 18007 | Tiverton | 4th Concession/Bruce Rd. 23 | 8581 | 2 | 3 | 5 | 8 | 13 | 24 | 6.5 | 40 | 27 | 0 |
| 21005 | Brantford | 324 Grand River Ave. | 8688 | 3 | 5 | 7 | 10 | 18 | 34 | 9.2 | 60 | 29 | 1 |
| 26060 | Kitchener | West Ave./Homewood Ave. | 8488 | 3 | 5 | 7 | 11 | 18 | 36 | 9.3 | 64 | 32 | 7 |
| 27067 | St. Catharines | Argyle Cres., Pump Stn. | 8681 | 3 | 5 | 7 | 10 | 16 | 29 | 8.8 | 65 | 29 | 1 |
| 28028 | Guelph | Exhibition St./Clark St. W. | 8572 | 3 | 5 | 7 | 10 | 17 | 37 | 8.9 | 64 | 37 | 6 |
| 29000 | Hamilton Downtown | Elgin St./Kelly St. | 8718 | 3 | 6 | 9 | 13 | 21 | 38 | 10.8 | 78 | 45 | 5 |
| 29114 | Hamilton Mountain | Vickers Rd./E. 18th St. | 8704 | 3 | 5 | 8 | 11 | 19 | 35 | 9.4 | 61 | 32 | 1 |
| 29118 | Hamilton West | Main St. W./Hwy 403 | 8732 | 3 | 5 | 8 | 11 | 19 | 37 | 9.9 | 86 | 46 | 4 |
| 31103 | Toronto Downtown | Bay St./Wellesley St. W. | 8720 | 3 | 5 | 7 | 10 | 17 | 31 | 8.7 | 52 | 33 | 3 |
| 33003 | Toronto East | Kennedy Rd./Lawrence Ave. E. | 8687 | 3 | 5 | 7 | 10 | 17 | 34 | 8.9 | 60 | 33 | 3 |
| 34020 | Toronto North | Hendon Ave./Yonge St. | 8609 | 3 | 5 | 7 | 11 | 17 | 34 | 9.2 | 58 | 33 | 2 |
| 35125 | Toronto West | 125 Resources Rd. | 8685 | 3 | 5 | 7 | 10 | 17 | 35 | 9.1 | 65 | 35 | 4 |
| 44008 | Burlington | North Shore Blvd. E./Lakeshore Rd. | 8704 | 3 | 5 | 8 | 11 | 18 | 35 | 9.6 | 64 | 42 | 4 |
| 44017 | Oakville | Eighth Line/Glenashton Dr., Halton Res. | 8727 | 3 | 5 | 7 | 10 | 16 | 32 | 8.5 | 69 | 36 | 5 |
| 45026 | Oshawa | 2000 Simcoe St. N., Durham College | 8676 | 2 | 4 | 6 | 9 | 15 | 28 | 7.7 | 47 | 27 | 0 |
| 46089 | Brampton | 525 Main St. N., Peel Manor | 8675 | 3 | 5 | 7 | 10 | 18 | 35 | 8.9 | 85 | 42 | 5 |
| 46108 | Mississauga | 3359 Mississauga Rd. N., U of T Campus | 8715 | 3 | 5 | 7 | 10 | 16 | 34 | 8.7 | 62 | 40 | 5 |
| 47045 | Barrie | 83 Perry St. | 8715 | 2 | 4 | 6 | 9 | 16 | 29 | 7.6 | 50 | 29 | 1 |
| 48006 | Newmarket | Eagle St. W./McCaffrey Rd. | 8711 | 1 | 3 | 6 | 9 | 15 | 30 | 7.3 | 59 | 30 | 1 |
| 49005 | Parry Sound | 7 Bay St. | 8416 | 2 | 3 | 5 | 7 | 11 | 20 | 5.8 | 43 | 25 | 0 |
| 49010 | Dorset | 1026 Bellwood Acres Rd. | 8618 | 1 | 3 | 4 | 6 | 11 | 20 | 5.3 | 41 | 20 | 0 |
| 51001 | Ottawa Downtown | Rideau St./Wurtemburg St. | 8622 | 2 | 4 | 6 | 8 | 14 | 27 | 7.0 | 80 | 27 | 0 |
| 51002 | Ottawa Central | 960 Carling Ave. | 8441 | 2 | 4 | 5 | 8 | 13 | 28 | 6.8 | 45 | 27 | 0 |
| 51010 | Petawawa | Petawawa Research Forest Facility | 8700 | 2 | 3 | 4 | 5 | 9 | 16 | 4.7 | 34 | 17 | 0 |
| 52023 | Kingston | 23 Beechgrove Lane | 8675 | 2 | 4 | 5 | 8 | 13 | 24 | 6.8 | 52 | 30 | 1 |
| 54012 | Belleville | 2 Sidney St., Water Treatment Plant | 8722 | 2 | 4 | 6 | 8 | 13 | 24 | 6.8 | 43 | 23 | 0 |
| 56010 | Morrisburg | County Rd. 2, Morrisburg Water Tower | 8633 | 2 | 4 | 6 | 8 | 13 | 25 | 7.0 | 56 | 33 | 1 |
| 56051 | Cornwall | Bedford St./3rd St. W. | 8699 | 2 | 4 | 6 | 8 | 13 | 26 | 7.0 | 58 | 31 | 1 |
| 59006 | Peterborough | 10 Hospital Dr. | 8637 | 2 | 4 | 5 | 8 | 14 | 24 | 6.9 | 61 | 29 | 1 |
| 63203 | Thunder Bay | 421 James St. S. | 8253 | 2 | 3 | 5 | 8 | 13 | 25 | 6.6 | 48 | 21 | 0 |
| 71078 | Sault Ste. Marie | Sault College | 8624 | 2 | 3 | 5 | 7 | 12 | 21 | 6.0 | 51 | 17 | 0 |
| 75010 | North Bay | Chippewa St. W., Dept. National Defence | 8616 | 2 | 3 | 4 | 6 | 10 | 20 | 5.3 | 43 | 18 | 0 |
| 77233 | Sudbury | 155 Elm St. | 8693 | 2 | 3 | 5 | 7 | 12 | 22 | 6.0 | 60 | 24 | 0 |
Note: Measurements taken by Synchronized Hybrid Ambient Real-time Particulate (SHARP) 5030.
| ID | City | Location | Valid h | Percentiles | Mean | Maximum 1h | Maximum 24h | |||||
|---|---|---|---|---|---|---|---|---|---|---|---|---|
| 10% | 30% | 50% | 70% | 90% | 99% | |||||||
| 12008 | Windsor Downtown | 467 University Ave. W. | 8685 | 0 | 1 | 2 | 3 | 9 | 46 | 4.0 | 158 | 50 |
| 12016 | Windsor West | College Ave./South St. | 8269 | 0 | 1 | 1 | 3 | 8 | 42 | 3.8 | 264 | 37 |
| 13001 | Chatham | 435 Grand Ave. W. | 8731 | 0 | 0 | 1 | 1 | 4 | 15 | 1.5 | 64 | 13 |
| 14064 | Sarnia | Front St. N./CN Tracks, Centennial Park | 8598 | 0 | 0 | 1 | 1 | 5 | 24 | 1.9 | 142 | 35 |
| 15020 | Grand Bend | Point Blake Conservation Area | 8704 | 0 | 0 | 0 | 0 | 1 | 4 | 0.2 | 11 | 3 |
| 15026 | London | 42 St. Julien St. | 8666 | 0 | 0 | 0 | 1 | 2 | 20 | 1.3 | 101 | 29 |
| 18007 | Tiverton | 4th Concession/Bruce Rd. 23 | 8623 | 0 | 0 | 0 | 1 | 3 | 10 | 1.3 | 38 | 10 |
| 21005 | Brantford | 324 Grand River Ave. | 8479 | 0 | 0 | 0 | 0 | 2 | 15 | 0.9 | 76 | 14 |
| 26060 | Kitchener | West Ave./Homewood Ave. | 8728 | 0 | 0 | 0 | 1 | 2 | 26 | 1.6 | 144 | 56 |
| 27067 | St. Catharines | Argyle Cres., Pump Stn. | 8677 | 0 | 0 | 1 | 1 | 3 | 21 | 1.7 | 105 | 29 |
| 28028 | Guelph | Exhibition St./Clark St. W. | 8626 | 0 | 0 | 0 | 1 | 2 | 20 | 1.2 | 106 | 20 |
| 29000 | Hamilton Downtown | Elgin St./Kelly St. | 8642 | 0 | 1 | 1 | 3 | 9 | 51 | 3.9 | 211 | 71 |
| 29114 | Hamilton Mountain | Vickers Rd./E. 18th St. | 8635 | 0 | 0 | 1 | 1 | 4 | 21 | 2.0 | 82 | 24 |
| 29118 | Hamilton West | Main St. W./Hwy 403 | 8661 | 0 | 1 | 2 | 4 | 14 | 66 | 5.9 | 227 | 85 |
| 31103 | Toronto Downtown | Bay St./Wellesley St. W. | 8547 | 0 | 0 | 1 | 2 | 6 | 26 | 2.5 | 99 | 34 |
| 33003 | Toronto East | Kennedy Rd./Lawrence Ave. E. | 8669 | 1 | 1 | 3 | 5 | 13 | 55 | 6.2 | 316 | 91 |
| 34020 | Toronto North | Hendon Ave./Yonge St. | 8709 | 0 | 1 | 2 | 3 | 10 | 42 | 4.3 | 231 | 74 |
| 35125 | Toronto West | 125 Resources Rd. | 8546 | 0 | 1 | 4 | 9 | 23 | 87 | 9.5 | 282 | 89 |
| 44008 | Burlington | North Shore Blvd. E./Lakeshore Rd. | 8674 | 0 | 1 | 2 | 3 | 10 | 55 | 4.6 | 191 | 61 |
| 44017 | Oakville | Eighth Line/Glenashton Dr., Halton Res. | 8688 | 0 | 1 | 2 | 3 | 7 | 33 | 3.4 | 136 | 36 |
| 45026 | Oshawa | 2000 Simcoe St. N., Durham College | 8734 | 0 | 0 | 1 | 2 | 4 | 20 | 2.0 | 93 | 22 |
| 46089 | Brampton | 525 Main St. N., Peel Manor | 8637 | 0 | 1 | 1 | 2 | 8 | 56 | 4.0 | 209 | 54 |
| 46108 | Mississauga | 3359 Mississauga Rd. N., U of T Campus | 8606 | 0 | 0 | 1 | 1 | 5 | 45 | 2.9 | 200 | 59 |
| 47045 | Barrie | 83 Perry St. | 8731 | 1 | 2 | 2 | 2 | 5 | 38 | 3.7 | 173 | 25 |
| 48006 | Newmarket | Eagle St. W./McCaffrey Rd. | 8686 | 0 | 0 | 0 | 1 | 3 | 20 | 1.4 | 132 | 31 |
| 49005 | Parry Sound | 7 Bay St. | 8730 | 0 | 0 | 0 | 0 | 1 | 9 | 0.6 | 51 | 5 |
| 51001 | Ottawa Downtown | Rideau St./Wurtemburg St. | 8677 | 0 | 1 | 1 | 2 | 4 | 16 | 1.9 | 88 | 12 |
| 51002 | Ottawa Central | 960 Carling Ave. | 8683 | 0 | 0 | 0 | 1 | 2 | 16 | 1.0 | 84 | 19 |
| 52023 | Kingston | 23 Beechgrove Lane | 8684 | 0 | 0 | 0 | 1 | 2 | 7 | 0.8 | 78 | 12 |
| 54012 | Belleville | 2 Sidney St., Water Treatment Plant | 8744 | 0 | 0 | 0 | 1 | 3 | 15 | 1.2 | 117 | 18 |
| 56051 | Cornwall | Bedford St./3rd St. W. | 8638 | 0 | 0 | 1 | 1 | 2 | 20 | 1.5 | 171 | 42 |
| 59006 | Peterborough | 10 Hospital Dr. | 8656 | 0 | 1 | 1 | 2 | 3 | 17 | 1.8 | 93 | 28 |
| 63203 | Thunder Bay | 421 James St. S. | 8441 | 1 | 1 | 2 | 3 | 11 | 39 | 4.2 | 129 | 28 |
| 71078 | Sault Ste. Marie | Sault College | 8675 | 1 | 1 | 1 | 2 | 4 | 14 | 2.0 | 74 | 9 |
| 75010 | North Bay | Chippewa St. W., Dept. National Defence | 8542 | 1 | 1 | 1 | 2 | 4 | 29 | 2.6 | 109 | 19 |
| 77233 | Sudbury | 155 Elm St. | 8666 | 1 | 1 | 2 | 2 | 6 | 38 | 3.3 | 168 | 40 |
| ID | City | Location | Valid h | Percentiles | Mean | Maximum 1h | Maximum 24h | No. of Times Above Criteria 1h | No. of Times Above Criteria 24h | |||||
|---|---|---|---|---|---|---|---|---|---|---|---|---|---|---|
| 10% | 30% | 50% | 70% | 90% | 99% | |||||||||
| 12008 | Windsor Downtown | 467 University Ave. W. | 8685 | 5 | 8 | 11 | 16 | 27 | 48 | 14.0 | 68 | 42 | 0 | 0 |
| 12016 | Windsor West | College Ave./South St. | 8269 | 3 | 6 | 10 | 14 | 23 | 41 | 11.8 | 73 | 37 | 0 | 0 |
| 13001 | Chatham | 435 Grand Ave. W. | 8718 | 3 | 4 | 5 | 8 | 13 | 27 | 6.8 | 51 | 25 | 0 | 0 |
| 14064 | Sarnia | Front St. N./CN Tracks, Centennial Park | 8598 | 2 | 4 | 7 | 11 | 20 | 33 | 9.0 | 59 | 36 | 0 | 0 |
| 15020 | Grand Bend | Point Blake Conservation Area | 8704 | 0 | 1 | 2 | 4 | 7 | 14 | 3.1 | 41 | 15 | 0 | 0 |
| 15026 | London | 42 St. Julien St. | 8667 | 2 | 4 | 5 | 8 | 13 | 33 | 6.9 | 53 | 32 | 0 | 0 |
| 18007 | Tiverton | 4th Concession/Bruce Rd. 23 | 8623 | 1 | 1 | 2 | 3 | 5 | 10 | 2.7 | 25 | 11 | 0 | 0 |
| 21005 | Brantford | 324 Grand River Ave. | 7694 | 1 | 2 | 4 | 6 | 12 | 29 | 5.5 | 51 | 26 | 0 | 0 |
| 26060 | Kitchener | West Ave./Homewood Ave. | 8728 | 2 | 3 | 5 | 8 | 14 | 34 | 7.0 | 59 | 35 | 0 | 0 |
| 27067 | St. Catharines | Argyle Cres., Pump Stn. | 8677 | 2 | 4 | 5 | 8 | 15 | 29 | 7.3 | 53 | 27 | 0 | 0 |
| 28028 | Guelph | Exhibition St./Clark St. W. | 8626 | 2 | 3 | 5 | 8 | 14 | 36 | 7.1 | 54 | 33 | 0 | 0 |
| 29000 | Hamilton Downtown | Elgin St./Kelly St. | 8642 | 4 | 7 | 10 | 15 | 24 | 42 | 12.4 | 67 | 47 | 0 | 0 |
| 29114 | Hamilton Mountain | Vickers Rd./E. 18th St. | 8638 | 3 | 4 | 7 | 10 | 20 | 37 | 9.3 | 64 | 35 | 0 | 0 |
| 29118 | Hamilton West | Main St. W./Hwy 403 | 8661 | 4 | 7 | 10 | 15 | 25 | 42 | 12.8 | 66 | 43 | 0 | 0 |
| 31103 | Toronto Downtown | Bay St./Wellesley St. W. | 8548 | 6 | 9 | 12 | 16 | 25 | 44 | 14.0 | 65 | 42 | 0 | 0 |
| 33003 | Toronto East | Kennedy Rd./Lawrence Ave. E. | 8669 | 5 | 8 | 12 | 16 | 27 | 50 | 14.2 | 89 | 48 | 0 | 0 |
| 34020 | Toronto North | Hendon Ave./Yonge St. | 8708 | 4 | 7 | 11 | 17 | 26 | 45 | 13.4 | 69 | 43 | 0 | 0 |
| 35125 | Toronto West | 125 Resources Rd. | 8546 | 6 | 10 | 15 | 20 | 31 | 54 | 17.1 | 83 | 51 | 0 | 0 |
| 44008 | Burlington | North Shore Blvd. E./Lakeshore Rd. | 8674 | 3 | 6 | 9 | 13 | 22 | 40 | 10.9 | 60 | 38 | 0 | 0 |
| 44017 | Oakville | Eighth Line/Glenashton Dr., Halton Res. | 8688 | 2 | 4 | 6 | 9 | 17 | 39 | 8.2 | 62 | 41 | 0 | 0 |
| 45026 | Oshawa | 2000 Simcoe St. N., Durham College | 8734 | 2 | 3 | 5 | 8 | 14 | 29 | 6.8 | 45 | 27 | 0 | 0 |
| 46089 | Brampton | 525 Main St. N., Peel Manor | 8637 | 2 | 4 | 7 | 12 | 24 | 46 | 10.6 | 66 | 44 | 0 | 0 |
| 46108 | Mississauga | 3359 Mississauga Rd. N., U of T Campus | 8605 | 3 | 4 | 7 | 11 | 19 | 40 | 9.2 | 73 | 41 | 0 | 0 |
| 47045 | Barrie | 83 Perry St. | 8731 | 2 | 4 | 6 | 8 | 17 | 43 | 8.1 | 64 | 30 | 0 | 0 |
| 48006 | Newmarket | Eagle St. W./McCaffrey Rd. | 8686 | 2 | 3 | 4 | 7 | 14 | 39 | 6.8 | 62 | 36 | 0 | 0 |
| 49005 | Parry Sound | 7 Bay St. | 8730 | 1 | 1 | 2 | 3 | 7 | 19 | 3.3 | 39 | 12 | 0 | 0 |
| 51001 | Ottawa Downtown | Rideau St./Wurtemburg St. | 8677 | 2 | 3 | 5 | 8 | 16 | 32 | 7.4 | 46 | 25 | 0 | 0 |
| 51002 | Ottawa Central | 960 Carling Ave. | 8683 | 1 | 2 | 4 | 6 | 13 | 35 | 6.0 | 55 | 27 | 0 | 0 |
| 52023 | Kingston | 23 Beechgrove Lane | 8684 | 1 | 2 | 3 | 4 | 9 | 22 | 3.9 | 45 | 15 | 0 | 0 |
| 54012 | Belleville | 2 Sidney St., Water Treatment Plant | 8744 | 1 | 2 | 3 | 5 | 10 | 27 | 4.5 | 46 | 20 | 0 | 0 |
| 56051 | Cornwall | Bedford St./3rd St. W. | 8638 | 1 | 2 | 4 | 6 | 12 | 34 | 5.6 | 60 | 36 | 0 | 0 |
| 59006 | Peterborough | 10 Hospital Dr. | 8656 | 1 | 2 | 4 | 6 | 11 | 31 | 5.3 | 43 | 27 | 0 | 0 |
| 63203 | Thunder Bay | 421 James St. S. | 8441 | 2 | 3 | 5 | 9 | 18 | 35 | 7.8 | 51 | 27 | 0 | 0 |
| 71078 | Sault Ste. Marie | Sault College | 8675 | 1 | 2 | 4 | 6 | 12 | 26 | 5.3 | 51 | 18 | 0 | 0 |
| 75010 | North Bay | Chippewa St. W., Dept. National Defence | 8542 | 1 | 2 | 3 | 5 | 12 | 36 | 5.6 | 46 | 25 | 0 | 0 |
| 77233 | Sudbury | 155 Elm St. | 8666 | 2 | 3 | 5 | 8 | 15 | 42 | 7.3 | 58 | 28 | 0 | 0 |
| ID | City | Location | Valid h | Percentiles | Mean | Maximum 1h | Maximum 24h | |||||
|---|---|---|---|---|---|---|---|---|---|---|---|---|
| 10% | 30% | 50% | 70% | 90% | 99% | |||||||
| 12008 | Windsor Downtown | 467 University Ave. W. | 8685 | 6 | 9 | 13 | 20 | 35 | 87 | 18.0 | 225 | 92 |
| 12016 | Windsor West | College Ave./South St. | 8266 | 4 | 8 | 11 | 17 | 30 | 75 | 15.7 | 337 | 74 |
| 13001 | Chatham | 435 Grand Ave. W. | 8718 | 3 | 4 | 6 | 9 | 16 | 37 | 8.2 | 103 | 36 |
| 14064 | Sarnia | Front St. N./CN Tracks, Centennial Park | 8598 | 2 | 4 | 8 | 13 | 23 | 51 | 10.9 | 201 | 55 |
| 15020 | Grand Bend | Point Blake Conservation Area | 8704 | 0 | 1 | 2 | 4 | 8 | 16 | 3.4 | 47 | 17 |
| 15026 | London | 42 St. Julien St. | 8666 | 2 | 4 | 6 | 9 | 16 | 44 | 8.3 | 143 | 60 |
| 18007 | Tiverton | 4th Concession/Bruce Rd. 23 | 8623 | 1 | 2 | 3 | 5 | 8 | 14 | 4.0 | 41 | 14 |
| 21005 | Brantford | 324 Grand River Ave. | 7694 | 1 | 2 | 4 | 6 | 14 | 41 | 6.4 | 109 | 39 |
| 26060 | Kitchener | West Ave./Homewood Ave. | 8728 | 2 | 4 | 6 | 9 | 16 | 54 | 8.5 | 196 | 91 |
| 27067 | St. Catharines | Argyle Cres., Pump Stn. | 8677 | 3 | 4 | 6 | 9 | 18 | 47 | 9.1 | 153 | 48 |
| 28028 | Guelph | Exhibition St./Clark St. W. | 8626 | 2 | 4 | 6 | 9 | 16 | 52 | 8.5 | 154 | 52 |
| 29000 | Hamilton Downtown | Elgin St./Kelly St. | 8642 | 5 | 8 | 12 | 17 | 31 | 86 | 16.3 | 278 | 118 |
| 29114 | Hamilton Mountain | Vickers Rd./E. 18th St. | 8627 | 3 | 5 | 8 | 12 | 24 | 53 | 11.3 | 145 | 57 |
| 29118 | Hamilton West | Main St. W./Hwy 403 | 8661 | 5 | 8 | 12 | 20 | 39 | 99 | 18.7 | 293 | 129 |
| 31103 | Toronto Downtown | Bay St./Wellesley St. W. | 8548 | 6 | 10 | 13 | 18 | 30 | 63 | 16.5 | 162 | 76 |
| 33003 | Toronto East | Kennedy Rd./Lawrence Ave. E. | 8669 | 6 | 10 | 15 | 22 | 39 | 99 | 20.4 | 396 | 139 |
| 34020 | Toronto North | Hendon Ave./Yonge St. | 8709 | 4 | 8 | 13 | 20 | 35 | 80 | 17.7 | 300 | 116 |
| 35125 | Toronto West | 125 Resources Rd. | 8546 | 7 | 12 | 20 | 29 | 52 | 136 | 26.5 | 362 | 140 |
| 44008 | Burlington | North Shore Blvd. E./Lakeshore Rd. | 8672 | 3 | 7 | 11 | 16 | 30 | 90 | 15.5 | 251 | 98 |
| 44017 | Oakville | Eighth Line/Glenashton Dr., Halton Res. | 8688 | 3 | 5 | 8 | 12 | 24 | 64 | 11.6 | 176 | 77 |
| 45026 | Oshawa | 2000 Simcoe St. N., Durham College | 8734 | 2 | 4 | 6 | 9 | 18 | 47 | 8.8 | 132 | 49 |
| 46089 | Brampton | 525 Main St. N., Peel Manor | 8637 | 3 | 5 | 9 | 15 | 32 | 92 | 14.6 | 248 | 84 |
| 46108 | Mississauga | 3359 Mississauga Rd. N., U of T Campus | 8605 | 3 | 5 | 8 | 12 | 24 | 77 | 12.1 | 273 | 100 |
| 47045 | Barrie | 83 Perry St. | 8731 | 4 | 6 | 8 | 11 | 22 | 78 | 11.8 | 221 | 53 |
| 48006 | Newmarket | Eagle St. W./McCaffrey Rd. | 8686 | 2 | 3 | 5 | 8 | 16 | 55 | 8.2 | 193 | 64 |
| 49005 | Parry Sound | 7 Bay St. | 8730 | 1 | 2 | 2 | 4 | 8 | 24 | 4.0 | 89 | 13 |
| 51001 | Ottawa Downtown | Rideau St./Wurtemburg St. | 8677 | 3 | 4 | 7 | 10 | 19 | 44 | 9.3 | 113 | 37 |
| 51002 | Ottawa Central | 960 Carling Ave. | 8683 | 2 | 3 | 4 | 7 | 15 | 44 | 7.1 | 129 | 44 |
| 52023 | Kingston | 23 Beechgrove Lane | 8684 | 1 | 2 | 3 | 5 | 10 | 28 | 4.8 | 118 | 28 |
| 54012 | Belleville | 2 Sidney St., Water Treatment Plant | 8744 | 1 | 2 | 3 | 6 | 12 | 39 | 5.7 | 158 | 37 |
| 56051 | Cornwall | Bedford St./3rd St. W. | 8638 | 1 | 3 | 4 | 7 | 14 | 51 | 7.0 | 231 | 79 |
| 59006 | Peterborough | 10 Hospital Dr. | 8656 | 2 | 3 | 5 | 7 | 14 | 44 | 7.1 | 134 | 54 |
| 63203 | Thunder Bay | 421 James St. S. | 8441 | 3 | 4 | 7 | 12 | 27 | 67 | 11.9 | 163 | 48 |
| 71078 | Sault Ste. Marie | Sault College | 8675 | 2 | 3 | 5 | 7 | 15 | 36 | 7.3 | 125 | 27 |
| 75010 | North Bay | Chippewa St. W., Dept. National Defence | 8541 | 2 | 3 | 5 | 7 | 16 | 64 | 8.1 | 155 | 41 |
| 77233 | Sudbury | 155 Elm St. | 8666 | 3 | 4 | 6 | 10 | 21 | 76 | 10.6 | 226 | 68 |
| ID | City | Location | Valid h | Percentiles | Mean | Maximum 1h | Maximum 24h | No. of Times Above Criteria 1h | No. of Times Above Criteria 24h | No. of Times Above Criteria 1y | |||||
|---|---|---|---|---|---|---|---|---|---|---|---|---|---|---|---|
| 10% | 30% | 50% | 70% | 90% | 99% | ||||||||||
| 12008 | Windsor Downtown | 467 University Ave. W. | 8703 | 0 | 0 | 1 | 2 | 6 | 25 | 2.4 | 66 | 20 | 0 | 0 | 0 |
| 12016 | Windsor West | College Ave./South St. | 8286 | 0 | 0 | 1 | 2 | 8 | 25 | 2.8 | 59 | 24 | 0 | 0 | 0 |
| 14064 | Sarnia | Front St. N./CN Tracks, Centennial Park | 8660 | 0 | 0 | 1 | 2 | 9 | 44 | 3.5 | 95 | 40 | 0 | 0 | 0 |
| 29000 | Hamilton Downtown | Elgin St./Kelly St. | 8673 | 0 | 0 | 1 | 2 | 17 | 55 | 5.1 | 122 | 40 | 0 | 0 | 0 |
| 29114 | Hamilton Mountain | Vickers Rd./E. 18th St. | 8595 | 0 | 0 | 1 | 2 | 8 | 32 | 2.9 | 106 | 27 | 0 | 0 | 0 |
| 35125 | Toronto West | 125 Resources Rd. | 8670 | 0 | 0 | 1 | 1 | 1 | 5 | 0.7 | 21 | 6 | 0 | 0 | 0 |
| 46108 | Mississauga | 3359 Mississauga Rd. N., U of T Campus | 8654 | 0 | 1 | 1 | 2 | 3 | 6 | 1.3 | 38 | 6 | 0 | 0 | 0 |
| 51001 | Ottawa Downtown | Rideau St./Wurtemburg St. | 8661 | 0 | 0 | 0 | 0 | 1 | 2 | 0.3 | 8 | 2 | 0 | 0 | 0 |
| 71078 | Sault Ste. Marie | Sault College | 8674 | 0 | 0 | 0 | 0 | 1 | 17 | 0.8 | 53 | 11 | 0 | 0 | 0 |
| 77233 | Sudbury | 155 Elm St. | 8681 | 0 | 0 | 0 | 1 | 6 | 34 | 2.4 | 297 | 26 | 1 | 0 | 0 |
| ID | City | Location | Valid h | Percentiles | Mean | Maximum 1h | Maximum 8h | No. of Times Above Criteria 1h 8h | No. of Times Above Criteria 8h | |||||
|---|---|---|---|---|---|---|---|---|---|---|---|---|---|---|
| 10% | 30% | 50% | 70% | 90% | 99% | |||||||||
| 12008 | Windsor Downtown | 467 University Ave. W. | 8571 | 0.17 | 0.20 | 0.23 | 0.29 | 0.42 | 0.76 | 0.27 | 1.81 | 0.89 | 0 | 0 |
| 29000 | Hamilton Downtown | Elgin St./Kelly St. | 8687 | 0.16 | 0.19 | 0.22 | 0.27 | 0.40 | 0.76 | 0.26 | 2.88 | 0.98 | 0 | 0 |
| 35125 | Toronto West | 125 Resources Rd. | 8390 | 0.17 | 0.20 | 0.23 | 0.27 | 0.37 | 0.69 | 0.26 | 1.6 | 1.07 | 0 | 0 |
| 51001 | Ottawa Downtown | Rideau St./Wurtemburg St. | 8559 | 0.14 | 0.16 | 0.18 | 0.21 | 0.28 | 0.43 | 0.2 | 0.8 | 0.57 | 0 | 0 |
| ID | City | Location | Valid h | Percentiles | Mean | Maximum 1h | Maximum 24h | |||||
|---|---|---|---|---|---|---|---|---|---|---|---|---|
| 10% | 30% | 50% | 70% | 90% | 99% | |||||||
| 12016 | Windsor West | College Ave./South St. | 8460 | 0 | 0 | 0 | 0 | 1 | 3 | 0.2 | 10 | 2 |
| 14064 | Sarnia | Front St. N./CN Tracks, Centennial Park | 8708 | 0 | 0 | 1 | 1 | 2 | 3 | 0.8 | 5 | 3 |
| 29000 | Hamilton Downtown | Elgin St./Kelly St. | 8533 | 0 | 0 | 0 | 1 | 1 | 3 | 0.4 | 5 | 2 |
| 71078 | Sault Ste. Marie | Sault College | 8650 | 0 | 0 | 0 | 0 | 0 | 1 | 0.0 | 4 | 1 |
| ID | City/Town | 2005 | 2006 | 2007 | 2008 | 2009 | 2010 | 2011 | 2012 | 2013 | 2014 | Change Over Time |
|---|---|---|---|---|---|---|---|---|---|---|---|---|
| 12008 | Windsor Downtown | 25.3 | 24.6 | 27.0 | 26.9 | 24.8 | 28.0 | 27.2 | 28.0 | 26.9 | 26.0 | ↑ 7% |
| 12016 | Windsor West | 25.6 | 24.3 | 25.3 | 25.9 | 24.9 | 26.7 | 26.4 | 28.0 | 26.7 | 27.2 | ↑ 10% |
| 13001 | Chatham | 31.0 | 28.7 | 30.9 | 30.9 | 28.8 | 31.9 | 29.7 | 29.5 | 29.6 | 29.3 | ↓ 3% |
| 14064 | Sarnia | 27.4 | 26.7 | 28.6 | 28.7 | 26.6 | 30.7 | 29.7 | 29.7 | 28.6 | 27.1 | ↑ 5% |
| 15020 | Grand Bend | 32.5 | 29.7 | 31.7 | 31.3 | 29.6 | 35.0 | 32.8 | 33.2 | 32.3 | 31.0 | ↑ 4% |
| 15026 | London | 26.1 | 25.1 | 27.2 | 27.0 | 25.1 | 28.2 | 26.8 | 27.7 | 28.7 | 28.1 | ↑ 10% |
| 16015 | Port Stanley | 34.6 | 32.4 | 34.3 | 34.3 | 30.9 | 34.6 | 32.8 | 33.1 | 33.9 | 32.3 | ↓ 3% |
| 18007 | Tiverton | 31.8 | 29.0 | 34.3 | 32.6 | 31.4 | 33.8 | 32.1 | 32.0 | 32.4 | 31.8 | ↑ 2% |
| 21005 | Brantford | 27.9 | 27.0 | 28.9 | 28.4 | 26.5 | 29.4 | 28.7 | 28.8 | 29.0 | 29.4 | ↑ 6% |
| 26060 | Kitchener | 28.0 | 26.6 | 28.6 | 28.1 | 27.0 | 29.4 | 27.6 | 28.0 | 28.0 | 27.3 | → 0% |
| 27067 | St. Catharines | 26.3 | 26.2 | 28.1 | 27.5 | 25.6 | 28.3 | 28.0 | 28.7 | 28.6 | 28.5 | ↑ 9% |
| 28028 | Guelph | 28.6 | 26.8 | 28.1 | 27.9 | 27.3 | 30.7 | 28.9 | 28.8 | 29.0 | 27.8 | ↑ 4% |
| 29000 | Hamilton Downtown | 23.3 | 23.2 | 24.8 | 25.1 | 24.3 | 26.9 | 25.4 | 25.7 | 25.0 | 25.3 | ↑ 9% |
| 29114 | Hamilton Mountain | 28.2 | 27.5 | 29.2 | 29.0 | 27.2 | 29.7 | 28.8 | 30.2 | 29.5 | 29.1 | ↑ 6% |
| 29118 | Hamilton West | 21.2 | 20.9 | 23.0 | 23.3 | 21.8 | 24.5 | 24.2 | 24.2 | 24.4 | 22.7 | ↑ 13% |
| 31103 | Toronto Downtown | 24.5 | 22.6 | 25.7 | 26.0 | 24.6 | 26.1 | 25.4 | 26.6 | 26.2 | 25.7 | ↑ 9% |
| 33003 | Toronto East | 22.4 | 22.0 | 23.2 | 21.6 | 22.1 | 23.0 | 23.3 | 24.6 | 24.1 | 23.4 | ↑ 9% |
| 34020 | Toronto North | 24.5 | 23.3 | 24.5 | 22.7 | 22.1 | 24.8 | 23.6 | 25.7 | 25.3 | 25.3 | ↑ 7% |
| 35125 | Toronto West | 20.3 | 19.0 | 21.1 | 20.7 | 19.5 | 20.6 | 20.1 | 21.5 | 21.5 | 21.1 | ↑ 7% |
| 44008 | Burlington | 23.9 | 23.5 | 24.6 | 24.9 | 24.1 | 26.6 | 25.9 | 26.7 | 26.4 | 25.5 | ↑ 12% |
| 44017 | Oakville | 27.7 | 26.1 | 27.5 | 27.0 | 25.5 | 28.0 | 26.8 | 27.7 | 28.3 | 27.2 | ↑ 3% |
| 45026 | Oshawa | 28.6 | 25.1 | 28.0 | 27.0 | 25.5 | 28.0 | 26.6 | 27.0 | 27.2 | 27.2 | → 0% |
| 46089 | Brampton | 26.8 | 25.5 | 26.8 | 26.6 | 25.2 | 27.5 | 26.1 | 26.6 | 26.7 | 26.5 | ↑ 1% |
| 46108 | Mississauga | 23.1 | 22.4 | 23.3 | 24.6 | 24.0 | 25.9 | 24.1 | 25.6 | 25.2 | 25.4 | ↑ 13% |
| 47045 | Barrie | 26.9 | 24.1 | 25.9 | 26.5 | 24.3 | 26.8 | 25.3 | 26.3 | 25.5 | 25.6 | → 0% |
| 48006 | Newmarket | 30.8 | 28.8 | 31.7 | 29.5 | 28.6 | 31.5 | 27.8 | 29.4 | 28.7 | 28.6 | ↓ 6% |
| 49005 | Parry Sound | 33.8 | 30.7 | 31.8 | 32.1 | 29.7 | 31.3 | 29.7 | 30.1 | 30.4 | 29.6 | ↓ 9% |
| 49010 | Dorset | 32.3 | 28.9 | 29.9 | 29.3 | 27.7 | 28.6 | 27.0 | 28.0 | 28.1 | 27.7 | ↓ 11% |
| 51001 | Ottawa Downtown | 23.3 | 23.6 | 24.7 | 23.3 | 23.4 | 25.7 | 24.2 | 26.0 | 25.6 | 24.8 | ↑ 9% |
| 51002 | Ottawa Central | n/a | INS | 26.5 | 27.4 | 24.7 | 26.6 | 24.8 | 25.6 | 26.6 | 26.6 | ↓ 1% |
| 51010 | Petawawa | n/a | INS | 28.3 | 27.6 | 27.3 | 27.9 | 26.7 | 27.7 | 27.6 | 26.8 | ↓ 3% |
| 52023 | Kingston | n/a | INS | 33.9 | 32.7 | 30.3 | 32.6 | 30.3 | 32.7 | 30.3 | 31.4 | ↓ 6% |
| 54012 | Belleville | 29.4 | 29.2 | 32.0 | 29.8 | 28.5 | 30.0 | 27.9 | 28.0 | 29.2 | 29.6 | ↓ 4% |
| 56010 | Morrisburg | 27.8 | 28.0 | 29.2 | 27.9 | 26.1 | 28.6 | 27.2 | 28.2 | 28.7 | 27.9 | → 0% |
| 56051 | Cornwall | 27.7 | 27.5 | 28.3 | 26.6 | 25.5 | 27.9 | 26.1 | 27.1 | 26.9 | 27.3 | ↓ 3% |
| 59006 | Peterborough | 31.2 | 24.9 | 27.6 | 28.2 | 27.7 | 30.5 | 27.9 | 29.1 | 28.6 | 29.2 | ↑ 3% |
| 63203 | Thunder Bay | 22.3 | 23.5 | 24.2 | 23.0 | 24.2 | 25.7 | 25.2 | 25.0 | 26.3 | 23.4 | ↑ 10% |
| 71078 | Sault Ste. Marie | 30.2 | 29.1 | 29.7 | 28.9 | 27.8 | 28.4 | 27.8 | 28.8 | 28.9 | 28.4 | ↓ 5% |
| 75010 | North Bay | 28.0 | 26.7 | 27.1 | 27.7 | 26.1 | 28.0 | 26.7 | 26.1 | 27.4 | 26.7 | ↓ 2% |
| 77233 | Sudbury | 31.0 | 28.4 | 28.1 | 27.9 | 25.9 | 28.7 | 28.7 | 28.5 | 27.2 | 26.3 | ↓ 8% |
Notes:
n/a indicates pollutant not monitored.
INS indicates there was insufficient data in the 2nd and/or 3rd quarter to calculate a valid annual mean.
Station 15026 replaced station 15025 as the London site in 2013.
Station 45026 replaced station 45025 as the Oshawa site in 2005.
Station 46108 replaced station 46109 as the Mississauga site in 2008.
Station 52023 replaced station 52022 as the Kingston site in 2014.
Station 77233 replaced station 77219 as the Sudbury site in 2013.
| ID | City/Town | 2005 | 2006 | 2007 | 2008 | 2009 | 2010 | 2011 | 2012 | 2013 | 2014 | Change Over Time |
|---|---|---|---|---|---|---|---|---|---|---|---|---|
| 12008 | Windsor Downtown | 35.6 | 32.6 | 36.3 | 34.1 | 30.4 | 34.6 | 33.8 | 36.8 | 32.5 | 30.9 | ↓ 6% |
| 12016 | Windsor West | 35.8 | 31.9 | 33.5 | 32.1 | 29.5 | 31.8 | 31.9 | 35.7 | 30.9 | 30.9 | ↓ 6% |
| 13001 | Chatham | 39.5 | 35.5 | 38.2 | 36.7 | 32.6 | 36.5 | 34.4 | 36.6 | 34.2 | 32.4 | ↓ 12% |
| 14064 | Sarnia | 34.1 | 32.0 | 34.2 | 33.0 | 28.6 | 34.3 | 32.9 | 36.6 | 32.0 | 29.4 | ↓ 4% |
| 15020 | Grand Bend | 36.3 | 33.5 | 34.9 | 32.4 | 29.7 | 37.8 | 33.9 | 38.9 | 33.1 | 31.5 | ↓ 2% |
| 15026 | London | 33.9 | 31.2 | 33.2 | 31.6 | 28.4 | 32.5 | 30.7 | 34.4 | 30.9 | 29.5 | ↓ 6% |
| 16015 | Port Stanley | 42.3 | 38.5 | 40.4 | 38.8 | 33.2 | 38.9 | 35.5 | 38.4 | 36.9 | 33.7 | ↓ 14% |
| 18007 | Tiverton | 33.3 | 30.4 | 38.3 | 34.0 | 30.3 | 33.3 | 31.7 | 36.0 | 32.5 | 30.8 | ↓ 4% |
| 21005 | Brantford | 33.5 | 31.8 | 33.6 | 31.0 | 27.5 | 31.6 | 31.1 | 33.5 | 30.1 | 29.9 | ↓ 7% |
| 26060 | Kitchener | 34.3 | 32.0 | 34.2 | 31.0 | 28.8 | 31.6 | 30.2 | 33.5 | 29.8 | 28.5 | ↓ 12% |
| 27067 | St. Catharines | 33.6 | 32.6 | 33.9 | 31.2 | 27.7 | 32.0 | 31.2 | 35.0 | 31.2 | 29.5 | ↓ 6% |
| 28028 | Guelph | 34.0 | 31.5 | 33.1 | 30.4 | 28.7 | 32.5 | 31.3 | 34.5 | 30.4 | 28.9 | ↓ 7% |
| 29000 | Hamilton Downtown | 30.4 | 29.2 | 30.8 | 29.8 | 28.2 | 31.6 | 28.7 | 32.4 | 28.4 | 27.5 | ↓ 4% |
| 29114 | Hamilton Mountain | 36.7 | 33.7 | 36.1 | 33.6 | 31.0 | 34.4 | 32.3 | 37.4 | 32.5 | 31.6 | ↓ 7% |
| 29118 | Hamilton West | 25.7 | 25.3 | 26.9 | 26.7 | 23.9 | 27.9 | 26.2 | 29.2 | 26.4 | 22.7 | ↓ 1% |
| 31103 | Toronto Downtown | 31.9 | 28.7 | 33.2 | 30.9 | 27.9 | 31.1 | 29.5 | 33.3 | 30.1 | 28.9 | ↓ 3% |
| 33003 | Toronto East | 30.6 | 27.2 | 28.3 | 24.9 | 25.2 | 26.7 | 27.4 | 30.6 | 27.1 | 25.9 | ↓ 4% |
| 34020 | Toronto North | 30.2 | 28.6 | 29.9 | 26.4 | 25.6 | 28.0 | 27.5 | 32.7 | 29.4 | 28.6 | ↑ 2% |
| 35125 | Toronto West | 26.5 | 24.3 | 25.9 | 24.8 | 22.5 | 24.3 | 23.6 | 27.5 | 24.4 | 23.5 | ↓ 4% |
| 44008 | Burlington | 30.2 | 29.2 | 30.0 | 28.3 | 26.7 | 30.2 | 29.2 | 32.5 | 29.2 | 27.4 | ↓ 1% |
| 44017 | Oakville | 34.4 | 31.7 | 32.8 | 30.8 | 28.2 | 31.5 | 29.9 | 34.2 | 30.6 | 28.3 | ↓ 9% |
| 45026 | Oshawa | INS | 28.0 | 31.5 | 28.3 | 26.4 | 29.5 | 28.5 | 31.1 | 28.3 | 27.9 | ↓ 1% |
| 46089 | Brampton | 31.7 | 31.3 | 31.9 | 31.0 | 28.5 | 30.8 | 29.3 | 32.7 | 29.5 | 28.9 | ↓ 6% |
| 46108 | Mississauga | 31.6 | 28.5 | 28.6 | 27.3 | 26.2 | 29.0 | 26.7 | 30.4 | 26.5 | 26.5 | ↓ 9% |
| 47045 | Barrie | 30.7 | 28.1 | 28.6 | 30.0 | 25.0 | 27.9 | 26.2 | 29.7 | 25.6 | 25.4 | ↓ 13% |
| 48006 | Newmarket | 36.1 | 33.7 | 36.0 | 32.1 | 30.9 | 34.4 | 30.5 | 34.2 | 30.3 | 29.4 | ↓ 15% |
| 49005 | Parry Sound | 36.9 | 33.3 | 33.6 | 32.2 | 28.6 | 30.4 | 28.7 | 32.8 | 30.1 | 28.2 | ↓ 18% |
| 49010 | Dorset | 33.0 | 29.2 | 30.0 | 27.2 | 25.0 | 25.2 | 23.8 | 28.3 | 25.3 | 24.4 | ↓ 22% |
| 51001 | Ottawa Downtown | 27.2 | 26.5 | 28.2 | 24.9 | 24.6 | 26.1 | 25.1 | 29.3 | 26.5 | 24.6 | ↓ 3% |
| 51002 | Ottawa Central | n/a | INS | 27.9 | 25.3 | 26.3 | 25.4 | 29.4 | 27.0 | 26.2 | 26.2 | → 0% |
| 51010 | Petawawa | n/a | INS | 26.7 | 24.7 | 24.4 | 23.8 | 22.8 | 28.1 | 24.5 | 22.9 | ↓ 6% |
| 52023 | Kingston | n/a | INS | 39.3 | 35.4 | 32.5 | 35.9 | 32.0 | 38.5 | 32.4 | 32.7 | ↓ 11% |
| 54012 | Belleville | 35.6 | 34.1 | 37.0 | 32.3 | 30.6 | 34.2 | 29.9 | 32.7 | 30.6 | 30.4 | ↓ 15% |
| 56010 | Morrisburg | 30.6 | 30.6 | 31.6 | 27.8 | 26.7 | 29.5 | 27.1 | 31.1 | 28.2 | 26.8 | ↓ 9% |
| 56051 | Cornwall | 31.8 | 29.8 | 31.1 | 27.6 | 27.1 | 29.8 | 26.7 | 30.7 | 28.1 | 27.0 | ↓ 10% |
| 59006 | Peterborough | 36.5 | 27.2 | 30.0 | 31.6 | 29.2 | 32.0 | 29.8 | 34.2 | 29.5 | 30.0 | ↓ 4% |
| 63203 | Thunder Bay | 23.6 | 24.7 | 24.6 | 21.3 | 24.2 | 23.9 | 24.2 | 25.3 | 24.7 | 22.7 | ↑ 1% |
| 71078 | Sault Ste. Marie | 32.0 | 31.4 | 31.5 | 28.4 | 27.5 | 27.2 | 26.4 | 30.3 | 28.2 | 27.4 | ↓ 13% |
| 75010 | North Bay | 31.0 | 29.0 | 28.5 | 28.3 | 26.5 | 28.4 | 26.3 | 28.5 | 26.9 | 26.2 | ↓ 11% |
| 77233 | Sudbury | 32.4 | 30.1 | 29.5 | 26.0 | 25.7 | 26.3 | 26.9 | 29.8 | 28.0 | 27.0 | ↓ 11% |
Notes:
n/a indicates pollutant not monitored.
INS indicates there was insufficient data to calculate a valid summer mean.
Station 15026 replaced station 15025 as the London site in 2013.
Station 45026 replaced station 45025 as the Oshawa site in 2005.
Station 46108 replaced station 46109 as the Mississauga site in 2008.
Station 52023 replaced station 52022 as the Kingston site in 2014.
Station 77233 replaced station 77219 as the Sudbury site in 2013.
| ID | City/Town | 2005 | 2006 | 2007 | 2008 | 2009 | 2010 | 2011 | 2012 | 2013 | 2014 | Change Over Time |
|---|---|---|---|---|---|---|---|---|---|---|---|---|
| 12008 | Windsor Downtown | 16.5 | 18.8 | 20.3 | 21.7 | 20.8 | 23.2 | 22.5 | 21.7 | 22.8 | 22.8 | ↑ 29% |
| 12016 | Windsor West | 18.2 | 18.8 | 19.4 | 21.5 | 21.6 | 22.8 | 22.5 | 22.3 | 23.4 | 24.5 | ↑ 32% |
| 13001 | Chatham | 25.1 | 23.9 | 25.4 | 26.8 | 26.1 | 28.5 | 26.7 | 24.3 | 26.2 | 27.1 | ↑ 7% |
| 14064 | Sarnia | INS | 23.0 | 24.7 | 25.5 | 25.2 | 28.1 | 27.4 | 24.7 | 26.2 | 25.4 | ↑ 8% |
| 15020 | Grand Bend | 29.8 | 26.8 | 29.4 | 30.5 | 29.5 | 33.0 | 32.1 | 29.1 | 31.8 | 30.6 | ↑ 9% |
| 15026 | London | 20.4 | 20.7 | 22.8 | 23.7 | 22.8 | 25.0 | 24.2 | 22.9 | 26.9 | 27.1 | ↑ 28% |
| 16015 | Port Stanley | 29.2 | 28.0 | 30.0 | 31.0 | 29.4 | 31.5 | 31.0 | 29.3 | 31.8 | 31.3 | ↑ 8% |
| 18007 | Tiverton | 30.7 | 28.2 | 31.5 | 31.7 | 32.3 | 34.1 | 32.2 | 29.2 | 32.4 | 32.7 | ↑ 7% |
| 21005 | Brantford | 23.9 | 23.6 | 25.5 | 26.6 | 25.8 | 27.8 | 27.1 | 25.4 | 28.3 | 28.8 | ↑ 18% |
| 26060 | Kitchener | 23.4 | 22.7 | 24.6 | 26.0 | 25.9 | 27.8 | 25.7 | 24.0 | 26.7 | 26.5 | ↑ 12% |
| 27067 | St. Catharines | 20.9 | 21.7 | 24.1 | 24.9 | 24.1 | 25.6 | 25.8 | 24.1 | 26.8 | 27.9 | ↑ 26% |
| 28028 | Guelph | 24.8 | 23.4 | 24.8 | 26.1 | 26.4 | 29.3 | 27.2 | 24.8 | 28.0 | 27.0 | ↑ 13% |
| 29000 | Hamilton Downtown | 18.2 | 18.9 | 20.5 | 21.7 | 21.5 | 23.5 | 23.1 | 20.9 | 22.5 | 23.7 | ↑ 24% |
| 29114 | Hamilton Mountain | 22.1 | 23.0 | 24.2 | 25.7 | 24.5 | 26.3 | 26.3 | 25.0 | 27.3 | 27.3 | ↑ 20% |
| 29118 | Hamilton West | 17.9 | 17.8 | 20.1 | 20.9 | 20.4 | 22.1 | 22.7 | 20.6 | 23.0 | 22.8 | ↑ 27% |
| 31103 | Toronto Downtown | 19.1 | 18.2 | 20.4 | 22.2 | 22.4 | 22.4 | 22.6 | 21.8 | 23.5 | 23.5 | ↑ 24% |
| 33003 | Toronto East | 17.5 | 18.2 | 19.5 | 19.3 | 19.9 | 20.4 | 20.4 | 20.3 | 22.0 | 21.6 | ↑ 22% |
| 34020 | Toronto North | 20.4 | 19.4 | 20.7 | 20.1 | 19.5 | 22.5 | 20.8 | 20.7 | 22.3 | 22.8 | ↑ 13% |
| 35125 | Toronto West | 15.8 | 15.1 | 17.7 | 17.7 | 17.4 | 18.0 | 17.7 | 17.2 | 19.5 | 19.4 | ↑ 21% |
| 44008 | Burlington | 19.3 | 19.3 | 20.7 | 22.5 | 22.3 | 23.9 | 23.5 | 22.5 | 24.4 | 24.1 | ↑ 26% |
| 44017 | Oakville | 22.8 | 22.0 | 23.7 | 24.4 | 23.6 | 25.5 | 24.7 | 23.1 | 26.6 | 26.5 | ↑ 16% |
| 45026 | Oshawa | 24.1 | 23.0 | 25.6 | 25.7 | 24.9 | 26.9 | 25.2 | 24.1 | 26.4 | 26.7 | ↑ 9% |
| 46089 | Brampton | 23.3 | 21.4 | 23.1 | 23.4 | 22.8 | 25.2 | 23.8 | 22.2 | 24.6 | 24.8 | ↑ 9% |
| 46108 | Mississauga | 17.0 | 18.0 | 19.2 | 22.8 | 22.5 | 23.7 | 22.5 | 22.2 | 24.3 | 24.7 | ↑ 39% |
| 47045 | Barrie | 24.2 | 21.3 | 24.0 | 24.2 | 23.8 | 26.0 | 24.7 | 23.9 | 25.5 | 25.8 | ↑ 11% |
| 48006 | Newmarket | 27.0 | 25.3 | 28.6 | 27.6 | 27.1 | 29.4 | 25.8 | 26.0 | 27.5 | 28.1 | ↑ 2% |
| 49005 | Parry Sound | 31.6 | 28.9 | 30.6 | 32.0 | 30.5 | 31.9 | 30.4 | 28.1 | 30.6 | 30.6 | ↓ 2% |
| 49010 | Dorset | 31.8 | 28.6 | 30.1 | 30.7 | 29.6 | 31.0 | 29.5 | 27.7 | 30.1 | 30.1 | ↓ 3% |
| 51001 | Ottawa Downtown | 20.7 | 21.4 | 22.0 | 22.2 | 22.6 | 25.5 | 23.6 | 23.5 | 24.9 | 25.1 | ↑ 20% |
| 51002 | Ottawa Central | n/a | INS | 25.6 | 27.0 | 24.1 | 26.8 | 24.5 | 22.9 | 26.3 | 26.9 | → 0% |
| 51010 | Petawawa | n/a | INS | 29.5 | 29.6 | 29.5 | 30.8 | 29.5 | 27.5 | 29.9 | 29.6 | ↓ 1% |
| 52023 | Kingston | n/a | INS | 30.1 | 30.6 | 28.6 | 30.0 | 29.0 | 28.6 | 28.8 | 30.4 | ↓ 2% |
| 54012 | Belleville | 25.1 | 25.8 | 28.4 | 28.0 | 26.9 | 27.0 | 26.4 | 24.6 | 28.2 | 29.1 | ↑ 6% |
| 56010 | Morrisburg | 25.7 | 26.2 | 27.5 | 27.9 | 25.7 | 28.0 | 27.5 | 26.0 | 29.1 | 28.7 | ↑ 8% |
| 56051 | Cornwall | 24.8 | 25.9 | 26.3 | 26.0 | 24.5 | 26.5 | 25.7 | 24.2 | 25.7 | 27.6 | ↑ 3% |
| 59006 | Peterborough | 27.3 | 23.3 | 25.9 | 26.0 | 26.7 | 29.5 | 26.6 | 25.5 | 28.0 | 28.6 | ↑ 10% |
| 63203 | Thunder Bay | 21.7 | 22.6 | 23.9 | 24.3 | 24.2 | 27.1 | 26.1 | 24.7 | 27.4 | 23.8 | ↑ 16% |
| 71078 | Sault Ste. Marie | 28.9 | 27.5 | 28.6 | 29.3 | 28.4 | 29.3 | 28.9 | 27.6 | 29.4 | 29.2 | ↑ 2% |
| 75010 | North Bay | 25.9 | 25.0 | 26.2 | 27.2 | 25.8 | 27.7 | 27.0 | 24.4 | 27.8 | 27.1 | ↑ 5% |
| 77233 | Sudbury | 30.0 | 27.2 | 27.2 | 29.3 | 26.0 | 30.5 | 30.0 | 27.6 | 26.6 | 25.8 | ↓ 6% |
Notes:
n/a indicates pollutant not monitored.
INS indicates there was insufficient data to calculate a valid winter mean.
Station 15026 replaced station 15025 as the London site in 2013.
Station 45026 replaced station 45025 as the Oshawa site in 2005.
Station 46108 replaced station 46109 as the Mississauga site in 2008.
Station 52023 replaced station 52022 as the Kingston site in 2014.
Station 77233 replaced station 77219 as the Sudbury site in 2013.
| ID | City/Town | 2005 | 2006 | 2007 | 2008 | 2009 | 2010 | 2011 | 2012 | 2013 | 2014 |
|---|---|---|---|---|---|---|---|---|---|---|---|
| 12008 | Windsor Downtown | 10.4 | 8.2 | 9.5 | 8.3 | 7.2 | 7.7 | 7.6 | 7.4 | 9.2 | 10.1 |
| 12016 | Windsor West | 10.5 | 9.2 | 9.8 | 8.9 | 7.4 | 7.8 | 7.8 | 7.6 | 10.0 | 10.7 |
| 13001 | Chatham | 9.1 | 7.4 | 7.9 | 7.3 | 6.3 | 6.5 | 6.6 | 6.0 | 8.1 | 8.6 |
| 14064 | Sarnia | 12.9 | 11.3 | 12.2 | 11.4 | 9.8 | 10.4 | 10.5 | 10.2 | 8.5 (7.0*) | 9.0 (6.7*) |
| 15020 | Grand Bend | 7.4 | 6.5 | 6.7 | 6.8 | 5.8 | 6.1 | 6.1 | 5.8 | 7.3 | 8.1 |
| 15026 | London | 8.8 | 6.9 | 6.5 | 6.8 | 5.7 | INS | 6.2 | 6.5 | 9.1 | 8.8 |
| 16015 | Port Stanley | 8.6 | 7.3 | 7.2 | 6.7 | 5.6 | 5.9 | 6.0 | 5.9 | 7.4 (5.3*) | 8.2 (5.6*) |
| 18007 | Tiverton | 6.6 | 5.6 | 5.6 | 5.0 | 4.0 | 4.5 | 4.7 | INS | 5.8 | 6.5 |
| 21005 | Brantford | 8.9 | 7.6 | 7.7 | 6.8 | 5.8 | 6.5 | 6.6 | 6.2 | 8.5 | 9.2 |
| 26060 | Kitchener | 9.5 | 7.7 | 8.0 | 7.1 | 5.8 | 6.3 | 6.2 | 6.0 | 8.7 | 9.3 |
| 27067 | St. Catharines | 8.6 | 7.9 | 8.2 | 7.4 | 6.0 | 6.5 | 6.3 | 6.3 | 8.5 | 8.8 |
| 28028 | Guelph | 8.8 | 7.0 | 7.5 | 6.5 | 5.6 | 5.7 | 5.9 | 5.8 | 8.1 | 8.9 |
| 29000 | Hamilton Downtown | 10.0 | 9.1 | 8.9 | 8.3 | 6.8 | 7.7 | 8.1 | 8.3 | 10.1 (7.8*) | 10.8 (8.5) |
| 29114 | Hamilton Mountain | 9.8 | 8.1 | 7.8 | 7.3 | 6.3 | 6.2 | 6.7 | 6.5 | 9.2 | 9.4 |
| 29118 | Hamilton West | 9.6 | 8.2 | 8.3 | 7.6 | 6.1 | 6.8 | 7.1 | 7.3 | 9.6 | 9.9 |
| 31103 | Toronto Downtown | 8.5 | 7.3 | 7.3 | 6.6 | 5.6 | 6.0 | 6.2 | 6.4 | 8.3 | 8.7 |
| 33003 | Toronto East | 8.4 | 7.6 | 7.8 | 6.7 | 5.9 | 6.7 | 6.2 | 6.3 | 8.2 | 8.9 |
| 34020 | Toronto North | 9.4 | 7.6 | 7.8 | 7.3 | 5.9 | 6.2 | 7.7 | 7.3 | 8.3 | 9.2 |
| 35125 | Toronto West | 10.0 | 8.2 | 8.4 | 7.5 | 6.1 | 6.5 | 6.9 | 7.1 | 8.8 (6.6*) | 9.1 (6.7*) |
| 44008 | Burlington | 9.1 | 7.6 | 7.3 | 6.9 | 5.9 | 6.2 | 6.2 | 6.4 | 8.7 | 9.6 |
| 44017 | Oakville | 8.9 | 7.4 | 7.6 | 6.7 | 5.3 | 5.7 | 6.4 | 6.1 | 8.0 | 8.5 |
| 45026 | Oshawa | 8.1 | 6.8 | 6.8 | 6.3 | 5.2 | 5.6 | 5.5 | 5.5 | 7.4 | 7.7 |
| 46089 | Brampton | 8.9 | 7.2 | 7.4 | 6.8 | 5.6 | 5.8 | 6.0 | 5.7 | 8.5 | 8.9 |
| 46108 | Mississauga | 9.2 | 7.6 | 7.2 | 7.1 | 5.8 | 6.1 | 6.0 | 6.0 | 7.9 | 8.7 |
| 47045 | Barrie | 8.1 | 6.7 | 6.9 | 6.1 | 5.2 | 5.4 | 5.7 | 5.6 | 7.5 | 7.6 |
| 48006 | Newmarket | 7.7 | 6.4 | 6.6 | 6.0 | 5.1 | 5.6 | 5.5 | 5.6 | 7.3 | 7.3 |
| 49005 | Parry Sound | 6.1 | 5.3 | 5.5 | 4.7 | 3.9 | 4.4 | 4.7 | 4.8 | 5.8 | 5.8 |
| 49010 | Dorset | 5.8 | 4.5 | 5.0 | 4.5 | 3.6 | 4.0 | 4.1 | 4.1 | 5.4 | 5.3 |
| 51001 | Ottawa Downtown | 7.7 | 6.1 | 6.0 | 5.3 | 4.6 | 4.5 | 4.9 | 4.8 | 7.0 (5.1*) | 7.0 (4.8*) |
| 51002 | Ottawa Central | n/a | INS | 5.8 | 5.1 | 4.4 | 4.3 | 4.5 | 5.0 | 7.1 | 6.8 |
| 51010 | Petawawa | n/a | INS | 4.0 | 3.9 | 3.1 | 3.2 | 3.4 | 3.6 | 4.8 | 4.7 |
| 52023 | Kingston | n/a | INS | 7.5 | 7.0 | 6.4 | 6.5 | 6.9 | 6.8 | 6.5 | 6.8 |
| 54012 | Belleville | 7.0 | 6.2 | 6.2 | 6.1 | 4.9 | INS | 4.8 | 5.1 | 6.9 | 6.8 |
| 56010 | Morrisburg | 7.0 | 6.8 | 6.2 | 5.7 | 5.0 | 5.3 | 5.2 | 5.0 | 6.7 | 7.0 |
| 56051 | Cornwall | 7.6 | 6.5 | 6.4 | 6.1 | 5.4 | 5.7 | 5.7 | 5.4 | 7.7 (5.2*) | 7.0 (5.1*) |
| 59006 | Peterborough | 7.5 | 6.3 | 6.4 | 6.0 | 4.9 | 5.1 | 5.5 | 4.9 | 7.4 | 6.9 |
| 63203 | Thunder Bay | 4.4 | 4.8 | 4.4 | 4.2 | 3.8 | 4.1 | 4.8 | 4.1 | 6.3 | 6.6 |
| 71078 | Sault Ste. Marie | 5.4 | 5.2 | 5.3 | 4.4 | 4.0 | 4.1 | 4.4 | 4.4 | 5.6 | 6.0 |
| 75010 | North Bay | 5.6 | 4.9 | 5.0 | 4.6 | 3.8 | 3.8 | 4.2 | 4.1 | 5.2 (3.8*) | 5.3 (3.8*) |
| 77233 | Sudbury | 5.1 | 4.6 | 4.9 | 4.1 | 3.4 | 3.6 | 4.0 | 4.0 | 5.7 | 6.0 |
Notes:
* For data comparison purposes, measurements were taken by Tapered Element Oscillating Microbalance (TEOM) sampler at selected sites. From 2004-2012, measurements taken by TEOM sampler operated at 30°C with a Sample Equilibration System (SES).
As of 2013, measurements taken by Synchronized Hybrid Ambient Real-time Particulate (SHARP) 5030. Due to change in the PM2.5 monitoring method in 2013, it is inappropriate to calculate a change over time. n/a indicates pollutant not monitored.
INS indicates there was insufficient data in any one quarter to calculate a valid annual mean.
Station 15026 replaced station 15025 as the London site in 2013.
Station 45026 replaced station 45025 as the Oshawa site in 2005.
Station 46108 replaced station 46109 as the Mississauga site in 2008.
Station 52023 replaced station 52022 as the Kingston site in 2014.
Station 77233 replaced station 77219 as the Sudbury site in 2013.
| ID | City/Town | 2005 | 2006 | 2007 | 2008 | 2009 | 2010 | 2011 | 2012 | 2013 | 2014 | Change Over Time |
|---|---|---|---|---|---|---|---|---|---|---|---|---|
| 12008 | Windsor Downtown | 7.8 | 7.2 | 6.4 | 5.9 | 5.6 | 4.7 | 4.5 | 4.7 | 3.7 | 4.0 | ↓ 53% |
| 12016 | Windsor West | 8.3 | 7.2 | 6.5 | 5.1 | 5.4 | 6.1 | 3.8 | 4.6 | 3.6 | 3.8 | ↓ 56% |
| 13001 | Chatham | 2.5 | 2.6 | 2.4 | 3.1 | 3.5 | 2.6 | 1.9 | 1.8 | 1.6 | 1.5 | ↓ 43% |
| 14064 | Sarnia | 3.8 | 3.7 | 3.2 | 3.2 | 2.8 | 2.2 | 3.1 | 2.1 | 1.7 | 1.9 | ↓ 53% |
| 15026 | London | 5.5 | 4.4 | 3.6 | 3.1 | 2.8 | 2.9 | 3.3 | 4.2 | 1.4 | 1.3 | ↓ 64% |
| 18007 | Tiverton | n/a | INS | 0.2 | 0.2 | 0.4 | 0.7 | 0.9 | 0.7 | 0.1 | 1.3 | not available |
| 21005 | Brantford | 3.8 | 2.5 | 1.8 | 1.3 | 1.7 | 1.3 | 1.2 | 1.1 | 1.2 | 0.9 | ↓ 78% |
| 26060 | Kitchener | 4.4 | 3.5 | 2.7 | 2.5 | 2.1 | 2.5 | 2.0 | 2.1 | 1.6 | 1.6 | ↓ 64% |
| 27067 | St. Catharines | 5.5 | 5.5 | 4.5 | 3.6 | 3.7 | 2.8 | 2.3 | 2.5 | 2.2 | 1.7 | ↓ 73% |
| 29000 | Hamilton Downtown | 9.9 | 8.0 | 7.7 | 6.5 | 5.8 | 5.0 | 4.8 | 4.6 | 4.3 | 3.9 | ↓ 62% |
| 29114 | Hamilton Mountain | n/a | 3.6 | 3.2 | 2.4 | 2.5 | 2.2 | 2.3 | 1.9 | 2.0 | 2.0 | ↓ 48% |
| 31103 | Toronto Downtown | 7.2 | 7.0 | 5.9 | 5.0 | 5.1 | 4.1 | 3.4 | 2.8 | 2.7 | 2.5 | ↓ 72% |
| 33003 | Toronto East | 14.4 | 12.5 | 10.8 | 9.2 | 7.8 | 7.8 | 7.6 | 6.6 | 5.7 | 6.2 | ↓ 63% |
| 34020 | Toronto North | 10.8 | 10.0 | 8.3 | 7.7 | 7.1 | 5.7 | 6.2 | 5.0 | 4.1 | 4.3 | ↓ 65% |
| 35125 | Toronto West | 26.1 | 20.1 | 17.5 | 16.2 | 13.5 | 13.4 | 12.4 | 11.3 | 8.6 | 9.5 | ↓ 67% |
| 44008 | Burlington | 12.3 | 9.8 | 8.8 | 6.5 | 5.9 | 5.0 | 4.6 | 4.6 | 4.6 | 4.6 | ↓ 71% |
| 44017 | Oakville | 5.2 | 4.3 | 3.9 | 4.0 | 3.5 | 3.6 | 2.7 | 3.4 | 2.1 | 3.4 | ↓ 44% |
| 45026 | Oshawa | INS | 3.8 | 3.2 | 3.2 | 3.0 | 2.3 | 2.3 | 2.1 | 1.5 | 2.0 | ↓ 56% |
| 46089 | Brampton | 8.9 | 9.1 | 6.0 | 5.8 | 6.5 | 3.7 | 4.6 | 4.4 | 4.6 | 4.0 | ↓ 60% |
| 47045 | Barrie | 7.1 | 8.0 | 5.5 | 5.5 | 5.1 | 4.3 | 3.8 | 3.2 | 3.2 | 3.7 | ↓ 62% |
| 48006 | Newmarket | 3.5 | 3.0 | 2.2 | 2.6 | 3.2 | 2.3 | 2.2 | 2.0 | 1.5 | 1.4 | ↓ 54% |
| 51001 | Ottawa Downtown | 3.3 | 3.0 | 3.4 | 2.7 | 2.4 | 1.6 | 1.8 | 2.4 | 2.1 | 1.9 | ↓ 45% |
| 51002 | Ottawa Central | n/a | INS | 2.4 | 2.7 | 1.8 | 1.4 | 1.5 | 2.0 | 2.8 | 1.0 | ↓ 29% |
| 52023 | Kingston | n/a | INS | 0.6 | 1.1 | 0.6 | 0.3 | 0.5 | 0.4 | 0.2 | 0.8 | ↓ 43% |
| 54012 | Belleville | 4.5 | 3.0 | 3.2 | 3.0 | 1.9 | 2.3 | 2.3 | 1.6 | 1.7 | 1.2 | ↓ 70% |
| 56051 | Cornwall | n/a | 3.1 | 3.5 | 3.6 | 3.2 | 2.0 | 1.9 | 2.2 | 1.9 | 1.5 | ↓ 65% |
| 59006 | Peterborough | n/a | 2.5 | 2.3 | 3.0 | 1.9 | 1.7 | 2.2 | 1.8 | 1.7 | 1.8 | ↓ 36% |
| 63203 | Thunder Bay | n/a | 6.1 | 5.4 | 5.1 | 5.7 | 4.6 | 5.9 | 5.1 | 4.7 | 4.2 | ↓ 22% |
| 71078 | Sault Ste. Marie | INS | 1.6 | 1.4 | 1.4 | 1.8 | 1.9 | 2.0 | 1.7 | 1.3 | 2.0 | ↑ 18% |
| 75010 | North Bay | 3.7 | 4.4 | 3.5 | 3.8 | 4.2 | 3.4 | 4.0 | 2.9 | 2.5 | 2.6 | ↓ 34% |
Notes:
n/a indicates pollutant not monitored.
INS indicates there was insufficient data to calculate a valid annual mean.
The measured NO concentrations at Tiverton are mostly below instrument detection limits and are considered regional background levels. As such, a meaningful change over time could not be calculated with any statistical significance.
Station 15026 replaced station 15025 as the London site in 2013.
Station 45026 replaced station 45025 as the Oshawa site in 2005.
Station 52023 replaced station 52022 as the Kingston site in 2014.
| ID | City/Town | 2005 | 2006 | 2007 | 2008 | 2009 | 2010 | 2011 | 2012 | 2013 | 2014 | Change Over Time |
|---|---|---|---|---|---|---|---|---|---|---|---|---|
| 12008 | Windsor Downtown | 16.9 | 17.2 | 17.2 | 15.2 | 14.4 | 15.6 | 14.5 | 13.2 | 12.4 | 14.0 | ↓ 26% |
| 12016 | Windsor West | 17.1 | 15.7 | 16.1 | 16.2 | 13.2 | 14.5 | 12.9 | 11.4 | 11.5 | 11.8 | ↓ 35% |
| 13001 | Chatham | 11.0 | 9.5 | 8.6 | 7.0 | 7.5 | 6.4 | 6.6 | 5.7 | 6.0 | 6.8 | ↓ 44% |
| 14064 | Sarnia | 12.7 | 11.0 | 11.3 | 10.8 | 8.2 | 8.0 | 8.6 | 8.6 | 8.1 | 9.0 | ↓ 35% |
| 15026 | London | 14.1 | 12.3 | 11.7 | 10.8 | 9.0 | 8.8 | 8.3 | 6.3 | 6.4 | 6.9 | ↓ 58% |
| 18007 | Tiverton | n/a | INS | 2.9 | 3.0 | 2.3 | 1.9 | 2.5 | 2.5 | 1.9 | 2.7 | ↓ 19% |
| 21005 | Brantford | 10.1 | 8.8 | 7.7 | 6.9 | 7.3 | 5.8 | 6.1 | 5.4 | 4.8 | 5.5 | ↓ 50% |
| 26060 | Kitchener | 12.9 | 10.8 | 9.7 | 9.0 | 8.6 | 7.7 | 7.7 | 7.1 | 6.7 | 7.0 | ↓ 48% |
| 27067 | St. Catharines | 13.1 | 11.7 | 12.0 | 10.4 | 9.9 | 9.1 | 8.5 | 8.1 | 7.7 | 7.3 | ↓ 46% |
| 29000 | Hamilton Downtown | 19.3 | 17.0 | 17.0 | 14.7 | 13.6 | 12.7 | 13.5 | 11.9 | 12.4 | 12.4 | ↓ 38% |
| 29114 | Hamilton Mountain | n/a | 11.6 | 11.9 | 10.5 | 9.9 | 8.9 | 9.9 | 8.6 | 9.0 | 9.3 | ↓ 25% |
| 31103 | Toronto Downtown | 20.7 | 19.2 | 18.2 | 17.0 | 16.5 | 16.1 | 14.9 | 13.4 | 13.5 | 14.0 | ↓ 36% |
| 33003 | Toronto East | 20.1 | 17.4 | 17.2 | 16.5 | 14.9 | 14.8 | 15.2 | 14.0 | 13.6 | 14.2 | ↓ 29% |
| 34020 | Toronto North | 19.2 | 17.4 | 16.7 | 16.5 | 15.8 | 14.3 | 15.4 | 13.4 | 12.9 | 13.4 | ↓ 31% |
| 35125 | Toronto West | 26.6 | 22.3 | 22.1 | 20.8 | 19.0 | 20.1 | 19.1 | 16.3 | 16.1 | 17.1 | ↓ 36% |
| 44008 | Burlington | 17.2 | 16.2 | 16.0 | 13.6 | 12.5 | 12.2 | 11.8 | 11.0 | 11.0 | 10.9 | ↓ 41% |
| 44017 | Oakville | 14.5 | 12.5 | 13.0 | 12.0 | 11.1 | 9.2 | 10.3 | 9.1 | 9.2 | 8.2 | ↓ 42% |
| 45026 | Oshawa | INS | 8.9 | 8.1 | 8.5 | 7.4 | 7.2 | 7.0 | 5.6 | 5.9 | 6.8 | ↓ 33% |
| 46089 | Brampton | 16.9 | 15.2 | 13.9 | 13.1 | 13.3 | 10.7 | 11.3 | 10.4 | 9.1 | 10.6 | ↓ 43% |
| 47045 | Barrie | 13.8 | 12.6 | 11.5 | 10.8 | 9.9 | 8.7 | 8.6 | 8.1 | 7.8 | 8.1 | ↓ 46% |
| 48006 | Newmarket | 8.5 | 9.0 | 8.3 | 8.0 | 7.8 | 7.2 | 8.1 | 7.2 | 6.8 | 6.8 | ↓ 23% |
| 51001 | Ottawa Downtown | 9.8 | 8.6 | 8.7 | 11.4 | 8.6 | 7.4 | 7.9 | 7.8 | 7.9 | 7.4 | ↓ 24% |
| 51002 | Ottawa Central | n/a | INS | 7.9 | 8.1 | 6.6 | 6.2 | 6.6 | 6.6 | 6.6 | 6.0 | ↓ 22% |
| 52023 | Kingston | n/a | INS | 5.5 | 5.5 | 5.0 | 4.3 | 4.6 | 4.0 | 3.6 | 3.9 | ↓ 35% |
| 54012 | Belleville | 8.2 | 4.5 | 6.4 | 7.3 | 6.0 | 5.5 | 6.3 | 4.7 | 4.7 | 4.5 | ↓ 34% |
| 56051 | Cornwall | n/a | 6.7 | 7.6 | 7.5 | 7.3 | 6.5 | 6.5 | 6.1 | 6.2 | 5.6 | ↓ 25% |
| 59006 | Peterborough | n/a | 6.3 | 6.4 | 7.0 | 5.6 | 5.0 | 4.3 | 3.7 | 5.0 | 5.3 | ↓ 33% |
| 63203 | Thunder Bay | n/a | 8.1 | 8.7 | 8.1 | 8.4 | 7.8 | 8.6 | 7.3 | 7.3 | 7.8 | ↓ 11% |
| 71078 | Sault Ste. Marie | INS | 5.2 | 5.0 | 5.5 | 5.1 | 5.5 | 5.3 | 4.8 | 5.0 | 5.3 | ↓ 2% |
| 75010 | North Bay | 6.8 | 7.7 | 7.4 | 7.5 | 8.2 | 7.6 | 7.4 | 6.1 | 5.8 | 5.6 | ↓ 21% |
Notes:
n/a indicates pollutant not monitored.
INS indicates there was insufficient data to calculate a valid annual mean.
Station 15026 replaced station 15025 as the London site in 2013.
Station 45026 replaced station 45025 as the Oshawa site in 2005.
Station 52023 replaced station 52022 as the Kingston site in 2014.
| ID | City/Town | 2005 | 2006 | 2007 | 2008 | 2009 | 2010 | 2011 | 2012 | 2013 | 2014 | Change Over Time |
|---|---|---|---|---|---|---|---|---|---|---|---|---|
| 12008 | Windsor Downtown | 24.9 | 24.4 | 23.6 | 21.1 | 20.0 | 20.2 | 18.9 | 17.8 | 16.2 | 18.0 | ↓ 34% |
| 12016 | Windsor West | 25.6 | 22.8 | 22.6 | 21.3 | 18.6 | 20.6 | 16.7 | 16.0 | 15.2 | 15.7 | ↓ 42% |
| 13001 | Chatham | 13.5 | 12.1 | 11.0 | 10.1 | 10.9 | 9.0 | 8.4 | 7.5 | 7.7 | 8.2 | ↓ 44% |
| 14064 | Sarnia | 16.8 | 14.7 | 14.5 | 13.9 | 11.0 | 10.2 | 11.7 | 10.7 | 9.8 | 10.9 | ↓ 40% |
| 15026 | London | 19.4 | 16.7 | 15.3 | 13.9 | 11.9 | 11.7 | 11.6 | 10.5 | 7.8 | 8.3 | ↓ 59% |
| 18007 | Tiverton | n/a | INS | 3.0 | 3.3 | 2.7 | 2.6 | 3.4 | 3.1 | 2.1 | 4.0 | ↑ 8% |
| 21005 | Brantford | 13.7 | 11.3 | 9.5 | 8.2 | 9.1 | 7.2 | 7.3 | 6.7 | 5.7 | 6.4 | ↓ 57% |
| 26060 | Kitchener | 17.4 | 14.3 | 12.4 | 11.5 | 10.8 | 10.3 | 9.6 | 9.2 | 8.3 | 8.5 | ↓ 52% |
| 27067 | St. Catharines | 18.8 | 17.2 | 16.5 | 14.0 | 13.7 | 11.8 | 10.9 | 10.6 | 9.9 | 9.1 | ↓ 54% |
| 29000 | Hamilton Downtown | 30.1 | 24.9 | 24.7 | 21.2 | 19.5 | 17.8 | 18.3 | 16.6 | 16.8 | 16.3 | ↓ 47% |
| 29114 | Hamilton Mountain | n/a | 15.3 | 15.1 | 12.9 | 12.4 | 11.2 | 12.2 | 10.5 | 11.0 | 11.3 | ↓ 30% |
| 31103 | Toronto Downtown | 28.2 | 26.1 | 24.2 | 22.1 | 21.6 | 20.3 | 18.4 | 16.2 | 16.1 | 16.5 | ↓ 46% |
| 33003 | Toronto East | 34.7 | 29.9 | 28.0 | 25.7 | 22.7 | 22.6 | 22.8 | 20.6 | 19.4 | 20.4 | ↓ 43% |
| 34020 | Toronto North | 30.4 | 27.5 | 25.0 | 24.3 | 22.8 | 20.0 | 21.5 | 18.5 | 17.0 | 17.7 | ↓ 44% |
| 35125 | Toronto West | 52.4 | 42.4 | 39.6 | 37.0 | 32.5 | 33.5 | 31.5 | 27.6 | 24.7 | 26.5 | ↓ 51% |
| 44008 | Burlington | 29.3 | 26.0 | 24.8 | 20.0 | 18.4 | 17.2 | 16.4 | 15.6 | 15.6 | 15.5 | ↓ 52% |
| 44017 | Oakville | 19.5 | 16.7 | 16.9 | 16.1 | 14.6 | 12.8 | 13.0 | 12.6 | 11.2 | 11.6 | ↓ 42% |
| 45026 | Oshawa | INS | 12.7 | 11.3 | 11.7 | 10.4 | 9.5 | 9.2 | 7.8 | 7.4 | 8.8 | ↓ 39% |
| 46089 | Brampton | 25.9 | 24.2 | 19.9 | 18.9 | 19.9 | 14.4 | 15.9 | 14.8 | 13.9 | 14.6 | ↓ 48% |
| 47045 | Barrie | 21.0 | 20.6 | 17.0 | 16.3 | 15.1 | 13.1 | 12.4 | 11.3 | 11.0 | 11.8 | ↓ 52% |
| 48006 | Newmarket | 12.2 | 11.8 | 10.4 | 10.4 | 11.0 | 9.5 | 10.3 | 9.2 | 8.4 | 8.2 | ↓ 31% |
| 51001 | Ottawa Downtown | 13.7 | 11.5 | 12.0 | 14.0 | 11.0 | 9.0 | 9.7 | 10.2 | 10.1 | 9.3 | ↓ 31% |
| 51002 | Ottawa Central | n/a | INS | 10.2 | 10.8 | 8.4 | 7.5 | 8.1 | 8.7 | 9.4 | 7.1 | ↓ 23% |
| 52023 | Kingston | n/a | INS | 6.3 | 6.5 | 5.7 | 4.7 | 5.3 | 4.6 | 3.8 | 4.8 | ↓ 35% |
| 54012 | Belleville | 12.6 | 7.5 | 9.6 | 10.2 | 7.9 | 7.8 | 8.7 | 6.4 | 6.3 | 5.7 | ↓ 46% |
| 56051 | Cornwall | n/a | 9.8 | 11.0 | 11.1 | 10.6 | 8.5 | 8.4 | 8.4 | 8.0 | 7.0 | ↓ 38% |
| 59006 | Peterborough | n/a | 8.8 | 8.6 | 10.0 | 7.5 | 6.7 | 6.6 | 5.4 | 6.6 | 7.1 | ↓ 34% |
| 63203 | Thunder Bay | n/a | 14.2 | 14.1 | 13.2 | 14.1 | 12.4 | 14.5 | 12.4 | 12.0 | 11.9 | ↓ 15% |
| 71078 | Sault Ste. Marie | INS | 6.9 | 6.4 | 6.9 | 6.9 | 7.4 | 7.2 | 6.4 | 6.3 | 7.3 | ↑ 1% |
| 75010 | North Bay | 11.2 | 12.1 | 10.9 | 11.3 | 12.4 | 11.0 | 11.5 | 9.1 | 8.3 | 8.1 | ↓ 28% |
Notes:
n/a indicates pollutant not monitored.
INS indicates there was insufficient data to calculate a valid annual mean.
Station 15026 replaced station 15025 as the London site in 2013.
Station 45026 replaced station 45025 as the Oshawa site in 2005.
Station 52023 replaced station 52022 as the Kingston site in 2014.
| ID | City/Town | 2005 | 2006 | 2007 | 2008 | 2009 | 2010 | 2011 | 2012 | 2013 | 2014 | Change Over Time |
|---|---|---|---|---|---|---|---|---|---|---|---|---|
| 12008 | Windsor Downtown | 1.3 | 2.9 | 5.0 | 1.3 | 1.4 | 2.5 | 3.8 | 2.1 | 1.9 | 1.8 | ↓ 18% |
| 29000 | Hamilton Downtown | 2.6 | 2.8 | 6.0 | 3.3 | 5.0 | 2.2 | 1.8 | 1.7 | 2.0 | 2.9 | ↓ 45% |
| 35125 | Toronto West | 2.7 | 3.0 | 1.4 | 1.7 | 1.6 | 1.8 | 1.4 | 1.4 | 1.4 | 1.6 | ↓ 49% |
| 51001 | Ottawa Downtown | 2.0 | 1.4 | 1.5 | 1.3 | 1.4 | 1.5 | 1.5 | 0.9 | 0.9 | 0.8 | ↓ 50% |
| ID | City/Town | 2005 | 2006 | 2007 | 2008 | 2009 | 2010 | 2011 | 2012 | 2013 | 2014 | Change Over Time |
|---|---|---|---|---|---|---|---|---|---|---|---|---|
| 12008 | Windsor Downtown | 4.9 | 5.0 | 5.5 | 4.5 | 3.5 | 3.5 | 3.5 | 2.8 | 2.4 | 2.4 | ↓ 58% |
| 12016 | Windsor West | 5.1 | 4.9 | 5.2 | 4.7 | 3.6 | 3.2 | 3.4 | 2.8 | 2.6 | 2.8 | ↓ 56% |
| 14064 | Sarnia | 7.8 | 8.3 | 8.0 | 7.7 | 4.5 | 3.9 | 5.3 | 4.1 | 3.8 | 3.5 | ↓ 64% |
| 29000 | Hamilton Downtown | 5.3 | 4.8 | 4.2 | 4.3 | 3.3 | 3.3 | 5.2 | 4.8 | 4.8 | 5.1 | ↑ 5% |
| 29114 | Hamilton Mountain | n/a | 3.3 | 3.5 | 3.0 | 3.0 | 2.9 | 4.1 | 3.7 | 2.8 | 2.9 | ↓ 5% |
| 35125 | Toronto West | 2.3 | 2.0 | 1.5 | 1.4 | 1.2 | 0.9 | 1.5 | 0.6 | 0.6 | 0.7 | ↓ 75% |
| 46108 | Mississauga | 2.6 | INS | n/a | 1.6 | 1.1 | 1.0 | 1.3 | 0.6 | 0.7 | 1.3 | ↓ 71% |
| 51001 | Ottawa Downtown | 1.5 | 1.1 | 0.9 | 1.0 | 0.9 | 0.2 | 0.4 | 0.3 | 0.3 | 0.3 | ↓ 94% |
| 71078 | Sault Ste. Marie | 1.5 | 1.4 | 1.8 | 1.2 | 0.6 | 0.7 | 0.8 | 0.6 | 0.8 | 0.8 | ↓ 64% |
| 77233 | Sudbury | 2.8 | 2.4 | 2.3 | 2.0 | 1.1 | 1.3 | 1.5 | 1.3 | 2.8 | 2.4 | ↓ 17% |
Notes:
n/a indicates pollutant not monitored.
INS indicates there was insufficient data to calculate a valid annual mean.
Station 46108 replaced station 46109 as the Mississauga site in 2008.
Station 77233 replaced station 77219 as the Sudbury site in 2013.
| City/Town | No. of Valid Hours | Percentage of Valid Hours AQI in Range | No. of Days At Least 1 Hour > 49 | ||||
|---|---|---|---|---|---|---|---|
| Very Good 0-15 |
Good 16-31 |
Moderate 32-49 |
Poor 50-99 |
Very Poor 100+ |
|||
| Windsor Downtown | 8709 | 27.2 | 62.3 | 10.4 | 0.1 | 0 | 3 |
| Windsor West | 8737 | 23.5 | 63.6 | 12.7 | 0.2 | 0 | 5 |
| Chatham | 8751 | 24.2 | 68.0 | 7.9 | <0.1 | 0 | 1 |
| Sarnia | 8727 | 26.1 | 65.8 | 7.8 | 0.2 | <0.1 | 6 |
| Grand Bend | 8711 | 20.1 | 70.8 | 9.0 | 0.1 | 0 | 3 |
| London | 8749 | 24.4 | 66.3 | 9.2 | 0.1 | 0 | 3 |
| Port Stanley | 8747 | 18.3 | 72.4 | 9.2 | <0.1 | 0 | 2 |
| Tiverton | 8646 | 20.1 | 74.7 | 5.2 | <0.1 | 0 | 1 |
| Brantford | 8715 | 21.7 | 67.8 | 10.4 | 0.1 | 0 | 3 |
| Kitchener | 8735 | 25.3 | 66.0 | 8.5 | 0.3 | 0 | 7 |
| St. Catharines | 8720 | 22.1 | 70.6 | 7.3 | <0.1 | 0 | 2 |
| Guelph | 8663 | 24.7 | 66.6 | 8.4 | 0.3 | 0 | 7 |
| Hamilton Downtown | 8739 | 24.8 | 63.6 | 11.4 | 0.2 | 0 | 5 |
| Hamilton Mountain | 8723 | 20.7 | 68.9 | 10.4 | 0.1 | 0 | 3 |
| Hamilton West | 8747 | 30.9 | 61.3 | 7.4 | 0.4 | 0 | 9 |
| Toronto Downtown | 8739 | 33.3 | 60.1 | 6.4 | 0.1 | 0 | 2 |
| Toronto East | 8757 | 37.3 | 56.1 | 6.6 | 0.1 | 0 | 3 |
| Toronto North | 8715 | 29.9 | 62.8 | 7.1 | 0.2 | 0 | 6 |
| Toronto West | 8739 | 44.0 | 49.4 | 6.4 | 0.2 | 0 | 6 |
| Burlington | 8739 | 29.2 | 62.6 | 8.0 | 0.2 | 0 | 3 |
| Oakville | 8746 | 28.4 | 65.1 | 6.4 | 0.1 | 0 | 2 |
| Oshawa | 8742 | 29.3 | 65.4 | 5.3 | <0.1 | 0 | 1 |
| Brampton | 8741 | 28.0 | 63.0 | 8.7 | 0.3 | 0 | 9 |
| Mississauga | 8724 | 31.9 | 61.4 | 6.6 | 0.2 | 0 | 5 |
| Barrie | 8740 | 32.4 | 63.2 | 4.3 | <0.1 | 0 | 1 |
| Newmarket | 8748 | 26.5 | 66.7 | 6.7 | 0.1 | 0 | 5 |
| Parry Sound | 8745 | 25.3 | 71.4 | 3.2 | 0 | 0 | 0 |
| Dorset | 8742 | 31.5 | 66.0 | 2.5 | 0 | 0 | 0 |
| Ottawa Downtown | 8745 | 38.6 | 58.7 | 2.7 | <0.1 | 0 | 1 |
| Ottawa Central | 8747 | 32.2 | 64.2 | 3.6 | 0 | 0 | 0 |
| Petawawa | 8745 | 35.7 | 62.8 | 1.5 | 0 | 0 | 0 |
| Kingston | 8741 | 21.8 | 72.0 | 6.1 | 0.1 | 0 | 2 |
| Belleville | 8751 | 24.6 | 69.8 | 5.6 | 0 | 0 | 0 |
| Morrisburg | 8755 | 27.8 | 69.0 | 3.1 | <0.1 | 0 | 1 |
| Cornwall | 8714 | 28.9 | 67.9 | 3.2 | <0.1 | 0 | 1 |
| Peterborough | 8741 | 25.9 | 69.2 | 4.9 | <0.1 | 0 | 1 |
| Thunder Bay | 8496 | 36.0 | 62.6 | 1.4 | 0 | 0 | 0 |
| Sault Ste. Marie | 8739 | 30.1 | 66.9 | 3.0 | 0 | 0 | 0 |
| North Bay | 8748 | 35.0 | 62.8 | 2.2 | 0 | 0 | 0 |
| Sudbury | 8751 | 33.9 | 63.5 | 2.6 | <0.1 | 0 | 1 |
| Air Quality Forecast Region | 2005 | 2006 | 2007 | 2008 | 2009 | 2010 | 2011 | 2012 | 2013 | 2014 | ||||||||||
|---|---|---|---|---|---|---|---|---|---|---|---|---|---|---|---|---|---|---|---|---|
| Adv. | Days | Adv. | Days | Adv. | Days | Adv. | Days | Adv. | Days | Adv. | Days | Adv. | Days | Adv. | Days | Adv. | Days | Adv. | Days | |
| Algonquin | 5 | 16 | 1 | 3 | 1 | 3 | 0 | 0 | 1 | 1 | 0 | 0 | 0 | 0 | 1 | 3 | 0 | 0 | 0 | 0 |
| Bancroft-Bon Echo | 7 | 21 | 1 | 3 | 4 | 13 | 2 | 3 | 2 | 4 | 1 | 5 | 0 | 0 | 2 | 5 | 1 | 2 | 0 | 0 |
| Barrie-Orillia-Midland | 13 | 39 | 5 | 11 | 8 | 21 | 3 | 7 | 2 | 4 | 1 | 4 | 1 | 1 | 7 | 15 | 0 | 0 | 0 | 0 |
| Belleville-Quinte-Northumberland | 13 | 42 | 5 | 12 | 9 | 24 | 4 | 8 | 2 | 4 | 2 | 8 | 1 | 1 | 6 | 13 | 1 | 2 | 0 | 0 |
| Brockville-Leeds and Grenville | 7 | 24 | 2 | 5 | 3 | 5 | 2 | 4 | 2 | 4 | 1 | 2 | 0 | 0 | 2 | 4 | 1 | 2 | 0 | 0 |
| Burk’s Falls Bayfield Inlet | 8 | 24 | 2 | 4 | 1 | 3 | 0 | 0 | 1 | 1 | 0 | 0 | 0 | 0 | 2 | 4 | 0 | 0 | 0 | 0 |
| City of Hamilton | 13 | 45 | 5 | 11 | 10 | 31 | 6 | 13 | 2 | 4 | 2 | 8 | 2 | 2 | 7 | 18 | 1 | 2 | 0 | 0 |
| City of Ottawa | 7 | 25 | 2 | 5 | 2 | 4 | 1 | 1 | 2 | 4 | 1 | 2 | 0 | 0 | 1 | 2 | 1 | 2 | 0 | 0 |
| City of Toronto | 14 | 48 | 5 | 11 | 11 | 29 | 6 | 13 | 2 | 4 | 2 | 8 | 1 | 1 | 8 | 16 | 1 | 2 | 0 | 0 |
| Cornwall-Morrisburg | 7 | 25 | 2 | 5 | 3 | 5 | 2 | 4 | 2 | 4 | 1 | 2 | 0 | 0 | 1 | 2 | 1 | 2 | 0 | 0 |
| Dufferin-Innisfil | 13 | 44 | 5 | 11 | 9 | 27 | 3 | 7 | 2 | 4 | 1 | 5 | 1 | 1 | 7 | 15 | 0 | 0 | 0 | 0 |
| Dunnville-Caledonia-Haldimand | 13 | 45 | 5 | 11 | 12 | 31 | 4 | 11 | 2 | 4 | 2 | 8 | 1 | 1 | 6 | 16 | 0 | 0 | 0 | 0 |
| Elgin | 12 | 45 | 4 | 13 | 13 | 37 | 6 | 15 | 2 | 4 | 2 | 10 | 2 | 4 | 7 | 18 | 0 | 0 | 0 | 0 |
| Elliot Lake-Ranger Lake | 4 | 12 | 1 | 3 | 1 | 3 | 0 | 0 | 0 | 0 | 0 | 0 | 0 | 0 | 2 | 4 | 0 | 0 | 0 | 0 |
| Greater Sudbury and Vicinity | 7 | 20 | 2 | 4 | 1 | 3 | 0 | 0 | 1 | 1 | 0 | 0 | 0 | 0 | 2 | 4 | 0 | 0 | 0 | 0 |
| Grey-Bruce | 10 | 32 | 4 | 10 | 9 | 22 | 1 | 2 | 2 | 4 | 2 | 8 | 1 | 1 | 6 | 14 | 0 | 0 | 0 | 0 |
| Haliburton | 10 | 30 | 4 | 10 | 6 | 17 | 1 | 2 | 2 | 4 | 1 | 4 | 0 | 0 | 3 | 6 | 0 | 0 | 0 | 0 |
| Halton-Peel | 14 | 48 | 5 | 11 | 11 | 31 | 6 | 13 | 2 | 4 | 2 | 8 | 1 | 1 | 8 | 17 | 1 | 2 | 0 | 0 |
| Huron-Perth | 12 | 44 | 4 | 11 | 12 | 27 | 3 | 7 | 2 | 4 | 2 | 10 | 1 | 1 | 7 | 18 | 0 | 0 | 0 | 0 |
| Kingston-Prince Edward | 10 | 32 | 5 | 12 | 9 | 23 | 4 | 8 | 2 | 4 | 2 | 8 | 1 | 1 | 5 | 11 | 1 | 2 | 0 | 0 |
| London-Middlesex | 12 | 45 | 4 | 12 | 12 | 27 | 5 | 11 | 2 | 4 | 2 | 9 | 1 | 1 | 7 | 18 | 0 | 0 | 0 | 0 |
| Manitoulin-Northshore-Killarney | 6 | 18 | 2 | 4 | 1 | 3 | 0 | 0 | 1 | 1 | 0 | 0 | 0 | 0 | 2 | 4 | 0 | 0 | 0 | 0 |
| Niagara | 13 | 45 | 5 | 11 | 10 | 29 | 4 | 11 | 2 | 4 | 2 | 8 | 1 | 1 | 6 | 16 | 0 | 0 | 0 | 0 |
| North Bay-West Nipissing | 7 | 20 | 2 | 4 | 1 | 3 | 0 | 0 | 1 | 1 | 0 | 0 | 0 | 0 | 2 | 4 | 0 | 0 | 0 | 0 |
| Oxford-Brant | 13 | 46 | 5 | 11 | 12 | 31 | 4 | 11 | 2 | 4 | 2 | 8 | 1 | 1 | 6 | 16 | 0 | 0 | 0 | 0 |
| Parry Sound-Muskoka-Huntsville | 10 | 30 | 4 | 10 | 8 | 21 | 2 | 5 | 2 | 4 | 1 | 4 | 0 | 0 | 5 | 10 | 0 | 0 | 0 | 0 |
| Peterborough-Kawartha Lakes | 12 | 38 | 4 | 10 | 8 | 21 | 3 | 6 | 2 | 4 | 2 | 8 | 0 | 0 | 6 | 13 | 1 | 2 | 0 | 0 |
| Prescott and Russell | 7 | 25 | 2 | 5 | 2 | 4 | 1 | 1 | 2 | 4 | 1 | 2 | 0 | 0 | 1 | 2 | 1 | 2 | 0 | 0 |
| Renfrew-Pembroke-Barry’s Bay | 5 | 17 | 1 | 3 | 2 | 5 | 0 | 0 | 2 | 4 | 1 | 2 | 0 | 0 | 1 | 2 | 1 | 2 | 0 | 0 |
| Sarnia-Lambton | 13 | 46 | 4 | 12 | 13 | 29 | 4 | 10 | 2 | 4 | 2 | 10 | 2 | 4 | 7 | 18 | 0 | 0 | 0 | 0 |
| Sault Ste. Marie-Superior East | 4 | 10 | 1 | 3 | 1 | 3 | 0 | 0 | 0 | 0 | 0 | 0 | 0 | 0 | 1 | 3 | 0 | 0 | 0 | 0 |
| Simcoe-Delhi-Norfolk | 13 | 46 | 5 | 11 | 12 | 31 | 4 | 11 | 2 | 4 | 2 | 10 | 1 | 1 | 6 | 16 | 0 | 0 | 0 | 0 |
| Smiths Falls-Lanark-Sharbot Lake | 6 | 19 | 2 | 5 | 2 | 4 | 1 | 1 | 2 | 4 | 1 | 2 | 0 | 0 | 1 | 2 | 1 | 2 | 0 | 0 |
| Stirling-Tweed-South Frontenac | 8 | 25 | 2 | 5 | 5 | 13 | 2 | 3 | 2 | 4 | 2 | 8 | 0 | 0 | 3 | 6 | 1 | 2 | 0 | 0 |
| Waterloo-Wellington | 13 | 45 | 5 | 11 | 11 | 29 | 3 | 7 | 2 | 4 | 2 | 8 | 1 | 1 | 6 | 15 | 0 | 0 | 0 | 0 |
| Windsor-Essex-Chatham-Kent | 13 | 46 | 4 | 14 | 13 | 38 | 5 | 12 | 3 | 5 | 2 | 10 | 4 | 8 | 8 | 24 | 0 | 0 | 0 | 0 |
| York-Durham | 14 | 48 | 5 | 11 | 11 | 29 | 5 | 9 | 2 | 4 | 2 | 8 | 1 | 1 | 8 | 16 | 1 | 2 | 0 | 0 |
| ONTARIO | 15 | 53 | 6 | 17 | 13 | 39 | 8 | 17 | 3 | 5 | 3 | 12 | 5 | 9 | 12 | 30 | 1 | 2 | 0 | 0 |
Note: A smog advisory day refers to a calendar day when a smog advisory is in effect.
Figure A1: 20y Trend of Ozone Annual Mean at Windsor Downtown
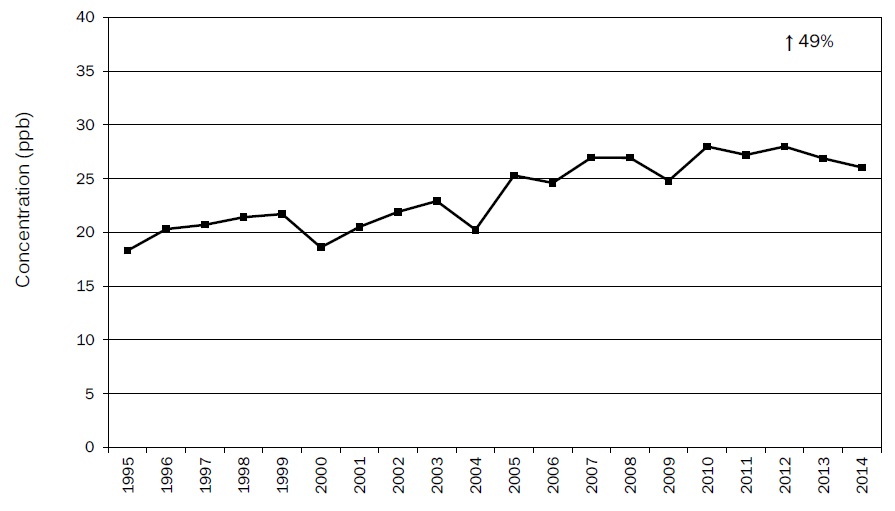
Figure A2: 20y Trend of Ozone Annual Mean at Windsor West
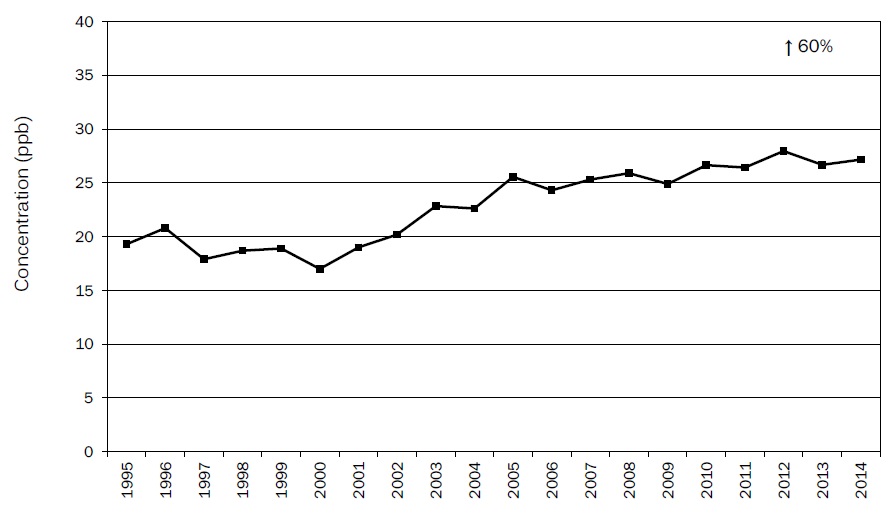
Figure A3: 20y Trend of Ozone Annual Mean at Sarnia
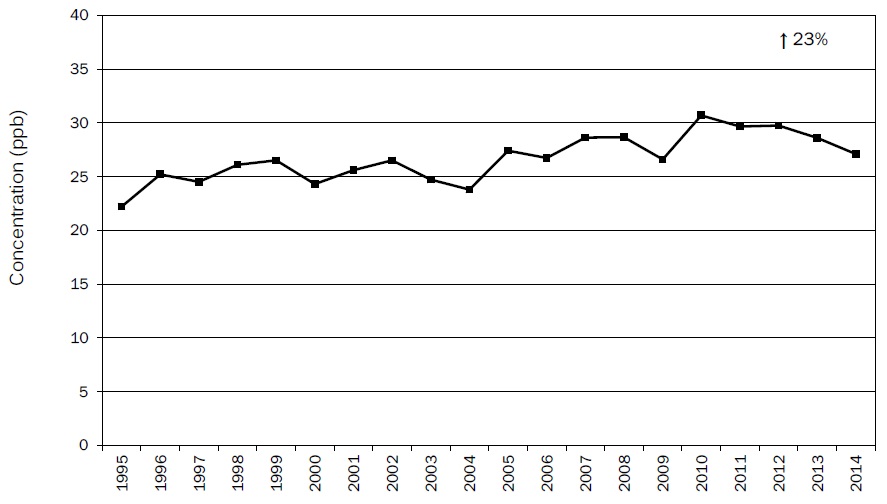
Figure A4: 20y Trend of Ozone Annual Mean at Grand Bend
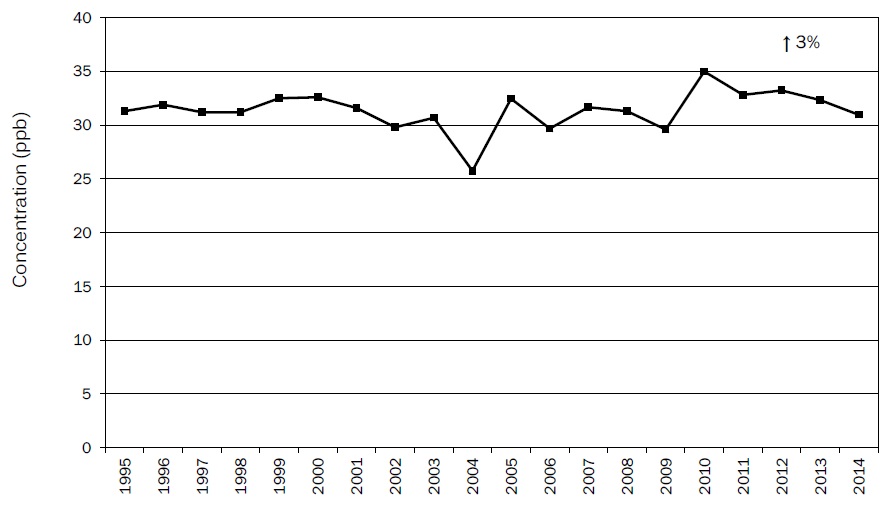
Figure A5: 20y Trend of Ozone Annual Mean at London
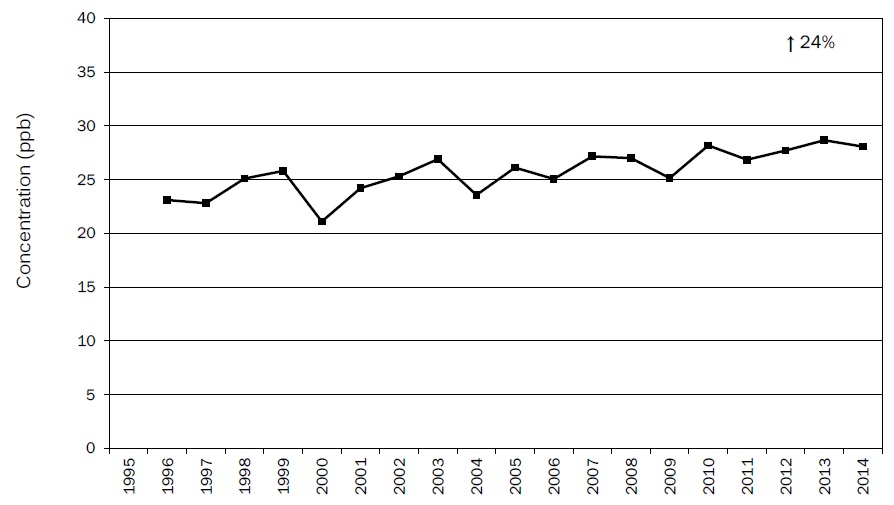
Figure A6: 20y Trend of Ozone Annual Mean at Tiverton
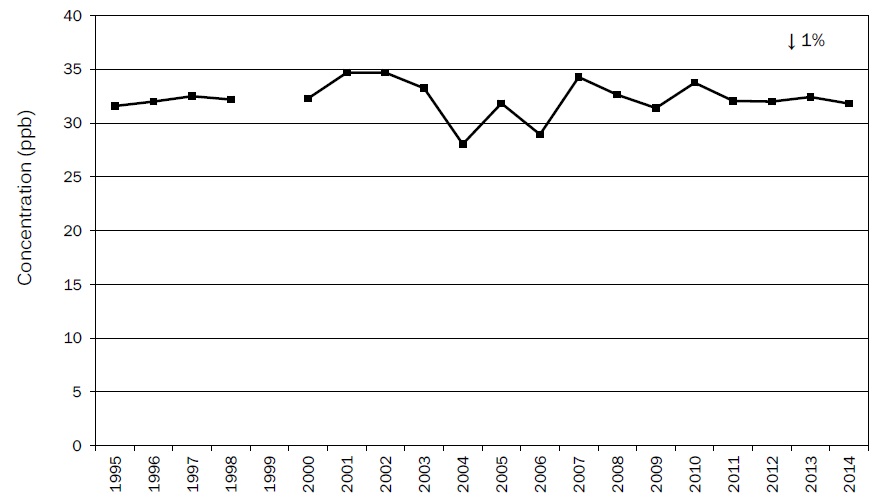
Figure A7: 20y Trend of Ozone Annual Mean at Kitchener
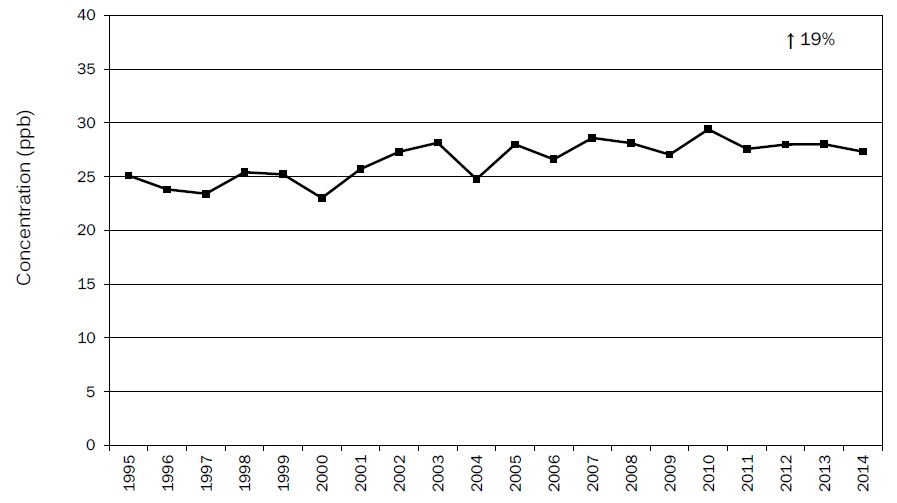
Figure A8: 20y Trend of Ozone Annual Mean at St. Catharines
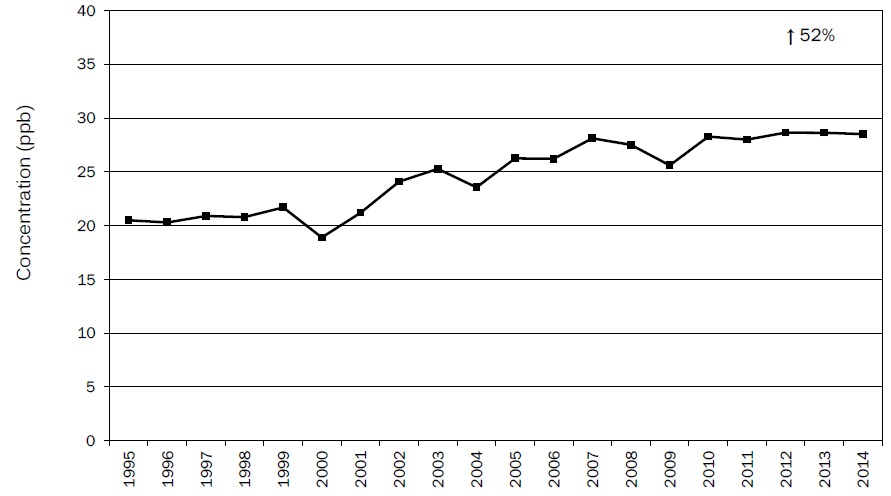
Figure A9: 20y Trend of Ozone Annual Mean at Guelph
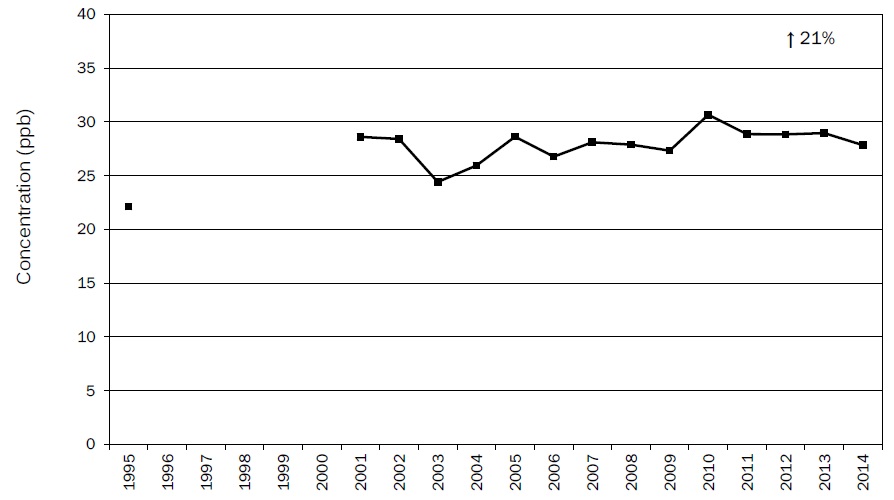
Figure A10: 20y Trend of Ozone Annual Mean at Hamilton Downtown
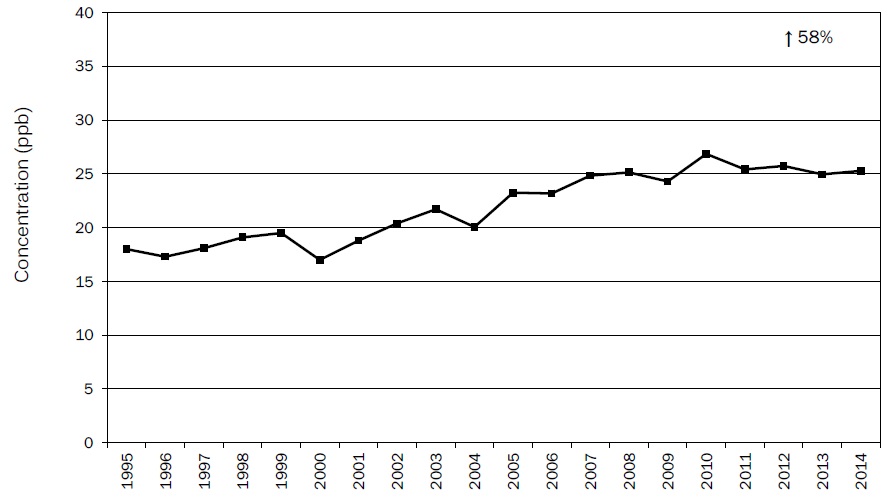
Figure A11: 20y Trend of Ozone Annual Mean at Hamilton Mountain
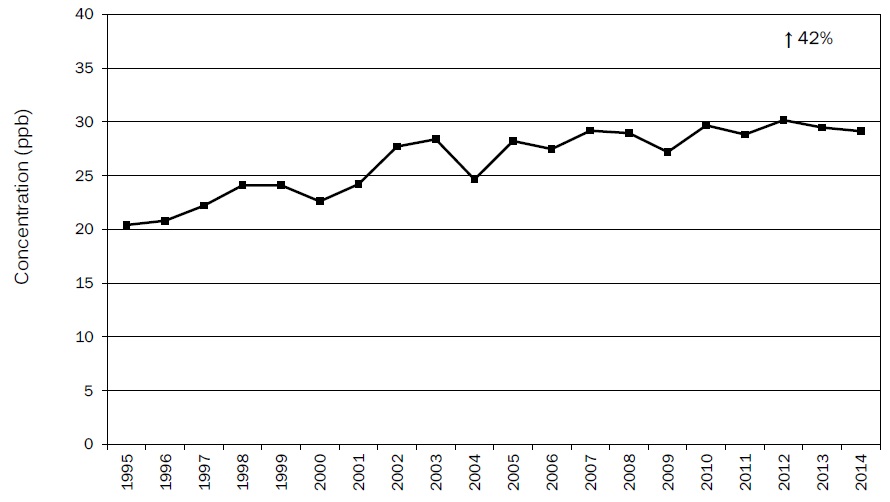
Figure A12: 20y Trend of Ozone Annual Mean at Hamilton West
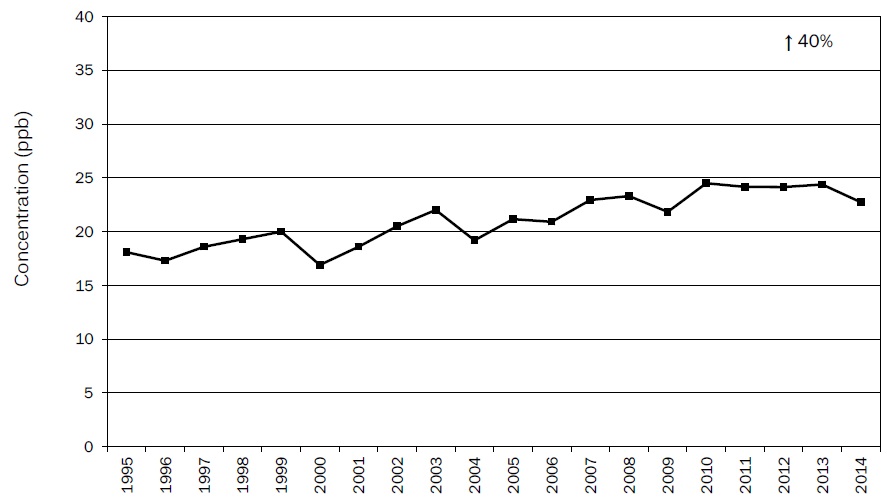
Figure A13: 20y Trend of Ozone Annual Mean at Toronto Downtown
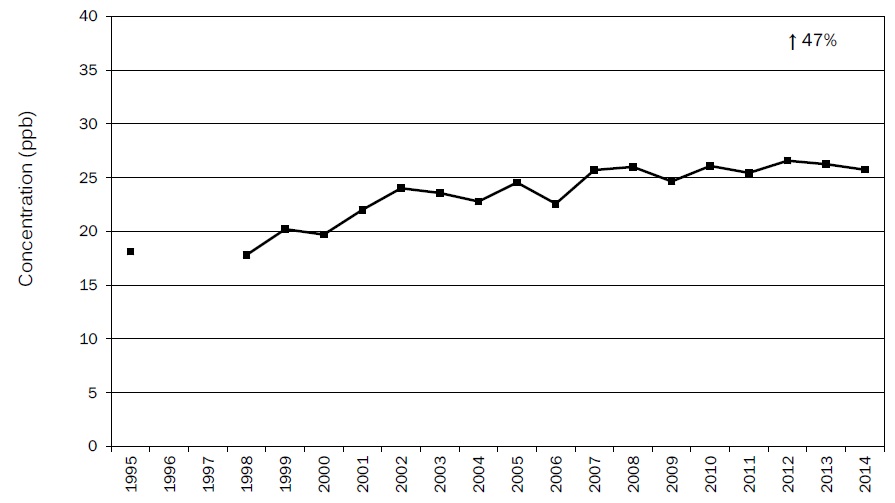
Figure A14: 20y Trend of Ozone Annual Mean at Toronto East
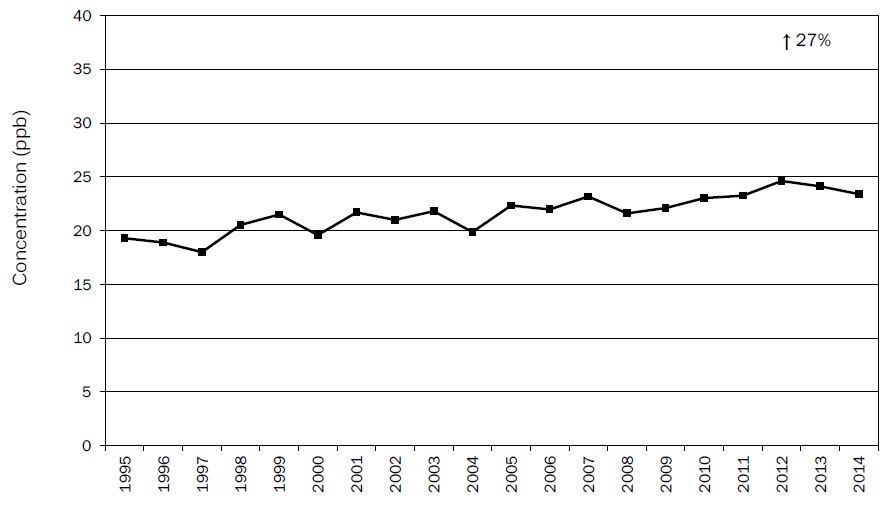
Figure A15: 20y Trend of Ozone Annual Mean at Toronto North
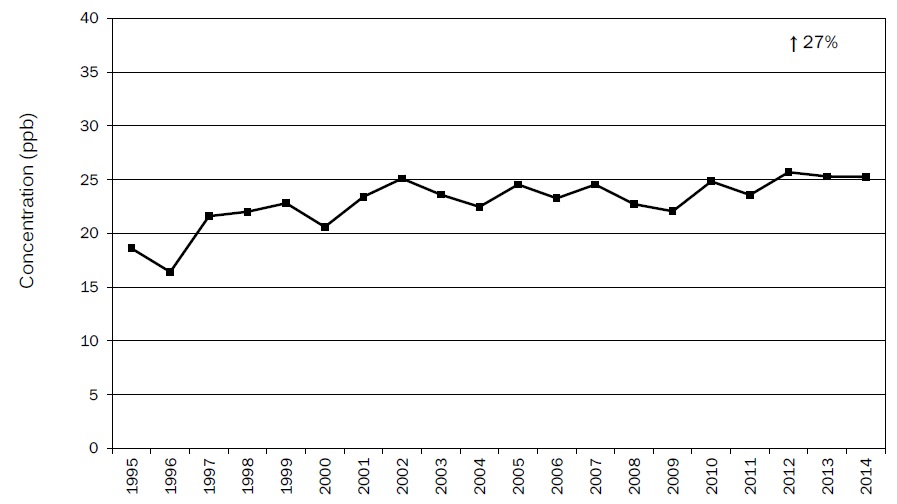
Figure A16: 20y Trend of Ozone Annual Mean at Burlington
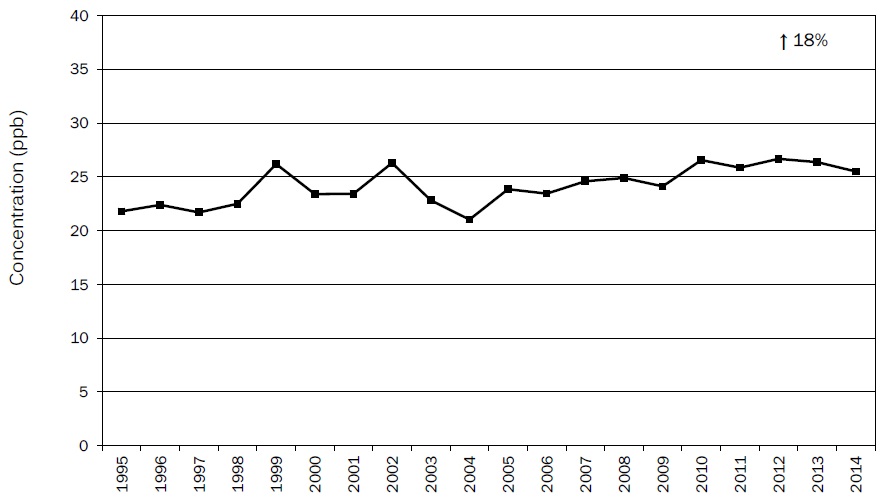
Figure A17: 20y Trend of Ozone Annual Mean at Oakville
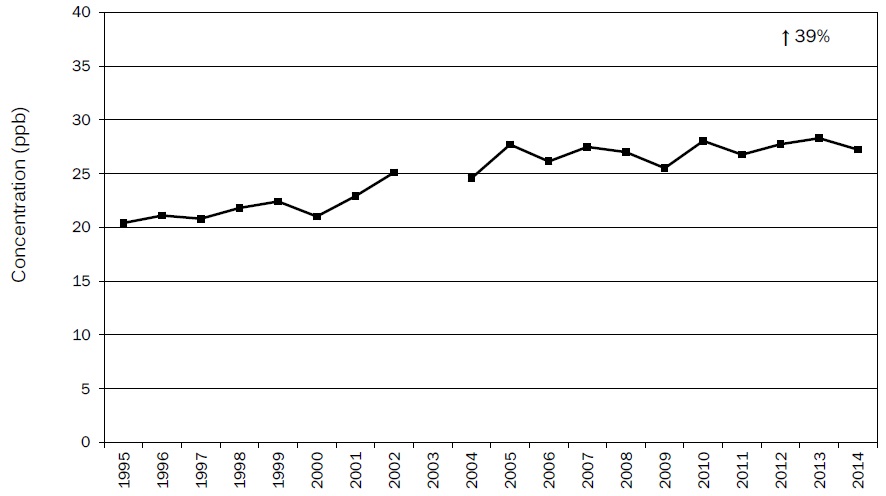
Figure A18: 20y Trend of Ozone Annual Mean at Oshawa
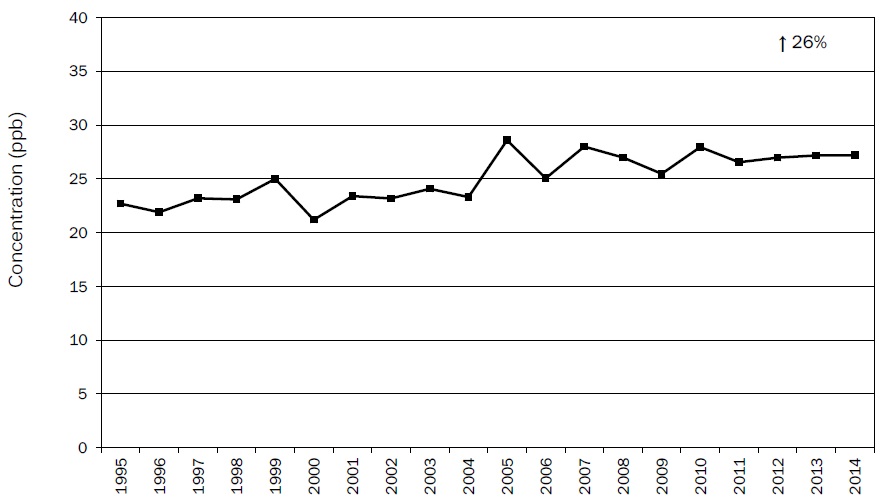
Figure A19: 20y Trend of Ozone Annual Mean at Mississauga
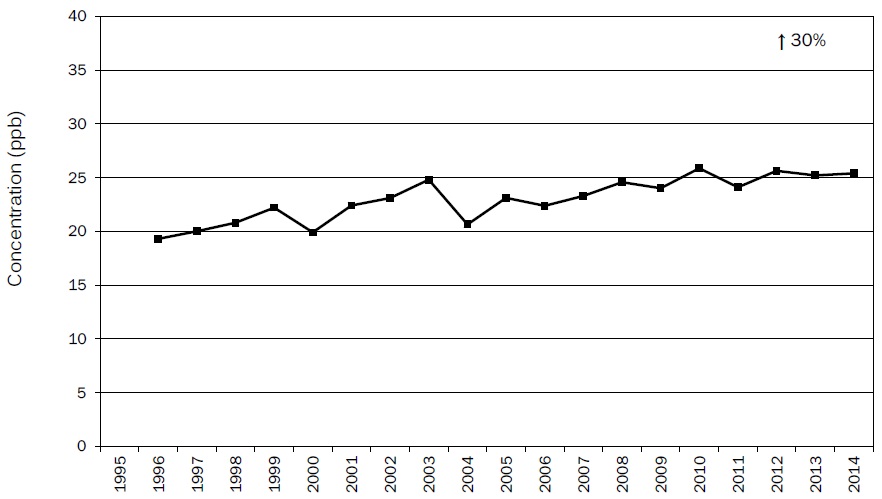
Figure A20: 20y Trend of Ozone Annual Mean at Dorset
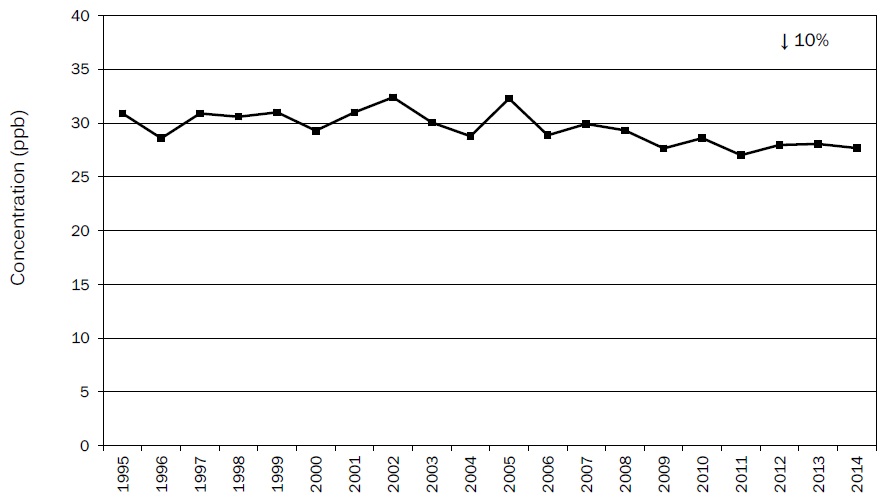
Figure A21: 20y Trend of Ozone Annual Mean at Ottawa Downtown
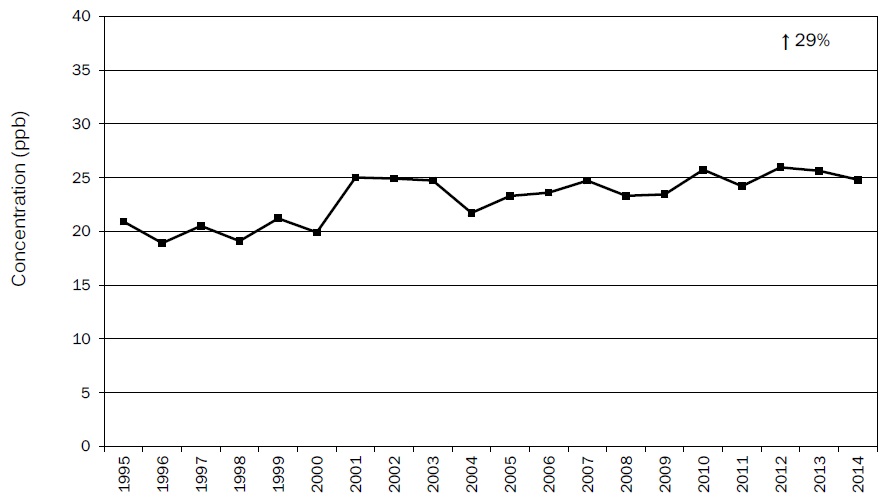
Figure A22: 20y Trend of Ozone Annual Mean at Cornwall
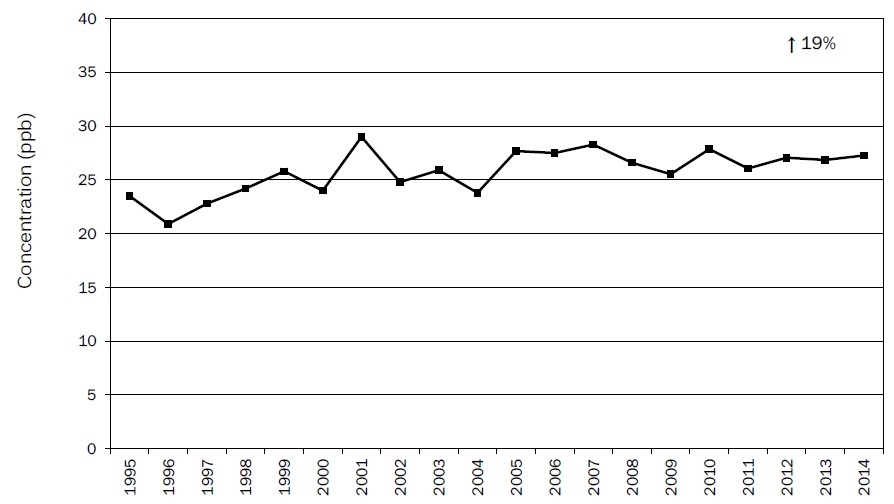
Figure A23: 20y Trend of Ozone Annual Mean at Peterborough
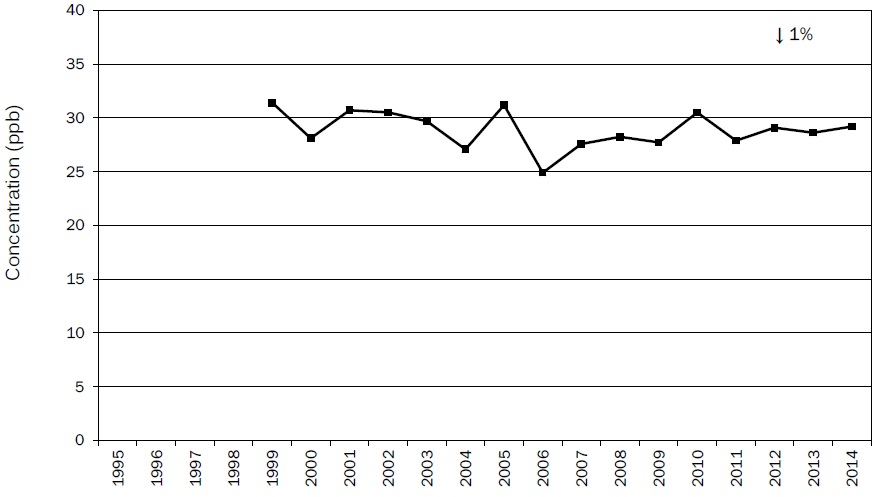
Figure A24: 20y Trend of Ozone Annual Mean at Thunder Bay
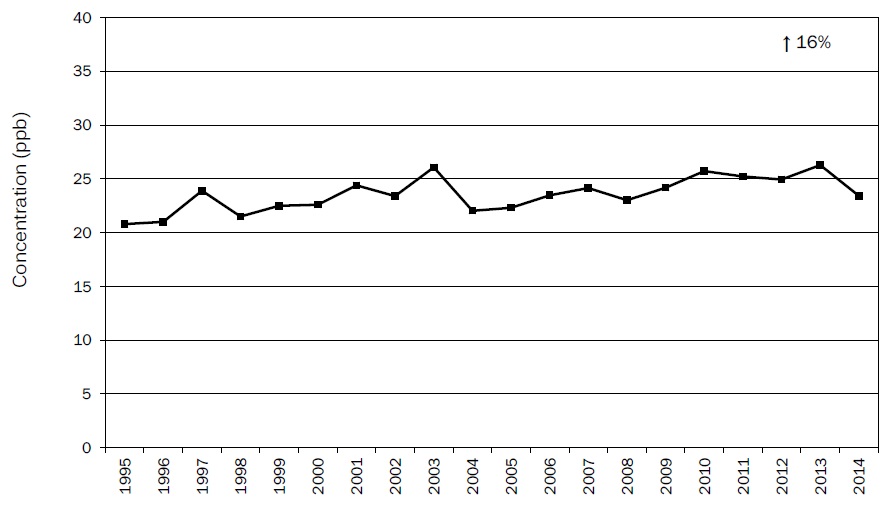
Figure A25: 20y Trend of Ozone Annual Mean at Sault Ste. Marie
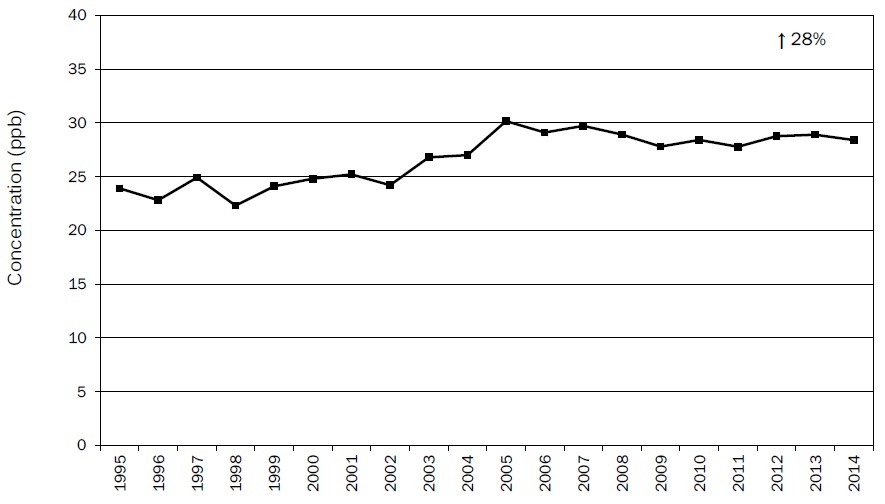
Figure A26: 20y Trend of Ozone Annual Mean at North Bay
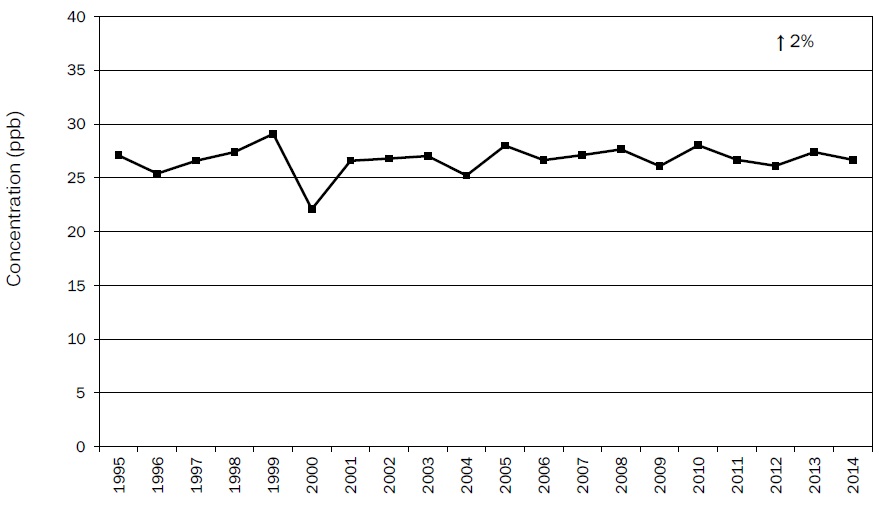
Figure A27: 20y Trend of Ozone Annual Mean at Sudbury
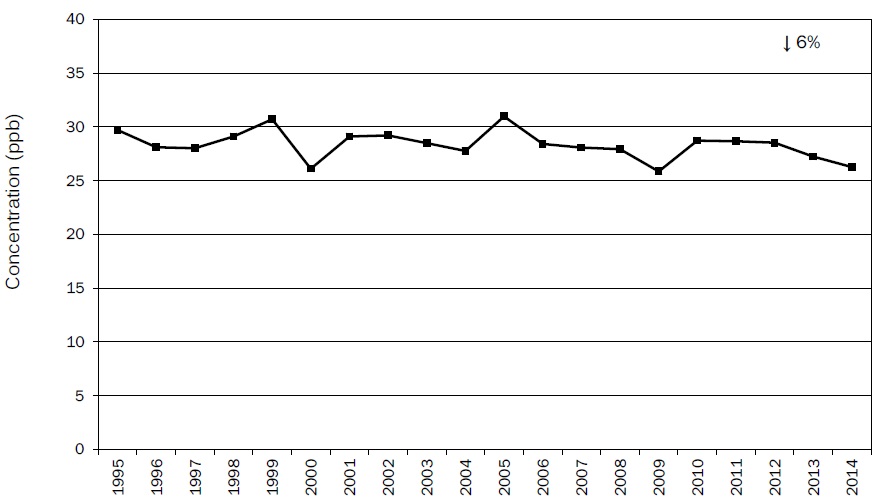
Figure A28: 20y Trend of NO2 Annual Mean at Windsor Downtown
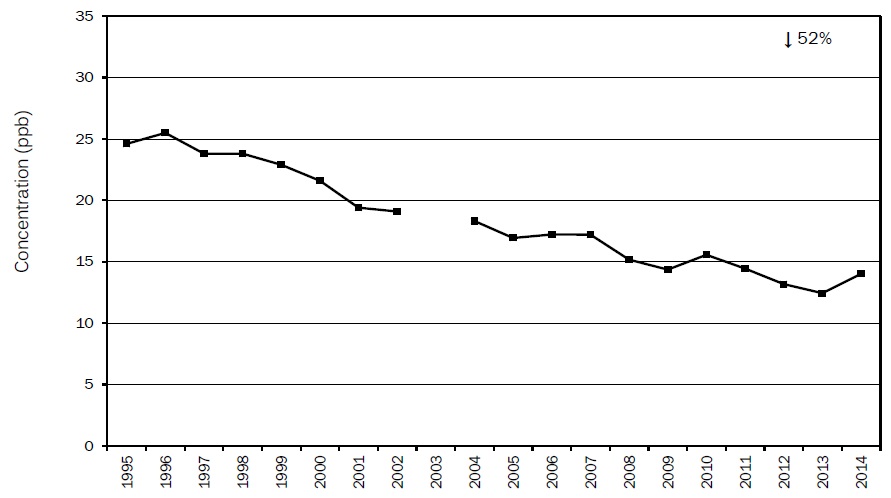
Figure A29: 20y Trend of NO2 Annual Mean at Sarnia
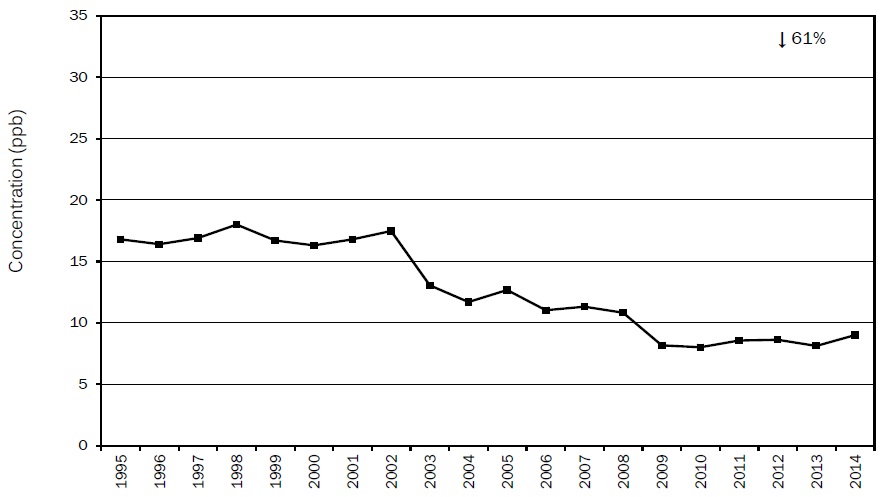
Figure A30: 20y Trend of NO2 Annual Mean at London
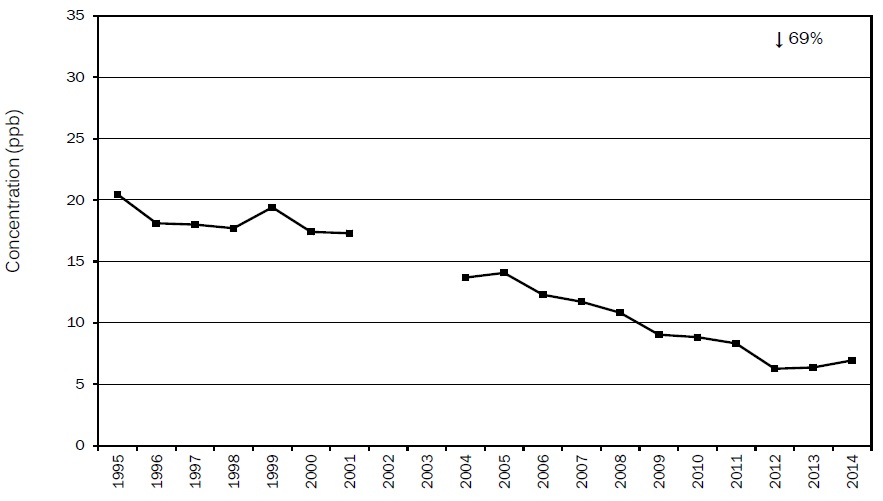
Figure A31: 20y Trend of NO2 Annual Mean at Kitchener
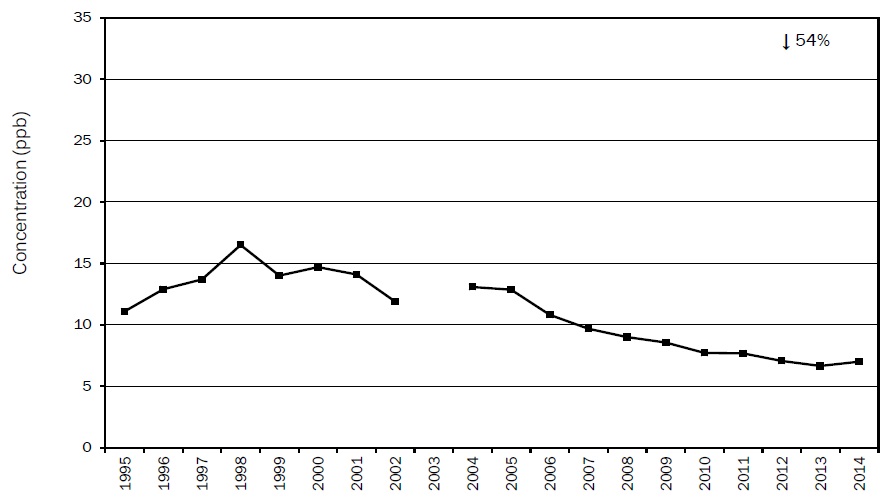
Figure A32: 20y Trend of NO2 Annual Mean at St. Catharines
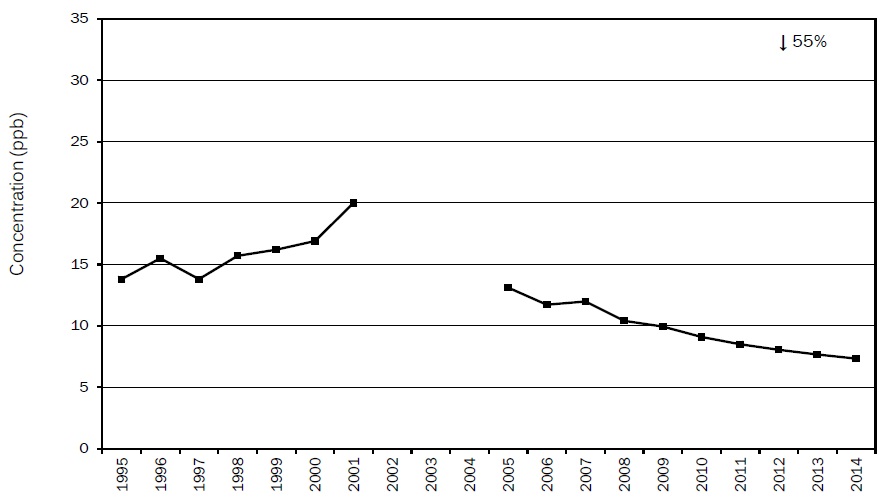
Figure A33: 20y Trend of NO2 Annual Mean at Hamilton Downtown
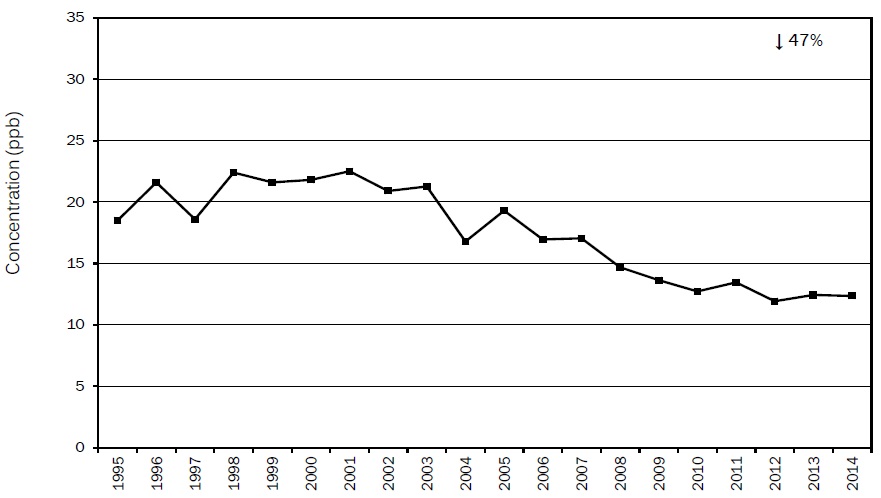
Figure A34: 20y Trend of NO2 Annual Mean at Hamilton Mountain
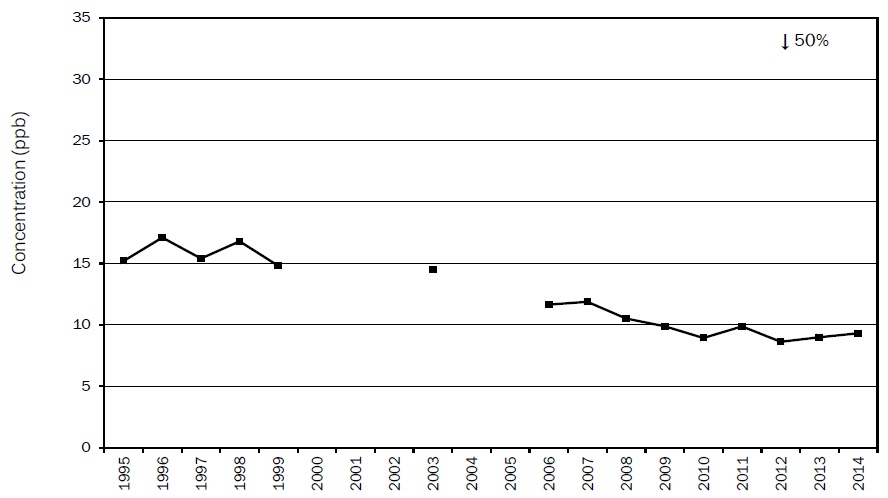
Figure A35: 20y Trend of NO2 Annual Mean at Toronto Downtown
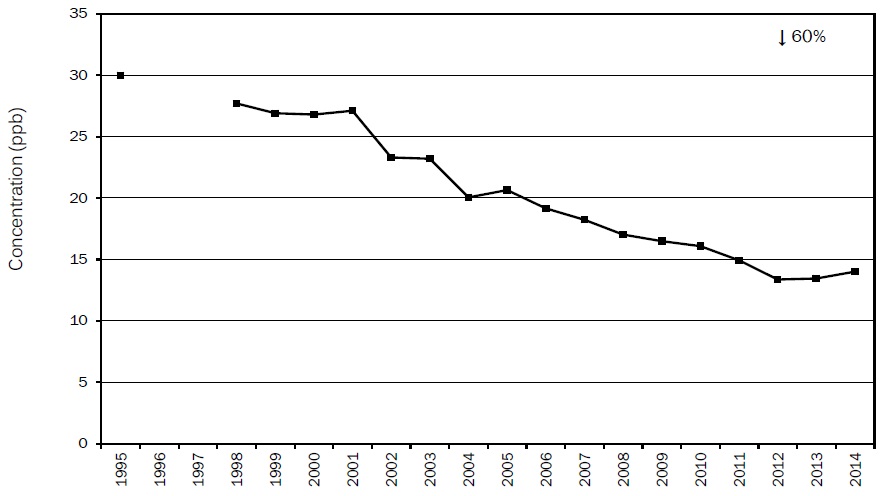
Figure A36: 20y Trend of NO2 Annual Mean at Toronto East
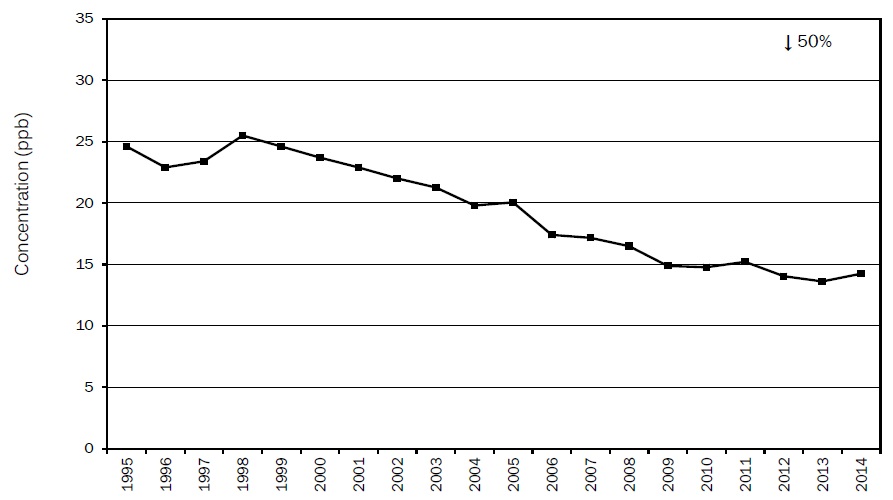
Figure A37: 20y Trend of NO2 Annual Mean at Toronto North
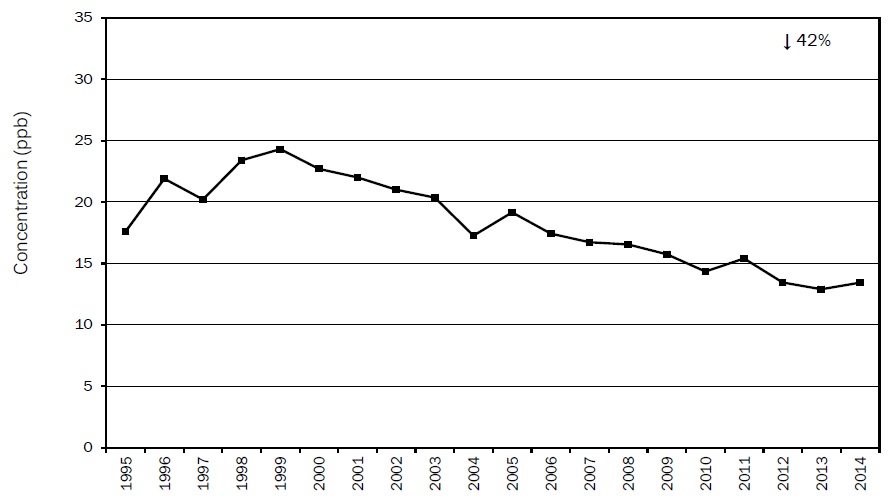
Figure A38: 20y Trend of NO2 Annual Mean at Burlington
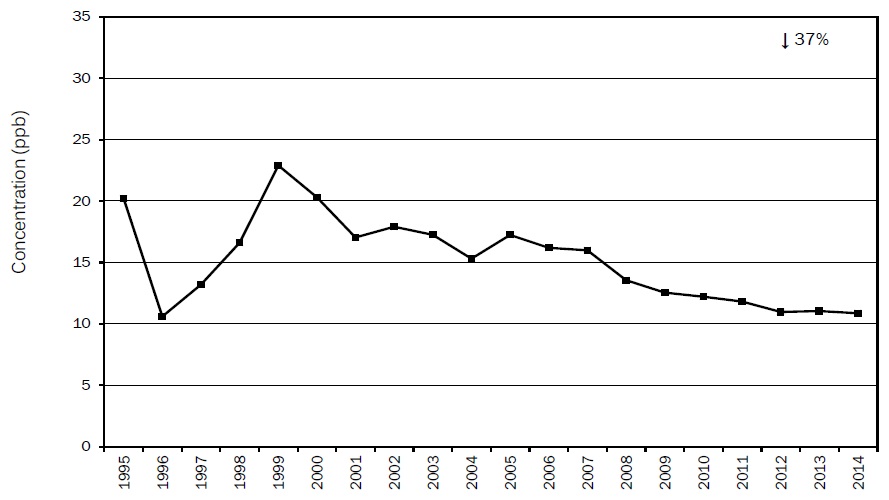
Figure A39: 20y Trend of NO2 Annual Mean at Oakville
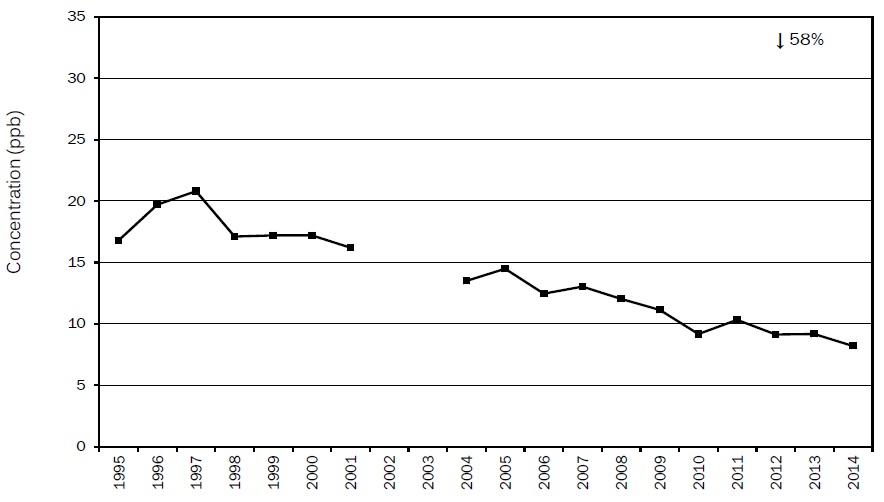
Figure A40: 20y Trend of NO2 Annual Mean at Oshawa
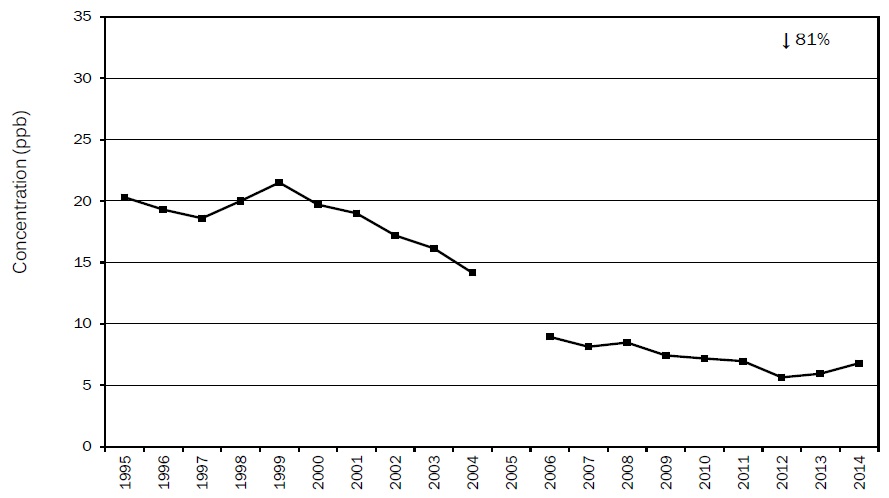
Figure A41: 20y Trend of NO2 Annual Mean at Ottawa Downtown
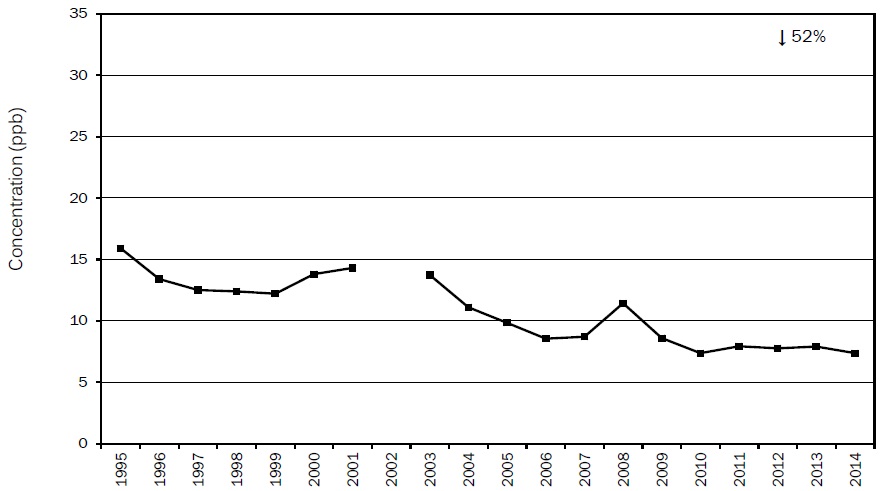
Figure A42: 20y Trend of NO2 Annual Mean at Thunder Bay
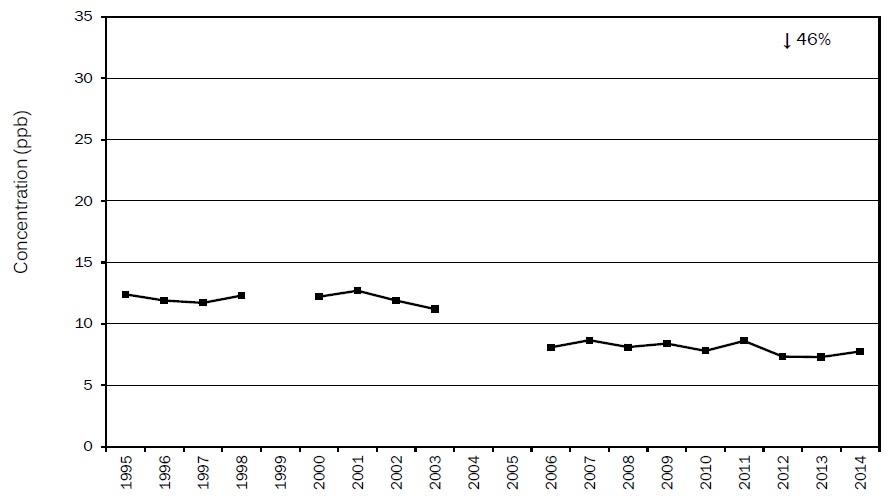
Figure A43: 20y Trend of NO2 Annual Mean at Sault Ste. Marie
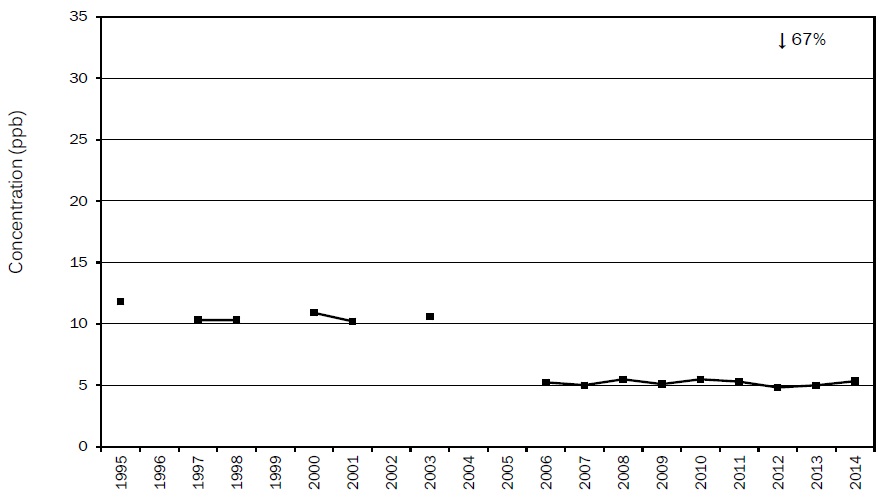
Figure A44: 20y Trend of SO2 Annual Mean at Windsor Downtown
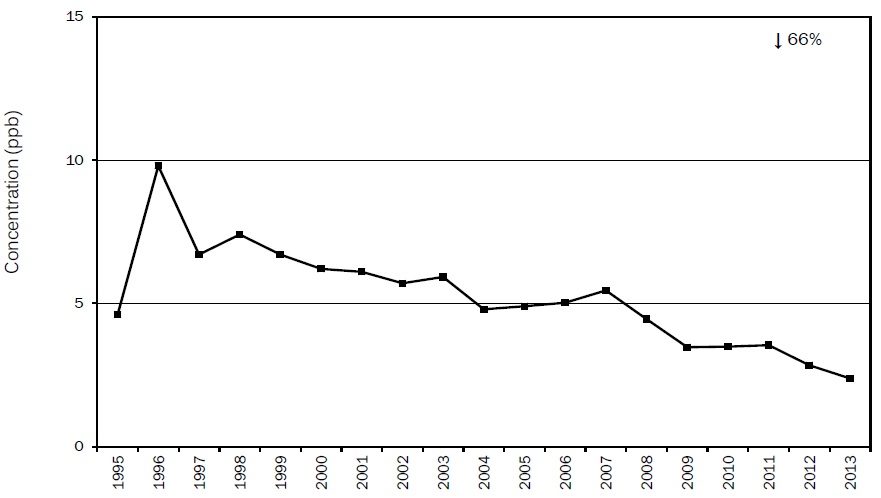
Figure A45: 20y Trend of SO2 Annual Mean at Windsor West
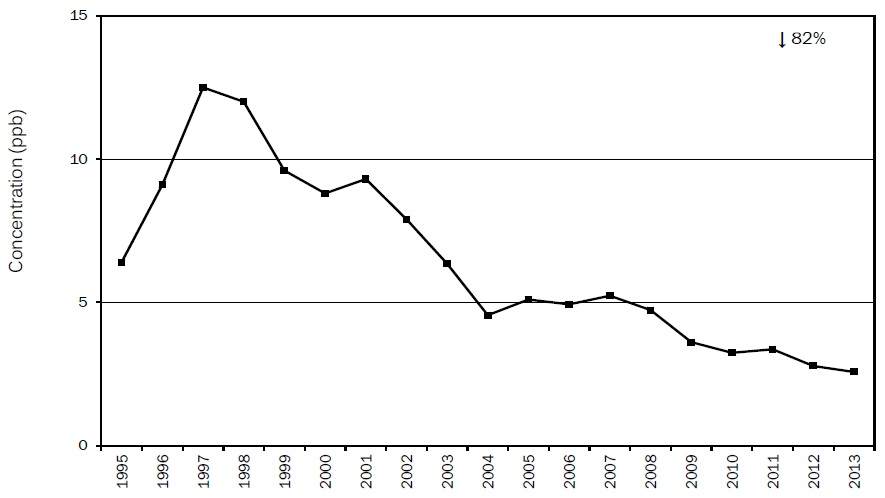
Figure A46: 20y Trend of SO2 Annual Mean at Sarnia
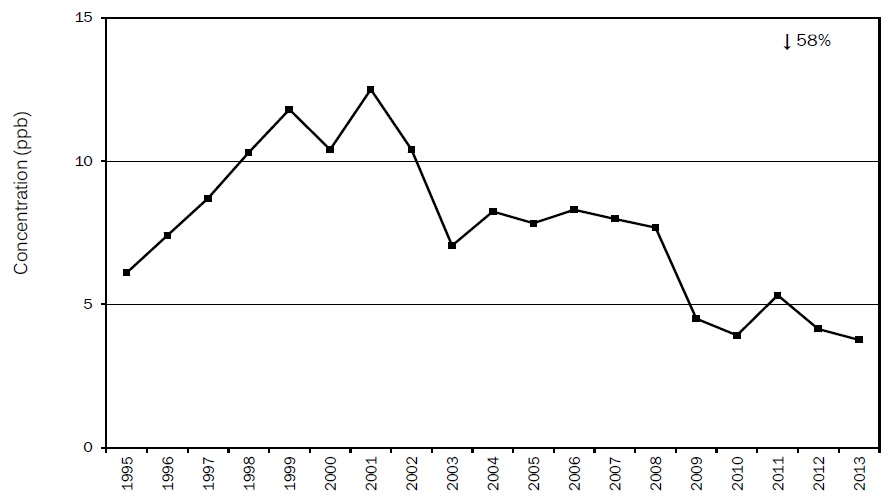
Figure A47: 20y Trend of SO2 Annual Mean at Hamilton Downtown
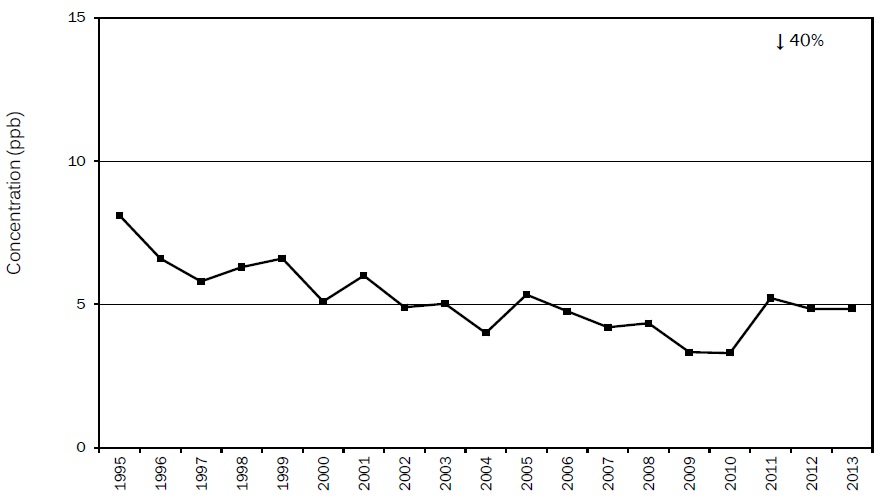
Figure A48: 20y Trend of SO2 Annual Mean at Hamilton Mountain
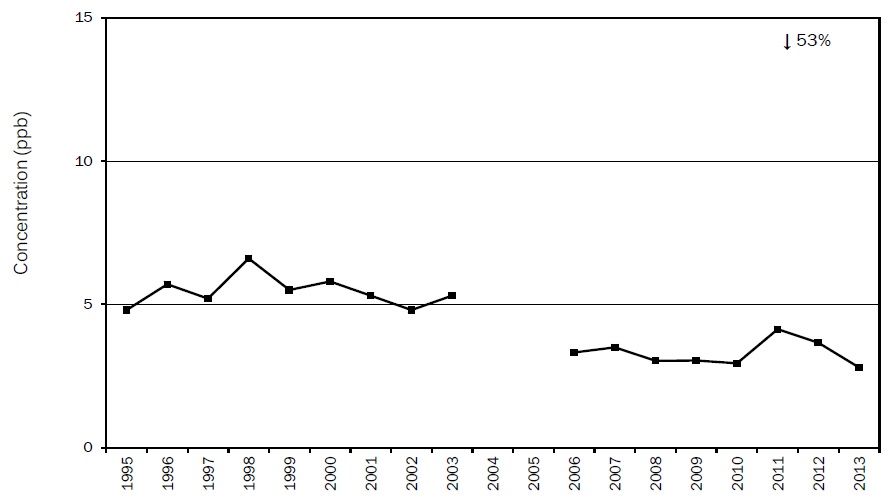
Figure A49: 20y Trend of SO2 Annual Mean at Ottawa Downtown
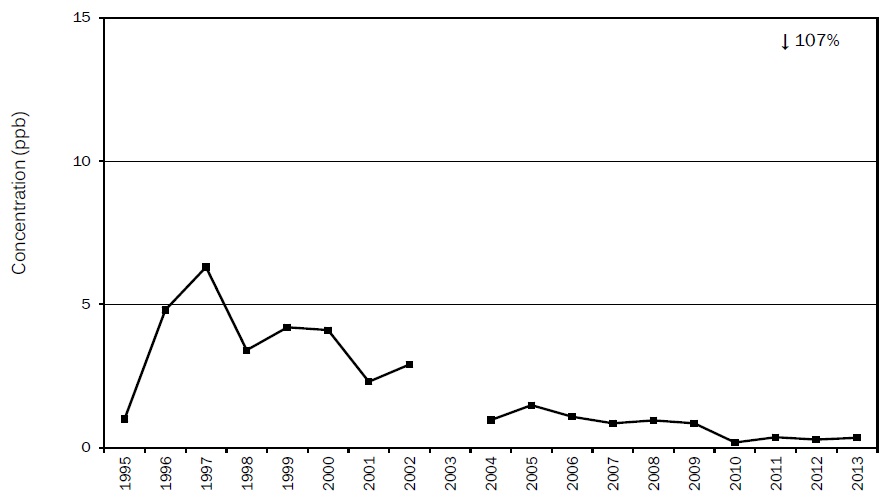
Figure A50: 20y Trend of SO2 Annual Mean at Sault Ste. Marie
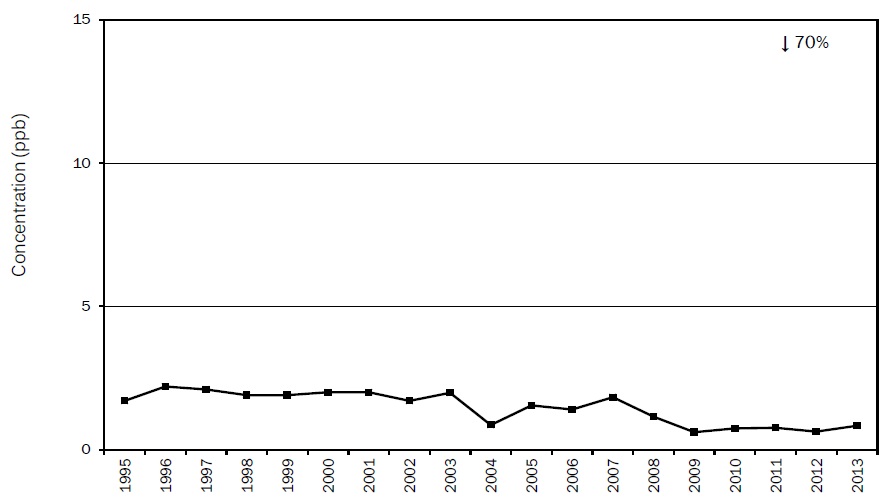
Figure A51: 20y Trend of SO2 Annual Mean at Sudbury