Appendix A for the 2015 Air Quality in Ontario report
Read the appendix containing tables one to five for the Air Quality in Ontario report for 2015.
The Appendix is intended for use in conjunction with the 2015 Annual Air Quality in Ontario Report. The Appendix briefly describes the provincial Air Quality Health Index (AQHI) network, quality assurance and quality control procedures, and the Ministry of the Environment and Climate Change’s air quality database. It also includes a series of tables displaying station locations and a listing of the summary statistics including means, maximums, percentile values and the number of exceedances of the Ontario Ambient Air Quality Criteria (AAQC) for each pollutant. In addition, trends for select pollutants are displayed for a 10-year period.
Monitoring network operations
Network Description
In 2015, the Environmental Monitoring and Reporting Branch (EMRB) operated 39 ambient air monitoring sites across Ontario as part of the AQHI network. Monitoring site locations for the AQHI network are illustrated in Map A1. The AQHI network was comprised of 133 continuous monitoring instruments at 39 sites. These instruments have the capability of recording minute data (approximately 70 million data points per year) that are used to scan and validate the continuous hourly data.
Quality Assurance and Quality Control
Day-to-day maintenance and support of the instruments are administered by EMRB staff. Instrumentation precision is verified by daily automatic internal zero and span checks. Data analysts and station operators review span control charts to confirm instrument precision using a telemetry system. A quarterly quality assurance and quality control (QA/QC) review is performed on the ambient data set in order to highlight anomalies and administer corrective action in a timely manner.
The air monitoring station operators routinely inspect and maintain monitoring equipment and stations with mandatory bi-monthly on-site visits where secondary transfer standards are used to calibrate instrumentation. Station maintenance activities are recorded using FieldWorker Inc. software, an electronic documentation solution; this information is transferred directly to the ministry’s database. The instrumentation used throughout the provincial air monitoring network has been standardized to Thermo Electron Corporation analyzers in an effort to streamline parts inventory and leverage common hardware used within each analyzer. The following is a summary of the instrumentation deployed within the network and are all US EPA designated equivalent methods:
- Ozone – TE49C/I
- Fine Particulate Matter – SHARP 5030
- Nitrogen Oxides – TE42C/I
- Carbon Monoxide – TE48C/I
- Total Reduced Sulphur – TE43C/CDN101
- Sulphur Dioxide – TE43C/I
EMRB operates a laboratory with gas reference standards that adhere to those of the U.S. National Institute of Standards and Technology (NIST) and the Air Quality Research Division of Environment & Climate Change Canada. The secondary transfer standards used by station operators are referenced and certified to EMRB’s NIST primary standards on a quarterly basis.
The Ontario ambient air quality monitoring network undergoes constant maintenance to ensure a high standard of quality control. Continuous real-time data are consistently reviewed, assessed and validated by EMRB staff. Immediate actions are taken to correct any inconsistencies that may affect the validity of the data. These measures ensure ambient air monitoring data are valid, complete, comparable, representative and accurate. As a result, the 2015 ambient air quality monitoring network had greater than 97 per cent valid data from over one million hourly data points.
Data Base
The ambient air quality data used in this report are stored in the ministry’s air quality information system (AQUIS) and are made available through the Air Quality Ontario web site, and the ministry’s Open Data Catalogue web page. A statistical pattern test is used to identify data anomalies, such as unusual pollutant concentrations. Each pollutant has a predetermined concentration range based on historical data. Values outside this range are flagged for further investigation.
Data are obtained from automated ambient air monitoring instruments that operate continuously to produce an average measurement for every hour for a possible total of 8,760 measurements in a given year. Hourly parameters measured include O3, PM2.5, NO/NO2/NOx, CO, SO2 and TRS compounds. A valid annual mean requires at least 6,570 hourly readings. In addition, the 2nd and 3rd quarters of the year should have 75 per cent valid data for ozone, whereas for PM2.5, each quarter of the year should have 75 per cent valid data.
Network descriptive table
The AQHI network for 2015 is summarized in Table A1. The table displays the station name, numerical identifier and pollutants measured. The numerical identifier is the station (ID) number, the first digit of which identifies the geographic region in which the station is located. Air monitoring stations within the AQHI network can measure up to six common pollutants (ozone, PM2.5, NO2, SO2, CO and TRS compounds) based on the pollutant(s) of concern for the regional area it represents.
Table A1 also identifies the type of air monitoring site: ambient, road-side, Canadian Ambient Air Quality Standard (CAAQS), and/or National Air Pollution Surveillance (NAPS). Ambient sites represent the general air quality of an area without any direct influence of local industrial sources. Road-side sites are within approximately 100 m of a major roadway with daily traffic volumes greater than 10,000 vehicles per day.
Annual statistics and 10-year trends
The 2015 statistical data and 10-year trends for various continuous pollutants are provided in Tables A2-A9, and Tables A10-A18, respectively. The annual averages, maximums and percentiles are displayed in the annual statistics tables. (A percentile value is the percentage of the data set that is equal to or below the stated value; for example, if the 70 percentile value is 0.10 ppm, then 70 percent of the data are equal to or below 0.10 ppm). To be included in the 10-year trend analysis, a site must have valid annual means for a minimum of 8 years over the 10-year period from 2006-2015.
Other informative tables
The calculated CAAQS metrics for ozone and PM2.5 are presented for 2015 (based on a three-year average, 2013-2015) in Table A19. In addition, Tables A20 and A21 focus on WOE analysis and the influence of transboundary flow days when calculating the ozone CAAQS metric. The percentage distribution of hourly AQHI readings within the various health risk categories for each of the 39 monitoring sites are displayed in Table A22. Table A23 summarizes the number of air quality alerts issued in Ontario during 2015. The 2014 statistical data for selected toxics are provided in Tables A24-A29.
Map A1: Air Quality Health Index (AQHI) Monitoring Sites Across Ontario in 2015
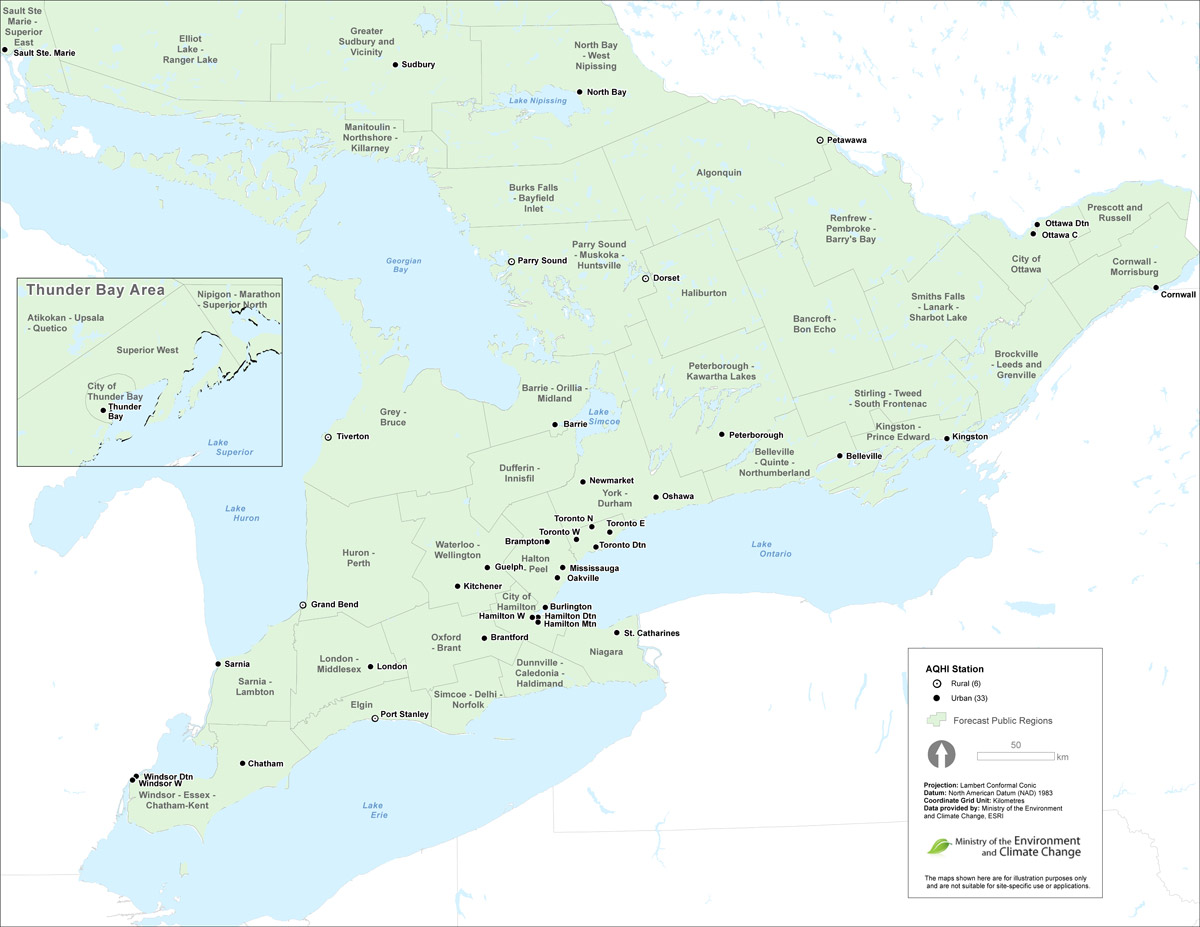
Table A1: 2015 Ontario Continuous Ambient Air Monitoring Network
Notes:
- ID
- station identfication number
- Year
- year station began monitoring
- Air intake
- height of air intake above ground (m)
- Type
- type of monitoring site: A = ambient, RS = road-side, C = CAAQS, N = NAPS
- AQI
- Air Quality Index site
- T
- telemetry
- O3
- ground-level ozone
- PM2.5
- fine particulate matter
- NO2
- nitrogen dioxide
- CO
- carbon monoxide
- SO2
- sulphur dioxide
- TRS
- total reduced sulphur
Table A2: 2015 Ozone (O3) Annual Statistics
Unit: parts per billion (ppb)
O3 1h AAQC: 80 ppb
Table A3: 2015 Fine Particulate Matter (PM2.5) Annual Statistics
Unit: micrograms per cubic metre (μg/m3)
PM2.5 24h Reference Level: 28 μg/m3
Table A4: 2015 Nitric Oxide (NO) Annual Statistics
Unit: parts per billion (ppb)
Table A5: 2015 Nitrogen Dioxide (NO2) Annual Statistics
Unit: parts per billion (ppb)
NO2 1h AAQC: 200 ppb
NO2 24h AAQC: 100 ppb