Basal resources sampling protocol
Contains methods to sample basal resources. Includes aquatic macrophytes, periphyton, organic material, and woody debris in rivers.
Basal resources sampling in rivers - sampling methodologies for Ontario’s flowing waters
Nicholas E. Jones, Brianna E. Houston
November 2011
© 2011
MNR 62763
ISBN 978-1-4435-8962-8 (PDF)
This publication was produced by:
Aquatic Research and Development Section
Ontario Ministry of Natural Resources
2140 East Bank Drive
Peterborough, Ontario
K9J 8M5
This technical report should be cited as follows:
Jones, NE and BE Houston 2011. Basal Resources Sampling in Rivers. Sampling Methodologies for Ontario’s Flowing Waters. Ontario Ministry of Natural Resources, Aquatic Research and Development Section, River and Stream Ecology Lab, Aquatic Research Series 2011-07
Please send comments and suggestions on the manual to Nick Jones at nicholas.jones@ontario.ca.
Cette publication hautement spécialisée Basal Resources Sampling in Rivers. Sampling Methodologies for Ontario’s Flowing Waters n’est disponible qu’en anglais en vertu du Règlement 411/97, qui en exempte l’application de la Loi sur les services en français. Pour obtenir de l’aide en français, veuillez communiquer avec le ministère des Richesses naturelles au Tom Jonston@ontario.ca.
Abstract
Attached algae, aquatic macrophytes, and riparian vegetation provide basal energy sources, nutrients, and critical habitat for ecosystems and their inhabitants (e.g., spawning northern pike and macroinvertebrates). This protocol describes methods for sampling basal resources including aquatic macrophytes, periphyton, organic material, and woody debris in rivers.
1.0 Introduction
Attached algae, aquatic macrophytes, and riparian vegetation provide basal energy sources, nutrients, and critical habitat for ecosystems and their inhabitants (e.g., spawning northern pike and macroinvertebrates). Aquatic macrophytes provide cover for fish and substrate for aquatic invertebrates, produce oxygen, and act as food for some fish and wildlife. In addition to living plants, woody debris and coarse particulate organic plant matter such as leaves from riparian vegetation provide food and habitat for many species (Wipfli and Musslewhite 2004). Algae and aquatic macrophyte communities respond to water levels, varying flows, water clarity, timing and frequency of floods (Biggs 1996). Even small changes in the amount and type of organic matter entering a river can dramatically affect the composition of fish and invertebrate communities (Moore 1998). Woody debris is important to river morphology as it creates debris dams and snags that maintain habitat heterogeneity (Bilby and Likens 1980; Entrekin et al. 2008). Woody debris can act as habitat and cover for fishes, and creates pools with lower velocity water that some species or age-groups prefer (Hicks et al. 1991; White et al. 2011). In addition, it can allow for the build up of organic material that invertebrates feed on, as well as acting as stable habitat (Benke and Wallace 2003).
Dams or other alterations to a river can potentially affect flow and alter the basal resources below the dam. Barriers can potentially interrupt the flow of organic material and thus change energy flow through the system. In regulated rivers, changes in periphyton community and increased periphyton biomass have been found below reservoirs (Dufford et al. 1987; Uehlinger et al. 2003). Altering flow below a dam can affect the distribution of aquatic macrophytes, and this distribution change can in turn further affect flow (Madsen et al. 2001). The direction of change in periphyton and macrophyte biomass (i.e., increase or decrease) cannot be predicted easily and depends on the hydrologic regime (Bunn and Arthington 2002; Rørslett and Johansen 1996; Uehlinger et al. 2003) and the influence of flushing flows. Monitoring basal resources can help evaluate the effects of remedial measures on dams (Uehlinger et al. 2003).
Previous research has shown that flow level is an important determinant of fish, benthos, and basal resources (Jones 2011; Peterson and Stevenson 1990). The area of river bottom that is routinely dried and wetted in regulated rivers is called the “varial zone”. In natural rivers, water levels typically recede much slower and peak less frequently. Sampling hydropower rivers at low flow will avoid this varial zone and provide a different portrayal of basal resources. For assessment and monitoring purposes the low flow channel is the focus. It is important to know you are sampling the perennially wetted low flow channel as indicated by gauges and/or power authority, and record this discharge. Discharge must be constant during the assessment period. Annual assessment must be completed during the same discharge volumes e.g. low flow.
The Basal Resources Sampling (BRS) protocol contains methods to sample basal resources including aquatic macrophytes, periphyton, organic material, and woody debris in rivers.
2.0 Gear description
Basic equipment required for basal resources sampling include a GPS, measuring tape, flow meter, and a rangefinder. Ideally, photographs should be taken of each site and sites should be marked using flagging tape, this will be useful for future reference. Field crews should have all the necessary maps of their river systems, including general sampling site locations, before going into the field. It is also helpful to have roadmaps and maps of any forest access roads that you will be required to travel on. Prior to the first sampling day, crews will need to prepare enough sampling forms to record their data while in the field (Appendix). Basal resources sampling forms can be printed or copied onto waterproof paper for working in inclement weather. All equipment should be examined before heading into the field and it is recommended to always take extra.
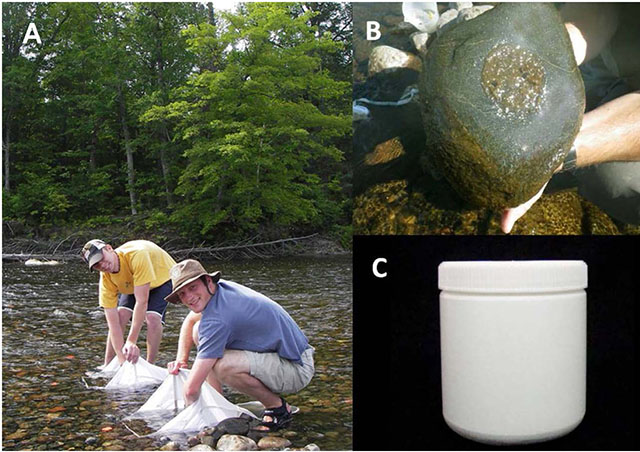
Figure 1. Early Surber sampling efforts to understand lateral patterns in abundance and composition (A). Collecting periphyton from within the circular area (B) and, close-up of jar used to collect core samples for CPOM (C).
3.0 Aquatic macrophyte field procedures
In this protocol, aquatic macrophytes will include vascular plants which are permanently submerged or floating-leaved, and attached to the substrate. Emergent macrophytes (e.g., sedges and rushes) are not covered here.
3.1 Site selection
Select 30-40 transect sampling sites equally spaced longitudinally in the natural river or downstream from the dam. Transects should be frequent enough to represent the river and the distribution of macrophytes. The entire length of the zone-of-influence (ZOI) should be sampled. Transects should run perpendicular from shore across the width of the river. Once a location has been selected, record its location using a GPS (NAD 83 Datum). This selection process can be done in the office.
3.2 Transect sampling
- For each transect record the wetted width and the distance covered by macrophytes. For example, a transect (entire wetted width) is 100 meters and 20 meters is occupied by macrophytes. Record the dominant species of macrophyte. Macrophyte observations can be done either by wading or from a boat. Use a laser rangefinder or tape measure to make measurements.
- To determine percent coverage, use the formula: Coverage% = (Lm/Lt) X 100, where Lt is the length of the transect and Lm is the cumulative length of the transect occupied by macrophytes.
3.3 Aerial photograph interpretation (alternative to intensive field sampling)
- Acquire aerial photographs or satellite imagery of the ZOI (e.g., ikonos high-resolution satellite). Otherwise, aerial photographs will need to be taken of the ZOI downstream of the dam. Images should be taken at high sun angle and not after a storm event.True colour film may be best for capturing detail of submerged species of macrophytes (Marshall and Lee 1994).
- Prior to interpreting the photographs, collect macrophyte data to ground-truth the aerial This can be done using the transect method above. Identifying areas that have aquatic macrophytes or identifying species will help to make photograph interpretation more accurate.
- Interpret photographs in ArcGIS. Use the polygon tool to select the area that has macrophytes. Field data will be useful in helping to decide if an area has macrophytes present. The area of macrophyte cover can then be calculated in ArcGIS and percent cover determined.
3.4 Information to record
Record discharge based on known gauges. Transect and aerial photo interpretation measures are very sensitive to changes in discharge, water clarity, and time of day. For this reason discharge must be known and constant during the assessment period. Annual assessment must be completed during the same discharge volumes.
4.0 Periphyton and organic material field procedures
4.1 Site selection and sampling
In natural rivers, sampling sites can be spaced equally along the length of the zone of interest. In regulated rivers, unless otherwise directed, the first sample is collected immediately downstream of the dam or where safe to do so and where sampling methodology allows. The first five sampling sites should be located at 0, 250, 500, 1000, and 2000 m downstream from the dam. For remaining five sites, divide the remaining zone of interest into five equal parts to establish spacing. The zone of influence extends to where the watershed area is greater than five times the watershed draining to a waterpower site - essentially one part regulated flow to four parts natural flow (Lewis et al. 2004). Using this approach, the ZOI can be estimated by examining watershed areas via GIS. However, in many cases, the ZOI likely ends at a receiving lake or a larger river where differences in temperature are attenuated. The exact location of sampling will depend on local conditions at the suggested site. Sometime the site location chosen on a map will not be suitable for sampling (e.g. too deep, not accessible). In such cases, move either up or down to the nearest suitable habitat and record the new location. Allocating sites in this manner acknowledges the longitudinal gradients in abiotic and biotic variables, and that of the majority of change typically happens close to the dam (Ward and Stanford 1983). Good sampling sites are typically C-type channels (Rosgen 1996) in rivers displaying a point bar, distinct riffles, and gravels with particle axes in the range of 2-64 mm (Figure 2).
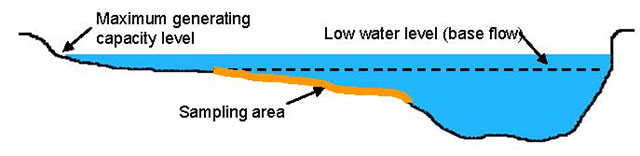
Figure 2. Cross-sectional depiction of a sampling site with transect at maximum and low flows.
Once a site’s location has been selected, record it using a GPS (NAD 83 Datum). The site should also be flagged on riparian vegetation. Take periphyton samples and CPOM cores at 3-5 locations – typically associated with benthic invertebrate sampling. The woody debris transect will be set up parallel to the river and shoreline.
4.2 Collecting periphyton
- To sample periphyton, randomly select cobble particles (64-256mm) of similar size from the site. Hold the 5.5cm diameter (23.75cm2) lid over the rock t. Other lid sizes can be used but must also be converted to a standard unit of mg⋅m-2. Then scrub the area around the sample area with a brush until clean (Figure 1). In the case of filamentous algae, care should be taken to ensure that the filaments from within the sample area are kept in the sample area and not excluded (i.e., cut off).
- Periphyton can be scraped off into a Whirlpak or small leak proof plastic jar using a small knife. Remove invertebrates and inorganic material visible without the aid of magnification.
- Samples should be kept on ice and in a dark area while in the field and transporting. Alternatively, periphyton can be preserved in sample bottles using M3 (Appendix) or Lugol’s solution.
4.3 Drying periphyton
Place sample on filter paper, if preserved, filter using suction filter first. Dry periphyton to a constant weight at 60°C in an oven (±0.1mg) and record weight. Oxidize the sample in a muffle furnace at 550°C and reweigh. The difference in weight is the ash-free dry mass (AFDM) (the biomass of the periphyton); measurements should be standardized to AFDM mg⋅m-2. It should be noted that this method does not distinguish between algae and other organic material.
4.4 Collecting CPOM (kick net)
Surber sampling can also be used to collect benthic invertebrates (Jones 2010), so it may be convenient to sample both at the same time. If not sampling benthic invertebrates then you may wish to sample using cores (see below). Do one or the other.
- Use a Surber net (Nitex 500 µm) with a 12 x 12 inch (~30 x 30 cm) metal frame. This net is portable and easy to use.
- Place the Surber perpendicular to the flow in water 20-30 cm deep during known low flow conditions. Stand to the side of the Surber. If there is little flow, orient the net such that it facilitates the collection of organics by hand-pushing water through the net. Hold the frame squarely on the stream bottom as gaps between the frame and substrate will allow organics to slip under the net. Be sure to check periodically to ensure there are no gaps.
- Work from the upstream edge of the sampling net backward and carefully pick up and rub stones in the net so that any attached organics drift into the net. Inspect each rock 10 cm or larger to ensure all organics have been dislodged and then set it outside the sampling area. If a rock is lodged in the stream bottom, rub it a few times concentrating on any cracks or indentations. After removing all large stones, disturb small substrates to a depth of approximately 10 cm by raking and stirring with your hands. Continue this process until you no longer see any organic matter being washed into the net. It should take approximately 3-5 minutes to complete one sample. Be consistent in your effort level across each sample.
- Wade carefully to shore without spilling the sample. In shallow water, hold the net vertically with the mouth up, and rinse any remaining material to the bottom of the net by splashing the outside of the net with river water. Empty net in the sorting tray.
4.5 Collecting CPOM (Cores)
At five locations associated with Surber samples or randomly located in 20-30 cm water, insert a 500mL cylindrical straight-sided plastic jar (no shoulders; Figure 1 vertically into the substrate far enough to fill the jar. Using the lid as a cover, remove the jar, making sure not to lose any of the contents.
4.6 Emptying the sample and preserving CPOM
This step may be done in the field or immediately upon returning to the lab.
- Empty the net into a white deep-sided tray by gripping the sample in the bottom and inverting the net or pull off the cod end. For CPOM cores, empty jar directly into tray. Use a 1L wash bottle with the spout removed to rinse any remaining sample into the tray. Rinse and remove any large rocks from the tray. Remove any invertebrates visible without the aid of a microscope (retain separately if benthic invertebrate sampling is also being conducted). Add water to the tray, swirl, and decant organic matter from the sample by mixing the contents of the tray and then pouring suspended sample into the 1mm sieve. Repeat this process (5-20 times) until no additional organic matter can be decanted, i.e., only sand and gravel is left in the tray.
- Empty CPOM into a leak-proof plastic whirlpak or jar with screw top and add an appropriate amount of 95% ethanol to the jar for sample preservation; taking into account the size of the sample, its makeup, and that the alcohol will be diluted by its water content. Aim for 70% final ethanol concentration. The use of an ethanol filled wash bottle to transfer the sample from the sieve to the jar should reduce the amount of extra ethanol required. Be certain to fasten the lid tightly. Do not allow samples to rattle in the truck, especially when on rough roads. You may wish to use foam between samples to reduce movement. Keep the sample in a cool location (e.g. refrigerator) while samples await processing.
4.7 Drying CPOM
Dry the samples at 60°C until they reach a constant mass (±0.1 mg) and record weight. If samples contain inorganic material (e.g., sand), obtain the ash-free dry mass (AFDM) by ashing samples at 550°C in a muffle furnace and reweighing them. The mass lost is the amount of CPOM in the sample; measurements should be standardized to AFDMg/m2.
4.9 Information to record
Record the three major substrate-particle-size classes at each sampling point (i.e., sand, cobble, small/large gravel, etc; see Table 1) along each periphyton/CPOM transect. Record depth and velocity at each sampling point. Record wetted width in metres and stream discharge based on known gauges. Take photos of the transect and include distinctive features such as a large tree or boulder that will help future field crews find the site. Lastly, record any observations you make about water levels, temperature, and weather conditions.
Table 1. Substrate classes based on the modified Wentworth scale
| Substrate Class | Size Descriptor |
|---|---|
| Organic matter | Wood chips, leaves, dead branches |
| Clay and slit | < 0.0625 mm, slippery feel |
| Sand | 0.0625 – 2 mm, gritty feel |
| Gravel | 2 – 64 mm |
| Cobble | 64 – 256 mm |
| Boulder | > 256 mm |
| Bedrock | Impermeable, continuous rock |
4.9.1 Collecting woody debris data
Woody debris is important in developing snag habitat (trapping of organic matter) and providing fish habitat. Lay out a 50m transect along the shore of the river extending 25m on either side of the chosen centre point (e.g., the CPOM transect). Woody debris should be sampled 1m from the bank on either side, such that the total area sampled is 100m2. Measure the length and diameter of each piece of woody debris larger than 10cm in length and 1cm in diameter. Calculate the surface area of the woody debris at the site, assuming that each piece is cylindrical (A = 2 π r 2 + 2 π r h). If needed you could use a frustum model. Record geographic coordinates (NAD 83) for each woody debris from the centre of the transect.
5.0 Safety and communication
5.1 Field safety
Sampling frequently takes place in remote locations and may require travel on roads that receive little maintenance. As such, the need for safety measures is intensified. A satellite phone is necessary in areas lacking cellular phone coverage and Citizen’s Band (CB) radios are required to coordinate traffic on logging roads. As an additional safety measure, government of Ontario employees may use the Provincial Communications Unit (PCU) to track their location and expected on and off water times.
Surveys often take place on rivers having deceptive and rapidly changing flows. Conditions can change abruptly, especially near hydro-electric dams. Contacting power generation authorities in advance to obtain information about changes in flow is highly recommended. Sampling should be delayed if severe weather conditions are expected. First-aid and safety equipment must be easily accessible and personal floatation devices must be worn as conditions dictate and whenever transportation by boat occurs. Safety of sampling crews must override all other activities and everyone participating in sampling must be aware of their rights and obligation according to the Occupational Health and Safety Act.
When river sampling, be sure to know where your put-in and take-out points are located including emergency exit points. Missing take-out points can be dangerous particularly if the ability to move upstream is limited.
5.2 Invasive species transfer
Although there is a low risk of transferring invasive species while sampling basal resources, care must be taken not to transfer invasive flora and fauna. This may involve cleaning sampling gear, waders, and any other equipment used at the sampling location. Some options include chemical treatment (e.g., peroxide, Alconox) of gear, or high temperature steaming and drying. Another approach is to dedicate sampling gear to single sites, or to zones having similar benthic faunas. When boats are used, ensure they are drained (including bilge/live well), and that all vegetation is removed before moving to a new waterbody. Boat, motor, and trailer should be pressure-washed, and all gear should be left to dry between 48 and 96 hours in situations where the risk of contamination is high.
6.0 References
Benke, A. and J.B. Wallace. 2003. Influence of wood on invertebrate communities in streams and rivers. In: S.V. Gregory, K.L. Boyer, and A.M. Gurnell (eds). The ecology and management of wood in world rivers. American Fisheries Society, Symposium 37, Bethesda, Maryland, pp. 149-177.
Biggs, B.J.F. 1996. Hydraulic habitat of plants in streams. Regulated Rivers: Research & Management 12: 131-144.
Bilby, R.E. and G.E. Likens. 1980. Importance of organic debris dams in the structure and function of stream ecosystems. Ecology 61: 1107-1113.
Bunn, S.E. and A.H. Arthington. 2002. Basic principles and ecological consequences of altered flow regimes for aquatic biodiversity. Environmental Management 30: 492-507. DOI: 10.1007/s00267-002-2737-0
Cazaubon, A. and J. Giudicelli. 1999. Impact of the residual flow on the physical characteristics and benthic community (algae, invertebrates) of a regulated Mediterranean river: The Durance, France.
Entrekin, S.A., J.L. Tank, E.J. Rosi-Marshall, T.J. Hoellein, and G.A. Lamberti. 2008. Responses in organic matter accumulation and processing to an experimental wood addition in three headwater streams. Freshwater Biology 53: 1642-1657.
Dufford, R.G., H.J. Zimmermann, L.D. Cline, and J.V. Ward, 1987. Responses of epilithic algae to regulation of Rocky Mountain streams. In: J.F. Craig and J.B. Kemper (eds.), Regulated streams: advances in ecology. Plenum Press, New York, pp. 383–390.
Hicks, B.J., J.D. Hall, P.A Bisson, and J.R. Sedell. 1991. Responses of salmonids to habitat changes. In: W.R. Meehan (ed). Influences of forest and rangeland management on salmonid fishes and their habitat. Special Publication 19. American Fisheries Society, Bethesda, Maryland, pp. 483-518.
Jones, N.E. 2010. Transect Benthic-invertebrate Sampling. Ontario Ministry of Natural Resources, River and Stream Ecology Lab, Peterborough, Ontario.
Jones, N.E. 2011. Patterns of Benthic Invertebrate Richness and Diversity in the Regulated Magpie River and Neighbouring Natural Rivers. River Research and Applications. In Press. DOI: 10.1002/rra.1601
Madsen, J.D., P.A. Chambers, W.F. James, E.W. Koch, and D.F. Westlake. 2001. The interaction between water movement, sediment dynamics and submersed macrophytes. Hydrobiologia 444: 71-84.
Marshall, T.R. and P.F. Lee. 1994. Mapping aquatic macrophytes through digital image analysis of aerial photographs: an assessment. Journal of Aquatic Plant Management 32: 61-66.
Moore, D.R.J. 1998. Ambient Water Quality Criteria for Organic Carbon in British Columbia. British Columbia Ministry of Water, Land and Air Protection.
Peterson, C.G. and R.J. Stevenson. 1990. Post-spate development of epilithic algal communities in different current environments. Canadian Journal of Botany 68: 2092-2102.
Rørslett, B. and S.W. Johansen. 1996. Remedial measures connected with aquatic macrophytes in Norwegian regulated rivers and reservoirs. Regulated Rivers: Research & Management 12: 509-522.
Rosgen, D.L. and H.L. Silvey. 1996. Applied River Morphology. Wildland Hydrology Books, Fort Collins, CO.
Uehlinger, U., B. Kawecka, and C.T. Robinson. 2003. Effects of experimental floods on periphyton and stream metabolism below a high dam in the Swiss Alps (River Spöl). Aquatic Sciences 65: 199-209. DOI: 10.1007/s00027-003-0664-7
White, S.L., C. Gowan, K.D. Fausch, J.G. Harris, and W.C. Saunders. 2011. Response of trout populations in five Colorado streams two decades after habitat manipulation. Canadian Journal of Fisheries and Aquatic Sciences 68: 2057 -2063. DOI: 10.1139/F2011-125
Wifpli, M.S. and J. Musslewhite. 2004. Density of red alder (Alnus rubra) in headwaters influence invertebrate and detritus subsidies to downstream fish habitats in Alaska. Hydrobiologia 520: 153:163.
6.1 Helpful resources
Fitzgerald, D.G., B. Zhu, S.B. Hoskins, D.E. Haddad, K.N. Green, L.G. Rudstam, and E.L. Mills. 2006. Quantifying submerged aquatic vegetation using aerial photograph interpretation: application in studies assessing fish habitat in freshwater ecosystems. Fisheries 31: 61-73.
Hauer, F.R. and G.A. Lamberti, eds. 2006. Methods in Stream Ecology. Second Edition. Academic Press, Burlington, MA.
Appendix: M3 fixative
Combine and dissolve the following items:
5g potassium iodide
10g iodine crystals (sublimed)
50mL formalin
1L distilled water
Table 4. Amount of M3 to add to solution
| Sample Volume (mL ) | M3 Fixative (mL ) |
|---|---|
| 50 | 1 |
| 100 | 2 |
| 250 | 5 |
| 500 | 10 |
Aquatic macrophyte sampling form
Aquatic Macrophyte Sampling Form
Periphyton and CPOM sampling form
Periphyton and CPOM Sampling Form
Woody debris sampling form
MNR
ISBN 978-1-4435-8962-8 (PDF)