Biomass burn characteristics
Learn about the physical and chemical characteristics of solid biomass for use as a fuel on the farm. This technical information is for Ontario producers.
ISSN 1198-712X, Published June 2011.
Introduction
Solid biomass can be grown for use as fuel on farms and for sale. This factsheet outlines the physical and chemical characteristics of solid biomass fuels, explains their significance and includes a table containing detailed information on the properties of 22 common biomass fuels in Ontario.
Understanding biomass
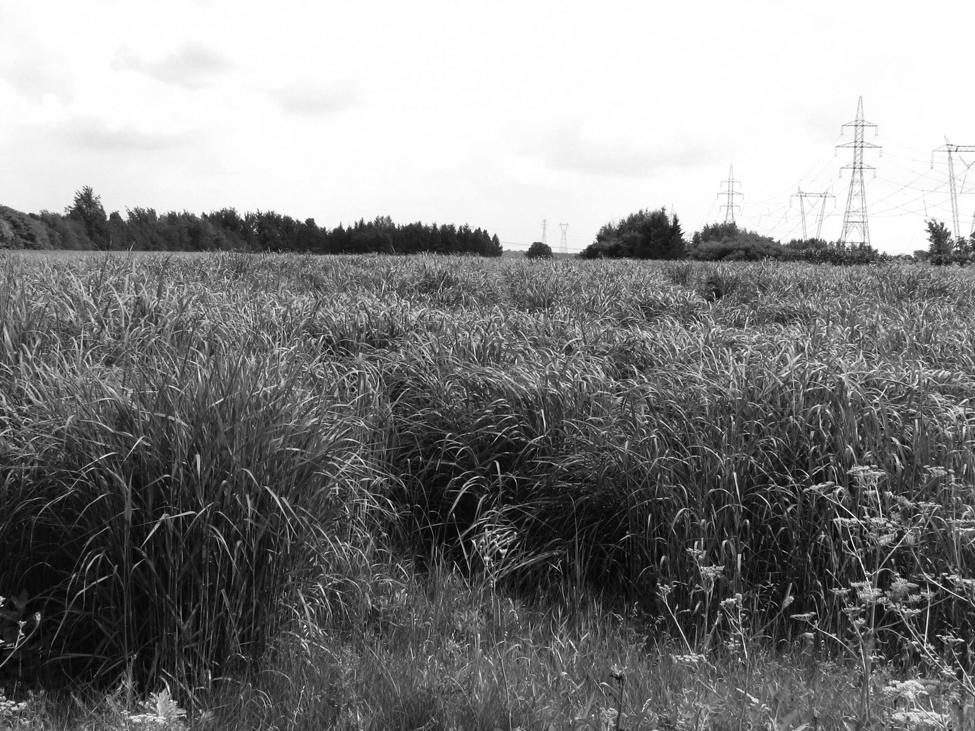
Biomass refers to any organic material derived from plants that use sunlight to grow. When burned, the energy stored in biomass is released to produce heat or electricity. Common forms of solid biomass include agricultural crops, crop residues and forestry products. Switchgrass (Figure 1) is an example.
Using biomass for energy offers potential advantages:
- Biomass is an abundant and renewable source of energy.
- Using biomass for energy would diversify the energy supply and reduce dependency on fossil fuels.
- Biomass production may create new jobs for the local economy in Ontario.
Energy content of biomass
The heating value of a fuel indicates the energy available in the fuel per unit mass — megajoules per kilogram or MJ/kg (BTU/lb). The net heating value is the actual energy available for heat transfer.
The difference in available energy is explained by the fuel’s chemical composition, moisture and ash content. For comparison, the energy content of fuels is reported on a dry basis.
For example, most agricultural residues have heating values that fall in the range of 14–19 MJ/kg (6,040–8,200 BTU/lb); coal ranges from 17–30 MJ/kg (7,300–1,3000 BTU/lb).
Moisture
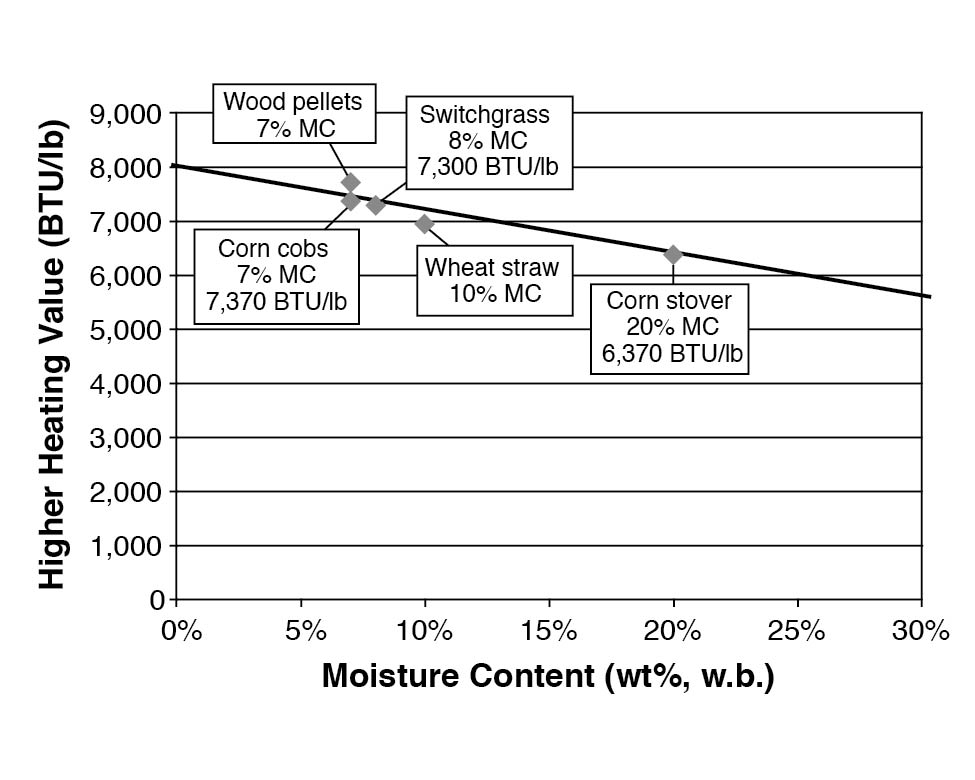
Moisture content is the key factor determining the net energy content of biomass material. Dry biomass has a greater heating value (or net energy potential), as it uses little of its energy to evaporate any moisture. Figure 2 shows this relationship and illustrates the correlation between energy and moisture contents. Increased moisture means less energy available for the boiler.
Generally, the moisture content of a solid is expressed as the quantity of water per unit mass. Moisture content is usually reported on an “as-is” or wet basis (w.b.) in which the water content is given as a fraction of the total weight. All biomass materials contain some moisture, from as low as 8% for dried straw to over 50% for fresh-cut wood.
A high moisture content adversely affects the collection, storage, pre-processing, handling and transportation of biomass. In addition, transporting wet material costs more.
The moisture content of raw biomass can be reduced by:
- leaving biomass in the field to dry for several weeks
- storing biomass, sheltered from precipitation
- commercial drying
Biomass composition
The composition of biomass varies significantly among biomass types. Fuel performance is related to the composition of the biomaterial. Important factors include ash, carbon, hydrogen, nitrogen, sulphur, oxygen and chloride content. The elemental composition of various fuels in Ontario is indicated in Table 1. All values are reported on a dry basis.
| Biomass Type | MJ/kg | BTU/lb | Typical Values |
Typical Values |
Typical Values< |
Typical Values |
Typical Values |
Typical Values |
Typical Values |
|---|---|---|---|---|---|---|---|---|---|
| Off-spec (non-food) grains: Beans | 19 | 7,996 | 4.7 | 45.7 | 6.3 | 4.3 | 0.7 | 38.8 | 193 |
| Off-spec (non-food) grains: Corn | 17 | 7,350 | 1.5 | 42.1 | 6.5 | 1.2 | 0.1 | 48.9 | 472 |
| Off-spec (non-food) grains: Canola | 28 | 12,220 | 4.5 | 60.8 | 8.3 | 4.5 | 0.5 | 21.4 | 163 |
| Off-spec (non-food) grains: Dried distillers grain | 22 | 9,450 | 4.9 | 50.4 | 6.7 | 4.7 | 0.7 | 32.6 | 1,367 |
| Grass/forages: Big blue stem | 19 | 8,020 | 6.1 | 44.4 | 6.1 | 0.8 | 0.1 | 42.6 | 1,880 |
| Grass/forages: Miscanthus | 19 | 8,250 | 2.7 | 47.9 | 5.8 | 0.5 | 0.1 | 43.0 | 1,048 |
| Grass/forages: Sorghum | 17 | 7,240 | 6.6 | 45.8 | 5.3 | 1.0 | 0.1 | 42.3 | 760 |
| Grass/forages: Switchgrass | 18 | 7,929 | 5.7 | 45.5 | 6.1 | 0.9 | 0.1 | 41.7 | 1,980 |
| Straw/residue: Alfalfa | 17 | 7,435 | 9.1 | 45.9 | 5.2 | 2.5 | 0.2 | 39.5 | 3,129 |
| Straw/residue: Barley straw | 17 | 7,480 | 5.9 | 46.9 | 5.3 | 0.7 | 0.1 | 41.0 | 1,040 |
| Straw/residue: Corn cobs | 18 | 7,927 | 1.5 | 48.1 | 6.0 | 0.4 | 0.1 | 44.0 | 2,907 |
| Straw/residue: Corn stover | 19 | 7,960 | 5.1 | 43.7 | 6.1 | 0.5 | 0.1 | 44.6 | 1,380 |
| Straw/residue: Flax straw | 18 | 7,810 | 3.7 | 48.2 | 5.6 | 0.9 | 0.1 | 41.6 | 2,594 |
| Straw/residue: Wheat straw | 18 | 7,710 | 7.7 | 43.4 | 6.0 | 0.8 | 0.1 | 44.5 | 525 |
| Processing by-product: Oat hulls | 19 | 7,960 | 5.1 | 46.7 | 6.1 | 0.9 | 0.1 | 41.1 | 1,065 |
| Processing by-product: Soybean hulls | 18 | 7,720 | 4.3 | 43.2 | 6.2 | 1.8 | 0.2 | 44.3 | 266 |
| Processing by-product: Sunflower hulls | 20 | 8,530 | 4.0 | 47.5 | 6.2 | 1.0 | 0.2 | 41.2 | 3,034 |
| Wood: Bark | 19 | 8,432 | 1.5 | 47.8 | 5.9 | 0.4 | 0.1 | 45.4 | 257 |
| Wood: Willow | 19 | 8,550 | 2.1 | 50.1 | 5.8 | 0.5 | 0.1 | 41.4 | 134 |
| Wood: Hardwood | 19 | 8,300 | 0.4 | 48.3 | 6.0 | 0.2 | 0.0 | 45.1 | 472 |
| Coal: Low sulphur subbit coal – PRB |
25 | 10,520 | 6.0 | 55.0 | 3.7 | 0.9 | 0.4 | 11.5 | 35 |
| Coal: Lignite | 22 | 9,350 | 22.0 | 58.8 | 4.2 | 0.9 | 0.5 | 13.6 | 25 |
Data compiled from AURI, 2005
Ash
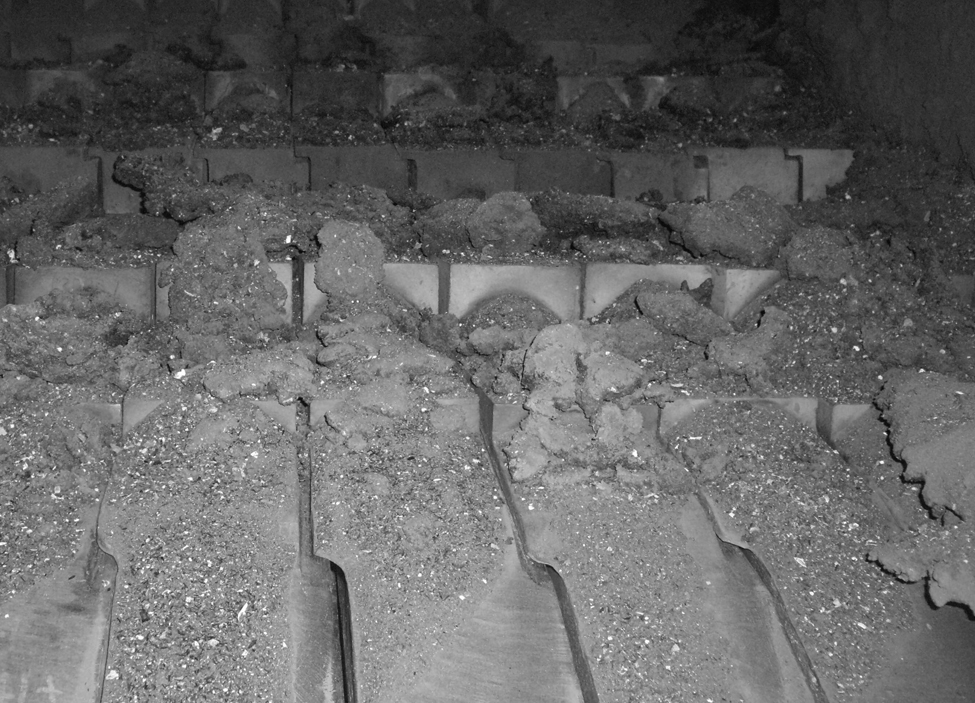
The non-combustible content of biomass is referred to as ash. High ash content leads to fouling problems, especially if the ash is high in metal halides (e.g., potassium).
Unfortunately, biomass fuels, especially agricultural crops/residues tend to have a high ash with high potassium content.
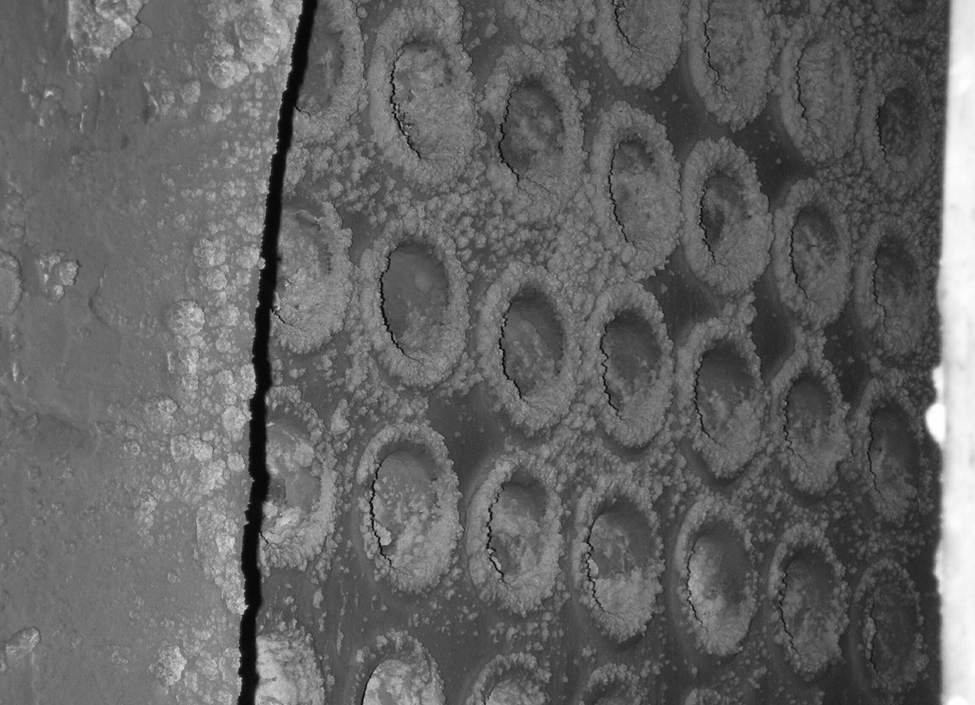
As a result, the ash melts at lower temperatures, resulting in “clinkers” that can jam furnace elements (Figure 3). Alternately, slagging and fouling occur when ash is vapourized and condensed in the boiler, resulting in the production of hard formations on the heat transfer surfaces (Figure 4).
Source: CanmetENERGY
Source: CanmetENERGY
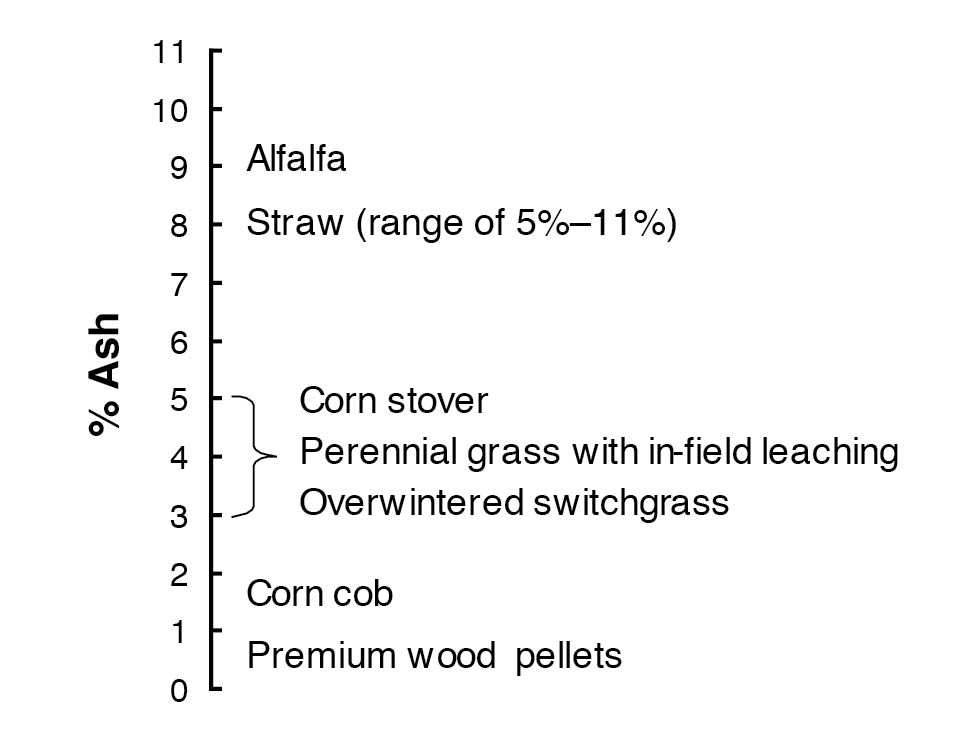
Wood (core, no bark) has less than 1% ash. Bark can have up to 3% ash. Agricultural crops have higher ash content, from 3% and higher (Figure 5). Some boilers/stoves cannot handle fuels with high ash content. More ash means more maintenance.
Source: AURI, 2005
Carbon
The carbon content of biomass is around 45%, while coal contains 60% or greater
Hydrogen
The hydrogen content of biomass is around 6% (Jenkins, 1998). A higher hydrogen content leads to a higher heating value.
Nitrogen
The nitrogen content of biomass varies from 0.2% to more than 1%. Fuel-bound nitrogen is responsible for most nitrogen oxide (NOx) emissions produced from biomass combustion. Lower nitrogen content in the fuel should lead to lower NOx emissions.
Sulphur
Most biomass fuels have a sulphur content below 0.2%, with a few exceptions as high as 0.5%–0.7%. Coals range from 0.5%–7.5%
Chloride
Combustion of biomass with high chloride concentrations (over 1,000 µg/g) can lead to increased ash fouling. High chloride content leads to the formation of hydrochloric acid in the boiler tubes, resulting in corrosion that can lead to tube failure and water leaks in the boiler. Fuels where this has been observed include corn stover and corn cobs.
Properties of biomass
The ultimate analyses for a variety of biomass materials are presented in Table 1. All results are displayed on a dry matter basis for comparison. Use the compiled data only as a general comparative guide.
It is important to note that biomass materials naturally contain variability, which depends on:
- geographical location
- variety
- climate conditions
- harvest methods
Processes to reduce ash, chloride and other elements
Various management strategies exist to reduce the ash and primary elements that interfere with the combustion process, including crop selection, growing conditions, plant fractions, harvesting time and minimizing soil contamination.
Crop selection
Ash is found in lower levels in warm-season grasses, such as big bluestem, switchgrass and annuals such as corn; compared to cool-season grasses, such as orchard grass, fescues and perennial ryegrass
Growing conditions
Soil type highly influences the ash levels of biomass. Higher ash levels are found in crops produced on clay soils than in crops produced on sandy soils.
Plant fractions
The major components of ash are silica and potassium. The distribution and composition of ash varies among different plant fractions. Ash levels are lowest in grass stems and highest in leaves
| Component | Switchgrass Ash Contents (%) |
|---|---|
| Leaves | 7.0 |
| Leaf sheaths | 3.0 |
| Stems | 1.0 |
| Seed heads | 2.4 |
Modified from Samson et al. 1999b.
Harvest timing to allow for leaching
Ash, chloride and potassium content are minimized by leaving the cut biomass in the field to overwinter. Overwintering switchgrass in the field reduces ash levels to as low as 3.5%, due to leaching and loss of plant components that are higher in ash (i.e., leaves). However, harvesting in the spring comes at a cost, with biomass losses of between 20% and 50%.
Minimizing soil contamination
It is important to minimize soil contamination of the crop residue, since soil particles greatly increase the ash concentration of the biomass.
Select mechanical harvesting techniques that avoid digging up the soil (e.g., cut the biomass with a higher stubble height).
Summary
Biomass materials are very diverse, ranging from wood, bark, straw and other agricultural residues, grasses and forages, and off-spec grains, etc. Despite this diversity, the composition of most biomass materials is relatively uniform, especially after moisture is removed. The energy content (on a mass basis) of most dry biomass fuels is in the 17–19 MJ/kg (7,300–8,000 BTU/lb) range. Differences in energy content are due to differences in density and moisture content.
For most biomass fuels, nitrogen and sulphur levels are quite low, resulting in relatively low SOx and NOx emissions. Biomass outside the normal range of these categories is mostly in the off-spec, non–food grain category.
The major difference in the composition of biomass fuels is ash content. Wood, the traditional biomass fuel, generally contains less than 0.5% ash. With bark, this increases to 2%–3% and jumps to above 5% for most grasses and agricultural residues. The increased ash content can cause significant fouling, clinkering and handling issues.
Take care when using these fuels. Design conversion systems specifically for the target fuels. Systems designed for wood (or coal) may not be suitable for other biomass fuels.
Conversion
| From | to | Multiply by |
|---|---|---|
| MJ/kg | BTU/lb | 430 |
| BTU/lb | GJ/ton | 0.00233 |
Resources
- Amos National Renewable Energy Laboratory. Properties of biomass relevant to gasification.
- International Energy Agency. Biomass combustion and co-firing properties.
- Phyllis. Database on the properties of biomass and waste.
- The Commonwealth Scientific and Industrial Research Organisation, Australia. Biomass fuel database.
- United States Department of Energy. Feedstock composition and property database.
This Factsheet was written by Steve Clarke, P.Eng.(retired), engineer, energy & crop engineering specialist, OMAFRA, Kemptville, and Fernando Preto, PhD, research scientist, CanmetENERGY, Ottawa.
Special thanks to Chantal Quesnel and Benjamin Bronson for their contributions and conscientious review and to Shalin Khosla, greenhouse specialist, OMAFRA, Harrow, for his considerable assistance in evaluating alternate fuels.
Footnotes
- footnote[1] Back to paragraph The content level of ash, chlorine and other elements can be lowered through crop selectivity, growing conditions, plant fractionation, harvest time and harvest method.
- footnote[2] Back to paragraph Calculated by difference. Percent by difference refers to the difference between two numbers as a percent of one of them. For example, the percentage difference from 5 to 3 is: 2/5 = 0.4 = 40%.
- footnote[3] Back to paragraph A microgram (µg) is a unit of mass equal to 1/1,000,000 of a gram (1 x 10⁻⁶), or 1/1,000 of a milligram. It is one of the smallest units of mass commonly used.
- footnote[4] Back to paragraph PRB – Power River Basin
- footnote[i] Back to paragraph AURI. (2005). Agricultural renewable solid fuels data. Retrieved from Agricultural Utilization Research Institute Fuels Initiative, www.auri.org.
- footnote[ii] Back to paragraph Preto, F. (2010). Properties of the 13 common biomass fuels in Ontario. Natural Resource Canada(NRCan), Ottawa, ON.
- footnote[iii] Back to paragraph Demirbas, A. (2004). Combustion characteristics of biomass fuels. Progress Energy Combustion Science, 30: 219–230.
- footnote[iv] Back to paragraph Mehdi, B., & Samson, R. (1998). Strategies to reduce the ash content in perennial grasses. Resource efficient Agricultural Production-Canada. Ste. Anne de Bellevue, Quebec.
- footnote[v] Back to paragraph Samson, R., Girouard, P., & Mehdi, B. (1999b). Establishement of commercial switchgrass plantations. Resource efficient Agricultural Production-Canada. Ste. Anne de Bellevue, Quebec.