Filtration processes technical bulletin
This bulletin provides guidance on filter monitoring, performance and reporting requirements at drinking water systems that provide filtration and are subject to the Safe Drinking Water Act, 2002.
Introduction
This technical bulletin provides information for owners, operating authorities, and operators –including certified operators and trained persons — of drinking water systems that use filters and get their water from surface sources (such as rivers or lakes) or from groundwater wells that are under the direct influence of surface water (GUDI).
This bulletin explains the requirements:
- for filtration set out in Ontario Regulation 170/03: Drinking Water Systems, made under the Safe Drinking Water Act, 2002 (SDWA)
- related to filtration processes specified in the Procedure for Disinfection of Drinking Water in Ontario (Procedure)
The Procedure outlines the criteria that a drinking water system with filtration must meet to receive the associated log removal/inactivation credits. It is adopted by reference into Ontario Regulation 170/03, making its requirements mandatory. This bulletin also provides information regarding filtration-related conditions that may be in Schedule E (Schedule E) of a Municipal Drinking Water Licence (Licence) issued to a municipal residential drinking water system.
The information in this bulletin is intended as general technical guidance on a complex subject. It does not address all possible situations or scenarios and is not a substitute for legal or other professional advice in connection with any specific matter. The content refers to existing legislation and regulations, which are subject to change. If you have questions about how the legislation applies to your circumstances, you should consult a lawyer. You may also wish to consult a licensed engineering practitioner with expertise in sanitary engineering related to drinking water systems.
Filtration
Filtration is a physical process used in drinking water treatment to separate solid particles, such as pathogens, from water. When water passes through a filter, solids are separated from the water and retained on the filter. The effectiveness of filtration in removing solids from water depends on factors such as:
- filter pore size
- media type
- maintenance
- operation
- the turbidity of the water being filtered
Turbidity
Turbidity is a measurement used to assess the cloudiness of water caused by suspended particles such as clay, silt and microscopic organisms. It should be measured in Nephelometric Turbidity Units (NTU), accurate to 1 decimal place, to comply with Schedule 6 to Ontario Regulation 170/03.
NTU is a measurement of the amount of light that scatters when it reflects off suspended particles. In general, the cloudier the water, the more light will scatter and the higher the measured turbidity will be. Since filtration is a unit process that separates solids from water, the performance or effectiveness of a filter can be assessed by the quality of the filtered water’s measured turbidity.
Municipal drinking water licence conditions
Conditions in the Municipal Drinking Water Licence typically require the operating authority of municipal residential drinking water system to:
- continuously monitor filter effluent turbidity and calculate the filter performance of each filter using results collected in a calendar day
- evaluate the filter performance results within 72 hours after the tests are conducted
- ensure that action is taken to identify, resolve, and document the cause(s) and responsive action(s) taken if an evaluation of daily filtrate turbidity performance indicates that a filter does not meet the percentage-based performance criterion specified in Schedule E
- continue to perform monthly filter performance calculations and evaluate the results within 72 hours after the end of each calendar month
- make an adverse water quality report as required by Schedule 16-4 to Ontario Regulation 170/03 if the monthly filter performance calculation result for any individual filter does not meet the percentage-based performance criterion specified in Schedule E
Non-municipal year-round residential drinking water systems and drinking water systems serving designated facilities
Non-municipal year-round residential drinking water systems and drinking water systems that serve designated facilities are required to undertake maintenance and operational checks that meet requirements in Schedule 8 or Schedule 9 to Ontario Regulation 170/03. The applicable schedule is based on the size and category of system.
Generally, these drinking water systems must follow the turbidity requirements established in:
- the Procedure
- their Engineering Evaluation Report
- Section 8-4 of Schedule 8 or Section 9-4 of Schedule 9 of Ontario Regulation 170/03 (as applicable based on the system type).
This typically includes requirements to:
- Continuously monitor filter effluent turbidity or, if eligible, collect daily grab samples from each filter (subject to the exclusions set out in Subsection 8-4 (3.1) and (4), or Subsection 9-4 (2.1) and (3), respectively).
- Calculate the filter performance of each filter using the results obtained in a calendar month.
- Complete monthly filter performance calculation or calculations no later than 72 hours after the end of the calendar month and assess the results.
- Make an adverse water quality report as required by Section 16-3 of Schedule 16 of Ontario Regulation 170/03 if there are turbidity exceedances.
- Make an adverse water quality report as required by Section 16-4 of Schedule 16 of Ontario Regulation 170/03 if the filter performance calculation result for any individual filter does not meet the percentage-based performance criterion specified in the Procedure. The report should be made immediately after the calculation and assessment are conducted.
Note that Ontario Regulation 170/03 include exclusions from these requirements for certain types of system, including residential systems that do not serve designated facilities, and non-residential systems that meet certain treatment requirements. For more information, please refer to Schedule 2, Schedule 8 and Schedule 9 of Ontario Regulation 170/03.
Monitoring and recording
Continuous monitoring
Continuous monitoring of filter effluent turbidity is required on each filter effluent line for municipal residential drinking water systems (clause 7-3(2)(b) of Schedule 7 to Ontario Regulation 170/03). All continuous monitoring equipment for filter effluent turbidity must sample, test, and record the date, time, location, and the test result, at a minimum frequency of every 15 minutes. Where the testing frequency is higher than once every 15 minutes, the continuous monitoring equipment must record the date, time, and location of every test result that exceeds 1.0 NTU (Subsection 6-5(1) of Schedule 6 to Ontario Regulation 170/03).
A continuous monitoring frequency that is at least once every 15 minutes must be established at the beginning of the month and remain consistent throughout the month. A minimum of two turbidity samples must be collected in the first 15 minutes of the filter operation period. The first sample must be taken at the time the filter is returned to service and the second sample must be taken no more than 15 minutes later.
If the continuous turbidity monitoring equipment tests more often than every 15 minutes, the equipment may be set to check and calculate the “minimum”, “maximum”, and “mean” values for that interval and to record all 3 results at the end of the 15-minute period. However, it is preferred that the actual turbidity values be continuously tested and recorded.
Spare continuous analyzers or spare parts must be kept readily available either at the drinking water system or nearby so that an analyzer can be quickly repaired or replaced if it malfunctions. Where possible, the filter should not be used during turbidity analyzer repair or replacement. If a filter must be used during analyzer repair or replacement, grab samples can be taken every 15 minutes for a short period of time while the analyzer is being repaired or replaced.
In addition to monitoring filter effluent turbidity, a drinking water system may use continuous monitoring equipment to monitor turbidity at additional locations throughout the treatment processes. These are considered “process” analyzers by the ministry. Process analyzers do not have to meet the requirements specified in Schedule 6 to Ontario Regulation 170/03 in respect of alarms and sample frequency, but they should be maintained in accordance with the manufacturer’s instructions.
Grab sample
Some drinking water systems that utilize slow sand filtration, cartridge filtration or bag filtration have the option to collect daily filter effluent grab samples from each filter instead of using continuous monitoring equipment. This does not apply to municipal residential drinking water sytems, where continuous monitoring is required. Continuous monitoring is also required when other forms of filtration are used (that is, not slow sand filtration, cartridge filtration or bag filtration).
Where continuous analyzers are used instead of grab samples for the filter effluent of slow sand filters and cartridge or bag filters, the analyzers are considered regulatory analyzers. They must comply with the requirements of Schedule 6 of Ontario Regulation 170/03, which includes requirements for calibration, alarms, recording frequency and more.
Record keeping
Continuous monitoring test results recorded under Subsection 6-5(1) of Schedule 6 of Ontario Regulation 170/03 must be examined within 72 hours after the tests are conducted. Documentation demonstrating that the continuous monitoring data was examined at least every 72 hours must be maintained.
Section 27 of Ontario Regulation 128/04 requires that information be recorded as entries in system logs or other record-keeping mechanisms for each operating shift (for example, a logbook). These entries must be made chronologically and include:
- any unusual or abnormal conditions observed during the shift, any action taken and any conclusions drawn from the observations (for example, filter effluent turbidity alarms, coagulant outages, power outages)
- any equipment that was taken out of service or ceased to operate during the shift and any action taken to maintain or repair equipment during the shift (for example, water treatment plant equipment shutdowns due to high filter effluent turbidity)
Entries must clearly identify the person who made them, the time of any departures from normal operating procedures and the name of the person who gave the instructions related to those departures.
Alarm and automatic shut-off features
If a drinking water system uses continuous monitoring equipment to monitor filter effluent turbidity, the equipment’s maximum alarm standard must be set no higher than 1.0 NTU. This maximum alarm standard for turbidity is specified in item 5 of the continuous monitoring table in Section 6-5 of Schedule 6 of Ontario Regulation 170/03. Each filter must have an alarm or an automatic shut-off feature that is triggered by its maximum alarm set point.
Many drinking water systems use a maximum alarm set point below 1.0 NTU or use multiple alarm set points so that, if needed, operators can respond before the filter effluent turbidity reaches the maximum alarm standard that is specified in O. Reg. 170/03. Where the highest setpoint for an alarm is set to less than 1.0 NTU, this alarm value becomes the ‘maximum alarm standard’ for the system and the point at which operators are required to respond and take corrective action in accordance with Ontario Regulation 170/03.
All requirements that apply to the maximum alarm standard also apply in situations where:
- a single alarm is used and is set below the maximum alarm standard of 1.0 NTU
- multiple set points are used and the highest value among them is set below 1.0 NTU
If multiple set points are used, all the other set points apart from the highest value (whether that is below 1.0 NTU or below an alternate maximum alarm standard for the system) are considered operational and do not trigger regulatory requirements for responding to alarms. This does not change the adverse reporting requirements for filter effluent turbidity set out in section 16-3 of Schedule 16 that apply when results exceed 1.0 NTU. Refer to the ‘Adverse Reporting’ section of this bulletin for additional information.
Where an automatic shut-off feature is not used and a test result for turbidity is at or above 1.0 NTU or the alternate maximum alarm standard for the system, the equipment alarm must immediately signal at the location where the tests are conducted. An operator must also be promptly dispatched to that location to address the issue. Where an operator is not always present at that location, the alarm must signal at a location where someone is always present to immediately dispatch an operator (Section 6-5 (1.1) of Schedule 6 of Ontario Regulation 170/03).
Where an automatic shut-off feature is used, it must automatically activate to ensure that no water is directed to users when:
- a test result for filter effluent turbidity is above 1.0 NTU or the alternate maximum alarm standard for the system
- if the equipment malfunctions or loses power
An operator must take action at the location where tests are conducted before water is again directed to users. Unless regulatory relief has been granted, the equipment cannot be restarted remotely without an operator first having arrived at the location and taken action.
Filter performance criteria
The criteria that must be met for a regulated drinking water system to receive the assigned filtration log removal and inactivation credits are outlined in the Procedure and in Municipal Drinking Water Licence conditions for municipal residential drinking water systems. These criteria vary based on the type of filtration technology used at the drinking water system.
A summary of the criteria and applicable guidance are provided in this bulletin for conventional filtration and other common treatment technologies. Refer to the Procedure or the applicable Municipal Drinking Water Licence for a complete list of criteria that must be met for each type of filtration treatment technology.
Conventional and direct filtration
To be eligible for filtration credits and the 2 log Cryptosporidium oocyst, 2.5 log Giardia cysts and 2 log virus removal credits, the design and operation filtration technology in a drinking water system must meet all the criteria listed below, subject to the clarifications noted:
- use a chemical coagulant whenever the treatment plant is in operation
- the chemical coagulant dosing equipment should be equipped with continuous monitoring, alarms and/or automatic shut-off devices to ensure that a chemical coagulant is used whenever the filters are sending water to the next stage of treatment
- minor coagulant outages do not need to be reported as an adverse water quality incident
- a “minor coagulant outage” is coagulant outage that does not cause the filter effluent turbidity to reach 0.3 NTU (during the outage) and that:
- lasts less than 5 minutes (for conventional filtration)
- lasts less than 2 minutes (for direct filtration)
- coagulant interruptions that are not considered to be minor coagulant outages must be reported immediately in accordance with Section 16-4 of Schedule 16 to Ontario Regulation 170/03, unless the drinking water system owner has received regulatory relief from this requirement.
- monitor and adjust chemical coagulant dosages in response to variations in raw water quality
- coagulant dosing effectiveness depends on many operational conditions that can only be assessed on a case-by-case basis
- operating procedures to monitor and adjust the treatment processes based upon changing conditions must be available
- maintain effective backwash procedures, including filter-to-waste or an equivalent procedure, during filter ripening to ensure that the effluent turbidity requirements are met at all times
- an ‘equivalent procedure’ must be approved through a technical application made to the Ministry of the Environment, Conservation and Parks
- filters placed into service without filter-to-waste ripening, or filters operating without coagulant, do not receive the log removal credits assigned for the filtration process
- monitor filtrate turbidity continuously from each filter
- each filter must be monitored with an individual turbidimeter
- turbidimeters located on the common filter effluent are only acceptable if the filters always operate on a duty/stand-by basis where only one filter is in use at a time
- meet the performance criterion for filtered water turbidity of less than or equal to 0.3 NTU in 95% of the measurements
Cartridge and bag filters
- To receive pathogen removal and inactivation credits, cartridge or bag filters should normally meet the performance criterion for filtered water turbidity of less than or equal to 0.2 NTU in 95% of the measurements. However, where it can be shown that turbidity results from the presence of inorganic particles of a size less than 2 microns, higher turbidity may be acceptable.
- A licensed engineering practitioner must make this determination through physical and chemical tests. There must be conclusive evidence that the presence of inorganic particles less than 2 microns in size are the only reason for the excessive turbidity or else a report of inadequate disinfection under Section 16-4 of Schedule 16 to Ontario Regulation 170/03 must be made.
Membrane filtration
In accordance with the Procedure, the integrity of the membrane must be monitored by continuous particle counting, or an equivalently effective method, such as intermittent pressure decay testing.
- The Municipal Drinking Water Licence for the system and/or the manufacturer’s recommendations should be followed regarding pressure decay testing.
- The frequency of pressure decay testing may depend on the log removal credits assigned. Weekly pressure decay testing is sufficient unless the manufacturer’s manual or the Municipal Drinking Water Licence for the system requires more frequent testing
- If a membrane fails a pressure decay test, operators should take steps to check and repair it as necessary. Once the unit is repaired, the filter must pass a pressure decay test to prove membrane integrity before being returned to service.
Membrane filtration must meet the performance criterion for filtered water turbidity of less than or equal to 0.1 NTU in 99% of the measurements.
Filter performance calculation
The filter performance calculation should only include the measurements taken when the filter effluent line is directing water to the next stage of the treatment process. Test results when the filter is in backwash mode or in filter-to-waste mode are not included in the calculations.
Operating authorities for municipal residential drinking water systems must calculate filter performance at the frequency specified in the Municipal Drinking Water Licence for the system, typically using all turbidity measurements taken in a calendar day. All drinking water systems must calculate filter performance monthly.
Filter performance calculations must be completed and reviewed no later than 72 hours after the last test used in the calculation was conducted.
Example 1 — monthly filter performance calculation
Example 1 provides an example calculation for a non-municipal year-round residential drinking water system that provides conventional filtration. In such systems, the filtered water turbidity must be less than or equal to 0.3 NTU in 95% of the measurements for each month.
For this example:
- the drinking water system has 2 filters, each equipped with a continuous analyzer on the filter effluent line
- the continuous analyzers take a measurement and make a record of the result every 5 minutes when the filtered water is discharged to the next treatment process
Table 1: Monthly filter effluent performance calculation
| Filter | Hours of operation | Number of turbidity measurements taken by turbidity meter | Number of turbidity measurements > 0.3 NTU | Number of turbidity measurements ≤ 0.3% NTU | Filter performance calculation |
|---|---|---|---|---|---|
| 1 | 98.5 | 1182 | 60 | 1122 | 94.9% |
| 2 | 137.25 | 1647 | 14 | 1633 | 99.1% |
The result of the filter performance calculation can be truncated to one decimal place but cannot be rounded up (if the result was 94.99 the result could be truncated to 94.9 but cannot be rounded up to 95). The filtered water turbidity for Filter 1 was less than 0.3 NTU in 94.9% of the measurements collected for the month. Therefore, the filter performance criterion of filtered water turbidity of less than or equal to 0.3 NTU in 95% of the measurements for the month was not met for Filter 1. This is required to be calculated no later than 72 hours following the end of the month and immediately reported as an adverse water quality incident if the performance criterion is not met.
Example 2 — calendar day performance calculation
Example 2 provides an example for a municipal residential drinking water system that provides membrane filtration and is subject to municipal drinking water licence conditions that typically require calendar day filter performance calculations in addition to monthly filter performance calculations. Where membrane filtration is used, the filtered water turbidity must be less than or equal to 0.1 NTU in 99% of the measurements for each filter train for each month.
For this example:
- continuous analyzers take a measurement and make a record of the result every 60 seconds when the filtered water is discharged to the next stage of the treatment process
- the filter performance calculation is completed every calendar day and includes turbidity monitoring results collected from 12:00 a.m. to 11:59 p.m. daily
- the total number of measurements taken and the total number that exceed 0.1 NTU over the calendar day are used to complete the filter performance calculation
Table 2: Calendar day filter performance calculation — Filter 1
| Day | Hours of operation | Number of turbidity measurements taken by turbidity meter | Number of turbidity measurements > 0.1 NTU (observed) | Number of turbidity measurements < 0.1 NTU | Filter performance calculation |
|---|---|---|---|---|---|
| June 1 | 21.5 | 1290 | 1 | 1289 | 99.9% |
| June 2 | 14.2 | 852 | 4 | 848 | 99.5 |
| June 3 | 17.5 | 1050 | 2 | 1048 | 99.8 |
| June 4 | 15.25 | 915 | 0 | 915 | 100.0 |
| June 5 | 14.5 | 870 | 1 | 869 | 99.8 |
| June 6 | 22.75 | 1365 | 17 | 1358 | 99.4 |
| June 7 | 16.25 | 975 | 0 | 975 | 100.0 |
| June 8 | 15.20 | 912 | 52 | 912 | 100.0 |
| June 9 | 20.75 | 1245 | 21 | 1224 | 98.3 |
| June 10 | 12.0 | 720 | 0 | 720 | 100.0 |
| June 11 | 18.30 | 1098 | 6 | 1092 | 99.4 |
| June 12 | 15.65 | 939 | 5 | 934 | 99.4 |
The filtered water turbidity on June 9 was less than or equal to 0.1 NTU in 98.3% of the measurements for that calendar day, but not in 99% of them. In such situations it is not necessary to make an adverse water quality incident report in relation to the daily performance criterion not being met. Where required by Municipal Drinking Water Licence conditions, the operating authority must ensure action is taken to identify the cause or causes of the elevated turbidity levels, resolve them where necessary and make a record to describe the action or actions taken.
The calculation must be completed and reviewed within 72 hours of the last test result used in the calculation being conducted, which in this illustrative example would be by 12:00 a.m. on June 13.
Note that the results of the daily filter performance calculations cannot be used to determine the monthly filter performance calculation. Rather, the total number of turbidity measurements taken in the calendar month must be used to perform the monthly calculation.
Adverse reporting
In accordance with Section 18 (1) of the SDWA and Section 16-3 of Schedule 16 to Ontario Regulation 170/03, the owner/operating authority must immediately report a prescribed adverse water quality incident where the filter effluent line is directing water to the next stage in the treatment process and either:
- the filter effluent turbidity exceeds 1.0 NTU in a single grab sample
- continuous monitoring readings exceed the filter effluent turbidity limit of 1.0 NTU in two samples collected 15 minutes or more apart
A report is not required to be made under section 18 (1) of the SDWA if a report in respect of turbidity has been made in the previous 24 hours.
An adverse water quality determination is dependent on the value of the first reading that is taken 15 minutes or more after the initial reading that showed elevated turbidity. It is only necessary to make an adverse water quality report for turbidity once every 24 hours and any adverse readings collected within 24 hours of an initial adverse water quality report do not need to be reported.
Examples of reportable and not reportable events are provided in Figure 1 below.
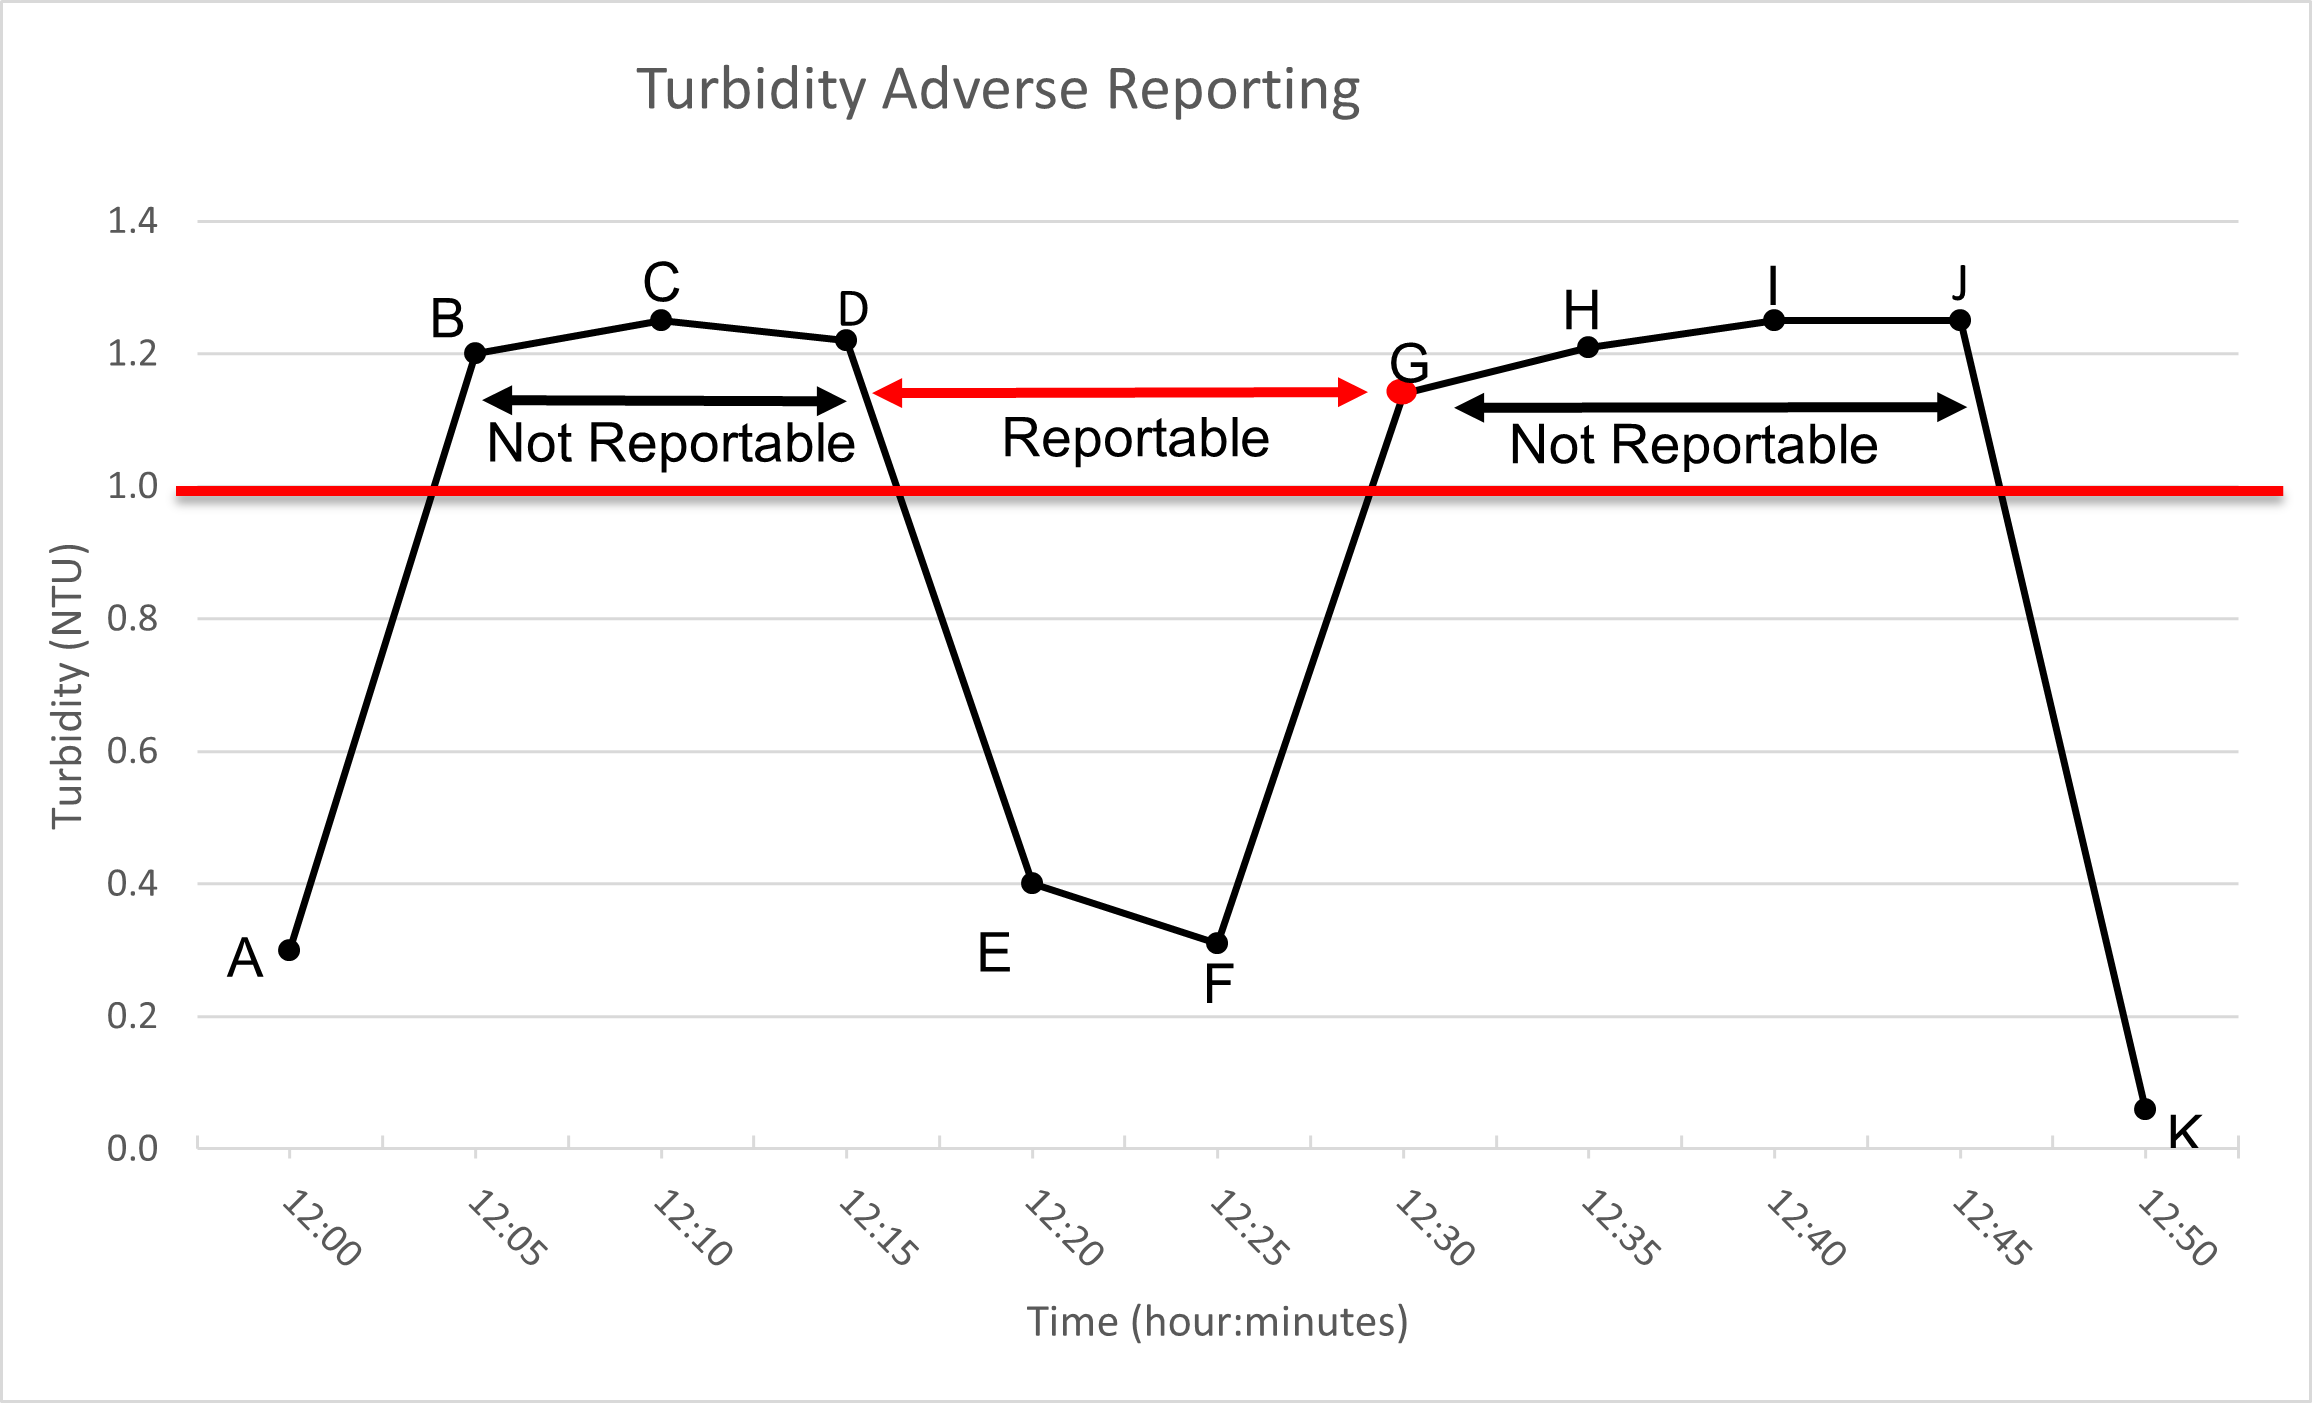
This single-line graph shows a plotted line on a graph where the X axis represents time in intervals of five minutes, the Y axis displays a range of Nephelometric Turbidity Units from 0 to 1.40 in 0.2 unit increments. The line identifies two distinct sets of monitoring results that exceed one Nephelometric Turbidity Unit, labelled as not reportable. Labels also indicate where monitoring results become reportable based on two monitoring results exceeding 1 Nephelometric Turbidity Unit collected 15 minutes apart.
In Figure 1, the continuous analyzer tests and records filter effluent turbidity every 5 minutes.
- the time between B (12:05) and D (12:15) is less than 15 minutes; therefore, an adverse water quality report would not be required even though the values exceed 1.0 NTU
- the reading at D (12:15) is above 1.0 NTU and the reading collected 15 minutes afterwards at G (12:30) also exceed 1.0 NTU; therefore, an adverse water quality report would need to be made at G (12:30) even though the 2 samples collected between E (12:20) and F (12:25) are below 1.0 NTU
- it is not necessary to report a second adverse test result until 24 hours later (For example, at 12:30 the following day). An adverse water quality report would not need to be made at 12:45 on the day of the first reportable event, despite the elevated values noted 15 minutes apart at 12:30 and 12:45 on the day illustrated.
For a turbidity exceedance to qualify as a prescribed adverse test result in accordance with Section 16-3 of Schedule 16 of Ontario Regulation 170/03, the filter effluent line involved only needs to direct water to the next stage of the treatment process (it does not need to direct the water to users).
Failure to meet filter performance criteria
If the filtration process fails to meet any of the Procedure’s criteria for the assigned level of pathogen removal and if the required filtration removal credits are not available from elsewhere in the treatment process, the owner and operating authority have a duty to report other observations as per Section 16-4 of Schedule 16 of Ontario Regulations 170/03.
If the filter performance calculation result for any individual filter does not meet the appliable monthly percentage-based performance criterion, or if it is determined that such a calculation will not satisfy that criterion, an adverse water quality report must be made immediately after the calculation and assessment are conducted (unless filtration removal credits were received from elsewhere in the treatment process).
Filters’ failure to meet their performance criteria could be due to:
- coagulant feed pump or equipment failure
- excessive or insufficient coagulant dose
- long filter run times
- increased loading rates
- inadequate filter backwash rates
The owner or operator must:
- check the operation of each filter for the preceding month
- rationalize the cause for not meeting the applicable filtration process performance criteria
- rectify the operation during the subsequent month
If a particular filter is not meeting the performance criteria, then a filter profile assessment should be conducted and, if necessary, an independent comprehensive performance evaluation of the filtration process should be undertaken.