Labour market report, December 2024
Employment in Ontario increased by 23,400 in December. Get the details in this report.
Quick facts
In December 2024:
- There were 13.5 million people in Ontario aged 15 years or older
- 8.8 million (64.9%) were in the labour force. The labour force increased by 17,900 (0.2%) in December compared to November.
- 8.1 million (60.0%) were employed, up by 23,400 (0.3%) from November.
- Ontario's unemployment rate decreased to 7.5% in December from 7.6% in November and 662,500 people were unemployed, down by 5,500 (-0.8%) from November.
Important note
This report is based on the Labour Force Survey (LFS), a household survey carried out by Statistics Canada. December’s LFS results cover labour market conditions during the week of December 8 to 14.
Employment increased in December
Employment in Ontario increased by 23,400 (0.3%) in December, after little change in November (-5,700 or -0.1%). A total of 8,118,800 people were employed in Ontario in December.
Employment in Canada increased by 90,900 (0.4%) in December, after increasing by 50,500 (0.2%) in November. A total of 20,738,300 people were employed in Canada in December.
Chart 1 shows employment in Ontario from January 2015 to December 2024.
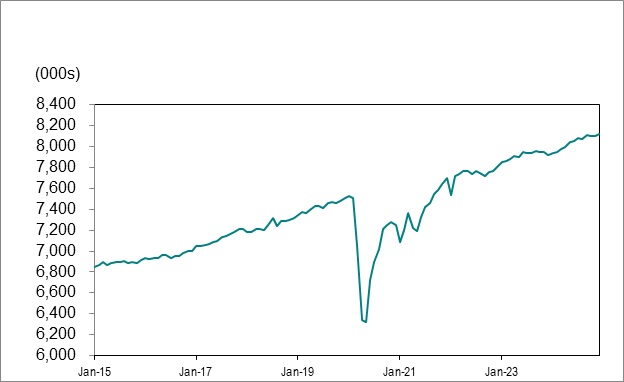
Source: Statistics Canada, Labour Force Survey, Table 14-10-0287-01, (seasonally adjusted data).
On an annual basis, employment in Ontario increased by 131,300 (1.7%) in 2024, following increases of 183,200 (2.4%) in 2023 and 338,300 (4.6%) in 2022.
Full-time vs. part-time
Full-time employment increased by 9,200 (0.1%) in December, while part-time employment increased by 14,200 (1.0%).
Employment change by sex and age
Employment for men increased by 35,900 (0.8%) in December, after increasing by 1,500 (0.0%) in November. Total male employment was 4,301,500 in December. Employment for women decreased by 12,500 (-0.3%) in December, after decreasing by 7,300 (-0.2%) in November. Total female employment was 3,817,300 in December.
Youth (aged 15 to 24) employment decreased by 17,700 (-1.6%) in December for a total of 1,063,800, after decreasing by 6,900 (-0.6%) in November. Employment for people aged 25 to 54 increased by 5,500 (0.1%) in December to 5,313,700, after increasing by 11,800 (0.2%) in November. Employment for those aged 55 and older increased by 35,700 (2.1%) in December to 1,741,300, after decreasing by 10,700 (-0.6%) in November.
Employment change by industry
Ontario’s largest industry groups by employment in December were wholesale and retail trade (1,111,000 or 13.7% of total employment), health care and social assistance (999,200 or 12.3%), professional, scientific and technical services (905,600 or 11.2%), manufacturing (795,300 or 9.8%) and finance, insurance, real estate, rental and leasing (712,500 or 8.8%).
Information, culture and recreation (15,400 or 4.5%), manufacturing (15,100 or 1.9%) and educational services (5,700 or 0.9%) led job gains in December.
Notable employment losses occurred in wholesale and retail trade (-10,900 or -1.0%), health care and social assistance (-9,800 or -3.2%) and professional, scientific and technical services (-5,100 or -0.6%) in December.
On an annual basis, employment increased in nine of the sixteen major industry groups in 2024, led by professional, scientific and technical services (65,100 or 7.9%), health care and social assistance (29,200 or 3.0%), educational services (28,600 or 5.1%) and finance, insurance, real estate, rental and leasing (25,100 or 3.7%).
On an annual basis, employment decreased in seven of the sixteen major industry groups in 2024. Notable employment losses occurred in construction (-26,500 or -4.4%) and wholesale and retail trade (-22,000 or -2.0%).
Chart 2 shows industries by employment change in Ontario, November 2024 to December 2024.
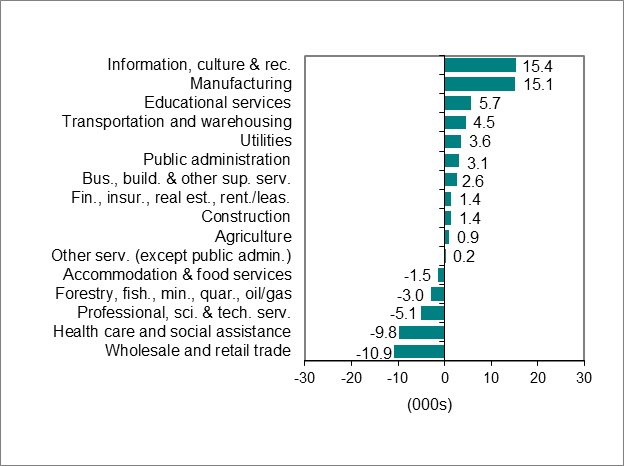
Source: Statistics Canada, Labour Force Survey, Table 14-10-0355-02, (seasonally adjusted data).
Employment change by occupation
Ontario’s largest occupational groups by employment in December were sales and service (1,638,800 or 20.3% of total employment), business, finance and administration (1,381,400 or 17.1%), trades, transport and equipment operators (1,064,500 or 13.2%) and occupations in education, law and social, community and government services (962,400 or 11.9%).
Seven of the ten major occupational groups in Ontario had net annual employment gains between 2023 and 2024. Management occupations (52,600 or 6.3%) led job gains, followed by natural and applied sciences and related occupations (43,900 or 5.8%) and occupations in education, law and social, community and government services (43,700 or 4.9%).
Annual employment losses were recorded in business, finance and administration occupations (-13,400 or -1.0%), sales and service occupations (-12,600 or -0.8%) and trades, transport and equipment operators (-10,200 or -0.9%).
Chart 3 shows occupations by annual employment change in Ontario, 2023 to 2024 (Annual).
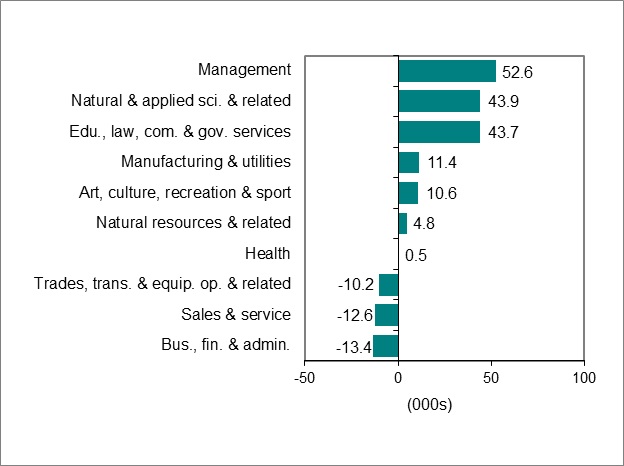
Source: Statistics Canada, Labour Force Survey, Table 14-10-0421-01, (data unadjusted for seasonality).
Employment change in urban centres
In December 2024, employment in nine of the sixteen Ontario Census Metropolitan Areas (CMAs) was above their December 2023 level, led by Toronto (94,700 or 2.6%) and followed by Kitchener-Waterloo-Cambridge (27,100 or 7.9%), Windsor (12,000 or 6.5%) and Ottawa-Gatineau (10,900 or 1.3%).
Notable employment losses in December were recorded in Belleville (-14,200 or -30.8%), Guelph (-7,500 or -7.3%) and Peterborough (-5,800 or -8.0%).
On an annual basis, employment increased in nine of the sixteen CMAs in 2024, led by Toronto (64,300 or 1.7%), Ottawa-Gatineau (25,600 or 1.9%), Kitchener-Waterloo-Cambridge (17,900 or 5.2%) and Hamilton (9,800 or 2.4%).
On an annual basis, employment decreased in seven of the sixteen major industry groups in 2024. Notable employment losses occurred in Belleville (-17,600 or -29.9%) and Barrie (-4,900 or -3.8%).
Chart 4 shows employment change for Ontario Census Metropolitan Areas (CMAs) from December 2023 to December 2024.
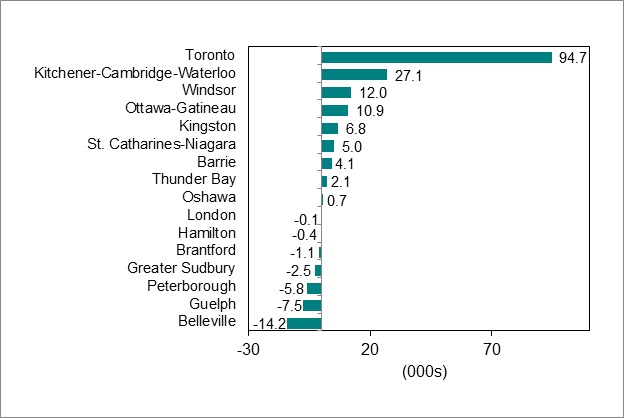
Source: Statistics Canada, Labour Force Survey, Table 14-10-0380-01, (seasonally adjusted data three-month moving average to reduce volatility caused by small sample size).
Unemployment rate decreased to 7.5%
Ontario’s unemployment rate decreased to 7.5% in December from 7.6% in November. The provincial unemployment rate has increased significantly since falling to a near-record low in April 2023 (5.1%).
The Canadian unemployment rate decreased to 6.7% in December from 6.8% in November. The national unemployment rate has increased significantly since April 2023 (5.1%).
Chart 5 shows unemployment rates, Ontario and Canada, January 2015 to December 2024.
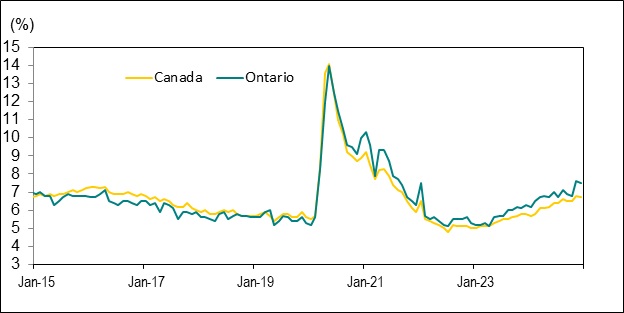
Source: Statistics Canada, Labour Force Survey, Table 14-10-0287-01, (seasonally adjusted data).
Ontario’s annual unemployment rate was 7.0% in 2024, well above the annual rate of 5.7% in 2023 and the annual rate of 5.6% in 2022.
Unemployment rate by sex, age, visible minority status, immigrant status and Indigenous group
The unemployment rate for women increased to 7.4% in December from 7.3% in November. The rate for men was 7.6% in December, down from 7.9% in November.
For youth aged 15 to 24, the unemployment rate increased to 18.2% in December from 17.0% in November. The unemployment rate for individuals aged 25 to 54 fell to 6.1% in December from 6.3% in November. The unemployment rate for those aged 55 and older decreased to 4.4% in December from 4.9% in November.
In Ontario, the unemployment rate among population groups designated as visible minorities was estimated at 9.2% in December compared to a 5.3% rate for those who are not visible minorities and did not identify as Indigenous (data are three-month moving averages and are not adjusted for seasonality).
The unemployment rate for landed immigrants was 7.3% in December compared to a 5.9% rate for the Canadian-born population in Ontario. The unemployment rate for landed immigrants includes the rates for very recent immigrants (i.e., immigrants who landed 5 less years earlier) (9.8%), recent immigrants (i.e., immigrants who landed more than 5 to 10 years earlier) (9.0%) and established immigrants (i.e., immigrants who landed more than 10 years earlier) (6.2%) (data are three-month moving averages and are not adjusted for seasonality).
In Ontario, the unemployment rate for the Indigenous population was estimated at 11.1% in December compared to a 6.7% rate for the non-Indigenous population. The unemployment rate for the Indigenous population includes the rates for First Nations people living off reserve (15.0%) and individuals who identify as Métis (6.0%) (data are three-month moving averages and are not adjusted for seasonality).
Unemployment rate by urban centre
In December, the average unemployment rate increased from November in nine of the sixteen Ontario Census Metropolitan Areas (CMAs). The largest increases were seen in Belleville (1.8% in November to 3.3% in December), Peterborough (4.3% to 5.3%) and Guelph (6.0% to 6.9%).
Four CMAs had average unemployment rates that decreased in December, led by Brantford (5.7% in November to 4.8% in December) and Ottawa-Gatineau (6.2% to 5.9%).
The average unemployment rate was unchanged in three CMAs in December: Barrie (5.8%), Kingston (5.6%) and Greater Sudbury (5.5%).
Chart 6 shows the average unemployment rate for Ontario Census Metropolitan Areas (CMAs) in December 2024.
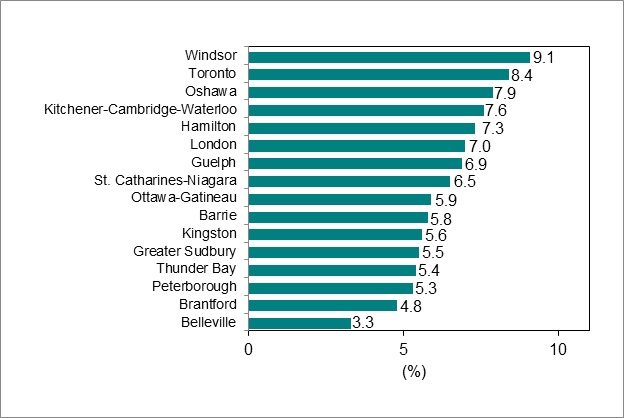
Source: Statistics Canada, Labour Force Survey, Table 14-10-0380-01, (seasonally adjusted data three-month moving average to reduce volatility caused by small sample size).
Long-term unemployment
In December, an estimated 160,000 Ontarians or 24.2% of all unemployed people were unemployed for 27 weeks or longer (long-term unemployed). This compared 173,400 Ontarians or 26.0% of all unemployed people in November and 95,200 or 18.0% of all unemployed people a year earlier in December 2023.
On an annual basis, the proportion of all unemployed people who were in long-term unemployment was 22.3% in 2024. This was well above the percentages in 2023 (16.7%) and 2022 (18.2%).
The average time in unemployment was 24.6 weeks in December, above the average in November (21.5 weeks) and well above the average in December 2023 (16.2 weeks).
On an annual basis, the average time in unemployment was 20.8 weeks in 2024, above the averages in 2023 (17.6 weeks) and 2022 (19.7 weeks).
Chart 7 shows Ontario’s long-term unemployment (27 weeks or more) as a percentage of total unemployment, January 2015 to December 2024.
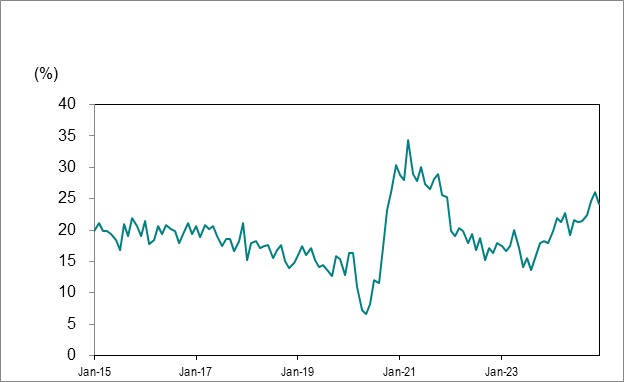
Source: Statistics Canada, Labour Force Survey, Table 14-10-0342-01, (seasonally adjusted data).
Average hourly wages by sex, age and industry
Important note
Average hourly wage rates are reported without adjusting for the rate of inflation.
The average hourly wage rate in Ontario for employees was $37.36 in December, above the average rate across Canada ($35.77). Ontario’s average hourly wage rate in December rose by 4.6% on a year-over-year basis (by $1.64 from $35.72 in December 2023) which was below the 5.5% increase in November.
December’s wage growth (4.6%) was well above the growth seen in the Ontario Consumer Price Index (CPI) as of October (1.8%). The CPI is a measure of inflation that represents changes in prices for goods and services as experienced by consumers.
Chart 8 shows the year-over-year percentage change in Ontario’s average hourly wage rate and the Ontario Consumer Price Index (CPI), January 2015 to December 2024.
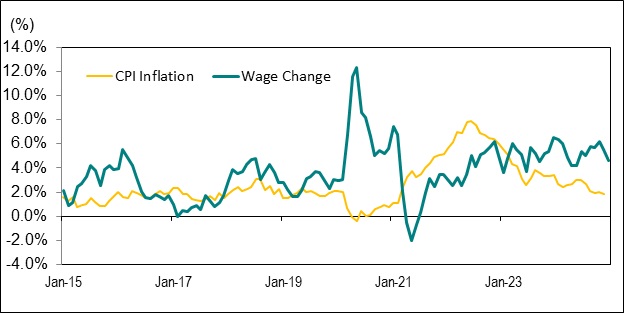
Source: Statistics Canada, Labour Force Survey, Table 14-10-0063-01 (data unadjusted for seasonality)
The average hourly wage rate was $34.78 for women in December, rising by 5.1% ($1.68) from $33.10 in December 2023. For men, the average hourly wage rate was $39.84, an increase of 3.9% ($1.50) from $38.34 a year earlier.
For youth aged 15 to 24, the average hourly wage rate was $22.07 in December, an increase of 5.7% ($1.20) from $20.87 in December 2023. The average hourly wage rate for individuals aged 25 to 54 rose to $39.92 in December, up 4.0% ($1.55) from $38.37 a year earlier. The average hourly wage rate for those aged 55 and older increased by 6.7% ($2.51) to $40.02 in December from $37.51 a year earlier.
In December, the industries with the largest increases in average hourly wage rates compared to a year earlier were:
- Agriculture: +20.1% ($4.74) to $28.31
- Utilities: +11.9% ($6.19) to $58.42
- Information, culture and recreation: +10.3% ($3.45) to $37.08
Only two industries experienced a decrease in their average hourly wage rates in December compared to a year earlier:
- Forestry, fishing, mining, quarrying, oil and gas: -5.7% (-$2.71) to $45.17
- Wholesale and retail trade: -2.7% (-$0.75) to $27.54
Changes in average hourly wages by industry are the result of multiple factors, including wage growth and shifts in the composition of employment by job tenure and occupation.
Download data
Source: Statistics Canada, Labour Force Survey
December 2024 Labour Market Report:
- CSV, Chart 1, employment in Ontario from January 2015 to December 2024, 1Kb
- CSV, Chart 2, industries with highest and lowest employment change in Ontario, November 2024 to December 2024, 2Kb
- CSV, Chart 3, employment change for occupations in Ontario from November 2023 to December 2024, 2Kb
- CSV, Chart 4, employment change for Ontario Census Metropolitan Areas (CMAs) from November 2024 to December 2024, 2Kb
- CSV, Chart 5, unemployment rates, Ontario and Canada, January 2015 to December 2024, 2Kb
- CSV, Chart 6, average unemployment rates for Ontario Census Metropolitan Areas (CMAs), December 2024, 2Kb
- CSV, Chart 7, Ontario’s long-term unemployed (27 weeks or more) as a percentage of total unemployment, January 2015 to December 2024, 2Kb
- CSV, Chart 8, year-over-year percentage change in Ontario’s average hourly wage rate and the Ontario Consumer Price Index (CPI), January 2015 to December 2024, 2Kb