Ministry of Infrastructure Results-based Plan 2014-15
The Ministry of Infrastructure’s key responsibilities, priorities and financial information for the fiscal year 2014-15.
Part 1: published results-based plan 2014-15
Ministry overview
Mandate
The Ministry of Infrastructure (MOI) works with partners inside and outside government to modernize public infrastructure and encourage the kind of sustainable growth that enhances our quality of life and contributes to our economic success.
MOI serves a central agency function providing support to Treasury Board (TB) in overseeing infrastructure planning and investments. It is responsible for managing sustainable growth – in collaboration with other ministries and in consultation with municipalities, stakeholders and the public. The ministry is also responsible for developing strategic policies for government-owned realty assets and enabling the revitalization of Toronto’s waterfront.
A priority is to modernize public infrastructure to support economic prosperity and quality of life through a strategic framework set out in Building Together, Ontario’s ten-year infrastructure plan released in 2011.
The ministry is also responsible for the Places to Grow initiative, and is currently implementing the Growth Plan for the Greater Golden Horseshoe, and working with the Ministry of Northern Development and Mines to implement the Growth Plan for Northern Ontario.
The ministry has legislative responsibility for the Ontario Infrastructure and Lands Corporation (Infrastructure Ontario or IO), which has an "end-to-end" realty and infrastructure delivery mandate. MOI also oversees the Toronto Waterfront Revitalization Corporation (Waterfront Toronto), in partnership with the federal government and the City of Toronto.
The ministry is responsible for the proposed Infrastructure for Jobs and Prosperity Act, which was introduced in the Legislature on July 7, 2014. If passed, the proposed legislation would ensure that current and future governments regularly prepare long-term infrastructure plans and continue to improve how Ontario’s infrastructure needs are prioritized.
Ministry Contribution to Priorities and Results
The ministry manages government policy and initiatives leading to revitalized public infrastructure that enhances economic competitiveness, protects the environment, builds sustainable communities and effectively manages the Province’s real estate assets.
Ministry contributions to economic prosperity
| Priorities | Economic prosperity |
|---|---|
| Results |
|
| Strategies |
|
| Major programs/activities |
|
| Key measures |
|
Ministry contributions to environmental stewardship
| Priorities | Environmental stewardship |
|---|---|
| Results |
|
| Strategies |
|
| Major Programs/Activities |
|
| Key Measures |
|
Ministry contributions to sustainable communities
| Priorities | Sustainable communities |
|---|---|
| Results |
|
| Strategies |
|
| Major programs/activities |
|
| Key measures |
|
The ministry supports the government’s long-term priorities of economic prosperity, environmental stewardship and sustainable communities.
To meet these priorities, the ministry is focused on three key deliverables:
- to continue to revitalize Ontario’s public infrastructure
- to implement provincial growth plans
- to effectively and responsibly manage the government’s realty
Infrastructure renewal and the ten-year infrastructure plan
Well-maintained and world-class public infrastructure is the foundation of a strong economy and is a cornerstone of vibrant and prosperous communities. Investments in infrastructure help improve Ontario’s competitiveness, provide positive impact on productivity and enhance quality of life.
That is why the Province has invested nearly $100 billion in public infrastructure since 2003. These investments include the five-year, $30-billion ReNew Ontario investment plan, which was completed in 2008-09, one year ahead of schedule. The ReNew Ontario plan positioned the Province as a leader in the modernization of public infrastructure.
As part of the government’s economic stimulus initiative launched in 2009, the Province invested more than $3 billion in nearly 11,000 stimulus projects. These investments were timely and targeted, and helped to support 80,000 jobs over their construction, stimulating the Province’s economy when it needed it the most.
Building on these successes, in June 2011 the ministry released Building Together – a roadmap for the Province’s infrastructure investments over the next decade. The plan focuses on making investments in core infrastructure, such as transit, highways, postsecondary education and hospitals, and ensuring that infrastructure is properly aligned with the life-long needs of Ontarians. The ministry will continue to ensure effective implementation of Building Together in 2014-15 and beyond.
To continue to build new transit, roads, bridges and hospitals and schools, the Province plans to make significant investments of over $130 billion in public infrastructure over the next 10 years. Ontario’s planned infrastructure investments would support over 110,000 jobs on average each year in construction and related industries.
To support government priorities the ministry remains committed in 2014-15 to:
- supporting Treasury Board in managing the government’s 10-year capital plan
- working with federal, municipal and other partners
- delivering critical public infrastructure projects through innovative investment strategies and Alternative Financing and Procurement where positive value for money can be demonstrated
Growth planning
Over the next 25 years, Ontario will encounter diverse growth challenges. The Places to Grow Act, 2005 is the cornerstone of the government’s initiative to manage growth in Ontario in ways that sustain a robust economy, preserve the environment and natural resources, and help communities grow and flourish. This legislation enables the government to identify and designate growth plan areas and develop strategic growth plans for those communities. This is accomplished with the participation of local officials, Aboriginal communities, stakeholders, residents, and other public groups.
Growth plans identify where and how growth should occur within a region and help guide government investments. They set out policy directions and planning tools that work to achieve attractive, healthy communities and contribute to a more creative, connected and prosperous community fabric. More broadly, the Province’s growth management policies and objectives can also be applicable to communities that are not subject to a specific growth plan.
There are two growth plans currently in effect that address different growth challenges. In the Greater Golden Horseshoe, the challenge is effectively planning for a population increase of approximately four and a half million people while mitigating the negative impacts of growth. In Northern Ontario, the challenge is creating a sustainable economy that supports training, education and employment opportunities, and attracts people and investment.
Growth plan for the Greater Golden Horseshoe
With the approval of the Growth Plan for the Greater Golden Horseshoe, 2006, the government has provided overall leadership and guidance for growth over the next 25 years. It sets provincial priorities and provides clear, region-wide standards for growth and development, while giving communities the flexibility they need to address local circumstances.
The Growth Plan was created as a visionary way of leveraging all the good things about growth – including greater prosperity, better jobs and more opportunities – while protecting residents and the countryside around them from the sprawl, congestion and pollution that unplanned expansion can bring.
Today, the Greater Golden Horseshoe is home to roughly 9.3 million people and 4.6 million jobs. By 2041, these numbers will grow to 13.5 million people and 6.3 million jobs – the equivalent of adding six cities of Mississauga to the region.
The Growth Plan is already at work helping to ensure thoughtful, coordinated approaches to this coming growth. Its goal is the creation of complete, dynamic communities throughout the region that are great places to live, work, play and learn; communities that attract well-educated, dynamic, creative people and the companies that want to employ them; communities where economic, social, personal and environmental health are all in balance.
It is achieving this by helping municipalities grow in smarter ways by:
- encouraging more compact built-up areas that are less costly to service and easier to get around in
- building infrastructure like roads and water systems in ways that make public money go further and conserve resources
- providing housing choices for people at all stages of their lives
- ensuring that people can bike, walk or take transit to as many destinations as possible
- preserving the region’s natural heritage, farmland and the green spaces that will be ever more important as growth accelerates
By providing a framework for municipalities to plan their growth through 2041, the Growth Plan supports long-range land-use, economic, and infrastructure planning. Communities across the region have begun making choices that will yield smart, sustainable growth now and in the future.
In the years to come, communities, people and businesses will experience even greater benefits from the Growth Plan for the Greater Golden Horseshoe as it continues to build the foundation the region needs to meet its challenges and – even more important – grasp the opportunities that growth and prosperity present.
The ministry will continue to work with municipalities so that they can achieve conformity with the Growth Plan and will continue to work with partner ministries to achieve policy and planning alignment. The ministry will continue its research and outreach activities that further the Province’s growth planning objectives, along with other supporting efforts to implement the Growth Plan in partnership with municipalities and key stakeholders.
Growth plan for Northern Ontario
The Growth Plan for Northern Ontario was released in March 2011. Developed in partnership with the Ministry of Northern Development and Mines, with extensive engagement of diverse partners, the 25-year plan will help create stronger, more diverse and sustainable northern communities.
The Growth Plan will help attract people and investments to the region, support training, education and employment opportunities, create a highly qualified workforce and position the northern economy to compete on a global scale.
Three significant implementation initiatives are already underway or complete:
- development of a northern multi-modal transportation strategy expected to be completed by 2016
- establishment of a Northern Policy Institute in August 2012
- hosted a forum for Northern Leaders in December, 2013 to initiate collaboration on further Growth Plan implementation work
Realty planning, development and management
The effective management of the government’s realty is a prime responsibility for the ministry. In addition to ensuring major infrastructure projects deliver value for money, this commitment includes effective management of the ministry’s realty portfolio and ensures the advancement of public policy and program delivery through use of realty. The portfolio of owned assets today consists of approximately 36 million square feet of space in almost 5,000 buildings and structures – ranging from detention centres to office space, courthouses, sheds and heritage buildings – and over one million acres of land.
The ministry and Infrastructure Ontario are committed to being leaders in sustainability, specifically in the sustainable management of Ontario’s real estate portfolio.
Realty under the administration and control of the ministry can be used for government programs or, when it is no longer required, can be sold to meet local or other government interests.
The government is committed to making the best use of and obtaining fair market value for its realty assets. Before properties are put up for sale, a stringent review and due diligence process determines if they serve useful purposes in meeting government program and policy objectives, and if there are environmental, heritage, aboriginal and archaeological issues/interest in the property. Only those identified as surplus assets are listed for sale.
The disposition of properties is part of a broader, long-term strategy set out by the government to manage the Province’s realty assets in the most efficient and effective manner. To implement the strategy, Infrastructure Ontario develops an annual sales plan for the disposition of surplus property and follows a streamlined disposition process for optimal results.
Realty transformation strategy
In March 2012, MOI proposed a strategy to modernize the way government manages its realty. The Realty Transformation Strategy is founded on corporate approaches and the private sector’s best practices to manage and unlock the value in the government’s large realty portfolio, which would move the program from a traditional project-by-project delivery focus to a strategic oversight and management focus.
This new approach includes updating the government’s realty policies to provide more appropriate tools and structures for planning, funding and managing of realty on an enterprise level. This includes:
- implementing a new modern realty policy framework that provides a more centralized approach to the planning and management of realty assets and that reflects market principles
- reducing the office footprint by one million square feet in Toronto and a further 300,000 square feet outside of Toronto
- developing a strategy for the repair and upkeep of core assets to a state of good repair and divest ownership of assets not required for program use
These initiatives are intended to lead to better management of a smaller pool of key assets, raise money through the sale of surplus assets, and decrease costs associated with the upkeep of assets so that key government priorities can be addressed.
Waterfront development
The Toronto Waterfront Revitalization Corporation (Waterfront Toronto) is responsible for carrying out the tri-government Toronto Waterfront Revitalization Initiative in the Designated Waterfront Area which consists of a 2,000 acre area that runs from Dowling Avenue to the west to Coxwell Avenue to the east. To date, over 80 per cent ($1.3 billion) of the initial $1.5 billion dollars of seed capital for the Toronto Waterfront Revitalization Initiative has been invested in Toronto waterfront development.
Waterfront Toronto has undertaken the upfront work of establishing precinct plans, ensuring zoning and planning approvals are in place, has constructed substantial infrastructure including a flood protection berm, roads and services within two of the priority precincts, East Bayfront and West Don Lands. The West Don Lands, an 80-acre parcel of predominantly provincially-owned land east of Toronto’s downtown core, has been selected to be the site of the Athletes' Village for the 2015 Pan/Parapan American Games. The Village achieves multiple provincial priorities including affordable housing, brownfield redevelopment and tangible progress on waterfront revitalization.
Over the next ten years (2014-2023), revitalization efforts in the Toronto waterfront will focus on completing work in the Central Waterfront, East Bayfront and West Don Lands precincts, as well as unlocking the development potential of North Keating, the Lower Don Lands / Port Lands. Waterfront Toronto is focusing on projects that leverage private investment, deliver critical infrastructure, have high community usage and increase connections across the waterfront and the rest of the City.
Ministry programs and activities
The Ministry of Infrastructure is committed to building and enhancing policies and programs in the following key areas:
- infrastructure and growth planning
- realty planning, development and management
Infrastructure
The ministry provides analysis and advice that guide public infrastructure decisions to achieve Ontario’s policy and fiscal objectives. In this regard, the ministry has central agency responsibility for the planning, analysis and management of infrastructure investments in the Province. The ministry supports Treasury Board in decision-making on infrastructure investments, leads negotiations with the federal government on new cost-shared infrastructure programs, works with municipalities on developing and implementing a municipal infrastructure strategy, supports asset management planning, develops infrastructure procurement and financing strategies, and provides research and analysis to support decision-making.
Growth planning
The ministry provides leadership in the development and implementation of the government’s Province-wide growth management policy under the Places to Grow Act, 2005. This initiative includes creating and implementing regional growth plans with the participation of local governments, Aboriginal communities, affected stakeholders, and the broader public. The ministry facilitates the alignment of government policy and funding across multiple ministries to support the implementation of the growth plans.
Realty planning, development and management
The ministry has integrated responsibility for strategic planning, policy development and management of a portfolio encompassing approximately one million acres of land held throughout Ontario. It is also responsible for acquiring, disposing and managing realty assets, as well as overseeing its realty delivery agent, the Ontario Infrastructure and Lands Corporation (Infrastructure Ontario).
In this role, the ministry and its realty delivery agent provide expert real estate advice and service to support Ontario’s policy and program objectives, in addition to working with other Ontario ministries and agencies to support their land and accommodation needs. Today, the ministry is achieving a number of Ontario’s environmental and policy objectives through its effective management of realty, value optimization of existing realty, and the provision of adequate and appropriate workspace for Ontario public servants. Key delivery agencies:
- Infrastructure Ontario plays a critical role in supporting the Ontario government to modernize and maximize the value of public infrastructure and real estate and manage government facilities using innovative procurement methods and administering a loan program
- Waterfront Toronto is responsible for revitalizing and transforming Toronto’s waterfront into beautiful, sustainable new communities, parks and public spaces, and to foster economic growth in knowledge-based, creative industries
| Operating | 143.2 |
|---|---|
| Capital | 478.1 |
| TOTAL | 621.3 |
Highlights of 2013-14 achievements
The ministry continues to create and deliver key initiatives in support of the government’s long-term priorities of economic prosperity, environmental stewardship and sustainable communities.
In 2013-14, the ministry continued its focus on the revitalization and renewal of public infrastructure and the implementation of growth plans. This includes the continued implementation of the ten-year infrastructure plan, continued support for municipal implementation of the Growth Plan for the Greater Golden Horseshoe, 2006 and continued implementation of the Growth Plan for Northern Ontario, 2011.
Infrastructure investments
Public infrastructure investments support jobs and provide significant economic benefits over the longer term. Since 2003, Ontario has invested nearly $100 billion in infrastructure focusing on hospitals, schools and transportation infrastructure. These investments have resulted in:
- 100 major hospital projects built or underway, including 23 new hospitals
- more than 27,000 school renewal projects completed or underway and nearly 650 new schools opened, planned or under construction
- providing funding to support enrolment growth of over 160,000 students, including $1.5 billion in joint Canada-Ontario stimulus funding announced in 2009 and most recently, over $600 million towards capital projects at colleges and universities announced as a part of the ten-year infrastructure plan
- investing more than $14.9 billion in capital funding to support public transit across the province, including approximately $8 billion in GO Transit to support an overall increase of 63 per cent in the GO Transit fleet size
- expanding and/or rehabilitating over 7,900 kilometres of provincial highways
- more than 950 new or repaired bridges on provincial highways
- five new consolidated courthouses
- launching the Municipal Infrastructure Strategy and providing over $13 billion in infrastructure funding to municipalities since 2003
- approving and executing over $7.3 billion in infrastructure loans through the Infrastructure Ontario Loan Program to help support over 1,900 projects – from the construction of roads, bridges and facilities to the acquisition of assets, such as vehicles and equipment
Some of the Province’s infrastructure projects are also being delivered through innovative investment strategies and the made-in-Ontario approach known as Alternative Financing and Procurement (AFP). Managed by Infrastructure Ontario, the AFP model leverages private sector expertise and resources to deliver some of the Province’s larger, more complex infrastructure projects, while ensuring appropriate public control and ownership.
To date, Infrastructure Ontario is delivering over 80 infrastructure projects using the AFP model, valued at about $35 billion in capital costs. Projects under construction or completed have an estimated $3.5 billion in value-for-money savings.
Ten-year infrastructure plan
The Province’s long-term infrastructure plan, Building Together, identifies key investment priorities, including getting Ontario’s goods to market faster with better highways, roads and bridges; giving commuters sound transit options; educating a strong and innovative workforce; ensuring healthier lifetime outcomes; and helping Ontario’s rural areas, regions, and cities.
As part of Building Together, the government has:
- released a municipal asset management guide through the Municipal Infrastructure Strategy
- adopted a 10-year perspective for capital planning
- expanded Alternative Financing and Procurement to more sectors
- committed to make greater use of Infrastructure Ontario to procure the Province’s infrastructure
Implementation of the commitments in Building Together is underway and will continue in 2014-15 and beyond.
Municipal infrastructure strategy
On August 16, 2012, the ministry introduced the Municipal Infrastructure Strategy. The strategy is a long-term policy framework that intends to help municipalities address their critical infrastructure needs. The strategy begins by requiring municipalities that request provincial infrastructure funding to show how proposed projects fit within a comprehensive asset management plan.
To support the strategy, the ministry released a Guide for Municipal Asset Management Plans and an online asset management toolkit. Both the guide and the toolkit are intended to help municipalities prepare asset management plans and share best practices.
Through the Small, Rural and Northern Municipal Infrastructure Fund, launched in 2013-14 and the previous Municipal Infrastructure Investment Initiative (MIII) program, the province is providing nearly $200 million to help municipalities address critical infrastructure projects and prepare asset management plans. This includes over $12 million in asset management funding to help smaller municipalities with the preparation of their asset management plans and over $185 million in capital funding for critical road, bridge, water and wastewater projects.
Federal-provincial infrastructure programs
In 2012, Ontario submitted Building Canada Together, Ontario’s recommendations for the new federal long-term infrastructure plan. Ontario called on the federal government to increase investment, focus on core economic infrastructure, incorporate asset management planning and private sector innovation in their programs, and streamline administration.
The federal government announced the new Building Canada Plan in its 2013 Budget and released additional details February and March 2014. The ministry is working with the federal government to operationalize the new federal-provincial programs in Ontario.
Proposed Infrastructure for Jobs and Prosperity Act (Bill 141)
On November 26, 2013 the government introduced Bill 141, the proposed Infrastructure for Jobs and Prosperity Act, 2014. The proposed legislation outlined a series of mechanisms to encourage principled, evidence-based and strategic long-term infrastructure planning. In addition, it included measures intended to support job creation and training opportunities, economic growth and protection of the environment. Prior to the dissolution of the 40th Parliament, when Bill 141 died on the Order Paper, debate at Second Reading had concluded and Bill 141 was referred to the Standing Committee on Regulations and Private Bills.
Realty programs
The Province’s programs and services are accommodated in a large portfolio of assets overseen by the Realty Program. Key achievements under the ministry’s realty program include:
- right-sizing of the realty portfolio and generation of $51.6 million net revenue in 2013/14 and approximately $342 million cumulative net revenue since 2007/08, through realty sales
- Toronto Accommodation Plan completion of site servicing for the new Forensic Services and Coroner’s Complex and the new Humber River Hospital in Downsview (Wilson Avenue and Keele Street) and the major office retrofit of buildings at 222 Jarvis and 77 Grenville Streets in Toronto
- continued implementation of the Toronto Waterfront Revitalization Initiative
- continued delivery of the Transmission Corridor Program, which generates revenue towards retiring the stranded debt of the former Ontario Hydro
Realty transformation strategy
The Commission on the Reform of Ontario’s Public Services (the Drummond Report) called for encouraging more efficient use of current space and development of a strategic plan for the Province’s realty portfolio. To that end, a commitment was made in the 2012 Ontario Budget to transform the way government manages its real estate holdings and to reduce the footprint by one million square feet in Toronto and a further 300,000 square feet outside of Toronto. The ministry brought forward a new Realty Directive and realty policies, which took effect April 2013 and establishes a realty policy framework, to support the modernization of Ontario’s realty management practices. The policies enable a more centralized approach to the planning and management of realty, allowing delivery of government-wide priorities through the realty program. It also helps achieve footprint reduction with the adoption of a new space standard of up to 180 rentable square feet per employee.
A comprehensive framework for forfeited corporate property
When a corporation is dissolved and its property is not disposed of before dissolution, the property forfeits to the Crown. The ministry is responsible for most corporate property that forfeits to the Ontario government.
Forfeited property can represent a significant financial, legal and operational liability in the government’s property portfolio. The ministry is leading a multi-ministry effort to create a new framework for the management of forfeited property in Ontario. The framework supports the ministry’s on-going transformation of government realty.
Following public consultation in 2012, the ministry received government policy approval for a forfeited property framework in 2013. Work is underway with partner ministries on proposed changes that, if approved, would achieve a number of outcomes including:
- reducing the number of corporate properties that forfeit to the government of Ontario
- returning forfeited corporate properties to productive use in a timely and efficient manner
- increasing corporate accountability for costs associated with forfeited property
- providing greater transparency and certainty in the management and disposition of forfeited corporate property
Growth planning for the Greater Golden Horseshoe
The Growth Plan for the Greater Golden Horseshoe, 2006, supports Ontario’s investments in infrastructure across the region. By working closely with various development partners and stakeholders, as well as municipalities across the Greater Golden Horseshoe, the ministry works to ensure official plans conform with the Growth Plan. To date, all upper- and single-tier municipalities have adopted official plan amendments and about 66% of lower-tier municipalities have also adopted similar amendments. The remaining municipalities are expected to follow suit soon.
Performance indicators
The ministry introduced proposed Growth Plan Performance Indicators in early 2014. The ministry is consulting stakeholders and other interested individuals on the draft indicators that are intended to measure the implementation of the policies in the Growth Plan. Once established, the performance indicators will help inform the mandated 10-year review of the Growth Plan.
Building on lessons learned in other jurisdictions, the ministry developed 12 proposed indicators, organized around four key themes of the Growth Plan. The proposed indicators are intended to be supplemented with other information and used also with indicators developed for related provincial initiatives. The proposed indicators focus on outcomes rather than process. Where possible, the indicators use data sources available at least every five years and that can be reported across the region.
The ministry released the proposed indicators with two documents, one public facing and one a detailed technical document. As well it has briefed major stakeholders and held four regional workshops in the Greater Golden Horseshoe to seek feedback on the proposed indicators. The ministry is also tracking submissions and will use all feedback to finalize the indicators for fall 2014.
Amendment 2 to the growth plan for the Greater Golden Horseshoe
In June 2013, the Province brought into effect Amendment 2 for the Growth Plan for the Greater Golden Horseshoe, which updates and extends the Growth Plan’s population and employment forecasts to 2041. Forecasts based on 2001 Census data were replaced by figures derived from the 2006 and 2011 Censuses to help communities across the region better plan for growth and development in a sustainable way. The review that led to the amendment started in 2010 and the amendment was developed through extensive consultation with partners from across the Greater Golden Horseshoe.
Implementation fund
In April 2013, the ministry launched the Places to Grow Implementation Fund. The fund supports projects from academic, sector organizations, non-governmental and municipalities that are engaged in the implementation, advancement, evaluation or promotion of policies and goals of the Province’s growth plans. The fund was well received by ministry stakeholders in its initial year, funding 5 of the 19 applications received.
Ministry organization chart as of June 23, 2014
Following the provincial election held in June 2014, the Honourable Brad Duguid became the Minister of Economic Development, Employment and Infrastructure.
- Minister Brad Duguid – Minister of Infrastructure
- Drew Fagan – Deputy Minister
- John Whytock - Director Communications
- Halyna Perun - Director
- Ron Hunter - Assistant Deputy Minister and Chief Information Officer, Central Agencies I & IT Cluster
- Assistant Deputy Minister, Robert Burns – Chief Administrative Officer (CAO) Corporate Services
- Lourdes Valenton – Director, Business & Resource Planning
- Betty Morgan – Director, Service Management
- Assistant Deputy Minister, Chris Giannekos – Infrastructure Policy & Planning
- Gladys Miu – Director, Social Infrastructure & Infrastructure Finance
- Joe Iannace – Director, Economic Infrastructure and Analytics
- Trevor Dauphinee – Director, Capital Planning
- Scott Pegg – Director, Intergovernmental Policy
- Assistant Deputy Minister, Larry Clay – Ontario Growth Secretariat
- Michelle Noble – Director, Partnerships & Consultation
- Adam Redish – Director, Growth Policy Planning & Analysis
- Assistant Deputy Minister, Bruce Singbush – Realty Division
- Maggie Allan – Director, Realty Management
- Mary Bartolomucci – Director, Realty Policy
- Drew Fagan – Deputy Minister
Agencies, boards and commissions
Ontario Infrastructure and Lands Corporation
The Ontario Infrastructure and Lands Corporation (Infrastructure Ontario or IO) is a Crown corporation established under the Ontario Infrastructure and Lands Corporation Act, 2011. Infrastructure Ontario has four business lines that deliver results:
- major projects: Alternative Financing and Procurement projects for the government and other public sector, when directed by the Minister
- real estate management: accommodation services for the Ontario Public Service (OPS) and asset and project management of the ministry’s realty portfolio
- realty planning and development: acquisition, disposition and strategic asset planning and renewal of MOI's realty portfolio
- commercial projects and lending: commercial business transactions that involve Infrastructure Ontario, when directed by the Minister, based on a $50 million threshold and/or major, complex and high risk; and affordable long-term financing to municipalities eligible public sector organizations
Infrastructure Ontario is dedicated to the renewal of the Province’s hospitals, courthouses, and other essential public assets. Ensuring appropriate public control and ownership, Infrastructure Ontario uses Alternative Financing and Procurement to rebuild vital infrastructure, on time and on budget.
Infrastructure Ontario provides Ontario municipalities, universities and other public bodies with access to affordable loans to build and renew public infrastructure.
Infrastructure Ontario also provides management services for the provincially-owned and leased realty portfolio, one of the largest real estate portfolios in Canada. The portfolio includes a wide variety of properties, ranging from detention centres to office space, courthouses and heritage buildings, and land holdings across the Province. Included in the consolidation adjustments are the expense impacts of the General Real Estate Portfolio (GREP) and the Transmission Corridor Program, which Infrastructure Ontario administers for the ministry.
| $M | 2014-15 |
|---|---|
| Operating | 70.4 |
| Capital | 2.5 |
| TOTAL | 72.9 |
Government organizations
The Ministry of Infrastructure has oversight of the Toronto Waterfront Revitalization Corporation (Waterfront Toronto) jointly with the federal government and the City of Toronto. One third of Waterfront Toronto’s finances are consolidated onto the ministry’s books.
Toronto Waterfront Revitalization Corporation
Waterfront Toronto was established by the federal government, the Province of Ontario and the City of Toronto to transform underutilized industrial lands along Toronto’s waterfront into sustainable new communities, promote economic growth in knowledge-based creative industries, create parks and open spaces, and provide continuous waterfront access to the public.
Waterfront Toronto is responsible for developing and implementing a coordinated and comprehensive waterfront vision and in ensuring that the public and private sectors are engaged in revitalization efforts.
| $M | 2014-15 |
|---|---|
| Operating | 12.6 |
| Capital | (2.8) |
| TOTAL | 9.8 |
Detailed financial information
The Ministry of Infrastructure is the central agency responsible for managing infrastructure planning, land use growth management and setting capital priorities - in collaboration with other ministries and in consultation with municipalities, stakeholders and the public. The ministry is also responsible for developing strategic realty policy and effectively managing and deploying significant government-owned realty assets. It is responsible for developing and managing effective asset management policies and programs for land use and accommodation, and for infrastructure financing, including Alternative Financing and Procurement.
The ministry has legislative responsibility for the Infrastructure Ontario. The ministry also has responsibility for Waterfront Toronto, in partnership with the federal government and the City of Toronto.
A top priority is modernizing public infrastructure to support economic prosperity and to help Ontario communities achieve a high quality of life. In summer 2011, the ministry released Building Together, Ontario’s long-term infrastructure plan, which helps to support jobs and economic growth.
The ministry is also responsible for the Places to Grow initiative, and is implementing growth plans in two regions of the province, the Greater Golden Horseshoe and Northern Ontario. The Growth Plan for the Greater Golden Horseshoe, 2006, has been in place for almost a decade, and a top priority going forward will be the 10-year review of this award winning plan.
| Votes/Programs | Estimates 2014-15 | Change from Estimates 2013-14 $ |
Change from Estimates 2013-14 % |
Estimates 2013-14 $ |
Interim Actuals 2013-14 $ |
Actuals 2012-13 $ |
|---|---|---|---|---|---|---|
| Operating and Capital Expenses | ||||||
| Ministry Administration | 2,103,200 | - | - | 2,103,200 | 2,103,200 | 1,296,690 |
| Infrastructure and Growth Planning | 357,324,200 | 110,949,600 | 45.0 | 246,374,600 | 14,193,100 | 11,580,932 |
| Realty Development and Management | 190,278,500 | (53,934,400) | (22.1) | 244,212,900 | 236,391,900 | 285,554,219 |
| Less: special warrants | 79,500,000 | 79,500,000 | - | - | - | - |
| Total Operating and Capital Expense to be Voted | 470,205,900 | (22,484,800) | (4.6) | 492,690,700 | 252,688,200 | 298,431,841 |
| Special warrants | 79,500,000 | 79,500,000 | - | - | - | - |
| Statutory appropriations | 209,014 | - | - | 209,014 | 208,014 | 14,385 |
| Ministry total operating & capital expense | 549,914,914 | 57,015,200 | 11.6 | 492,899,714 | 252,896,214 | 298,446,226 |
| Ontario Infrastructure and Lands Corporation | 72,889,200 | 65,421,200 | 876.0 | 7,468,000 | 63,462,500 | 24,211,000 |
| General real estate portfolio | 795,500 | 38,253,000 | - | (37,457,500) | (20,164,269) | (253,422,410) |
| Transmission corridor program | (12,220,000) | (3,360,000) | - | (8,860,000) | (11,591,000) | (47,000) |
| Toronto waterfront revitalization corporation | 9,874,000 | 12,910,700 | - | (3,036,700) | (2,362,967) | (2,802,475) |
| Total including consolidation & other adjustments | 621,253,614 | 170,240,100 | 37.7 | 451,013,514 | 282,240,478 | 66,385,341 |
| Operating and Capital Assets | ||||||
| Realty Development and Management | 324,801,000 | 313,220,000 | 2,704.6 | 11,581,000 | 5,285,000 | - |
| Total Operating and Capital Assets to be Voted | 324,801,000 | 313,220,000 | 2,704.6 | 11,581,000 | 5,285,000 | - |
| Total ministry assets | 324,801,000 | 313,220,000 | 2,704.6 | 11,581,000 | 5,285,000 | - |
Legislation
The following is a list of the legislation for which the Ministry of Infrastructure has primary legislative or administrative responsibility.
Statutes administered by MOI
- Electricity Act, 1998, S.O. 1998, c. 15, Sched. A and O. Reg. 114/03, s. 0.1
- In respect of the ownership and use of corridor land under Part IX.1 and as described section 0.1 of the regulation.
- Green Energy Act, 2009, S.O. 2009, c. 12, Sched. A
- In respect of section 10 and in respect of subsection 8 (2) which is shared with the Minister of Energy.
- Ministry of Infrastructure Act, 2011, S.O. 2011, c. 9, Sched. 27
- Ontario Infrastructure and Lands Corporation Act, 2011, S.O. 2011, c. 9, Sched. 32
- Places to Grow Act, 2005, S.O. 2005, c. 13
- Toronto Waterfront Revitalization Corporation Act, 2002, S.O. 2002, c. 28
MOI authority under particular sections of statutes/regulations
- Conservation Authorities Act, R.S.O. 1990, c. C. 27, s. 32(2)
- In respect of the powers and duties of the Minister of Infrastructure described in subsection 32(2).
- Education Act, R.S.O. 1990, c. E. 2 and R.R.O. 1990, Reg. 296, ss. 18(k)
- In respect of the powers and duties of the Ministry of Infrastructure described in subsection 18(k).
- Fish and Wildlife Conservation Act, 1997, S.O. 1997, c. 41, s. 81
- In respect of the powers of the Minister of Infrastructure, described in section 81, regarding agreements for the acquisition of land.
- Public Lands Act, R.S.O. 1990, c. P. 43, s. 46
- In respect of powers of the Minister of Infrastructure described in section 46.
- Surveys Act, R.S.O. 1990, c. S. 30, s. 61
- In respect of the powers of the Minister of Infrastructure described in section 61 regarding the installation of survey monuments on lands.
Appendix: annual report 2013-14
2013-14 achievements
In 2013-14, the Ministry of Infrastructure (MOI) made significant progress in meeting three strategic priorities:
- revitalizing public infrastructure
- implementing provincial growth management plans
- effectively managing the Province’s realty
As a result, the ministry is supporting the kind of growth and environmental stewardship that will lead to economic prosperity and sustainable communities for Ontarians, present and future.
Major accomplishments
Infrastructure Planning
The ministry supported Treasury Board in decision-making on capital programs and projects.
On November 26th, 2013 the government introduced Bill 141: the proposed Infrastructure for Jobs and Prosperity Act, 2014. The proposed legislation outlined a series of mechanisms to encourage principled, evidence-based and strategic long-term infrastructure planning. In addition, it included guiding principles to maximize the value of provincial infrastructure investments and promote innovation, competitiveness, and job creation and training. Many of the principles contained in the province’s long-term infrastructure plan, Building Together, released in 2011 were reflected in the proposed legislation.
Prior to the dissolution of the 40th Parliament, debate at Second Reading debate had concluded and Bill 141 was referred to the Standing Committee on Regulations and Private Bills.
Moving Ontario Forward
The ministry worked with the Ministry of Finance and Ministry of Transportation to develop the Moving Ontario Forward strategy, announced in the 2014 Budget, to make nearly $29 billion available for investment over the next 10 years in public transit, transportation infrastructure, and other priority infrastructure projects across the province. The ministry will continue to work with the government and stakeholders to implement this initiative.
Municipal infrastructure strategy
Municipal infrastructure is critical to delivering services to Ontarians. The municipal infrastructure strategy is a long-term policy framework that intends to help municipalities address their critical infrastructure needs. The policy priorities of the strategy include: making asset management planning and public reporting universal, making optimal use of the full range of infrastructure financing tools and addressing the structural challenges that are confronting small municipalities.
The strategy begins by requiring municipalities that request provincial infrastructure funding to show how proposed projects fit within a comprehensive asset management plan. Asset management helps municipalities make smart planning decisions about building, operating, maintaining, renewing and replacing infrastructure over the long-term.
In the 2013 Ontario Budget, the government announced a new $100 million investment to help small and rural municipalities build roads, bridges and other critical infrastructure. It also committed to consult on the components of a potential permanent program for roads, bridges and other critical infrastructure investments in small and rural municipalities for the 2014 Budget.
In the summer of 2013, the Province heard from more than 500 municipal representatives during 10 in-person consultation sessions that were hosted across the Province in addition to a webinar and a drop-in session at the Association of Municipalities of Ontario annual conference. Written submissions were also accepted.
The feedback informed both, the 2013-14 Small, Rural and Northern Municipal Infrastructure Fund which was launched in October 2013 and the new permanent roads and bridges fund which was announced in the 2014 Budget.
Through the Small, Rural and Northern Municipal Infrastructure Fund and the previous Municipal Infrastructure Investment Initiative program, the province is providing nearly $200 million to help municipalities address critical infrastructure projects and prepare asset management plans. This includes over $12 million in asset management funding to help smaller municipalities with the preparation of their asset management plans and over $185 million in capital funding for critical road, bridge, water and wastewater projects.
Federal-provincial infrastructure programs
The federal government announced a new Building Canada Plan (BCP) in its 2013 budget that provides $47 billion over 10 years, to support provincial, territorial and municipal infrastructure. Additional details were also released in February and March 2014. The ministry continues to work with the federal government to operationalize the new federal-provincial programs in Ontario.
Growth plan for the Greater Golden Horseshoe
The Growth Plan for the Greater Golden Horseshoe, 2006, is helping to build strong, sustainable communities that are great places to live, work and play. The Growth Plan directs future growth in a way that supports a robust economy, makes efficient use of infrastructure, and reduces development pressure on important agricultural lands. It sets clear, region-wide standards for growth and development, while giving communities the flexibility they need to address local circumstances.
In 2012, the ministry concluded the first review of the population and employment forecasts in the Growth Plan. Coordinated and consistent population and employment forecasts are a foundation of good growth management. The original forecasts were developed from 2001 Census data, while the review utilized more recent data available from the 2006 and 2011 Censuses. Municipalities in the Greater Golden Horseshoe and stakeholders were consulted throughout the review. The new forecasts are now in place.
Over the past year, ministry staff continued to collaborate with municipalities across the Greater Golden Horseshoe to bring their official plans into conformity with the Growth Plan, addressing conflicts between stakeholders and minimizing potential challenges at the Ontario Municipal Board. To date, all upper and single-tier municipalities have adopted official plan amendments to conform to the Growth Plan. About 66% of lower-tier municipalities have adopted similar amendments, and the Province expects the rest to follow suit soon.
Growth plan for Northern Ontario
Since 2007, the ministry has worked closely with inter-ministerial partners, northern communities, stakeholders and First Nations and Métis communities to develop the Growth Plan for Northern Ontario, 2011. This Plan will help guide decision-making and investments in the North over the next 25 years. It aims to strengthen Northern Ontario by:
- diversifying the region’s traditional resource-based industries to stimulate investment and entrepreneurship
- providing education, training and career opportunities in priority economic areas
- ensuring communities are well positioned to attract people and investment
Three significant implementation initiatives are already underway or complete:
- development of a northern multi-modal transportation strategy expected to be completed by 2016
- establishment of a Northern Policy Institute in August 2012
- hosted a Forum For Northern Leaders in December 2013 to initiate collaboration on further Growth Plan implementation work
Realty transformation strategy
In March 2012, the ministry announced plans to modernize the way it manages its office space across the Province to save money and free up resources. Through the plan, the Province intends to achieve savings by reducing its office space footprint by shrinking large government office space, and reducing the amount of leased space.
The ministry is working with Infrastructure Ontario to implement the plan, using the most modern financing and procurement methods to achieve savings. A commitment was made in the 2012 Ontario Budget to transform the way government manages its real estate holdings and to reduce the footprint by net one million square feet in Toronto and a further 300,000 square feet outside of Toronto. At the end of 2013/14, 32% of the target has been achieved in Toronto and 40% of the target has been achieved outside of Toronto.
Other major accomplishments under the ministry’s realty program include:
- implementation of the Realty Portfolio Plan, focusing on generating net revenue and reducing long-term costs and liabilities associated with the MOI-controlled real estate portfolio over the three year period 2013/14 to 2015/16 ($24M in 2013/14, $30M in 2014/15, and $25M in 2015/16) and a liability/cost reduction of $1.5M over the three years.
- Toronto Accommodation Plan completion of site servicing for the new Forensic Services and Coroner’s Complex and the new Humber River Hospital in Downsview (Wilson Avenue and Keele Street) and the major office retrofit of buildings at 222 Jarvis and 77 Grenville Streets in Toronto
- continued implementation of the Toronto Waterfront Revitalization Initiative
- continued delivery of the Transmission Corridor Program, which generates revenue towards retiring the hydro stranded debt
| Operating | 75.8 |
|---|---|
| Capital | 177.1 |
| Staff strength ** (as of March 31, 2014) | 132 |
Part 2: detailed financials 2014-15
Ministry summary information
The Ministry of Infrastructure is the central agency responsible for managing infrastructure planning, land use growth management and setting capital priorities - in collaboration with other ministries and in consultation with municipalities, stakeholders and the public. The ministry is also responsible for developing strategic realty policy and effectively managing and deploying significant government-owned realty assets. It is responsible for developing and managing effective asset management policies and programs for land use and accommodation, and for infrastructure financing, including alternative financing and procurement.
The ministry has legislative responsibility for the Ontario Infrastructure and Lands Corporation. The ministry also has responsibility for Waterfront Toronto, in partnership with the federal government and the City of Toronto.
A top priority is modernizing public infrastructure to support economic prosperity and to help Ontario communities achieve a high quality of life. In summer 2011, the ministry released Building Together, Ontario’s long-term infrastructure plan, which helps to create and preserve jobs, and supports economic growth.
The ministry is also responsible for the Places to Grow initiative, and is implementing growth plans in two regions of the Province, the Greater Golden Horseshoe and Northern Ontario. The Growth Plan for the Greater Golden Horseshoe, 2006, has been in place for almost a decade, and a top priority going forward will be the 10-year review of this award winning plan.
| Votes/Programs | Estimates 2014-15 $ |
Change from Estimates 2013-14 $ |
% | Estimates 2013-14 $ |
Interim Actuals 2013-14* $ |
Actuals 2012-13 $ |
|---|---|---|---|---|---|---|
| Operating expense | ||||||
| Ministry administration | 2,103,200 | - | - | 2,103,200 | 2,103,200 | 1,296,690 |
| Infrastructure and Growth Planning | 15,155,500 | 61,400 | 0.4 | 15,094,100 | 13,694,100 | 11,580,872 |
| Realty Development and Management | 64,032,600 | 5,040,500 | 8.5 | 58,992,100 | 59,772,100 | 66,804,746 |
| Less: special warrants | 24,700,000 | 24,700,000 | - | - | - | - |
| Total Operating Expense to be Voted | 56,591,300 | (19,598,100) | (25.7) | 76,189,400 | 75,569,400 | 79,682,308 |
| Special warrants | 24,700,000 | 24,700,000 | - | - | - | - |
| Statutory appropriations | 208,014 | - | - | 208,014 | 208,014 | 14,385 |
| Ministry total operating expense | 81,499,314 | 5,101,900) | 6.7 | 76,397,414 | 75,777,414 | 79,696,693 |
| Consolidation Adjustment - Ontario Infrastructure and Lands Corporation | 70,418,200 | 65,307,200 | 1,277.8 | 5,111,000 | 61,531,500 | 22,278,000 |
| Consolidation adjustment - general real estate portfolio | (9,120,500) | 22,626,300 | - | (31,746,800) | (26,918,114) | 150,556,151 |
| Consolidation adjustment - transmission corridor program | (12,220,000) | (3,360,000) | - | (8,860,000) | (11,591,000) | (47,000) |
| Consolidation adjustment - toronto waterfront revitalization corporation | 12,630,700 | (3,769,300) | (23.0) | 16,400,000 | 16,693,700 | 16,766,333 |
| Total Including Consolidation and other Adjustments | 143,207,714 | 85,906,100 | 149.9 | 57,301,614 | 115,493,500 | 269,250,177 |
| Capital expense | ||||||
| Infrastructure and growth planning | 342,168,700 | 110,888,200 | 47.9 | 231,280,500 | 499,000 | 60 |
| Realty Development and Management | 126,245,900 | (58,974,900) | (31.8) | 185,220,800 | 176,619,800 | 218,749,473 |
| Less: special warrants | 54,800,000 | 54,800,000 | - | - | - | - |
| Total Capital Expense to be Voted | 413,614,600 | (2,886,700) | 0.7 | 416,501,300 | 177,118,800 | 218,749,533 |
| Special warrants | 54,800,000 | 54,800,000 | - | - | - | - |
| Statutory appropriations | 1,000 | - | - | 1,000 | - | - |
| Ministry total capital expense | 468,415,600 | 51,913,300 | 12.5 | 416,502,300 | 177,118,800 | 218,749,533 |
| Consolidation Adjustment - Ontario Infrastructure and Lands Corporation | 2,471,000 | 114,000 | 4.8 | 2,357,000 | 1,931,000 | 1,933,000 |
| Consolidation adjustment - general real estate portfolio | 9,916,000 | 15,626,700 | - | (5,710,700) | 6,753,845 | (403,978,561) |
| Consolidation adjustment - toronto waterfront revitalization corporation | (2,756,700) | 16,680,000 | - | (19,436,700) | (19,056,667) | (19,568,808) |
| Total Including Consolidation and Other Adjustments | 478,045,900 | 84,334,000 | 21.4 | 393,711,900 | 166,746,978 | (202,864,836) |
| Capital assets Realty development and management |
324,801,000 | 313,220,000 | 2,704.6 | 11,581,000 | 5,285,000 | - |
| Less: special warrants | 2,000,000 | 2,000,000 | - | - | - | - |
| Total Capital Assets to be Voted | 322,801,000 | 311,220,000 | 2,687.3 | 11,581,000 | 5,285,000 | - |
| Special warrants | 2,000,000 | 2,000,000 | - | - | - | - |
| Ministry total capital assets | 324,801,000 | 313,220,000 | 2,704.6 | 11,581,000 | 5,285,000 | 5,542,341 |
| Ministry Total Operating and Capital including Consolidation and other Adjustments (not including Assets) | 621,253,614 | 170,240,100 | 37.7 | 451,013,514 | 282,240,478 | 66,385,341 |
* Interim actuals reflect the numbers presented in the 2014 Ontario Budget.
| Standard Account $ |
4001 Ministry Administration Program $ |
4003 Infrastructure and Growth Planning $ |
4004 Realty Development and Management $ | Total Ministry $ |
Total Ministry %** |
|---|---|---|---|---|---|
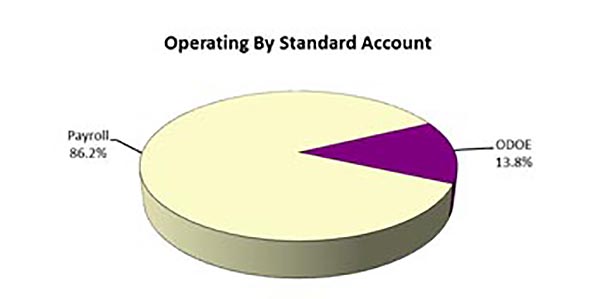
| Operating Expense Salaries and Wages* | 1,670,914 | 9,105,300 | 3,204,800 | 13,981,014 | 17.2 |
| Employee benefits | 197,900 | 1,205,700 | 451,700 | 1,855,300 | 2.3 |
| Transportation and Communications | 52,000 | 307,000 | 52,300 | 411,300 | 0.5 |
| Services | 203,500 | 4,086,600 | 56,741,100 | 61,031,200 | 74.9 |
| Supplies and Equipment | 42,900 | 249,900 | 57,700 | 350,500 | 0.4 |
| Transfer payments | - | 201,000 | 1,820,000 | 2,021,000 | 2.5 |
| Other transactions* | - | - | 3,669,000 | 3,669,000 | 4.5 |
| Recoveries | - | - | (1,820,000) | (1,820,000) | (2.2) |
| Total | 2,167,214 | 15,155,500 | 64,176,600 | 81,499,314 | 100.0 |
| Percent of total ministry | 2.7 | 18.6 | 78.7 | 100.0 | - |
* Including Statutory Appropriations
** Percentages may not sum due to rounding
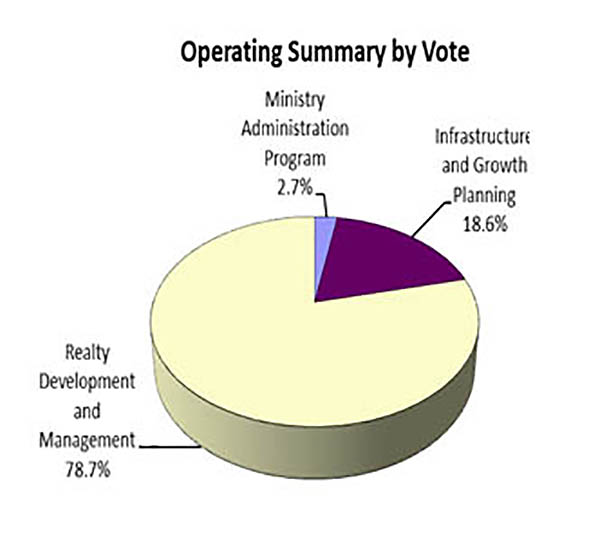
The operating summary by vote pie chart.
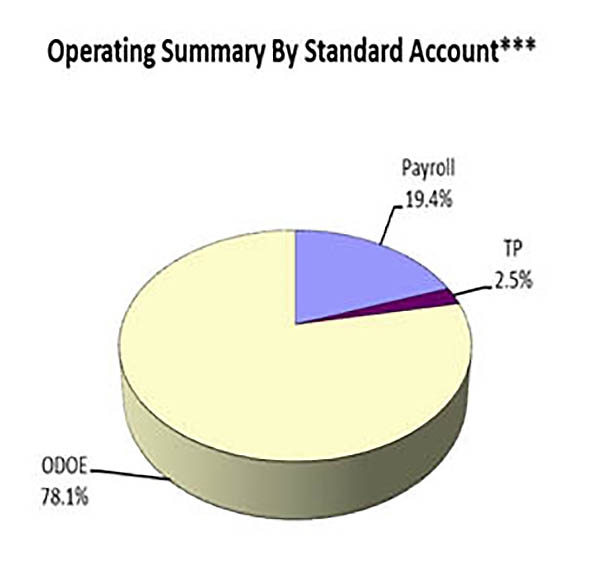
The operating summary by standard account pie chart.
| Standard Account $ |
4003 Infrastructure and Growth Planning $ |
4004 Realty Development and Management $ | Total Ministry $ |
Total Ministry % |
|---|---|---|---|---|
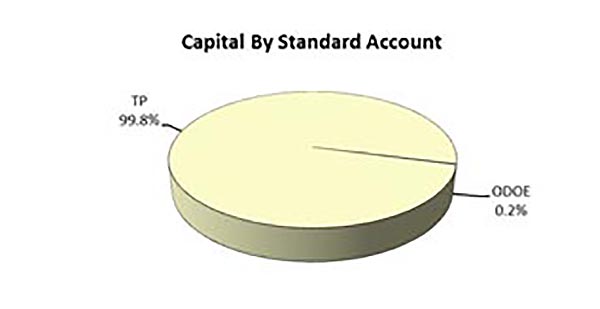
| Capital expense services | 499,000 | 92,678,000 | 93,177,000 | 19.9 |
| Transfer payments | 241,669,700 | 33,566,900 | 275,236,600 | 58.8 |
| Other transactions* | 100,000,000 | 2,000 | 100,002,000 | 21.3 |
| Total | 342,168,700 | 126,246,900 | 468,415,600 | 100.0 |
| Percent of total ministry | 73 | 27 | 100 | - |
| Capital assetsland | - | 7,800,000 | 7,800,000 | 2.4 |
| Buildings | - | 317,000,000 | 317,000,000 | 97.6 |
| Land and Marine Fleet | - | 1000 | 1000 | 0.0 |
| Total | - | 324,801,000 | 324,801,000 | 100.0 |
| Percent of total ministry | - | 100 | 100 | - |
*Including Statutory Appropriations
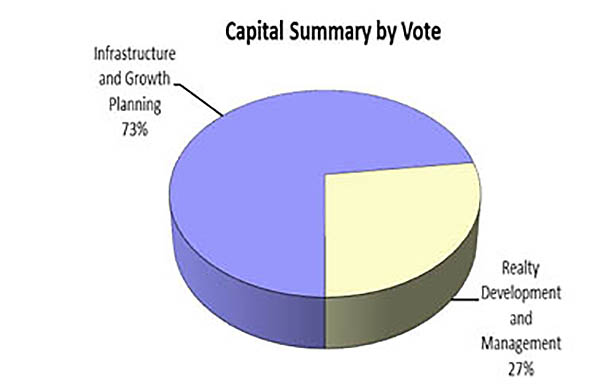
Capital summary by vote pie chart.
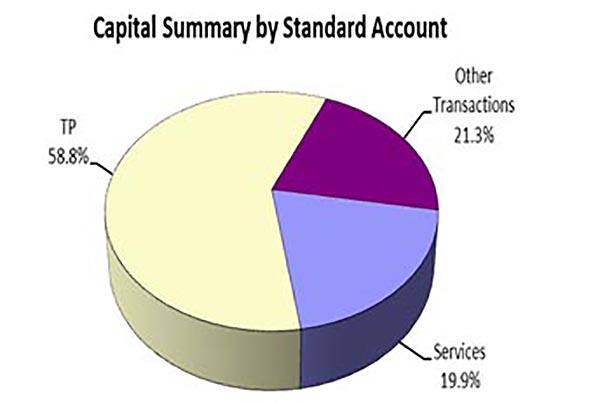
Capital summary by standard account pie chart
4001 - ministry administration
Vote summary information– ministry administration
This program includes the Minister’s Office, Parliamentary Assistant’s Office and Deputy Minister’s Office. The program is responsible for overall direction and corporate leadership of the ministry and internal administration. Other ministry administrative services are provided by the Ministry of Energy.
| Vote/Program | Estimates 2014-15 $ |
Change from 2013-14 Estimates $ | % | Estimates 2013-14 $ |
Interim Actuals 2013-14* $ |
Actuals 2012-13 $ |
|---|---|---|---|---|---|---|
| Operating expense ministry administration |
2,103,200 | - | - | 2,103,200 | 2,103,200 | 1,296,690 |
| Total including special warrants | 2,103,200 | - | - | 2,103,200 | 2,103,200 | 1,296,690 |
| Less: special warrants | 963,500 | 963,500 | - | - | - | - |
| Total Operating Expense to be Voted | 1,139,700 | (963,500) | (45.8) | 2,103,200 | 2,103,200 | 1,296,690 |
| Special warrants | 963,500 | 963,500 | - | - | - | - |
| Minister’s Salary, the Executive Council Act | 47,841 | - | - | 47,841 | 47,841 | - |
| Parliamentary Assistant’s Salary, the Executive Council Act | 16,173 | - | - | 16,173 | 16,173 | 14,385 |
| Total statutory appropriations | 64,014 | - | - | 64,014 | 64,014 | 14,385 |
| Total operating expense | 2,167,214 | - | - | 2,167,214 | 2,167,214 | 1,311,075 |
* Interim actuals reflect the numbers presented in the 2014 Ontario Budget.
Item summary information
Ministry administration
Vote/Item: 4001-01
Vote: Ministry Administration
Item: Ministry Administration
Type: Operating Expense
Item/Sub-Item description:
This program includes the Minister’s Office, Parliamentary Assistant’s Office and Deputy Minister’s Office. The program is responsible for overall direction and corporate leadership of the ministry and internal administration. Other ministry administrative services are provided by the Ministry of Energy.
| Standard Account | Estimates 2014-15 $ |
Change from 2013-14 Estimates $ |
% | Estimates 2013-14 $ |
Interim Actuals 2013-14 ** $ |
Actuals 2012-13 $ |
|---|---|---|---|---|---|---|
| Salaries and Wages* | 1,670,914 | - | - | 1,670,914 | 1,670,914 | 1,140,714 |
| Employee benefits | 197,900 | - | - | 197,900 | 197,900 | 104,243 |
| Transportation and Communications | 52,000 | - | - | 52,000 | 52,000 | 30,477 |
| Services | 203,500 | - | - | 203,500 | 203,500 | 27,378 |
| Supplies and Equipment | 42,900 | - | - | 42,900 | 42,900 | 8,263 |
| Total | 2,167,214 | - | - | 2,167,214 | 2,167,214 | 1,311,075 |
* Including Statutory Appropriations
**Interim actuals reflect the numbers presented in the 2014 Ontario Budget.
Operating by standard account – ministry administration pie chart
4003 - Infrastructure and growth planning
Vote summary information – infrastructure and growth planning
The infrastructure program supports the development and implementation of sound infrastructure strategies for the Province, including: central agency management of the provincial infrastructure planning process and capital budget development; implementation of the long-term infrastructure plan; development of horizontal and sectoral infrastructure policy and program proposals; negotiation with the federal government on new cost-shared infrastructure programs; coordination of infrastructure program implementation, including programs to support municipal infrastructure; development and implementation of a government asset management framework; infrastructure economics and financial analysis and advice; and information management for infrastructure investments.
The growth-planning program leads the development and implementation of the government’s growth management policy. This includes working with local governments, stakeholders, and the broader public as well as facilitating the alignment of multi-ministry government policy to support implementation, particularly in the fast-growing Greater Golden Horseshoe.
| Vote/Program | Estimates 2014-15 $ |
Change from 2013-14 Estimates $ |
% | Estimates 2013-14 $ |
Interim Actuals 2013-14* $ |
Actuals 2012-13 $ |
|---|---|---|---|---|---|---|
| Operating expense | ||||||
| Infrastructure and growth policy and programs | 15,155,500 | 61,400 | 0.4 | 15,094,100 | 13,694,100 | 11,580,872 |
| Total including special warrants | 15,155,500 | 61,400 | 0.4 | 15,094,100 | 13,694,100 | 11,580,872 |
| Less: special warrants | 3,714,500 | 3,714,500 | - | - | - | - |
| Total Operating Expense to be Voted | 11,441,000 | (3,653,100) | (24.2) | 15,094,100 | 13,694,100 | 11,580,872 |
| Special warrants | 3,714,500 | 3,714,500 | - | - | - | - |
| Total operating expense | 15,155,500 | 61,400 | 0.4 | 15,094,100 | 13,694,100 | 11,580,872 |
| Capital expense | ||||||
| Infrastructure programs | 242,168,700 | 110,888,200 | 84.5 | 131,280,500 | 499,000 | 60 |
| Capital Contingency fund | 100,000,000 | - | - | 100,000,000 | - | - |
| Total capital Expense to be voted | 342,168,700 | 110,888,200 | 47.9 | 231,280,500 | 499,000 | 60 |
| Ministry total capital expense | 342,168,700 | 110,888,200 | 47.9 | 231,280,500 | 499,000 | 60 |
*Interim actuals reflect the numbers presented in the 2014 Ontario Budget.
C1: Item summary information
Infrastructure and growth policy and programs
Vote/item: 4003-01
Vote: Infrastructure and Growth Planning
Item: Infrastructure and Growth Policy and Programs
Type: Operating Expense
Item/sub-item description:
The ministry takes a strategic approach to infrastructure planning and growth management.
The Infrastructure Policy and Planning Division develops and coordinates the implementation of sound infrastructure strategies for the Government of Ontario, including:
- Serving a central agency function to support Treasury Board in decision-making on capital programs and projects.
- Developing inter-governmental infrastructure programs in partnership with federal and municipal governments.
- Developing policy for the government’s Alternative Financing and Procurement model for infrastructure procurement.
- Conducting economic and financial analysis.
The Ontario Growth Secretariat (OGS) leads implementation of the Places to Grow initiative that supports the Government’s Strong Communities agenda. Implementation of the Growth Plan for the Greater Golden Horseshoe, 2006, and the Growth Plan for Northern Ontario, 2011 is underway. The division does this work by integrating growth policy and planning with the corporate capital planning process, provincial land use and resource policy, and other provincial policies and legislation. In addition, OGS provides land use planning analysis and technical research, geospatial analysis and growth monitoring systems. The division builds awareness and acceptance of key growth planning principles, develops and maintains strong relationships with key stakeholders. It also disseminates information and facilitates constructive feedback on Places to Grow materials, and supports engagement and consultation with Aboriginal Communities. OGS also provides expertise on urban form and design.
Comparative details
| Standard Account | Estimates 2014-15 $ |
Change from 2013-14 Estimates $ |
% | Estimates 2013-14 $ |
Interim Actuals 2013-14 * $ |
Actuals 2012-13 $ |
|---|---|---|---|---|---|---|
| Salaries and Wages | 9,105,300 | - | - | 9,105,300 | 9,105,300 | 7,617,856 |
| Employee Benefits | 1,205,700 | - | - | 1,205,700 | 1,205,700 | 1,043,390 |
| Transportation and Communications | 307,000 | - | - | 307,000 | 307,000 | 128,109 |
| Services | 4,086,600 | 60,400 | 1.5 | 4,026,200 | 2,626,200 | 2,734,628 |
| Supplies and Equipment | 249,900 | - | - | 249,900 | 249,900 | 56,889 |
| Transfer Payments | ||||||
| Growth Fund | 200,000 | - | - | 200,000 | 200,000 | - |
| Infrastructure Fund | 1,000 | 1,000 | - | - | - | - |
| Total | 15,155,500 | 61,400 | 0.4 | 15,094,100 | 13,694,100 | 11,580,872 |
*Interim Actuals reflect the numbers presented in the 2014 Ontario Budget.
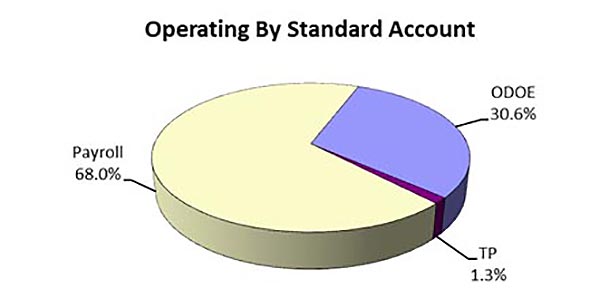
Operating by standard account – infrastructure and growth pie chart
Figures may not sum due to rounding.
Explanation for change from 2013-14 estimates ($) : net increase in funding (inter-ministry transfer for the IT funding model) - 61,400
Infrastructure programs
Vote/item: 4003-02
Vote: Infrastructure and Growth Planning
Item: Infrastructure Programs
Type: Capital Expense
Item/sub-item description:
The ministry has lead responsibility for negotiating infrastructure agreements with the federal government and developing programs to support municipal infrastructure, working with provincial ministries responsible for implementing infrastructure partnership programs. These programs, which include the new Building Canada Plan (2014-2024), and the proposed permanent program for municipal infrastructure, provide strategic investment in infrastructure renewal projects throughout the Province.
Municipal programs
The ministry launched the Municipal Infrastructure Strategy in August 2012 to improve asset management practices in order to allow a more strategic approach to how municipal infrastructure priorities are set and how the Province considers requests for funding. The strategy begins by requiring municipalities that request provincial infrastructure funding to show how projects fit within a comprehensive asset management plan. Asset management planning establishes clear priorities, focuses on the most critical needs and makes the best use of resources.
Through the Small, Rural and Northern Municipal Infrastructure Fund and the previous Municipal Infrastructure Investment Initiative program, the Province is providing nearly $200 million to help municipalities address critical infrastructure projects and prepare asset management plans. This includes over $12 million in asset management funding to help smaller municipalities with the preparation of their asset management plans and over $185 million in capital funding for critical road, bridge, water and wastewater projects.
Federal-provincial programs
The ministry will work with the federal government to implement the new Building Canada Plan in Ontario.
Economic and financial analysis
The ministry conducts research related to maximizing the benefit of infrastructure investments and asset management. The development of infrastructure asset management expertise and robust research into how to best allocate scarce resources over the capital plan will help the government manage its existing infrastructure assets effectively over the long-term and will enable it to decide when and how much to invest in renewing existing infrastructure assets or expanding when needed.
Comparative details
| Standard Account | Estimates 2014-15 $ |
Change from 2013-14 Estimates $ |
% | Estimates 2013-14 $ |
Interim Actuals 2013-14 * $ |
Actuals 2012-13 $ |
|---|---|---|---|---|---|---|
| Services | 499,000 | (1,500,000) | (75) | 1,999,000 | 499,000 | 60 |
| Transfer payments | ||||||
| Federal – provincial infrastructure programs | 96,666,700 | 99,665,700 | - | 1,000 | - | - |
| Federal – provincial infrastructure – federal contributions | 145,000,000 | 144,999,000 | - | 1,000 | - | - |
| Municipal infrastructure initiative | 1,000 | (29,277,500) | (100) | 29,278,500 | - | - |
| Municipal infrastructure | 1,000 | (99,999,000) | (100) | 100,000,000 | - | - |
| Asset management | 1,000 | - | - | 1,000 | - | - |
| Total | 242,168,700 | 110,888,200 | 84 | 131,280,500 | 499,000 | 60 |
*Interim actuals reflect the numbers presented in the 2014 Ontario Budget.
Capital by standard account pie chart.
| Planned increase from previous results based plan approval (Municipal Infrastructure Initiative) | 17,857,800 |
|---|---|
| Inter-ministry transfer - Municipal Infrastructure Initiative funding | (47,135,300) |
| Inter-ministry transfer - Municipal Infrastructure Funding to the Ministry of Rural Affairs | (99,999,000) |
| Funding increase in Federal-Provincial Infrastructure Programs - Provincial contributions | 96,665,700 |
| Funding increase in Federal-Provincial Infrastructure Programs - Federal contributions | 144,999,000 |
| Planned decrease from previous RbP approval (Asset Management) | (1,500,000) |
| Total | 110,888,200 |
Capital contingency fund
Vote/item: 4003-03
Vote: Infrastructure and growth planning
Item: Capital contingency fund
Type: Capital expense
Item/sub-item description:
The fiscal plan includes a Capital Contingency Fund to help mitigate expense risks that may otherwise have a negative impact on results. The Capital Contingency Fund will only be used to fund ministries' pressures in cases where health and safety might be compromised or services to the most vulnerable are jeopardized. During the fiscal year, Treasury Board / Management Board of Cabinet releases funding from the Capital Contingency Fund to individual ministries after a thorough justification of costs.
Examples of costs covered by the Capital Contingency Fund include:
- natural disaster recovery costs such as the cost of flood repairs to government-owned buildings
- unanticipated expenses such as the cost of emergency highway or bridge repairs
Comparative details
| Standard Account | Estimates 2014-15 $ |
Change from 2013-14 Estimates $ |
% | Estimates 2013-14 $ |
Interim Actuals 2013-14 * $ |
Actuals 2012-13 $ |
|---|---|---|---|---|---|---|
| Other transactions | 100,000,000 | - | - | 100,000,000 | - | - |
| Total | 100,000,000 | - | - | 100,000,000 | - | - |
*Interim actuals reflect the numbers presented in the 2014 Ontario Budget.
Explanation for change from 2013-14 estimates ($) - No change
4004 - Realty development and management
Vote summary information – realty development and management
This program has integrated responsibility for strategic planning, policy development and management of a realty portfolio encompassing approximately one million acres of land and thousands of buildings and structures held throughout Ontario. It also has the responsibility for acquisition, disposition and use of realty assets as well as governance and oversight of its delivery agent, the Ontario Infrastructure and Lands Corporation. In this role, the program provides expert real estate advice and service to support Ontario’s policy and program objectives in addition to working with Ontario ministries and agencies to support their land use, property management and accommodation needs. Today, the program is achieving a number of Ontario’s environmental and policy objectives through its effective management of realty assets, value optimization of existing realty assets, and the provision of adequate and appropriate workspace for Ontario Public Servants. The program also includes management of corporate forfeited property to reduce potential liabilities for the government. In addition, this program has responsibility for oversight of Waterfront Toronto, a non-share capital corporation created by the three orders of government (the City of Toronto, the Provincial Government of Ontario and the Federal Government of Canada) to oversee the revitalization of Toronto’s waterfront.
| Vote/Program | Estimates 2014-15 $ |
Change from 2013-14 Estimates $ |
% | Estimates 2013-14 $ |
Interim Actuals 2013-14* $ |
Actuals 2012-13 $ |
|---|---|---|---|---|---|---|
| OPERATING EXPENSE Realty Programs | 64,032,600 | 5,040,500 | 8.5 | 58,992,100 | 59,772,100 | 66,804,746 |
| Total Including Special Warrants | 64,032,600 | 5,040,500 | 8.5 | 58,992,100 | 59,772,100 | 66,804,746 |
| Less: Special Warrants | 20,022,000 | 20,022,000 | - | - | - | - |
| Total Operating Expense to be Voted | 44,010,600 | (14,981,500) | (25.4) | 58,992,100 | 59,772,100 | 66,804,746 |
| Special Warrants | 20,022,000 | 20,022,000 | - | - | - | - |
| Bad Debt Expense, the Financial Administration Act | 144,000 | - | - | 144,000 | 144,000 | - |
| Total Statutory Appropriations | 144,000 | - | - | 144,000 | 144,000 | - |
| Total Operating Expense | 64,176,600 | 5,040,500 | 8.5 | 59,136,100 | 59,916,100 | 66,804,746 |
*Interim actuals reflect the numbers presented in the 2014 Ontario Budget.
| Vote/Program | Estimates 2014-15 $ |
Change from 2013-14 Estimates $ | % | Estimates 2013-14 $ |
Interim Actuals 2013-14* $ |
Actuals 2012-13 $ |
|---|---|---|---|---|---|---|
| CAPITAL EXPENSE | ||||||
| Realty Programs | 126,244,900 | (58,974,900) | (31.8) | 185,219,800 | 176,619,800 | 218,749,473 |
| Realty Development and Management – Expense related to Capital assets | 1,000 | - | - | 1,000 | - | - |
| Total Including Special Warrants | 126,245,900 | (58,974,900) | (31.8) | 185,219,800 | 176,619,800 | 218,749,473 |
| Less: Special Warrants | 54,800,000 | 54,800,000 | - | - | - | - |
| Total Capital Expense to be voted | 71,445,900 | (113,774,900) | (61.4) | 185,220,800 | 176,619,800 | 218,749,473 |
| Special Warrants | 54,800,000 | 54,800,000 | - | - | - | - |
| Amortization Expense, the Financial Administration Act | 1,000 | - | - | 1,000 | - | - |
| Total Statutory Appropriations | 1,000 | - | - | 1,000 | - | - |
| Ministry Total Capital Expense | 126,246,900 | (113,774,900) | (61.4) | 185,221,800 | 176,619,800 | 218,749,473 |
*Interim actuals reflect the numbers presented in the 2014 Ontario Budget.
| Vote/Program | Estimates 2014-15 $ |
Change from 2013-14 Estimates $ |
% | Estimates 2013-14 $ |
Interim Actuals 2013-14* $ |
Actuals 2012-13 $ |
|---|---|---|---|---|---|---|
| CAPITAL ASSETS | ||||||
| Land and marine fleet | 1,000 | - | - | 1,000 | - | - |
| Buildings | 317,000,000 | 317,000,000 | - | - | - | - |
| Land | 7,800,000 | (3,780,000) | (32.6) | 11,580,000 | 5,285,000 | - |
| Total Including Special Warrants | 324,801,000 | 313,220,000 | 2,704.6 | 11,581,000 | 5,285,000 | - |
| Less: Special Warrants | 2,000,000 | 2,000,000 | - | - | - | |
| Total Capital Assets to be Voted | 322,801,000 | 311,220,000 | 2,687.3 | 11,581,000 | 5,265,000 | - |
| Special Warrants | 2,000,000 | 2,000,000 | - | - | - | - |
| Total Capital Assets | 324,801,000 | 313,220,000 | 2,704.6 | 11,581,000 | 5,285,000 | - |
*Interim actuals reflect the numbers presented in the 2014 Ontario Budget.
Item summary information
Realty programs (operating expense)
Vote/item: 4004-01
Vote: Realty development and management
Item: Realty programs
Type: Operating expense
Item/sub-item description:
This program provides operating funding for the Realty Division to identify and execute the strategic policy interests with respect to the ministry’s real estate portfolio. The Realty Division works to ensure that real estate policy and decisions support the broad range of government initiatives and directives. It provides direction and oversight to the Ontario Infrastructure and Lands Corporation (Infrastructure Ontario) and works closely with other ministries to develop policies, frameworks and strategies to support real estate planning and decision-making related to the use of ministry-owned properties and other property and accommodation matters.
The program also provides funding to Infrastructure Ontario for operating expenses related to the management of the real estate portfolio and operating costs associated with the Transmission Corridor Program.
Comparative details
| Standard Account | Estimates 2014-15 $ |
Change from 2013-14 Estimates $ |
% | Estimates 2013-14 $ |
Interim Actuals 2013-14 ** $ |
Actuals 2012-13 $ |
|---|---|---|---|---|---|---|
| Salaries and Wages | 3,204,800 | - | - | 3,204,800 | 3,204,800 | 2,712,045 |
| Employee Benefits | 451,700 | - | - | 451,700 | 451,700 | 267,070 |
| Transportation and Communications | 52,300 | - | - | 52,300 | 52,300 | 37,824 |
| Services | 56,741,100 | 3,835,500 | 7.2 | 52,905,600 | 55,505,600 | 56,432,274 |
| Supplies and Equipment | 57,700 | - | - | 57,700 | 57,700 | 12,312 |
| Transfer Payments | ||||||
| Toronto Waterfront Revitalization | 1,820,000 | - | - | 1,820,000 | - | 7,319,221 |
| Other Transactions* | 3,669,000 | 1,205,000 | 48.9 | 2,464,000 | 2,464,000 | 3,795,700 |
| Recoveries | (1,820,000) | - | - | (1,820,000) | (1,820,000) | (3,771,700) |
| Total | 64,176,600 | 5,040,500 | 8.5 | 59,136,100 | 59,916,100 | 66,804,746 |
*Including Statutory Appropriations
**Interim actuals reflect the numbers presented in the 2014 Ontario Budget.
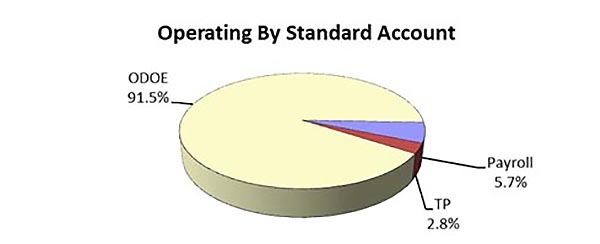
Operating by standard account pie chart
ODOE is net of Recoveries and includes Other Transactions.
| Inter-ministry transfer for the IT funding model | 20,500 |
|---|---|
| Increase in funding to the Transmission Corridor Program with revenue offset | 5,020,000 |
| Total | 5,040,500 |
Realty Programs (Capital Expense)
Vote/Item: 4004-02
Vote: Realty Development and Management
Item: Realty Programs
Type: Capital Expense
Item/Sub-Item Description:
The program provides funding to the Ontario Infrastructure and Lands Corporation (Infrastructure Ontario), which acts as an agent on behalf of the Ministry of Infrastructure as the owner of the properties and other ministries as users of the properties. Work performed on behalf of other ministries is undertaken on a cost recovery basis and funded directly by other ministries independent of this account. Infrastructure Ontario has also been assigned as the project manager for the construction of infrastructure for the Pan/ Parapan American Games Athletes' Village. The program also advances revitalization of Toronto’s waterfront through the Toronto Waterfront Revitalization Corporation (Waterfront Toronto).
The functions of the Realty Services Program (Capital) include:
- Maintaining provincial real property portfolio by repairing government buildings
- Preparing and marketing provincial properties
- Environmental consulting, testing and clean-up of provincial properties
- Acquiring or disposing of properties
- Protecting environmentally significant land within the government portfolio
The repair of government buildings is partially funded from this allocation. About half of the funding available for repairs is derived from rent collected from ministries occupying space in government buildings.
Comparative Details
| Standard Account | Estimates 2014-15 $ |
Change from 2013-14 Estimates $ |
% | Estimates 2013-14 $ |
Interim Actuals 2013-14 ** $ |
Actuals 2012-13 $ |
|---|---|---|---|---|---|---|
| Services | 92,678,000 | (5,110,800) | (5.2) | 97,788,800 | 103,788,800 | 138,302,691 |
| Transfer Payments | ||||||
| Realty Transactions | 629,400 | 628,400 | - | 1,000 | 1,000 | - |
| Toronto Waterfront Revitalization | 23,897,900 | (42,803,700) | (64.2) | 66,701,600 | 56,201,600 | 52,316,059 |
| Pan/Parapan American Games Athletes Village Infrastructure | 9,039,600 | (11,687,800) | (56.4) | 20,727,400 | 16,627,400 | 28,130,723 |
| Other Transactions | - | (1,000) | (100.0) | 1,000 | 1,000 | - |
| Total | 126,244,900 | (58,974,900) | (31.8) | 185,219,800 | 176,619,800 | 218,749,473 |
*Interim actuals reflect the numbers presented in the 2014 Ontario Budget.
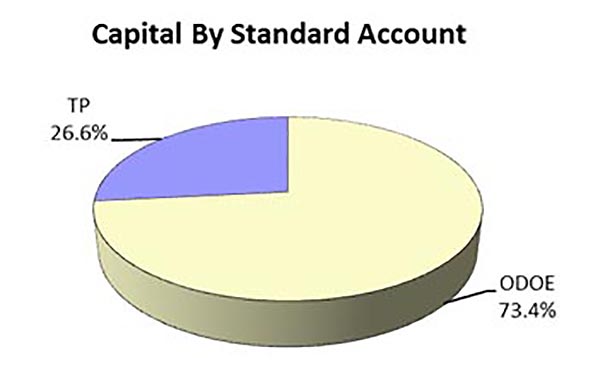
Capital by standard account pie chart
| Net funding reduction to Realty Program | (5,111,800) |
|---|---|
| Nominal Value Land Transfer | 628,400 |
| Net reduction to Toronto Waterfront Revitalization funding | (42,803,700) |
| Net reduction to the Pan/ Parapan American Games Athletes Village Infrastructure | (11,687,800) |
| Total | (58,974,900) |
Expenses Related to Capital Assets
Vote/Item: 4004-03
Vote: Realty Development and Management
Item: Expenses Related to Capital Assets
Type: Capital Expense
Comparative Details
| Standard Account | Estimates 2014-15 $ |
Change from 2013-14 Estimates $ |
% | Estimates 2013-14 $ |
Interim Actuals 2013-14 ** $ |
Actuals 2012-13 $ |
|---|---|---|---|---|---|---|
| Other transactions* | ||||||
| Loss on Asset disposal | 1,000 | - | - | 1,000 | - | - |
| Amortization Expense, the Financial administration Act | 1,000 | - | - | 1,000 | - | - |
| Total | 2,000 | - | - | 2,000 | - | - |
*Including Statutory Appropriations
**Interim actuals reflect the numbers presented in the 2014 Ontario Budget.
Explanation for chame from 2013-14 estimates ($): No change
Tangible Capital Assets
Vote/Item: 4004-04
Vote: Realty Development and Management
Item: Tangible Capital Assets
Type: Capital Assets
Comparative Details
| Standard Account | Estimates 2014-15 $ |
Change from 2013-14 Estimates $ |
% | Estimates 2013-14 $ |
Interim Actuals 2013-14 ** $ |
Actuals 2012-13 $ |
|---|---|---|---|---|---|---|
| Land and marine fleet | 1,000 | - | - | 1,000 | - | - |
| Buildings | 317,000,000 | 317,000,000 | - | - | - | - |
| Land | 7,800,000 | (3,780,000) | (32.6) | 11,580,000 | 5,285,000 | - |
| Total | 324,801,000 | 313,220,000 | 2,704.6 | 11,580,000 | 5,285,000 | - |
*Interim actuals reflect the numbers presented in the 2014 Ontario Budget.
| Investment in land and building for government use | 317,000,000 |
|---|---|
| Planned decrease in project funding - Seaton | (3,780,000) |
| Total | 313,220,000 |