Port Stanley Technical Report
This report talks about the effects of polycyclic aromatic hydrocarbons (PAHs) on the aquatic macroinvertebrate life of Kettle Creek and deliniation of PAHs in the sediments of kettle creek, at Port Stanley, Ontario, in 2009.
Effects of Polycyclic Aromatic Hydrocarbons(PAHs) on the aquatic macroinvertebrate life of Kettle Creek and delineation of PAHs in the sediments of Kettle Creek at Port Stanley, Ontario, in 2009.
Dr. Ronald Griffiths
Ryan Smith
Ministry of the Environment
Southwestern Region
733 Exeter Road
London, Ontario N6E-1L3
« Cette publication hautement spécialisée n’est disponible qu’en anglais en vertu du règlement 441/97, qui en exempte l’application de la Loi sur les services en français. Pour obtenir de l’aide en français, veuillez communiquer avec le ministère de l’Environnement au 519-873-5000. »
June 2010
Executive Summary
In the mid 1980’s, the Ontario Ministry of the Environment (MOE) became aware of PAH contaminated soils on lands owned by Shamrock Chemicals Limited and Ultramar Canada Inc., and in Kettle Creek sediments downstream of the confluence with the outlet of the George Street Drain in Port Stanley, Ontario. Clean-up and containment activities on these two properties in the early 1990s, essentially stopped the discharge of PAHs to Kettle Creek by 1994. With a new focus on Port Stanley as a tourist and recreational centre by the Municipality of Central Elgin, a potential need to dredge the river for flood control of upstream lands by the Conservation Authority, and identification of PAH sediment contamination in lower Kettle Creek by the Kettle Creek Source Protection Committee, a review of the PAH situation in Kettle Creek resulting from discharges from the George Street Drain in Port Stanley was initiated in 2009. Consequently, this study: a) examined the aquatic macroinvertebrate life (e.g. worms, crustaceans, insects) in Kettle Creek to assess whether PAH concentrations in the sediments are having a negative biological effect and to assess current overall water quality conditions, and b) delineated the horizontal and vertical distribution of PAHs in the sediments of Kettle Creek and the George Street Drain. Results of the 2009 study were compared with those from 1987 prior to any clean-up activities.
Aquatic worms were specifically used to establish environmental-effects thresholds for PAHs as they were judged to be the most sensitive ecosystem health component because: a) they are in continuous physical contact with the sediments throughout their life, b) they ingest sediments to obtain its organic matter for food, c) they lack an exoskeleton that acts as a barrier to surface absorption, and d) they were abundant throughout the study area. In 1987, it was observed that the worm density in surficial sediments with PAH concentrations over 80 µg/g dry weight was significantly depressed compared with that in surficial sediments with PAH concentrations below 35 µg/g. This analysis inferred a minimum toxicity threshold of 80 µg/g and a maximum no-effect threshold of 35 µg/g. A no-effect threshold is defined as the maximum concentration of a compound that causes no measured effect on aquatic life. In 1987, this area of biological impairment (i.e. low worm density) in Kettle Creek extended in a broad diagonal from the outlet of the George Street Drain (source of PAHs) downstream for about 50 m and covered an area of approximately 520 m2.
In contrast, no toxic effect of PAHs on the aquatic worm fauna was observed in either the spring or autumn of 2009. The maximum concentration of total PAHs in these samples was only 21.2 µg/g, an order of magnitude lower than in 1987, and less than the no-effect threshold of 35 µg/g established in 1987. Consequently, no zone of biological impairment existed in Kettle Creek in 2009.
Similarly, an overall improvement in water quality conditions (i.e., lack of toxic conditions, lowered nutrient loadings) was evident in the change in the composition of the whole benthic community (higher abundance, greater number of taxa) from 1987 to 2009. The BioMAP water quality index, which combines the abundance of each aquatic species with a measure of their sensitivity to pollution, quantified this change in the benthic fauna as an 18% improvement in water quality conditions from 1987 to 2009.
Within the main study area, total PAH concentrations in surficial sediments showed a significant decline from a geometric mean of 33.9 µg/g in 1987 to 4.8 µg/g in 2009. In contrast, a significant decline was not measured in total PAH concentrations in the subsurface sediments from 1987 (geometric mean = 34.7 µg/g) to 2009 (geometric mean = 24.3 µg/g), suggesting that the loss and displacement of PAHs from subsurface sediments proceeded at a far slower rate than the surficial sediments.
Sediments within the George Street Drain had the highest total PAH concentrations found in the study area in 2009. Surficial sediments had a PAH concentration of 219 µg/g, an order of magnitude greater than the maximum concentration found in Kettle Creek. Subsurface concentrations increased with depth from 453 µg/g to 1002 µg/g, which were 2 to 5 times that found in Kettle Creek. Meanwhile, only trace (background) concentrations of total PAHs were measured in sediments upstream and downstream of the main study area both in 2009 (maximum of 3.9 µg/g) and 1987 (maximum of 2.4 µg/g).
A simple mixing-type model was formulated to account for the rapid decline of PAHs in surficial sediments since the elimination of PAH discharges to the creek by 1995. This model was based on: a) the continuous deposition of relatively low PAH laden sediment from upstream, b) mixing of surface sediments by biological and physical forces, c) a pool of historic PAHs contained in the subsurface sediments and d) the infrequent displacement of these sediments from this area.
Although sediment-bound PAHs are not currently affecting the aquatic life in Kettle Creek, application of the Canada-Ontario Decision-Making Framework for assessment of Great Lakes contaminated sediment approach would recommend that an area of 325 m2, or a volume of 325 m3 assuming a mean sediment depth of one metre, within and downstream of the George Street Drain be considered for future management.
Introduction
In the late 1940’s, the Dominion Natural Gas Company constructed an oil-gas manufacturing facility at Port Stanley along Carlow Road near Kettle Creek that operated throughout the 1950’s. Oil piped from Port Stanley harbour was “cracked” to produce natural gas that was then piped under pressure to the main gas line near Highway 3. Raw water was pumped from Kettle Creek for use in this process. Polycyclic aromatic hydrocarbons (PAHs), commonly referred to as “oil tar”, were a waste product produced by this process that were deposited into lagoon cells on the property for disposal.
In the mid 1980’s, the Ontario Ministry of the Environment (MOE) became aware of PAH contaminated soils on the historic Dominion Natural Gas Company lands, then owned by Shamrock Chemicals Limited (northern parcel) and Ultramar Canada Inc. (southern parcel), and in Kettle Creek sediments downstream of the confluence with the “new” outlet of the George Street Drain. This municipal drain was constructed to drain waters from the wetlands and springs to the east along George Street to Kettle Creek. As a consequence, it flowed across the southern and eastern limits of the historic Dominion Natural Gas Company property and thus also drained these industrial lands.
Sediment samples collected in 1987 (Canviro 1988) delineated the distribution of PAHs in Kettle Creek, and showed concentrations of PAHs up to 500 µg/g in surficial sediments and up to 2650 µg/g in subsurface sediments. At the same time, Griffiths (1988) showed that total PAH concentrations in the surficial sediments were sufficiently high in places to negatively affect the abundance of aquatic life in Kettle Creek. It is these aquatic organisms that provide a measure water quality conditions in river and lakes. This study documented that total PAH concentrations exceeding 80 µg/g were toxic to aquatic life, whereas no effect was observed at concentrations less than 35 µg/g. The area of biological impairment covered about 520 m2 of Kettle Creek extending downstream from the George Street Drain outlet.
Clean-up activities by MOE on the Shamrock Chemicals property and by Ultramar Canada on their own property were completed by the mid-1990s such that the source of PAHs to Kettle Creek was essentially eliminated. Shortly thereafter a follow-up study was conducted to identify the levels of PAHs in Kettle Creek and George Street Drain (CH2M Gore&Storrie, 1996). This study indicated that PAH concentrations in Kettle Creek immediately downstream of the Drain were dramatically lower compared with 1987, and attributed this decrease to biodegradation and downstream export of sediment-bound (adsorbed) PAHs.
With a new focus on Port Stanley as a tourist and recreational centre by the Municipality of Central Elgin, a potential need to dredge the river for flood control of upstream lands by the Conservation Authority, and identification of PAH sediment contamination in lower Kettle Creek by the Kettle Creek Source Protection Committee, a review of the PAH situation in Kettle Creek resulting from discharges from the George Street Drain in Port Stanley was initiated in 2009. The specific purpose of our study is: a) to examine the aquatic macroinvertebrate life (e.g. worms, crustaceans, insects) in Kettle Creek to assess whether PAH concentrations in the sediments are having a negative biological effect and to assess current overall water quality conditions, and b) to delineate the horizontal and vertical distribution of PAHs in the sediments of Kettle Creek and the George Street Drain. Results of the 2009 study were compared with those from 1987 prior to any clean-up activities.
Methods:
Sediment Sample Collection:
We located 12 of the original 14 metal posts placed into the ground by Canviro Consultants for the 1987 study (Canviro 1988). The missing two posts were surveyed into place. These posts marked the origin (shoreline) of 14 transects across Kettle Creek along which the sampling stations were located. The origin of transect 5 is the present outlet of the George Street Drain.
Core samples of the sediments were collected at 29 stations in the main study area, 4 stations along 2 transects upstream and 2 stations along a single transect downstream of the main study area from June 15 to November 6, 2009 (Figure 1a; Appendix 1).
In wadeable areas (< 1.5 m water depth), sediments were collected with a 2-inch diameter acrylic plastic tube, 30 or 48 inches in length. This core sampler was pushed into the sediments by placing a metal cap with handles over the top of the plastic tube (Figure 2a). Occasionally, sufficient resistance was met to stop penetration; a slide-hammer then was placed over the top of the corer and used to pound the corer into the sediments. Cores were pushed or hammered to reach the underlying blue clay layer, although this was not always possible. At no time could the corer be driven to a depth greater than 1 m. A cap was placed over the top of the tube before the core was pulled from the sediments. A cap was placed over the bottom of the tube when it reached the sediment surface.
In non-wadeable areas (> 1.5 m water depth), sediments were collected by placing 2-inch diameter acrylic plastic tubes, 48 inches in length, with an eggshell retainer, into an aluminum Ogeechee Corer. Metal rods were screwed into the top of the corer and the corer then lowered into the water over the side of an anchored boat.
When placed on the bottom, a slide hammer was screwed onto the metal rod and used to pound the corer into the sediments. When resistance was met, the whole apparatus was pulled out of the sediments and onto the boat. The lower cone of the corer was unscrewed, a cap placed on the plastic tube, the tube removed from the corer and a cap placed over the top of the tube.
The depth of sediment in each core sample was measured and photographed (Figure 3a). The water overlaying the sediments in the core was suctioned off and then the sediment core was extruded along a length of aluminium foil lining a concave plastic stand. Once the core was split open lengthwise, the various stratigraphic layers were identified, photographed and sampled. The surficial sediment layer was typically 3 to 10cm thick, consisting of brown silts that were flocculent (fluid) near the top and firm near the bottom (Figure 3b). The remainder of the core was considered to be subsurface sediments. Only the sediments along the interior of the core were sampled, to prevent contamination from smearing that occurs along the outside of the core. Each sample was placed into an amber jar, capped, labelled and shipped to the Ministry of Environment’s Laboratory in Rexdale for analyses. Observations made during the core sampling are documented in Appendix 2. Total PAH concentrations found at the 2009 sampling stations are documented in Appendix 3. Concentrations of the individual PAH compounds found at various depths at stations in 2009 and 1987 are documented in Appendix 4.
Other Data Collection:
As in 1987, the area of visual and olfactory contamination was documented by walking along transects 3 through 10 within the main study area, up to a water depth of 1.5 m, and at 1m intervals pushing a rod into the sediments as far as possible to determine if a PAH odour or visible sheen was generated (Appendix 5).
To assess changes in the bathymetry of Kettle Creek within the main study area between 2009 and 1987, i.e. identify areas of accretion (sediment deposition) and erosion, the water depth at sampling stations along transects 3 through 10 was measured and compared to those from 1987 after correcting for difference in the Lake Erie water level (minus 36 cm) (Appendix 6).
Benthic Sample Collection:
In the spring (May to June) of 2009, an Ekman grab (Figure 2b), which enclosed an area of 230 cm2, was used to collect a single sample at the same 22 stations sampled in 1987 in the main study area (Figure 1b) to characterize the benthic macroinvertebrate fauna. At the 8 non-wadeable sites, each sample was collected from a canoe. In the autumn (November to December), one sample was collected from the 12 wadeable sites along transects 1 through 9.
The water depth, sediment type and sediment characteristics of each sample were recorded upon collection. The sample was then sieved in a screen pail containing a No. 30 (U.S. Standard Sieve Series) mesh screen (aperture 0.60 mm). The macroinvertebrates and debris retained in the pail were placed into a labelled widemouth jar. Later that same day, the samples were poured into white enamel trays and the animals removed from the debris and placed in 30 ml bottles filled with 80% ethanol.
Identification of Macroinvertebrates:
The benthic macroinvertebrates (Figure 4) were identified to the lowest possible taxonomical level using current taxonomy keys and references (Appendices 7, 8, 9). All organisms were identified in each sample except aquatic worms when a large number of individuals were present. In these samples, all worms that could be identified under a low-power microscope e.g. Potamothrix moldaviensis, and Branchiura sowerbyi, etc., were enumerated and removed from the sample. The remaining individuals were sorted into two groups: hair chaete present and hair chaete absent. A random sample of not less than 20% of the individuals from each group, up to a maximum of 100 individuals, was removed from each group for identification. Worms were mounted on glass slides in a clearing medium, left for 24 h, and then identified using a high-power microscope.
Data Analysis:
As in the 1987 study (Griffiths 1988), a discontinuity in worm density over the range of sediment PAH concentrations was assessed by ranking the samples in order of total PAH concentration and then graphing the 3-sample and 5-sample moving average of worm density against its variance starting at the lowest PAH concentration and moving higher and starting at highest PAH concentrations and moving lower. Rapid changes in consecutive averages indicates a breakpoint or discontinuity in the data at that PAH concentration.
Aquatic worms were specifically used to establish environmental-effects thresholds for PAHs as they were judged to be the most sensitive ecosystem health component because they are in continuous physical contact with the sediments throughout their life, they ingest sediments to obtain its organic matter for food, and they lack an exoskeleton that acts as a barrier to surface absorption. In addition, their habitat corresponds with the depth of the surficial sediments sampled, i.e. upper brown silty layer of sediments, and they were abundant throughout the study area.
In addition, the change in overall water quality conditions in the study area between 1987 and 2009 was assessed by analyzing the composition of the benthic fauna in each year and quantitatively by using the BioMAP water quality index (Griffiths 1999, 1996), which integrates all benthic macroinvertebrate information into a single value by combining the abundance of each aquatic species with a measure of their sensitivity to pollution. For this analysis, benthic data from the wadeable sites along transects 1 to 9 were used as these sites were sampled in 1987 and in spring and autumn of 2009. However, only the 10 sites with surficial sediments consisting of brown silts were used for the comparison so that differences in habitat composition (silts vs. gravels) did not affect the analysis.
All statistical analyses were preformed using the software package Systat 13.
Results and Discussion:
Environmental Effects Thresholds:
A discontinuity in worm abundance was evident in 1987 (Figure 5) inferring a toxic threshold to PAHs. Surficial sediments containing PAH concentrations less than 35 µg/g dry weight had a mean density of 190 individuals per 230 cm2, whereas nearby sediments containing PAH concentrations ranging from 80 to 500 µg/g dry weight had only 21 individuals per 230 cm2, a significantly lower density (ln-transformed values, two-sample t-test; p < 0.05). The density of worms at these latter sites was likely maintained by continuous immigration of worms from nearby areas and drift from upstream coupled with a short survival time before death. The area of biological impairment in Kettle Creek, i.e. low worm density, extended in a broad diagonal from the outlet of the George Street Drain (source of PAHs) downstream to station 9-24, covering an area of approximately 520 m2 (Figure 6).
In contrast, no toxic effect of PAHs on the aquatic worm fauna was observed in either the spring or autumn of 2009 (Figure 5). Worm densities were similar across all sediment PAH concentrations measured in both the spring and autumn of 2009. The lack of response was attributed to the absence of total PAH concentrations above 80µg/g. In fact, total PAH concentrations in the surficial sediments did not exceed 21.2 µg/g. The lower mean density of worms in the spring (32 per 230 cm2) compared with the autumn (106 per 230 cm2) is a seasonal effect related to hatching of eggs over the summer that results in more juvenile worms in the autumn. These data, therefore, support the no-effect threshold of 35 µg/g found in 1987 (Griffiths 1988), suggesting that no biological impairment occurs in silty-clay sediments with PAH concentrations less than this value. It should also be noted that total PAH concentrations in all surficial sediments samples from Kettle Creek in 2009 did not exceed the Consensus-Based Probable Effect Level of 22.8 µg/g used in the United States to identify sediments that may cause harmful effects (Ingersoll et al. 2000). Consequently, no zone of biological impairment was evident in Kettle Creek in 2009.
Interestingly, the maximum sediment PAH concentration in our study, 21.2 µg/g, was similar to the maximum concentration of 25.2 µg/g reported in 1995 (CH2M Gore&Storrie 1996). These values are an order of magnitude lower than the maximum concentration of 499 µg/g found in 1987 (Griffiths 1988). This suggests that with the containment of off-site discharges in the early 1990s, the discharge of PAHs to the creek via the George Street Drain was essentially eliminated and, in response, PAH concentrations in surface sediments declined rapidly. Consequently, the zone of biological impairment may have been absent since the mid-1990s.
The total PAH toxicity threshold of 80 µg/g found in this study compares well against the proposed Ontario Ministry of the Environment’s Severe Effect Level (SEL) guideline for total PAHs of 10,000 µg/g total organic carbon (TOC) (Jaagumagi 1994). Assuming TOC sediment concentrations of 1 to 2% in Kettle Creek (Richman 2001), this SEL guideline would be equivalent to a total PAH concentration between 50 and 100 µg/g in bulk sediments, which brackets our measured toxicity threshold.
The International Joint Commission (IJC), meanwhile, has established a limit for benzo-[a]-pyrene (Bap), one specific PAH compound that is a known carcinogen and mutagen, of 1 µg/g for both sediments and aquatic organisms (IJC 1983) for the protection of human health and aquatic life. In Kettle Creek sediments, the Bap concentration was observed to be directly related to the total PAH concentration (Bap = 0.02 + 0.091 × PAH; n=73 samples; r2=0.99), indicating that it accounted for about 9% of total PAHs in samples. For comparison, creosote, a wood preservative produced from coal tar, contains about 1% Bap (Mueller et al. 1989). Consequently, a sample with a concentration of 1 µg/g Bap corresponded to a total PAH concentration of 10.8 µg/g. In 2009, only 2 of the 22 sampling stations in the main study area had PAH concentrations in surficial sediments exceeding a value of 10.8 µg/g (17.6 µg/g at station 8-10 and 21.2 µg/g at station 9-10). However, the overall mean concentration of PAHs in surficial sediments in the main study area was only 4.8 µg/g, suggesting that the overall mean concentration of Bap was just 0.44 µg/g.
Water Quality Changes:
Improved overall water quality conditions were also suggested by differences observed in the benthic fauna between autumn 1987 and 2009 (Table 1). Importantly, the mean density and mean richness (number of taxa) of macroinvertebrates was significantly higher in the autumn of 2009 compared with 1987 (paired t-test; p < 0.01). This response is consistent with an elimination of toxic conditions, including toxic conditions caused by PAHs (Scoggins et al. 2007). Furthermore, there were notable shifts in the composition of the benthic fauna between years, including a reduction in the proportion of aquatic worms from 87% to 41%, an increase in the proportion of true flies, particularly aquatic non-biting midges, from 10% to 55%, the complete disappearance of the worm, Quistradrilus multisetosus, an indicator of extreme organic and nutrient enrichment, and the widespread appearance of the midges, Tanytarsus, and Tribelos (Appendix 7 and 9). This change in composition is consistent with a reduction in nutrient concentrations, particularly phosphorus, which may be largely related to both local improvements and improvements at the St. Thomas Wastewater Treatment Plant some 15 km upstream. The combined effect is an improvement in water quality of 18% as reflected in the increase in the BioMAP water quality score from 1.68 to 1.98. Note that although there were major differences in the structure of the benthic community between spring and autumn of 2009 (Table 1), largely as a function of aquatic insects (e.g. true flies) emerging from the creek in early spring to mate and lay eggs, the BioMAP score for this season was identical to that in the autumn strengthening our evidence that permanent water quality improvements have occurred since 1987.
Notwithstanding these improved water quality conditions, the autumn community composition is largely composed of the midges, Chironomus, Cryptochironomus, Polypedilum halterale, and Procladius and several species of Limnodrilus worms, which is more reflective of lake environments such as the western basin of Lake Erie or Lake St. Clair. This composition suggests that low dissolved oxygen levels and accumulations of organic material still stress this area. However, the increased abundance and occurrence of riverine species in the community such as the beetle: Dubiraphia vittata, true fly: Tanytarsus, scuds: Gammarus fasciatus and Hyalella, clams: Sphaerium transversum, and worms: Aulodrilus pigueti and A. pluriseta, show that conditions have sufficiently improved for species more representative of this area to settle and survive.
PAH distribution in sediments:
Within the main study area, total PAH concentrations in surficial sediments in 2009 (geometric mean = 4.8 µg/g) were found to be significantly lower (paired t-test; n=16; p < 0.001) than in 1987 (geometric mean = 33.9 µg/g) (Figures 7 and 8). The surficial sediment concentrations ranged from non-detect to 21.2 µg/g in 2009 and from non-detect to 499 µg/g in 1987 (Canviro 1988). Meanwhile, the maximum concentration observed in 2009 was similar to the maximum of 25.2 µg/g found in 1995 (CH2M Gore&Storrie, 1996). This suggests that with the containment of off-site discharges in the early 1990s, the discharge of PAHs to the creek via the George Street Drain was essentially eliminated and, in response, PAH concentrations in surface sediments declined rapidly.
Although total PAH concentrations in the subsurface sediments of the main study area in 2009 (geometric mean = 24.3 µg/g) were generally lower than in 1987 (geometric mean = 34.7 µg/g), no significant difference was found (paired t-test; n=20; p > 0.25) (Figures 9 and 10). Subsurface sediment concentrations ranged from non-detect to 240 µg/g in 2009, and from non-detect to 2648 µg/g in 1987. Still these lower PAH concentrations appear to account for the significantly smaller area of visual contamination observed in 2009 over 1987 when the sediments were disturbed (Figures 11 and 12).
Sediments within the George Street Drain had the highest total PAH concentrations found in 2009 (Figure 13). Surface sediment had a PAH concentration of 219 µg/g, an order of magnitude greater than the maximum concentration found in Kettle Creek. Subsurface concentrations increased with depth from 453 µg/g to 1002 µg/g, which were 2 to 5 times that found in Kettle Creek.
Sediments in sampling areas upstream (transect 99 and 100) and downstream (transect 50) of the main study area, meanwhile, only showed trace concentrations of total PAHs both in 2009 (maximum of 3.9 µg/g) and 1987 (maximum of 2.4 µg/g).
A simple mixing-type model can be formulated to account for the development and maintenance of low PAH concentrations in surficial sediments since 1995. This model is based on: a) the continuous deposition of relatively low PAH laden sediment from upstream, b) mixing of surface sediments by biological and physical forces, c) a pool of historic PAHs contained in the subsurface sediments and d) the infrequent export of these sediments from this area.
The lower reach of Kettle Creek is generally turbid (Secchi depth < 0.5m and SS= 40 to 60 mg/L during ice-free season (Richman 2001)) with a slow discharge (typically < 0.2 m3/sec in summer and autumn). Consequently, some proportion of fine sediments (silts and sands) and organic matter transported in the water column continuously settles out over the main study area during typical (frequent) ice-free conditions either replenishing (sediment accretion) or replacing (sediment substitution) the surficial sediments in the area. In most of the main study area, no change in sediment thickness was measured (i.e. less than 10 cm) suggesting that the surficial sediments are in dynamic equilibrium with sediment losses equalling gains (Figure 14). However, sediment accretion (maximum 64 cm) was observed at several sites, particularly along the edge thalweg in 1 to 1.5 m of water, while a small site of erosion was measured near the shoreline between transects 7 and 9 (maximum loss of 16 cm). This suggests that the topography of the creek in the main study area is shifting, with the slope of the bottom becoming less steep over time. Upstream sediments have been similarly shown to be filling in others areas in lower Kettle Creek over a period from 2001 to 2007 (Riggs Engineering Ltd 2008).
These upstream sediments have at best low levels of PAHs (< 4 µg/g). Although no measurements of the PAH content of suspended solids in Kettle Creek are available, the low levels of PAHs in the surficial sediment of sampling stations upstream of the George Street Drain outlet (transect 5) were in the range of 0.9 to 3.9 µg/g, suggesting that suspended solids have low PAH concentrations. Downstream of the George Street Drain outlet, meanwhile, these sediment particles come into contact with subsurface sediments containing historic concentrations of PAHs and consequently adsorb some of the PAHs. Sediment disturbance through bioturbation, i.e. sediment mixing caused by the feeding activity and movement of macroinvertebrates in the sediment column, and weak physical forces, caused by winds, currents, boating activity and seiches transmitted by wave action, assures that surficial sediments are continuously mixing both vertically and horizontally thus increasing the likelihood that all sediments come in contact with the subsurface sediments at some time. The brownish colour throughout the surficial sediment layer, indicating aerobic conditions, suggests these sediments were well mixed. Consequently, the PAH concentration of surface sediments in the main study area under “benign” environmental conditions continuously increase above upstream (background) concentrations over time.
Some loss of PAHs from the surficial sediments may be accounted for by the loss of low molecular weight (2 to 3 ring compounds), i.e. light, PAHs through volatilization, photo-degradation, and bio-degradation (Concord Scientific Corporation & Beak Consultants, 1992). The proportion of light PAHs in surficial sediments in fact significantly declined (paired t-test; n=16; p < 0.001) from 39% to 18% from 1987 to 2009. However, the dramatically lower PAH concentrations observed in 1995 after just a year or two since the elimination of PAH discharges to the creek suggests that additional mechanisms were likely at work. Although infrequent, the erosion of surficial sediments and their displacement to Lake Erie under extreme conditions including storm-generated high current velocities, seiches, waves and ice jams (e.g. Figure 15, middle panel), probably accounts for the rapid decline in PAH concentrations seen in 1995 and for continuing PAH losses from the study area. With the drop in Lake Erie water levels of about 36 cm since the early 1990s (Figure 15, lower panel; Canadian Hydrographic Service 2010), surficial sediments in Kettle Creek are now even more vulnerable to be re-suspended and exported as less wave energy is now required. The simple act of turning a commercial fishing boat around generated a wave of sufficient energy to resuspend surficial sediments in the study area and turning the clear waters a turbid brown (Figure 15, upper panel). Loss of the brown silty surface layer was noted at several locations in November 2009, leaving the subsurface gravels exposed to the water (Figure 15, lower panel). These infrequent actions essentially reset the sediment contamination cycle: surficial sediments with elevated PAHs are removed and the sediment layer rebuilds with particles with trace levels of PAHs under the more typical and frequent “benign” environmental conditions. Consequently, PAH concentrations in surficial sediments no longer exceed 20 to 25 µg/g despite subsurface layers having higher PAH concentrations.
Losses of PAHs from subsurface sediments have proceeded at a slower rate. Again it appears that the light PAH compounds have declined faster than the heavier or higher molecular weight compounds (4 to 6 rings). The proportion of light PAHs in subsurface sediments did show a significant decline (paired t-test; n=22; p < 0.001) from 37% to 23% from 1987 to 2009. Losses of subsurface PAHs depend on contact with surface particles. This may occur when surface particles come in contact with the subsurface boundary, adsorb PAHs, and are later dislodged and swept downstream or when subsurface sediments are mixed into the surface sediments. A measure of sediment mixing depth can be inferred by the ratio of light to heavy PAH compounds with depth. For example, sediments in the George Street Drain are the least likely to be disturbed to any significant depth. Here we observed that the proportion of light PAHs increase with sediment depth from 25% in the 0 to 8.5 cm (surface) layer, to 33% in the 8.5 to 19 cm layer, to 51% in the 19 to 30 cm (bottom) layer. If these sediments were mixed to 30 cm, we would expect that the proportion of light PAHs to show no trend over this depth.
Using this measure of sediment mixing, all stations from the George Street Drain (5-22) downstream to 10-28 show sediment mixing to depths of 55 cm, as core samples at each site show no increasing trend in the proportion of light PAHs with depth. In contrast, only shallow sediment mixing (less than 12 cm) is inferred at stations upstream of the George Street Drain and downstream of transect 10. Thus the PAHs in the subsurface sediments in a large section of the main study area must be periodically mixed with the surface sediments thus dispersing the PAHs into the surface sediments. Consequently both mechanisms have likely contributed to lowering the PAH concentrations in the subsurface layers of Kettle Creek, although this proceeds at a much slower rate than observed in the surface sediments.
Notwithstanding these mechanisms, the area of erosion noted near the shoreline in 2009 suggests that in this area the subsurface sediments (gravels) are frequently exposed to the surface waters (Figure 14). Thus the PAHs in these subsurface sediments may be more frequently displaced during a variety of weather disturbances. In contrast, the subsurface PAHs in the accretion sites are generally buried by a deep layer of cleaner upstream sediments and thus have less chance to be displaced downstream.
Despite the downstream export of the contaminated sediments (both surficial and subsurface) from the study area, total PAH sediment concentrations in lower Kettle Creek and the harbour have never been found above trace levels, i.e. 4 µg/g, (CH2M Hill 2009; Riggs Engineering 2008; Dove et al. 2002; Richman 2001) and are similar to concentrations measured in other Lake Erie Harbours (Tarandus Associates Limited 1992). It should be noted that 75% of the annual loadings of PAHs to Lake Erie come from atmospheric deposition (Concord Scientific Corporation and Beak Consultants 1992).
Sediment Management Recommendations:
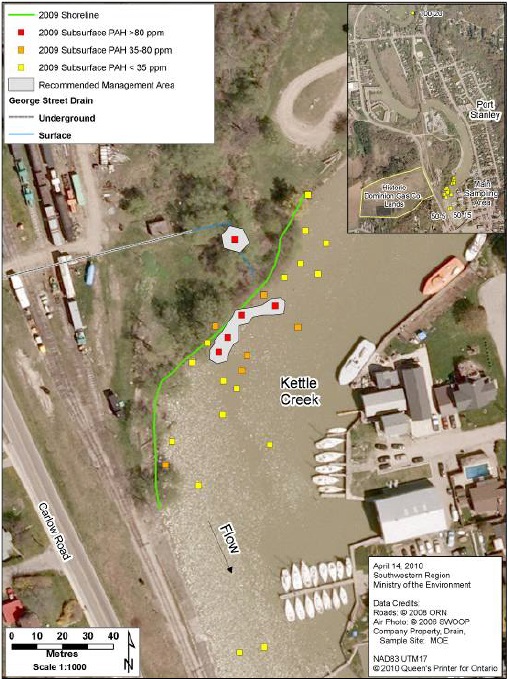
The Canada-Ontario Decision Making Framework for Assessment of Great Lakes Contaminated Sediments (EC & OMOE 2007) provides a process for identifying areas with sediments requiring possible management actions. The application of this process requires the establishment of a Severe Effect Level (SEL) for total PAHs and a measure of sediment mixing depth. The in-situ toxic threshold of 80 µg/g for total PAHs found by Griffiths (1988), and supported by this study, was selected as the SEL for PAHs. Meanwhile, our study estimated that sediment mixing likely occurs to a depth of at least 55 cm. Consequently we identified all sampling stations that contained sediment concentrations of total PAHs in excess of 80 µg/g and within 55 cm of the sediment surface, as these subsurface sediments are at risk of coming into contact with the surficial sediment and thus causing an impact to aquatic life. Enclosing an area around adjacent sampling stations provided an area requiring potential management actions according to the Canada-Ontario Decision Making Framework (Figure 16). This management area includes an area within the George Street Drain and an area in Kettle Creek extending downstream from the Drain outlet, covering an area of 325 m2. Assuming an estimated 1 m depth to uncontaminated sediment, this area contains a volume of approximately 325 m3.
Acknowledgements:
We wish to thank Kim Harman for her field and lab assistance and canoe paddling prowess during this study. Comments from our group leader, Scott, helped improve the clarity of the report. Support from Regional MOE management was essential for the completion of this project.
References:
Canadian Hydrographic Service, 2010. Water Levels Monthly Bulletin, March 2010. Department of Fisheries and Oceans, Ottawa, Ontario.
Canviro 1988. Polynuclear Aromatic Hydrocarbon (PAH) sediment contamination in Kettle Creek, Port Stanley: Site investigation and remedial recommendations. Prepared by Canviro Consultants, Waterloo, Ontario. Prepared for Ministry of the Environment, Southwestern Region, London, Ontario.
CH2M Gore&Storrie. 1996. Sampling program in the George Street drain area. Prepared by: CH2M Gore&Storrie, Waterloo, Ontario. Prepared for: Ontario Ministry of the Environment, Southwestern Region, London, Ontario.
CH2M Hill 2009. Phase II Environmental Site Assessment, Port Stanley Harbour, Port Stanley, Ontario. Prepared for: Public Works and Government Services Canada. Prepared by: CH2M Hill, Waterloo, Ontario.
Concord Scientific Corporation and Beak Consultants. 1992. Polycyclic Aromatic Hydrocarbons: Sources, Fate and Levels in Air, Water, Soil, Sediments, Sludge and Food in Ontario. Prepared for Ontario Ministry of the Environment, Hazardous Contaminants Branch, Toronto.
Dove, A., S.Painter and J.Kraft. 2002. Sediment Quality in Canadian Lake Erie Tributaries, A Screening Level Survey .Environment Canada, Ontario Region.
EC & OMOE 2007. Canada-Ontario Decision-Making Framework for Assessment of Great Lakes Contaminated Sediment. Environment Canada & Ontario Ministry of the Environment COA Sediment Task Group. Ottawa, Ontario. 75pp.
IJC, 1983. Annual Report. Great Lakes Science Advisory Board. International Joint Commission, Windsor, Ontario. 58 pp.
Ingersoll, C.G., D.D. MacDonald, N. Wang, J.L. Crane, L.J. Field, P.S. Haverland, N.E. Kemble, R.A. Lindskoog, C. Severn, and D.E. Smorong. 2000. Prediction of sediment toxicity using consensus-based freshwater sediment quality guidelines. United States Geological Survey. Final report for the U.S. Environmental Protection Agency. Great Lakes National Program Office. EPA 905/R-00/007.
Jaagumagi, R. 1994. Development of the Ontario Provincial Sediment Quality Guidelines for polycyclic aromatic hydrocarbons (PAH). Ontario Ministry of the Environment, Toronto.
Griffiths, R.W. 1988. Effect of Polynuclear Aromatic Hydrocarbons on the benthic invertebrate fauna of Kettle Creek at Port Stanley, Ontario. Aquatic Ecostudies Limited, Kitchener, Ontario. Prepared for Canviro Consultants, Waterloo, Ontario, and Ministry of the Environment, Southwestern Region, London, Ontario. 21 pp.
Griffiths, R.W. 1999. BioMAP: Bioassessment of Water Quality. Published by Niagara College, Glendale Campus, Niagara-on-the-Lake, Ontario.
Griffiths, R.W. 1996. A biological measure of water quality for creeks, streams, and rivers. Ministry of the Environment, Southwestern Region, London, Ontario.
Mueller, J.G., P.J. Chapman and P.H. Pritchard. 1989. Creosote Contaminated Sites. Environ. Sci. Tech. 23: 1197-1201.
Richman, L.A. 2001. Great Lakes Reconnaissance Surveys: Lake Erie Harbours Water and Sediment Quality, 1998. Ministry of the Environment, Toronto, Ontario. 63 pp. plus appendices.
Riggs Engineering. 2008. Port Stanley Harbour Maintenance Dredging 2008 Disposal Options. Report for: Public Works and Government Services Canada. Report by: Riggs Engineering Ltd., London, Ontario.
Scoggins et al. 2007. Occurrence of polycyclic aromatic hydrocarbons below coaltar-sealed parking lots and effects on stream benthic macroinvertebrate communities. Journal of the North American Benthological Society 26: 694 to 707.
Tarandus Associates Limited. 1992. Great Lakes Embayments and Harbours Investigation Program, Phase 1: The Lake Erie Harbours Synoptic Surveys. Prepared for the Ontario Ministry of Environment & Energy, Water Resources Branch, Toronto.
| Benthic macroinvertebrates | Autumn 1987 | Autumn 2009 | Spring 2009 |
|---|---|---|---|
| Insects: | |||
| Beetles | 0.2 | 1.0 | 0.4 |
| Mayflies | 0.0 | 0.3 | 0.3 |
| True Flies | 7.0 | 138 | 13.8 |
| Crustaceans: | |||
| Scuds | 0.7 | 1.3 | 0.0 |
| Pillbugs | 0.1 | 0.0 | 0.0 |
| Molluscs: | |||
| Clams | 0.6 | 2.3 | 0.0 |
| Annelids: | |||
| Leeches | 0.3 | 0.4 | 0.0 |
| Worms | 132 | 101 | 27.9 |
| Mean Density | 141 | 244 | 42.4 |
| Mean Richness (taxa) | 7.7 | 13.7 | 10.4 |
| BioMAP Score | 1.68 | 1.98 | 1.98 |
Figure 1a: Location of sampling stations for sediment samples in the overall study area in lower Kettle Creek, 1987 and 2009. (Refer to Appendix 1 for a list of sample locations and their associated UTM coordinates).
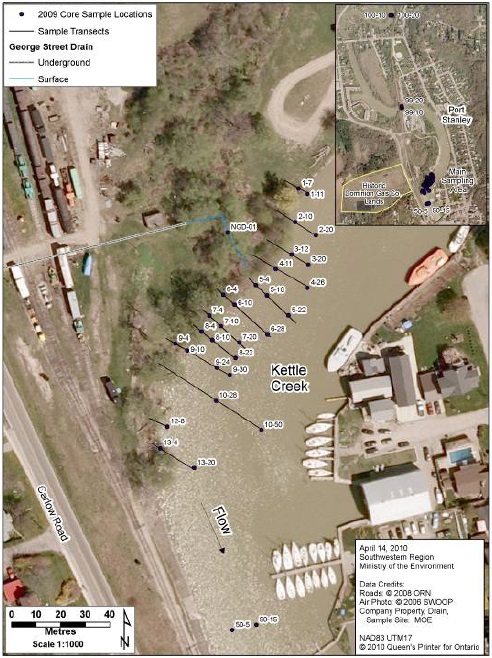
Figure 1b: Location of sampling sites in lower Kettle Creek for surficial sediment Polycyclic Aromatic Hydrocarbons concentrations and benthic macroinvertebrates 1987 and 2009.
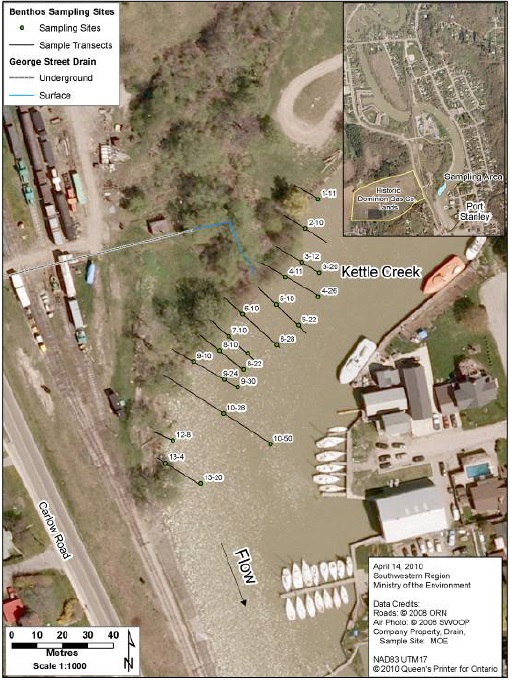
Figure 2: a) Left panel shows core sampler being pushed by hand into the sediments at a wadeable site of Kettle Creek. b) Right panel shows an Ekman sampler being lowered into Kettle Creek to sample benthic macroinvertebrates at a wadeable site.
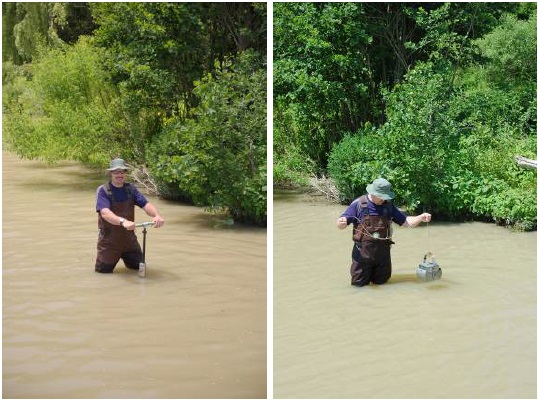
Figure 3: a) Left panel shows retrieved core sample of sediments from Kettle Creek. Water overlaying sediments was suctioned off before sediments were extruded. b) Right panel shows extruded sediment core on aluminium foil. Core length is measured from the bottom as the top sediments are not firm enough to hold together and flow away. The brown silty layer from 0 to 7 cm in this sample represents the surficial sediment layer and would be removed and submitted for PAH analysis. Since the peripheral edge of the sample was typically smeared down the core length, the core was split open and only the interior sediments removed for PAH analysis.
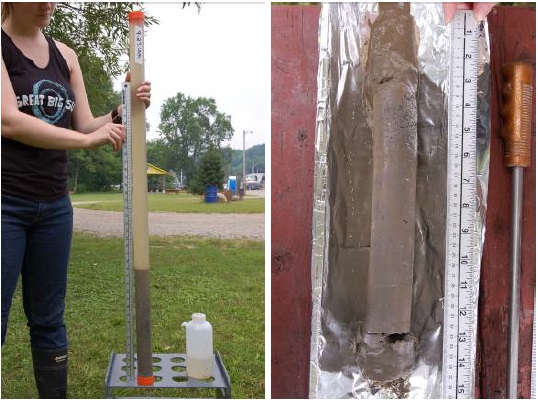
Figure 4: Typical benthic macroinvertebrates collected at Kettle Creek. Top Left: the amphipod or water scud, Gammarus fasciatus. Top Right: the mayfly nymph, Caenis. Bottom Left: the true flies or non-biting midges, Cryptochironomus, Procladius, and Chironomus (from left to right). Bottom Right: the riffle beetle larvae, Dubiraphia vittata.
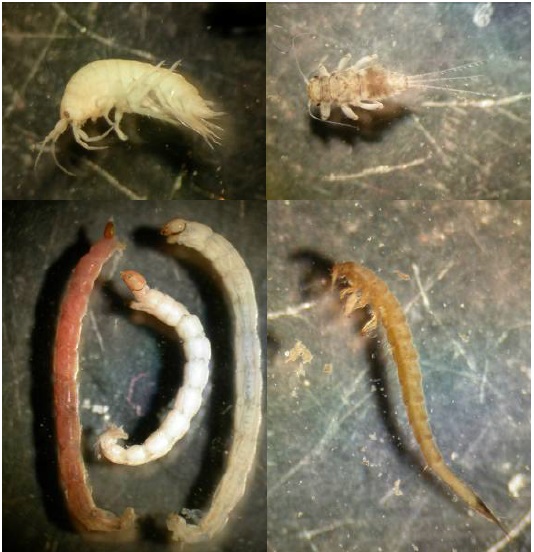
Figure 5: Relationship between total PAH concentrations (µg/g) and aquatic worm density (number ⁄ 230 cm2) in surficial sediments of Kettle Creek in 1987 (upper panel) and 2009 (lower panel).
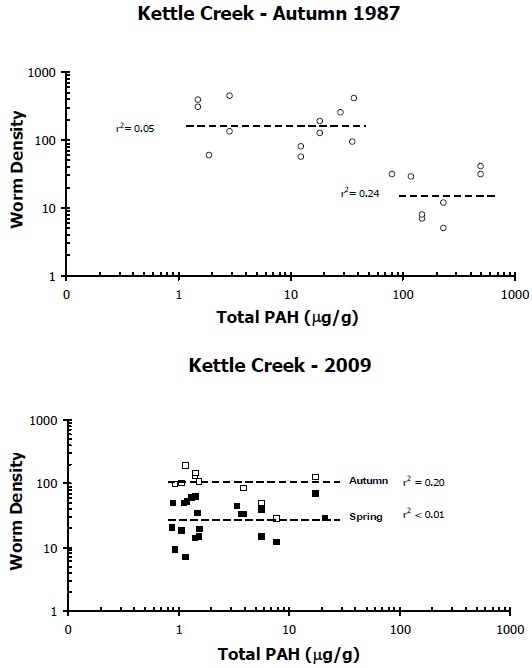
Figure 6: Area of Biological Impairment (reduced worm density) in Kettle Creek, 1987 (from Griffiths 1988).
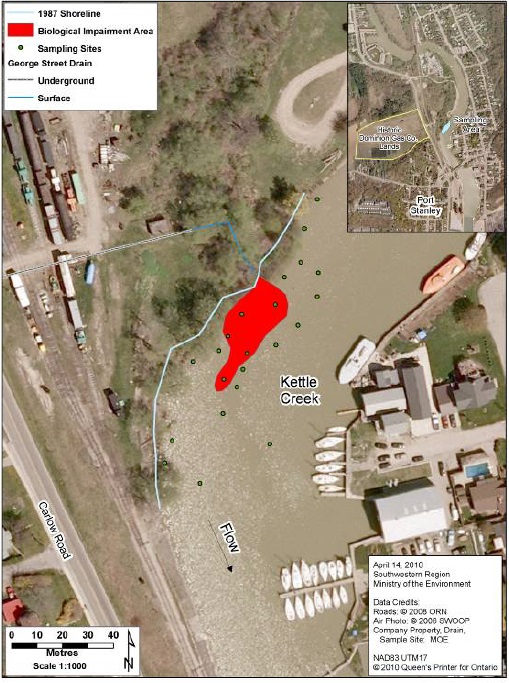
Figure 7: Total PAH surficial sediment concentrations in 1987.
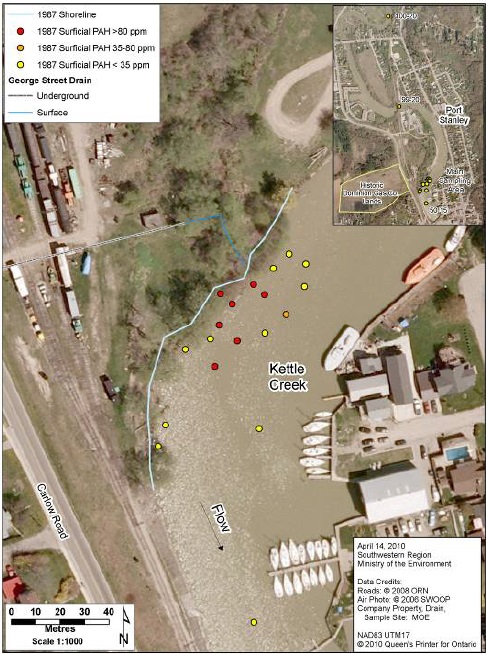
Figure 8: Total PAH surficial sediment concentrations in 2009.
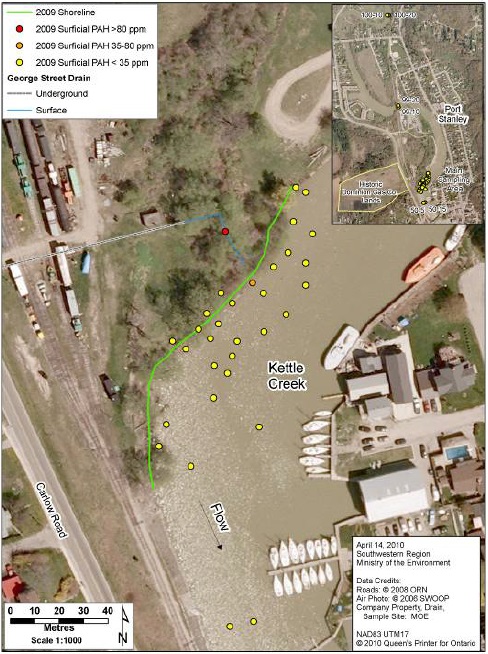
Figure 9: Total PAH subsurface sediment concentrations as seen in 1987.
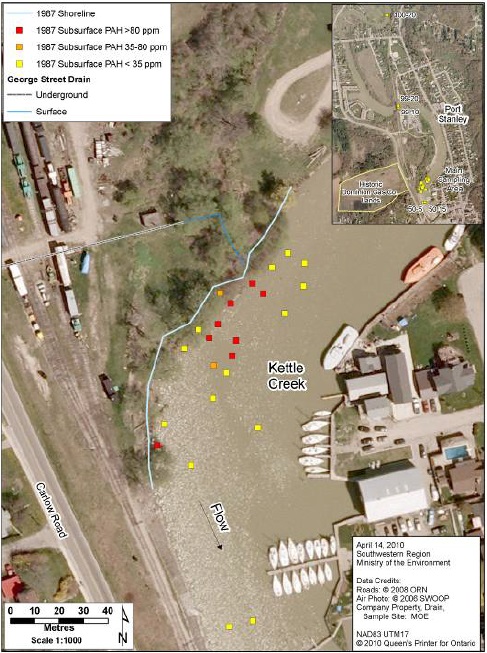
Figure 10: Total PAH subsurface sediment concentrations in 2009.
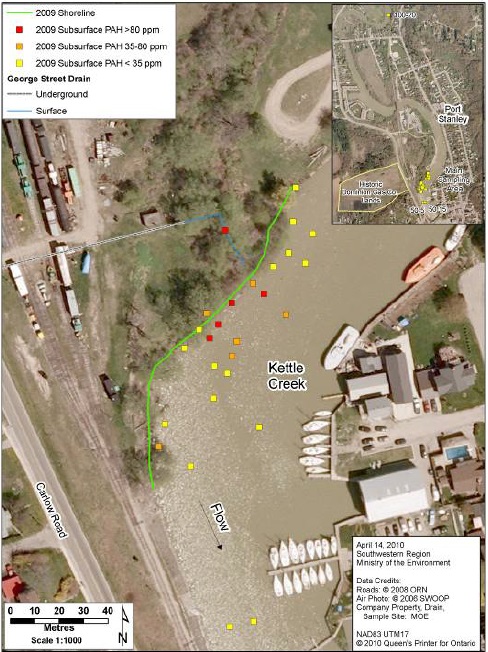
Figure 11: Areas of visual contamination in 1987. (From Canviro, 1988)
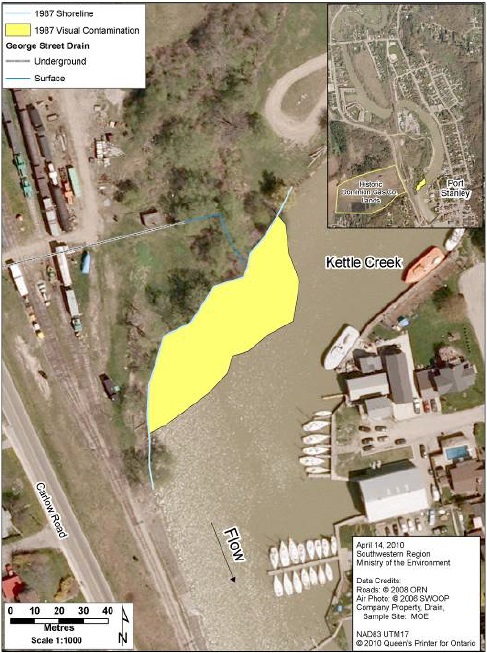
Figure 12: Areas of visual contamination in 2009. (Refer to Appendix 9 for data)
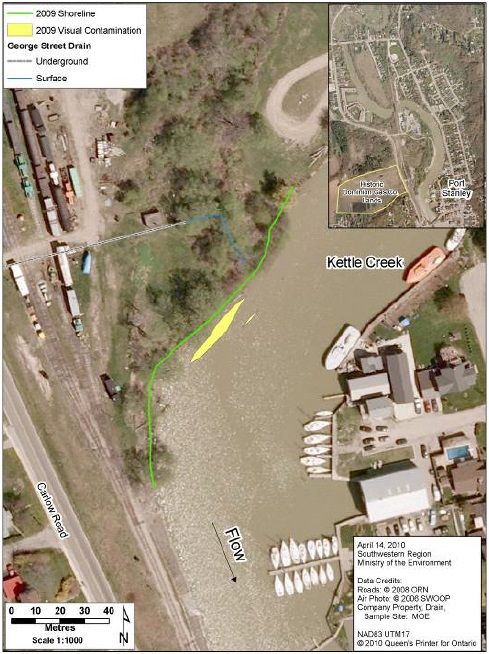
Figure 13: Samples from the George Street Drain a)Top left panel shows an example of the retrieved core sample of sediments from the Drain. b) Top right panel shows extruded sediment core on aluminium foil. Visual contamination in the sediment core appears as rainbow sheen on the sediments. c) Bottom left panel shows the stratgraphic layers in the sediment. d) Bottom right panel shows the obvious oil tar contamination in orange cap.
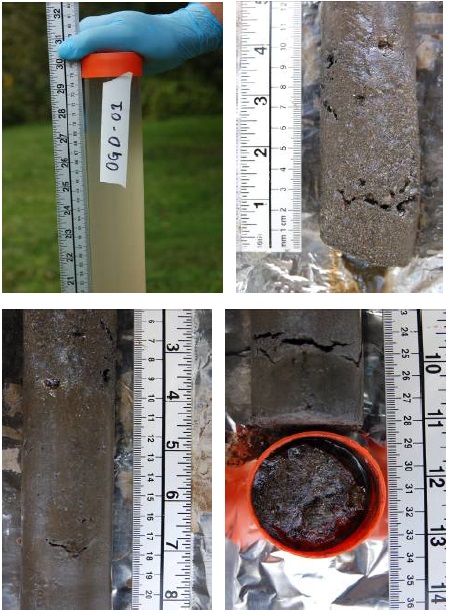
Figure 14: Areas of accretion and erosion with associated subsurface total PAH concentrations, 2009. (Refer to Appendix 10 for data)
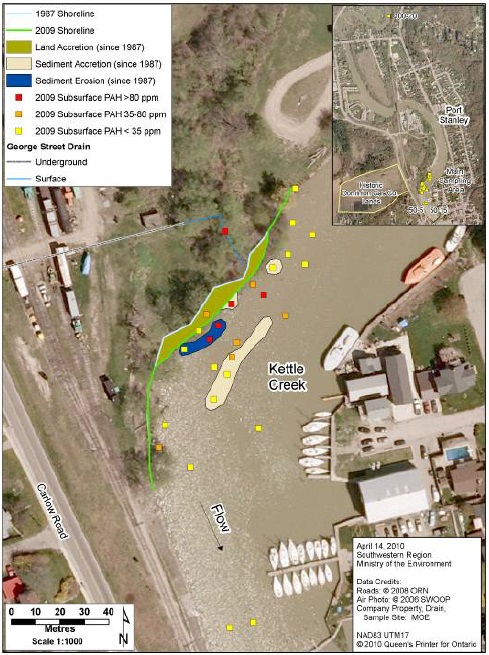
Figure 15: Upper panel shows waves generated by a commercial fishing boat flowing across Kettle Creek site (left) and the clear waters turned turbid by resuspending surficial sediments (right). Middle panel shows ice jam in Kettle Creek in January 2009 slowly moving to Lake Erie scouring the nearshore sediments (left) in contrast to a sheet of ice covering the river in February of 2010 causing no scour of sediments (right). Lower panel (left) shows the loss of the surficial brown silt layer present during the summer thus exposing the subsurface gravel sediments. Lower panel (right) shows the lower water levels since mid-1990s: the base of large willow tree marks the water level in 1987; the bushes mark the 2009 water level; the alders in between became established since 1995.
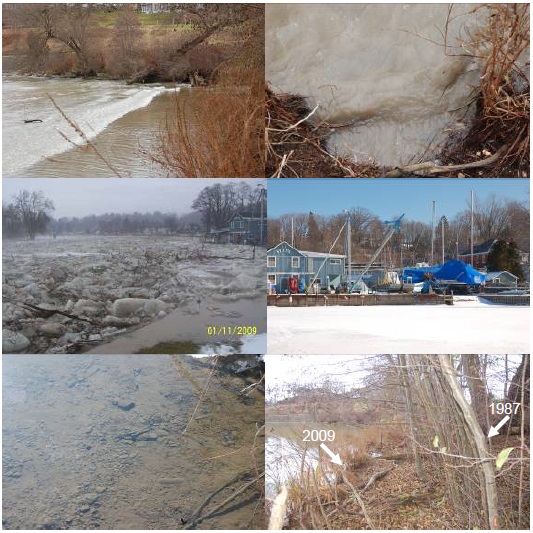
Figure 16: Identified Sediment Management Areas for possible management actions using the Canada-Ontario Decision-Making Framework of 2007. (See Appendix 10 for data).
Appendix 1: 2009 Sediment Sampling locations and their associated UTM coordinates. (UTM: Zone 17N, NAD 83)
| Station Name | Easting | Northing |
|---|---|---|
| 1-7 | 482413 | 4723939 |
| 1-11 | 482417 | 4723937 |
| 2-10 | 482412 | 4723925 |
| 2-20 | 482420 | 4723920 |
| 3-12 | 482410 | 4723912 |
| 3-20 | 482417 | 4723908 |
| 4-11 | 482404 | 4723906 |
| 4-26 | 482417 | 4723899 |
| 5-4 | 482396 | 4723900 |
| 5-10 | 482400 | 4723896 |
| 5-22 | 482409 | 4723887 |
| 6-4 | 482382 | 4723896 |
| 6-10 | 482387 | 4723892 |
| 6-28 | 482400 | 4723880 |
| 7-4 | 482377 | 4723887 |
| 7-10 | 482381 | 4723883 |
| 7-20 | 482389 | 4723876 |
| 8-4 | 482373 | 4723881 |
| 8-10 | 482378 | 4723877 |
| 8-22 | 482387 | 4723870 |
| 9-4 | 482363 | 4723876 |
| 9-10 | 482368 | 4723873 |
| 9-24 | 482380 | 4723866 |
| 9-30 | 482385 | 4723863 |
| 10-28 | 482379 | 4723853 |
| 10-50 | 482398 | 4723841 |
| 12-8 | 482360 | 4723842 |
| 13-4 | 482357 | 4723833 |
| 13-20 | 482370 | 4723825 |
| 50-5 | 482386 | 4723759 |
| 50-15 | 482396 | 4723761 |
| 99-10 | 482233 | 4724344 |
| 99-20 | 482231 | 4724354 |
| 100-10 | 482172 | 4724909 |
| 100-20 | 482162 | 4824909 |
| NGD-01 | 482384 | 4723921 |
Appendix 2: 2009 Sediment Core Field Observations
Download Appendix 2
Appendix 3: 2009 sediment sampling stations with associated depth and total PAH
| Station ID | Depth (cm) | Total PAH (ug/g) |
|---|---|---|
| 1-7 | 33-49 | 2.0 |
| 1-11 | 0-15 | 3.9 |
| 2-10 | 0-11 | 1.1 |
| 2-10 | 11-25 | 10.0 |
| 2-20 | 0-3.5 | 1.0 |
| 2-20 | 6.5-21.5 | 0.4 |
| 3-12 | 0-11 | 0.9 |
| 3-12 | 11-27 | 13.2 |
| 3-12 | 11-27 | 13.2 |
| 3-12 | 27-30 | 4.5 |
| 3-20 | 0-11 | 3.4 |
| 4-11 | 0-12 | 1.2 |
| 4-11 | 12-14.5 | 26.9 |
| 4-11 | 27-32 | 4.0 |
| 4-26 | 0-14 | 0.0 |
| 5-4 | 0-7 | 66.5 |
| 5-4 | 7-13 | 44.7 |
| 5-10 | 0-6.5 | 5.7 |
| 5-10 | 6.5-25 | 190.1 |
| 5-22 | 0-11 | 1.6 |
| 5-22 | 11-27 | 42.1 |
| 5-22 | 27-37 | 45.0 |
| 6-4 | L0-L16 | 2.8 |
| 6-4 | L0-L16 | 2.8 |
| 6-4 | 0-13 | 6.3 |
| 6-10 | 0-1 | 5.7 |
| 6-10 | 1-7.5 | 13.8 |
| 6-10 | 16-18.5 | 123.1 |
| 6-28 | 1-12 | 3.7 |
| 7-4 | L0-L18 | 17.6 |
| 7-4 | 0-6 | 56.0 |
| 7-4 | 6-24 | 26.5 |
| 7-10 | 0.1-5 | 7.9 |
| 7-10 | 1.5-12.5 | 43.8 |
| 7-10 | 12.5-18.5 | 57.8 |
| 7-10 | 18.5-25 | 205.1 |
| 7-10 | 25-30 | 240.2 |
| 7-20 | 0-12 | 1.4 |
| 7-20 | 0-12 | 1.4 |
| 7-20 | 12-42 | 55.2 |
| 7-20 | 42-43 | 6.9 |
| 7-20 | 43-50.5 | 60.8 |
| 8-4 | L0-L8.5 | 32.9 |
| 8-4 | 0-4 | 7.2 |
| 8-4 | 4-14 | 3.1 |
| 8-10 | 0-4.5 | 17.6 |
| 8-10 | 4.5-9.5 | 36.1 |
| 8-10 | 9.5-26.5 | 109.4 |
| 8-10 | 26.5-36 | 7.2 |
| 8-22 | 0-11 | 1.5 |
| 8-22 | 24.5-54.5 | 12.4 |
| 8-22 | 54.5-58 | 50.6 |
| 9-4 | L0-L16 | 3.1 |
| 9-4 | 0-12 | 7.0 |
| 9-10 | 0-5 | 21.2 |
| 9-10 | 5-24 | 8.4 |
| 9-24 | 0-5 | 1.4 |
| 9-24 | 19-25.5 | 34.6 |
| 9-30 | 0-2.5 | 1.2 |
| 9-30 | 2.5-42 | 13.9 |
| 10-28 | 0-7.5 | 1.5 |
| 10-28 | 7.5-33 | 2.7 |
| 10-28 | 33-37.5 | 3.4 |
| 10-50 | 0-7.5 | 0.9 |
| 10-50 | 10-25.5 | 8.1 |
| 12-8 | 0-9.5 | 1.3 |
| 12-8 | 9.5-18 | 12.4 |
| 12-8 | 29-35 | 28.9 |
| 13-4 | 0-6.5 | 1.1 |
| 13-4 | 6.5-22 | 9.5 |
| 13-4 | 32-41 | 13.6 |
| 13-4 | 56.5-58 | 73.7 |
| 13-4 | 56.5-58 | 73.7 |
| 13-20 | 0-2 | 0.9 |
| 13-20 | 2-23.5 | 1.3 |
| 13-20 | 23.5-25.5 | 9.3 |
| 50-5 | 0-3.5 | 1.5 |
| 50-5 | 3.5-14 | 2.9 |
| 50-15 | 0-9 | 0.8 |
| 50-15 | 9-27 | 3.9 |
| 99-10 | 0-9 | 0.5 |
| 99-20 | 0-7 | 0.0 |
| 100-10 | 0-11 | 0.0 |
| 100-20 | 0-14 | 0.0 |
| 100-20 | 14-19 | 0.3 |
| NGD-01 | 0-8.5 | 218.5 |
| NGD-01 | 8.5-19 | 453.3 |
| NGD-01 | 19-30 | 1001.9 |
Appendix 4: Total PAH analyses for Canviro and 2009 Studies
| Station ID | 1-7 | 1-11 | 2-10 | 2-10 | 2-20 | 2-20 | 3-12 | 3-12 | 3-12 | 3-20 |
|---|---|---|---|---|---|---|---|---|---|---|
| Date Sampled | 4-Aug-09 | 22-Jun-09 | 13-Jul-09 | 13-Jul-09 | 8-Aug-09 | 8-Aug-09 | 13-Jul-09 | 13-Jul-09 | 13-Jul-09 | 11-Aug-09 |
| Depth (cm) | 33-49 | 0-15 | 0-11 | 11-25 | 0-3.5 | 6.5-21.5 | 0-11 | 11-27 | 27-30 | 0-11 |
| LIMS Number | C173573-0001 | C171006-0027 | C171006-0026 | C173573-0002 | C173573-0003 | C173573-0004 | C171006-0025 | C173573-0005 | C173573-0006 | C171006-0024 |
| 2009 | µg/g | µg/g | µg/g | µg/g | µg/g | µg/g | µg/g | µg/g | µg/g | µg/g |
| Napthalene | 0.04 | 0.03 | 0.014 | 0.073 | 0.015 | 0.031 | 0.014 | 0.19 | 0.17 | 0.017 |
| Acenapthylene | 0.027 | 0.071 | 0.011 | 0.21 | 0.007 | 0.006 | 0.0072 | 0.26 | 0.089 | 0.032 |
| Acenapthene | 0.009 | 0.11 | 0.008 | 0.088 | 0.0046 | 0.023 | 0.0069 | 0.16 | 0.11 | 0.016 |
| Fluorene | 0.028 | 0.098 | 0.012 | 0.078 | 0.0099 | 0.011 | 0.01 | 0.13 | 0.11 | 0.08 |
| Phenanthrene | 0.16 | 0.51 | 0.077 | 0.66 | 0.063 | 0.039 | 0.066 | 1 | 0.54 | 0.51 |
| Anthracene | 0.037 | 0.12 | 0.014 | 0.18 | 0.0086 | 0.01 | 0.011 | 0.27 | 0.15 | 0.1 |
| Fluoranthene | 0.23 | 0.39 | 0.14 | 0.96 | 0.15 | 0.051 | 0.13 | 1.1 | 0.36 | 0.6 |
| Pyrene | 0.23 | 0.71 | 0.15 | 1.9 | 0.13 | 0.053 | 0.12 | 2.4 | 0.7 | 0.45 |
| Benzo(a)anthracene | 0.096 | 0.25 | 0.058 | 0.72 | 0.049 | 0.021 | 0.021 | 0.046 | 0.98 | 0.29 |
| Chrysene | 0.16 | 0.3 | 0.11 | 0.91 | 0.099 | 0.031 | 0.094 | 1.2 | 0.35 | 0.28 |
| Benzo(b)fluoranthene | 0.12 | 0.14 | 0.07 | 0.46 | 0.074 | 0.019 | 0.063 | 0.64 | 0.17 | 0.17 |
| Benzo(k)fluoranthene | 0.12 | 0.2 | 0.079 | 0.6 | 0.076 | 0.02 | 0.072 | 0.84 | 0.23 | 0.23 |
| Benzo(e)pyrene | 0.12 | 0.19 | 0.067 | 0.65 | 0.073 | 0.024 | 0.059 | 0.89 | 0.26 | 0.14 |
| Benzo(a)pyrene | 0.13 | 0.28 | 0.078 | 0.97 | 0.07 | 0.022 | 0.064 | 1.3 | 0.36 | 0.2 |
| Perylene | 0.26 | 0.11 | 0.043 | 0.32 | 0.05 | 0.026 | 0.041 | 0.33 | 0.12 | 0.071 |
| Ideno(1,2,3-c,d)pyrene | 0.11 | 0.17 | 0.077 | 0.49 | 0.066 | 0.014 | 0.071 | 0.57 | 0.18 | 0.18 |
| Dibenzo(a,h)anthracene | 0.023 | 0.03 | 0.01 | 0.13 | 0.011 | 0.0026 | 0.0088 | 0.17 | 0.049 | 0.029 |
| Benzo(g,h,i)perylene | 0.12 | 0.17 | 0.064 | 0.63 | 0.078 | 0.02 | 0.058 | 0.8 | 0.24 | 0.13 |
| Total PAH (µg/g) | 2.0 | 3.9 | 1.1 | 10.0 | 1.0 | 0.4 | 0.9 | 13.2 | 4.5 | 3.4 |
| 1987 | ||||||||||
| Station ID | 3-12-1 | 3-20-1 | ||||||||
| Depth (cm) | 2-87 | 2-20 | ||||||||
| 1/2 MDL | ||||||||||
| Napthalene | 0.04 | 0.04 | 0.04 | |||||||
| Acenapthylene | 0.09 | 0.09 | 0.09 | |||||||
| Acenapthene | 0.05 | 0.05 | 0.5 | |||||||
| Fluorene | 0.05 | 0.05 | 0.05 | |||||||
| Phenanthrene | 0.14 | 0.14 | 0.14 | |||||||
| Anthracene | 0.05 | 0.05 | 0.5 | |||||||
| Fluoranthene | 0.06 | 0.04 | 0.06 | |||||||
| Pyrene | 0.05 | 0.70 | 0.05 | |||||||
| Benzo(a)anthracene + Chrysene | 0.12 | 0.40 | 0.12 | |||||||
| Benzo(b) & (k) fluoranthene | 0.18 | 0.18 | 0.18 | |||||||
| Benzo(a)pyrene | 0.07 | 0.07 | 0.07 | |||||||
| Ideno(1,2,3-c,d)pyrene | 0.1 | 0.10 | 0.1 | |||||||
| Dibenzo(a,h)anthracene | 0.7 | 0.70 | 0.7 | |||||||
| Benzo(g,h,i)perylene | 0.11 | 0.11 | 0.11 | |||||||
| Total PAH (µg/g) | 1.8 | 2.7 | 1.8 |
| Station ID | 3-20 | 4-11 | 4-11 | 4-11 | 4-26 | 5-4 | 5-4 | 5-10 | 5-10 | 5-22 |
|---|---|---|---|---|---|---|---|---|---|---|
| Date Sampled | 11-Aug-09 | 13-Jul-09 | 13-Jul-09 | 13-Jul-09 | 11-Aug-09 | 6-Nov-09 | 6-Nov-09 | 23-Jul-09 | 23-Jun-09 | 5-Aug-09 |
| Depth (cm) | 3-20 | 0-12 | 12-14.5 | 27-32 | 0-14 | 0-7 | 7-13 | 0-6.5 | 6.5-25 | 0-11 |
| LIMS Number | C173573-0007 | C171006-0023 | C173573-0008 | C173573-0009 | C171006-0022 | C173573-0010 | C173573-0011 | C171006-0021 | C173573-0012 | C171006-0020 |
| 2009 | µg/g | µg/g | µg/g | µg/g | µg/g | µg/g | µg/g | µg/g | µg/g | µg/g |
| Napthalene | 0.016 | 0.016 | 0.19 | 0.082 | 0 | 0.27 | 0.19 | 0.13 | 10 | 0.043 |
| Acenapthylene | 0.0042 | 0.01 | 0.63 | 0.082 | 0 | 1.2 | 0.61 | 0.11 | 2.3 | 0.013 |
| Acenapthene | 0.045 | 0.009 | 0.69 | 0.13 | 0 | 0.89 | 0.83 | 0.12 | 9.8 | 0.031 |
| Fluorene | 0.017 | 0.012 | 0.5 | 0.084 | 0 | 0.66 | 0.66 | 0.083 | 8.8 | 0.028 |
| Phenanthrene | 0.064 | 0.079 | 3.3 | 0.4 | 0 | 7 | 4.7 | 0.53 | 42 | 0.18 |
| Anthracene | 0.02 | 0.014 | 0.93 | 0.11 | 0 | 2.4 | 1.5 | 0.14 | 11 | 0.042 |
| Fluoranthene | 0.11 | 0.15 | 1.9 | 0.36 | 0 | 6.4 | 5.5 | 0.58 | 13 | 0.2 |
| Pyrene | 0.096 | 0.16 | 4 | 0.65 | 0 | 13 | 8.3 | 1.1 | 31 | 0.22 |
| Benzo(a)anthracene | 0.035 | 0.059 | 2 | 0.25 | 0 | 5.2 | 3.5 | 0.39 | 10 | 0.079 |
| Chrysene | 0.049 | 0.12 | 2.1 | 0.31 | 0 | 5.9 | 3.7 | 0.48 | 11 | 0.13 |
| Benzo(b)fluoranthene | 0.024 | 0.079 | 0.92 | 0.18 | 0 | 2.4 | 1.7 | 0.21 | 4.3 | 0.089 |
| Benzo(k)fluoranthene | 0.027 | 0.088 | 1.5 | 0.21 | 0 | 3.4 | 2.4 | 0.32 | 6.4 | 0.1 |
| Benzo(e)pyrene | 0.025 | 0.073 | 1.8 | 0.22 | 0 | 3.8 | 2.5 | 0.31 | 6.7 | 0.083 |
| Benzo(a)pyrene | 0.029 | 0.082 | 2.8 | 0.34 | 0 | 6.4 | 3.8 | 0.47 | 11 | 0.1 |
| Perylene | 0.02 | 0.044 | 0.52 | 0.18 | 0 | 1 | 0.69 | 0.094 | 1.7 | 0.046 |
| Ideno(1,2,3-c,d)pyrene | 0.019 | 0.087 | 1.2 | 0.15 | 0 | 2.4 | 1.7 | 0.28 | 4.1 | 0.1 |
| Dibenzo(a,h)anthracene | 0.0024 | 0.012 | 0.28 | 0.043 | 0 | 0.64 | 0.42 | 0.048 | 0.97 | 0.013 |
| Benzo(g,h,i)perylene | 0.024 | 0.072 | 1.6 | 0.23 | 0 | 3.5 | 2 | 0.27 | 6 | 0.082 |
| Total PAH (µg/g) | 0.6 | 1.2 | 26.9 | 4.0 | 0.0 | 66.5 | 44.7 | 5.7 | 190.1 | 1.6 |
| 1987 | ||||||||||
| Station ID | 4-11-3 | 4-11-1 | 4-26-1 | 5-4-3 | 5-4-1 | 5-10-3 | 5-10-2 | 5-22-2 | ||
| Depth (cm) | 2-34 | 47-49 | 2-37 | 2-14 | 42-72 | 2-27 | 31-44 | 2-11 | ||
| Napthalene | 0.2 | 0.4 | 0.04 | 21.1 | 498 | 80 | 33 | 1.5 | ||
| Acenapthylene | 0.8 | 0.4 | 0.09 | 28 | 23 | 10.2 | 4.6 | 2 | ||
| Acenapthene | 0.2 | 0.9 | 0.05 | 9.6 | 246 | 33 | 13.6 | 0.8 | ||
| Fluorene | 0.7 | 0.6 | 0.05 | 9.9 | 138 | 50.4 | 15.3 | 2 | ||
| Phenanthrene | 3.1 | 2.7 | 0.14 | 36 | 960 | 94.5 | 28.6 | 6.6 | ||
| Anthracene | 0.9 | 0.8 | 0.05 | 7.8 | 139 | 31.5 | 9.5 | 2.1 | ||
| Fluoranthene | 2.1 | 0.9 | 0.06 | 2.7 | 89 | 20.1 | 9.6 | 3.4 | ||
| Pyrene | 4.3 | 2.1 | 0.05 | 19.6 | 238 | 46.2 | 20 | 6.9 | ||
| Benzo(a)anthracene + Chrysene | 3.1 | 1.3 | 0.12 | 24.6 | 91 | 41.4 | 18 | 5 | ||
| Benzo(b) & (k) fluoranthene | 1.6 | 0.7 | 0.18 | 11 | 41 | 19.6 | 8.3 | 2.5 | ||
| Benzo(a)pyrene | 1.3 | 0.07 | 0.07 | 10 | 62.7 | 40.2 | 13.3 | 2.8 | ||
| Ideno(1,2,3-c,d)pyrene | 0.1 | 0.1 | 0.1 | 3.9 | 31 | 11.3 | 4 | 0.9 | ||
| Dibenzo(a,h)anthracene | 0.7 | 0.7 | 0.7 | 0.7 | 0.7 | 0.7 | 0.7 | 0.7 | ||
| Benzo(g,h,i)perylene | 0.11 | 0.4 | 0.11 | 7.1 | 91 | 20.7 | 8.5 | 0.11 | ||
| Total PAH (µg/g) | 19.2 | 12.1 | 1.8 | 192.0 | 2648.4 | 499.8 | 8.5 | 0.11 |
| Station ID | 5-22 | 5-22 | 6-4 | 6-4 | 6-10 | 6-10 | 6-10 | 6-28 | 7-4 | 7-4 | |
|---|---|---|---|---|---|---|---|---|---|---|---|
| Date Sampled | 5-Aug-09 | 5-Aug-09 | 1-Oct-09 | 1-Oct-09 | 14-Jul-09 | 14-Jul-09 | 14-Jul-09 | 5-Aug-09 | 1-Oct-09 | 1-Oct-09 | |
| Depth (cm) | 11-27 | 27-37 | L0-L16 | 0-13 | 0-1 | 1-7.5 | 16-18.5 | 1-12 | L0-L18 | 0-6 | |
| LIMS Number | C173573-0013 | C173573-0014 | C173573-0015 | C173573-0016 | C171006-0019 | C173573-0017 | C173573-0018 | C171006-0018 | C173573-0019 | C173573-0020 | |
| 2009 | µg/g | µg/g | µg/g | µg/g | µg/g | µg/g | µg/g | µg/g | µg/g | µg/g | |
| Napthalene | 1.7 | 0.45 | 0.017 | 0.059 | 0.05 | 0.18 | 0.58 | 1.4 | 0.068 | 0.38 | |
| Acenapthylene | 0.74 | 0.67 | 0.057 | 0.13 | 0.12 | 0.25 | 2.4 | 0.031 | 0.31 | 1 | |
| Acenapthene | 1.4 | 0.83 | 0.021 | 0.043 | 0.068 | 0.43 | 3.1 | 0.23 | 0.18 | 0.43 | |
| Fluorene | 0.9 | 0.51 | 0.015 | 0.046 | 0.048 | 0.29 | 2.2 | 0.09 | 0.12 | 0.32 | |
| Phenanthrene | 5.6 | 4.2 | 0.21 | 0.65 | 0.49 | 1.8 | 15 | 0.3 | 1.4 | 4.3 | |
| Anthracene | 1.7 | 1.5 | 0.047 | 0.12 | 0.16 | 0.49 | 4.4 | 0.056 | 0.36 | 1.1 | |
| Fluoranthene | 3.1 | 4.4 | 0.27 | 0.63 | 0.57 | 1.3 | 9.2 | 0.27 | 1.8 | 5 | |
| Pyrene | 7.7 | 11 | 0.55 | 1.3 | 1.1 | 2.7 | 24 | 0.28 | 3.9 | 12 | |
| Benzo(a)anthracene | 2.6 | 3.3 | 0.22 | 0.48 | 0.42 | 0.95 | 8.3 | 0.097 | 1.4 | 4.9 | |
| Chrysene | 2.9 | 3.5 | 0.26 | 0.54 | 0.51 | 1 | 8.8 | 0.17 | 1.6 | 5.1 | |
| Benzo(b)fluoranthene | 1.2 | 1.3 | 0.12 | 0.23 | 0.23 | 0.43 | 4.2 | 0.12 | 0.64 | 2.2 | |
| Benzo(k)fluoranthene | 1.9 | 2.1 | 0.17 | 0.34 | 0.34 | 0.69 | 6.6 | 0.15 | 1.1 | 3.5 | |
| Benzo(e)pyrene | 2.4 | 2.5 | 0.2 | 0.4 | 0.33 | 0.76 | 7.9 | 0.11 | 1.1 | 3.7 | |
| Benzo(a)pyrene | 3.5 | 3.9 | 0.28 | 0.55 | 0.52 | 1.1 | 12 | 0.11 | 1.6 | 5.6 | |
| Perylene | 0.59 | 0.67 | 0.047 | 0.088 | 0.098 | 0.21 | 2 | 0.06 | 0.25 | 0.92 | |
| Ideno(1,2,3-c,d)pyrene | 1.6 | 1.5 | 0.12 | 0.24 | 0.31 | 0.48 | 4.6 | 0.13 | 0.71 | 2.2 | |
| Dibenzo(a,h)anthracene | 0.39 | 0.36 | 0.033 | 0.062 | 0.051 | 0.11 | 0.91 | 0.018 | 0.18 | 0.45 | |
| Benzo(g,h,i)perylene | 2.2 | 2.3 | 0.18 | 0.38 | 0.29 | 0.59 | 6.9 | 0.1 | 0.86 | 2.9 | |
| Total PAH (µg/g) | 42.1 | 45.0 | 2.8 | 6.3 | 5.7 | 13.8 | 123.1 | 3.7 | 17.6 | 56.0 | |
| 1987 | |||||||||||
| Station ID | 5-22-1 | 6-4-2 | 6-4-1 | 6-10-2 | 6-10-1 | 6-28-3 | |||||
| Depth (cm) | 15-20 | 3-11 | 11-14 | 2-36 | 42-47 | 9-16 | |||||
| Napthalene | 6.2 | 13.9 | 7.3 | 52.1 | 14.6 | 0.04 | |||||
| Acenapthylene | 0.09 | 8.2 | 2.3 | 6.1 | 0.4 | 0.09 | |||||
| Acenapthene | 1.2 | 17.2 | 4.6 | 19.8 | 3.4 | 0.05 | |||||
| Fluorene | 0.05 | 18.9 | 3.3 | 13.4 | 1.5 | 0.5 | |||||
| Phenanthrene | 1.5 | 26.3 | 12.2 | 33.8 | 1.5 | 0.5 | |||||
| Anthracene | 0.05 | 8.9 | 3.9 | 11.1 | 0.05 | 0.05 | |||||
| Fluoranthene | 0.5 | 7.4 | 4.7 | 11.4 | 1.9 | 0.2 | |||||
| Pyrene | 1.7 | 15 | 11.3 | 29.3 | 0.57 | 0.7 | |||||
| Benzo(a)anthracene + Chrysene | 0.12 | 4.5 | 8.8 | 11 | 0.12 | 0.18 | |||||
| Benzo(b) & (k) fluoranthene | 0.18 | 1 | 3.5 | 10.3 | 0.18 | 0.5 | |||||
| Benzo(a)pyrene | 0.07 | 7 | 5.5 | 16.1 | 0.07 | 0.07 | |||||
| Ideno(1,2,3-c,d)pyrene | 0.1 | 2.4 | 2.2 | 5.7 | 0.1 | 0.1 | |||||
| Dibenzo(a,h)anthracene | 0.7 | 0.7 | 0.7 | 0.7 | 0.7 | 0.7 | |||||
| Benzo(g,h,i)perylene | 0.11 | 2.8 | 3.8 | 12 | 0.11 | 0.11 | |||||
| Total PAH (µg/g) | 12.6 | 134.2 | 74.1 | 232.7 | 25.2 | 3.3 |
| Station ID | 7-4 | 7-10 | 7-10 | 7-10 | 7-10 | 7-10 | 7-20 | 7-20 | 7-20 | 7-20 |
|---|---|---|---|---|---|---|---|---|---|---|
| Date Sampled | 1-Oct-09 | 14-Jul-09 | 14-Jul-09 | 14-Jul-09 | 14-Jul-09 | 14-Jul-09 | 18-Aug-09 | 18-Aug-09 | 18-Aug-09 | 18-Aug-09 |
| Depth (cm) | 6-24 | 0-1.5 | 1.5-12.5 | 12.5-18.5 | 18.5-25 | 25-30 | 0-12 | 12-42 | 42-43 | 43-50.5 |
| LIMS Number | C173573-0021 | C171006-0017 | C173573-0022 | C173573-0023 | C173573-0024 | C173573-0025 | C171006-0028 | C173573-0026 | C173573-0027 | C173573-0028 |
| 2009 | µg/g | µg/g | µg/g | µg/g | µg/g | µg/g | µg/g | µg/g | µg/g | µg/g |
| Napthalene | 0.16 | 0.14 | 1.2 | 0.71 | 8.8 | 3.5 | 0.044 | 0.4 | 0.3 | 0.29 |
| Acenapthylene | 0.48 | 0.17 | 1 | 1.2 | 2.5 | 2 | 0.01 | 1.1 | 0.099 | 1.3 |
| Acenapthene | 0.47 | 0.22 | 1.7 | 1 | 8.1 | 8.1 | 0.017 | 1.2 | 0.41 | 1.6 |
| Fluorene | 0.35 | 0.15 | 0.96 | 0.48 | 6.1 | 6.3 | 0.017 | 0.99 | 0.27 | 0.98 |
| Phenanthrene | 2.6 | 0.85 | 4.9 | 4.1 | 28 | 32 | 0.11 | 6.4 | 1.4 | 7.2 |
| Anthracene | 0.84 | 0.27 | 1.5 | 1.5 | 6.9 | 9 | 0.022 | 1.9 | 0.4 | 2.1 |
| Fluoranthene | 2.4 | 0.68 | 2.8 | 4.8 | 16 | 20 | 0.19 | 3.8 | 0.51 | 4.9 |
| Pyrene | 4.9 | 1.4 | 5.9 | 12 | 43 | 50 | 0.21 | 12 | 1.4 | 11 |
| Benzo(a)anthracene | 2.2 | 0.5 | 2.7 | 4.5 | 13 | 15 | 0.074 | 3.9 | 0.26 | 4.4 |
| Chrysene | 2.3 | 0.61 | 3 | 4.7 | 13 | 15 | 0.13 | 4.4 | 0.34 | 4.8 |
| Benzo(b)fluoranthene | 0.99 | 0.3 | 1.7 | 2.1 | 5.5 | 7.2 | 0.086 | 1.9 | 0.16 | 2 |
| Benzo(k)fluoranthene | 1.6 | 0.44 | 2.7 | 3.5 | 10 | 13 | 0.099 | 3.2 | 0.24 | 3.4 |
| Benzo(e)pyrene | 1.7 | 0.46 | 3.2 | 3.9 | 9.8 | 13 | 0.082 | 3.2 | 0.24 | 3.9 |
| Benzo(a)pyrene | 2.6 | 0.69 | 4.4 | 5.9 | 16 | 21 | 0.098 | 4.9 | 0.33 | 5.9 |
| Perylene | 0.4 | 0.15 | 0.68 | 1.3 | 2 | 3 | 0.045 | 0.73 | 0.11 | 0.83 |
| Ideno(1,2,3-c,d)pyrene | 0.95 | 0.35 | 2.2 | 2.4 | 6.5 | 8.8 | 0.097 | 2.1 | 0.15 | 2.6 |
| Dibenzo(a,h)anthracene | 0.23 | 0.078 | 0.46 | 0.51 | 1.6 | 2.3 | 0.012 | 0.52 | 0.038 | 0.63 |
| Benzo(g,h,i)perylene | 1.3 | 0.4 | 2.8 | 3.2 | 8.3 | 11 | 0.083 | 2.6 | 0.2 | 3 |
| Total PAH (µg/g) | 26.5 | 7.9 | 43.8 | 57.8 | 205.1 | 240.2 | 1.4 | 55.2 | 6.9 | 60.8 |
| 1987 | ||||||||||
| Station ID | 7-10-3 | 7-10-2 | 7-10-1 | 7-20-3 | 7-20-2 | 7-20-1 | ||||
| Depth (cm) | 2-38 | 40-69 | 70-100 | 2-32 | 35-55 | 57-65 | ||||
| Napthalene | 15.7 | 15.1 | 0.04 | 2.9 | 2.1 | 3.7 | ||||
| Acenapthylene | 2.3 | 2.8 | 0.09 | 2.8 | 2.5 | 5 | ||||
| Acenapthene | 11.2 | 6 | 0.8 | 6.4 | 5.8 | 4.7 | ||||
| Fluorene | 6.5 | 39.6 | 0.05 | 3.9 | 4.5 | 1.6 | ||||
| Phenanthrene | 14.8 | 59.3 | 0.6 | 12.2 | 13.3 | 6.1 | ||||
| Anthracene | 6.7 | 19.7 | 0.05 | 7 | 4.5 | 0.2 | ||||
| Fluoranthene | 60 | 5.5 | 0.3 | 7 | 9.4 | 2.2 | ||||
| Pyrene | 12.6 | 10.9 | 1 | 15 | 13.3 | 5 | ||||
| Benzo(a)anthracene + Chrysene | 7.7 | 71 | 0.12 | 9.8 | 9.9 | 3.1 | ||||
| Benzo(b) & (k) fluoranthene | 3.9 | 14 | 0.4 | 4.6 | 2.5 | 1.6 | ||||
| Benzo(a)pyrene | 5.1 | 24 | 0.07 | 6.6 | 8.8 | 1.8 | ||||
| Ideno(1,2,3-c,d)pyrene | 1.5 | 8.2 | 0.1 | 2 | 2.4 | 0.7 | ||||
| Dibenzo(a,h)anthracene | 0.7 | 0.7 | 0.7 | 0.7 | 0.7 | 0.8 | ||||
| Benzo(g,h,i)perylene | 2.3 | 14.3 | 0.11 | 0.11 | 3.9 | 0.8 | ||||
| Total PAH (µg/g) | 151.0 | 291.1 | 4.4 | 81.0 | 83.6 | 37.3 |
| Station ID | 8-4 | 8-4 | 8-4 | 8-10 | 8-10 | 8-10 | 8-10 | 8-22 | 8-22 | 8-22 |
|---|---|---|---|---|---|---|---|---|---|---|
| Date Sampled | 1-Oct-09 | 1-Oct-09 | 1-Oct-09 | 14-Jul-09 | 14-Jul-09 | 14-Jul-09 | 14-Jul-09 | 15-Jul-09 | 15-Jul-09 | 15-Jul-09 |
| Depth (cm) | L0-L8.5 | 0-4 | 4-14 | 0-4.5 | 4.5-9.5 | 9.5-26.5 | 26.5-36 | 0-11 | 11-24.5 | 24.5-54.5 |
| LIMS Number | C173573-0029 | C173573-0030 | C173573-0031 | C171006-0016 | C173573-0032 | C173573-0033 | C173573-0034 | C171006-0015 | C173573-0035 | C173573-0036 |
| 2009 | µg/g | µg/g | µg/g | µg/g | µg/g | µg/g | µg/g | µg/g | µg/g | µg/g |
| Napthalene | 0.16 | 0.11 | 0.015 | 0.18 | 0.44 | 1.9 | 0.085 | 0.029 | 0.02 | 0.14 |
| Acenapthylene | 0.69 | 0.15 | 0.063 | 0.28 | 0.7 | 2.1 | 0.15 | 0.009 | 0.058 | 0.31 |
| Acenapthene | 0.38 | 0.14 | 0.038 | 0.54 | 0.64 | 4 | 0.25 | 0.055 | 0.032 | 0.34 |
| Fluorene | 0.26 | 0.055 | 0.026 | 0.48 | 0.35 | 3.1 | 0.14 | 0.034 | 0.022 | 0.24 |
| Phenanthrene | 2.9 | 0.57 | 0.25 | 3 | 3.1 | 15 | 0.8 | 0.15 | 0.21 | 1.2 |
| Anthracene | 0.64 | 0.16 | 0.07 | 0.96 | 1 | 4.1 | 0.25 | 0.02 | 0.062 | 0.36 |
| Fluoranthene | 2.8 | 0.66 | 0.29 | 1.7 | 3.3 | 7.5 | 0.54 | 0.21 | 0.24 | 0.95 |
| Pyrene | 6.1 | 1.5 | 0.62 | 3.5 | 7.6 | 19 | 1.2 | 0.21 | 0.51 | 2.3 |
| Benzo(a)anthracene | 2.8 | 0.59 | 0.24 | 1.1 | 2.9 | 7.2 | 0.44 | 0.068 | 0.19 | 0.9 |
| Chrysene | 3 | 0.63 | 0.28 | 1.2 | 3 | 7.8 | 0.5 | 0.14 | 0.22 | 1 |
| Benzo(b)fluoranthene | 1.3 | 0.27 | 0.12 | 0.47 | 1.3 | 3.5 | 0.26 | 0.089 | 0.11 | 0.48 |
| Benzo(k)fluoranthene | 2.1 | 0.43 | 0.2 | 0.75 | 2.1 | 5.8 | 0.4 | 0.1 | 0.17 | 0.78 |
| Benzo(e)pyrene | 2.2 | 0.46 | 0.2 | 0.73 | 2.2 | 6.8 | 0.55 | 0.079 | 0.17 | 0.81 |
| Benzo(a)pyrene | 3.5 | 0.67 | 0.3 | 1.2 | 3.6 | 9.8 | 0.73 | 0.095 | 0.25 | 1.2 |
| Perylene | 0.47 | 0.097 | 0.05 | 0.22 | 0.5 | 1.4 | 0.13 | 0.064 | 0.072 | 0.21 |
| Ideno(1,2,3-c,d)pyrene | 1.5 | 0.26 | 0.12 | 0.55 | 1.3 | 4.3 | 0.31 | 0.094 | 0.12 | 0.49 |
| Dibenzo(a,h)anthracene | 0.35 | 0.065 | 0.028 | 0.12 | 0.32 | 1 | 0.078 | 0.014 | 0.025 | 0.13 |
| Benzo(g,h,i)perylene | 1.7 | 0.34 | 0.15 | 0.61 | 1.7 | 5.1 | 0.39 | 0.076 | 0.14 | 0.6 |
| Total PAH (µg/g) | 32.9 | 7.2 | 3.1 | 17.6 | 36.1 | 109.4 | 7.2 | 1.5 | 2.6 | 12.4 |
| 1987 | ||||||||||
| Station ID | 8-4-1 | 8-10-2 | 8-10-1 | 8-22-3 | 8-22-2 | |||||
| Depth (cm) | 58-64 | 2-10 | 13-69 | 23-39 | 42-68 | |||||
| Napthalene | 0.04 | 4.7 | 33.5 | 3.6 | 0.4 | |||||
| Acenapthylene | 0.09 | 0.8 | 10.2 | 0.8 | 0.6 | |||||
| Acenapthene | 0.05 | 2.7 | 41 | 2.6 | 0.3 | |||||
| Fluorene | 0.05 | 2.1 | 66.5 | 2.1 | 0.4 | |||||
| Phenanthrene | 0.14 | 6.4 | 56.7 | 1.1 | 2 | |||||
| Anthracene | 0.05 | 2 | 18.9 | 2 | 0.6 | |||||
| Fluoranthene | 0.2 | 1.6 | 25.6 | 2.6 | 1.1 | |||||
| Pyrene | 0.2 | 1.6 | 25.6 | 2.6 | 1.1 | |||||
| Benzo(a)anthracene + Chrysene | 0.12 | 1.9 | 41 | 4.3 | 1.6 | |||||
| Benzo(b) & (k) fluoranthene | 0.18 | 0.8 | 19 | 2.1 | 0.8 | |||||
| Benzo(a)pyrene | 0.07 | 1 | 20.2 | 0.07 | 1 | |||||
| Ideno(1,2,3-c,d)pyrene | 0.1 | 0.1 | 5.6 | 0.1 | 0.5 | |||||
| Dibenzo(a,h)anthracene | 0.7 | 0.7 | 0.7 | 0.7 | 0.7 | |||||
| Benzo(g,h,i)perylene | 0.11 | 0.11 | 9.9 | 0.11 | 1 | |||||
| Total PAH (µg/g) | 2.1 | 28.5 | 361.8 | 28.7 | 13.2 |
| Station ID | 8-22 | 9-4 | 9-4 | 9-10 | 9-10 | 9-24 | 9-24 | 9-30 | 9-30 | 10-28 |
|---|---|---|---|---|---|---|---|---|---|---|
| Date Sampled | 15-Jul-09 | 1-Oct-09 | 1-Oct-09 | 24-Jul-09 | 24-Jun-09 | 10-Jul-09 | 10-Jul-09 | 6-Aug-09 | 6-Aug-09 | 6-Aug-09 |
| Depth (cm) | 54.5-58 | L0-L16 | 0-12 | 0-5 | 5-24 | 0-5 | 19-25.5 | 0-2.5 | 2.5-42 | 0-7.5 |
| LIMS Number | C173573-0037 | C173573-0038 | C173573-0039 | C171006-0014 | C173573-0040 | C171006-0013 | C173573-0041 | C171006-0012 | C173573-0042 | C171006-0011 |
| 2009 | µg/g | µg/g | µg/g | µg/g | µg/g | µg/g | µg/g | µg/g | µg/g | µg/g |
| Napthalene | 0.15 | 0.0095 | 0.11 | 0.08 | 0.043 | 0.026 | 0.095 | 0.021 | 0.17 | 0.041 |
| Acenapthylene | 1.1 | 0.063 | 0.081 | 0.41 | 0.17 | 0.021 | 0.77 | 0.01 | 0.3 | 0.017 |
| Acenapthene | 0.72 | 0.02 | 0.049 | 0.28 | 0.047 | 0.022 | 0.9 | 0.011 | 0.16 | 0.024 |
| Fluorene | 0.41 | 0.019 | 0.038 | 0.25 | 0.045 | 0.024 | 0.74 | 0.013 | 0.13 | 0.022 |
| Phenanthrene | 3.2 | 0.22 | 0.65 | 1.9 | 0.59 | 0.14 | 5.2 | 0.095 | 1.3 | 0.13 |
| Anthracene | 1.1 | 0.051 | 0.1 | 0.56 | 0.17 | 0.033 | 1.4 | 0.021 | 0.34 | 0.03 |
| Fluoranthene | 4.8 | 0.28 | 0.74 | 1.9 | 0.75 | 0.18 | 2.5 | 0.16 | 1.4 | 0.18 |
| Pyrene | 12 | 0.58 | 1.7 | 4 | 1.6 | 0.23 | 5.7 | 0.19 | 2.9 | 0.23 |
| Benzo(a)anthracene | 3.9 | 0.26 | 0.52 | 1.7 | 0.68 | 0.083 | 2.2 | 0.07 | 1 | 0.09 |
| Chrysene | 4.4 | 0.31 | 0.64 | 1.9 | 0.8 | 0.12 | 2.6 | 0.11 | 1.2 | 0.13 |
| Benzo(b)fluoranthene | 1.7 | 0.12 | 0.23 | 0.79 | 0.33 | 0.073 | 1.1 | 0.068 | 0.51 | 0.076 |
| Benzo(k)fluoranthene | 2.9 | 0.2 | 0.37 | 1.3 | 0.54 | 0.088 | 1.8 | 0.082 | 0.83 | 0.095 |
| Benzo(e)pyrene | 3 | 0.19 | 0.42 | 1.3 | 0.54 | 0.079 | 2.1 | 0.07 | 0.77 | 0.08 |
| Benzo(a)pyrene | 4.8 | 0.3 | 0.55 | 2.1 | 0.83 | 0.1 | 3.3 | 0.088 | 1.2 | 0.11 |
| Perylene | 0.8 | 0.063 | 0.11 | 0.37 | 0.21 | 0.05 | 0.52 | 0.048 | 0.27 | 0.061 |
| Ideno(1,2,3-c,d)pyrene | 2.3 | 0.15 | 0.28 | 1.1 | 0.42 | 0.087 | 1.4 | 0.077 | 0.6 | 0.091 |
| Dibenzo(a,h)anthracene | 0.42 | 0.028 | 0.055 | 0.2 | 0.08 | 0.013 | 0.31 | 0.012 | 0.12 | 0.014 |
| Benzo(g,h,i)perylene | 2.9 | 0.19 | 0.38 | 1.1 | 0.52 | 0.073 | 2 | 0.067 | 0.74 | 0.074 |
| Total PAH (µg/g) | 50.6 | 3.1 | 7.0 | 21.2 | 8.4 | 1.4 | 34.6 | 1.2 | 13.9 | 1.5 |
| 1987 | ||||||||||
| Station ID | 8-22-1 | 9-10-2 | 9-24-2 | 9-24-1 | 9-30-1 | 10-28-2 | ||||
| Depth (cm) | 70-79 | 2-30 | 2-65 | 69-74 | 33-66 | 23-44 | ||||
| Napthalene | 219.6 | 0.04 | 13.1 | 9.4 | 0.04 | 1.5 | ||||
| Acenapthylene | 46.3 | 0.3 | 5.8 | 1.7 | 0.3 | 1.8 | ||||
| Acenapthene | 90.6 | 0.6 | 18.5 | 8.4 | 0.3 | 2.8 | ||||
| Fluorene | 72.2 | 0.4 | 4.4 | 5.1 | 0.7 | 2.1 | ||||
| Phenanthrene | 51.7 | 1.7 | 6.6 | 10.1 | 1.4 | 2.1 | ||||
| Anthracene | 64.3 | 0.1 | 2.3 | 4.5 | 0.05 | 3.5 | ||||
| Fluoranthene | 59.2 | 1 | 13 | 4.8 | 0.9 | 4.1 | ||||
| Pyrene | 134 | 2.1 | 9.9 | 12.2 | 2.5 | 10 | ||||
| Benzo(a)anthracene + Chrysene | 61 | 1.6 | 21 | 6.7 | 1.8 | 5.3 | ||||
| Benzo(b) & (k) fluoranthene | 33.3 | 1.1 | 9.3 | 2.8 | 1.2 | 2.7 | ||||
| Benzo(a)pyrene | 52.1 | 0.07 | 9.3 | 3.9 | 0.07 | 5.5 | ||||
| Ideno(1,2,3-c,d)pyrene | 6.9 | 0.1 | 2.8 | 0.8 | 0.1 | 1.3 | ||||
| Dibenzo(a,h)anthracene | 0.7 | 0.7 | 0.7 | 0.7 | 0.7 | 0.7 | ||||
| Benzo(g,h,i)perylene | 17.2 | 0.11 | 4 | 1.2 | 0.11 | 1.9 | ||||
| Total PAH (µg/g) | 909.1 | 9.9 | 120.7 | 72.3 | 10.2 | 45.3 |
| Station ID | 10-28 | 10-28 | 10-50 | 10-50 | 10-50 | 12-8 | 12-8 | 12-8 | 13-4 | 13-4 |
|---|---|---|---|---|---|---|---|---|---|---|
| Date Sampled | 6-Aug-09 | 6-Aug-09 | 11-Aug-09 | 11-Aug-09 | 11-Aug-09 | 11-Aug-09 | 15-Jul-09 | 15-Jul-09 | 11-Aug-09 | 15-Jul-09 |
| Depth (cm) | 7.5-33 | 33-37.5 | 0-7.5 | 7.5-10 | 10-25.5 | 0-9.5 | 9.5-18 | 29-35 | 0-6.5 | 6.5-22 |
| LIMS Number | C173573-0043 | C173573-0044 | C171006-0010 | C173573-0045 | C173573-0046 | C171006-0009 | C173573-0047 | C173573-0048 | C171006-0008 | C173573-0049 |
| 2009 | µg/g | µg/g | µg/g | µg/g | µg/g | µg/g | µg/g | µg/g | µg/g | µg/g |
| Napthalene | 0.048 | 0.035 | 0.013 | 0.05 | 0.088 | 0.024 | 0.056 | 0.48 | 0.018 | 0.086 |
| Acenapthylene | 0.048 | 0.065 | 0.0052 | 0.02 | 0.19 | 0.022 | 0.26 | 0.51 | 0.012 | 0.21 |
| Acenapthene | 0.032 | 0.045 | 0.005 | 0.059 | 0.067 | 0.024 | 0.11 | 1.2 | 0.01 | 0.091 |
| Fluorene | 0.026 | 0.044 | 0.0092 | 0.05 | 0.077 | 0.022 | 0.086 | 0.83 | 0.013 | 0.079 |
| Phenanthrene | 0.23 | 0.31 | 0.065 | 0.29 | 0.68 | 0.13 | 0.88 | 4.4 | 0.082 | 0.7 |
| Anthracene | 0.052 | 0.086 | 0.01 | 0.065 | 0.19 | 0.033 | 0.26 | 1.2 | 0.016 | 0.21 |
| Fluoranthene | 0.26 | 0.31 | 0.13 | 0.13 | 0.63 | 0.15 | 1 | 2 | 0.14 | 0.65 |
| Pyrene | 0.43 | 0.65 | 0.11 | 0.25 | 1.3 | 0.21 | 2.3 | 4.6 | 0.16 | 1.6 |
| Benzo(a)anthracene | 0.16 | 0.23 | 0.04 | 0.068 | 0.51 | 0.08 | 1 | 1.7 | 0.057 | 0.72 |
| Chrysene | 0.23 | 0.29 | 0.088 | 0.11 | 0.71 | 0.11 | 1.2 | 2 | 0.11 | 0.87 |
| Benzo(b)fluoranthene | 0.12 | 0.13 | 0.062 | 0.051 | 0.39 | 0.062 | 0.57 | 0.91 | 0.071 | 0.38 |
| Benzo(k)fluoranthene | 0.17 | 0.2 | 0.068 | 0.068 | 0.61 | 0.083 | 0.81 | 1.5 | 0.082 | 0.64 |
| Benzo(e)pyrene | 0.16 | 0.2 | 0.054 | 0.067 | 0.56 | 0.075 | 0.85 | 1.7 | 0.066 | 0.67 |
| Benzo(a)pyrene | 0.21 | 0.29 | 0.057 | 0.082 | 0.77 | 0.11 | 1.3 | 2.4 | 0.08 | 1.1 |
| Perylene | 0.17 | 0.13 | 0.042 | 0.045 | 0.22 | 0.054 | 0.27 | 0.46 | 0.042 | 0.18 |
| Ideno(1,2,3-c,d)pyrene | 0.13 | 0.15 | 0.067 | 0.047 | 0.46 | 0.075 | 0.56 | 1.2 | 0.083 | 0.49 |
| Dibenzo(a,h)anthracene | 0.022 | 0.028 | 0.009 | 0.0096 | 0.11 | 0.012 | 0.13 | 0.25 | 0.012 | 0.11 |
| Benzo(g,h,i)perylene | 0.17 | 0.19 | 0.055 | 0.063 | 0.57 | 0.067 | 0.8 | 1.6 | 0.069 | 0.68 |
| Total PAH (µg/g) | 2.7 | 3.4 | 0.9 | 1.5 | 8.1 | 1.3 | 12.4 | 28.9 | 1.1 | 9.5 |
| 1987 | ||||||||||
| Station ID | 10-28-1 | 10-50-2 | 12-8-1 | 13-4-2 | ||||||
| Depth (cm) | 48-56 | 2-22 | 2-79 | 2-45 | ||||||
| Napthalene | 0.04 | 0.09 | 0.4 | 0.04 | ||||||
| Acenapthylene | 0.09 | 0.09 | 0.4 | 0.09 | ||||||
| Acenapthene | 0.05 | 0.05 | 0.7 | 0.05 | ||||||
| Fluorene | 0.05 | 0.05 | 0.7 | 0.3 | ||||||
| Phenanthrene | 0.2 | 0.14 | 3.1 | 0.14 | ||||||
| Anthracene | 0.05 | 0.05 | 1 | 0.05 | ||||||
| Fluoranthene | 0.2 | 0.2 | 1.6 | 0.6 | ||||||
| Pyrene | 0.5 | 0.4 | 2 | 1.4 | ||||||
| Benzo(a)anthracene + Chrysene | 0.12 | 0.12 | 1.9 | 0.12 | ||||||
| Benzo(b) & (k) fluoranthene | 0.18 | 0.2 | 1.1 | 0.6 | ||||||
| Benzo(a)pyrene | 0.7 | 0.7 | 0.7 | 0.7 | ||||||
| Ideno(1,2,3-c,d)pyrene | 0.1 | 0.1 | 0.1 | 0.1 | ||||||
| Dibenzo(a,h)anthracene | 0.7 | 0.7 | 0.7 | 0.7 | ||||||
| Benzo(g,h,i)perylene | 0.11 | 0.11 | 0.11 | 0.11 | ||||||
| Total PAH (µg/g) | 2.5 | 2.3 | 13.5 | 4.4 |
| Station ID | 13-4 | 13-4 | 13-20 | 13-20 | 13-20 | 50-5 | 50-5 | 50-15 | 50-15 | 99-10 |
|---|---|---|---|---|---|---|---|---|---|---|
| Date Sampled | 15-Jul-09 | 15-Jul-09 | 11-Aug-09 | 11-Aug-09 | 11-Aug-09 | 11-Aug-09 | 11-Aug-09 | 12-Aug-09 | 12-Aug-09 | 12-Aug-09 |
| Depth (cm) | 32-41 | 56.5-58 | 0-2 | 2-23.5 | 23.5-25.5 | 0-3.5 | 3.5-14 | 0-9 | 9-27 | 0-9 |
| LIMS Number | C173573-0050 | C173573-0051 | C171006-0007 | C173573-0052 | C173573-0053 | C171006-0006 | C173573-0054 | C171006-0005 | C173573-0055 | C171006-0004 |
| 2009 | µg/g | µg/g | µg/g | µg/g | µg/g | µg/g | µg/g | µg/g | µg/g | µg/g |
| Napthalene | 0.34 | 1.4 | 0.016 | 0.15 | 5.3 | 0.018 | 0.094 | 0.014 | 0.1 | 0.0064 |
| Acenapthylene | 0.36 | 1.2 | 0.0067 | 0.015 | 0.033 | 0.019 | 0.039 | 0.005 | 0.082 | 0.002 |
| Acenapthene | 0.27 | 0.8 | 0.0058 | 0.017 | 0.91 | 0.012 | 0.022 | 0.0033 | 0.021 | 0.0048 |
| Fluorene | 0.19 | 0.72 | 0.009 | 0.017 | 0.39 | 0.019 | 0.035 | 0.0085 | 0.05 | 0.008 |
| Phenanthrene | 1.1 | 6.8 | 0.069 | 0.079 | 0.6 | 0.13 | 0.22 | 0.057 | 0.3 | 0.043 |
| Anthracene | 0.36 | 2.3 | 0.013 | 0.019 | 0.075 | 0.03 | 0.047 | 0.0079 | 0.075 | 0.0064 |
| Fluoranthene | 0.73 | 5 | 0.12 | 0.12 | 0.3 | 0.19 | 0.31 | 0.12 | 0.36 | 0.081 |
| Pyrene | 1.9 | 14 | 0.12 | 0.17 | 0.46 | 0.25 | 0.41 | 0.1 | 0.5 | 0.067 |
| Benzo(a)anthracene | 0.85 | 4.9 | 0.048 | 0.058 | 0.14 | 0.092 | 0.14 | 0.037 | 0.21 | 0.024 |
| Chrysene | 1.1 | 5.8 | 0.088 | 0.1 | 0.2 | 0.14 | 0.24 | 0.083 | 0.35 | 0.048 |
| Benzo(b)fluoranthene | 0.53 | 2.5 | 0.06 | 0.062 | 0.1 | 0.082 | 0.15 | 0.062 | 0.24 | 0.032 |
| Benzo(k)fluoranthene | 0.89 | 4.2 | 0.068 | 0.074 | 0.14 | 0.1 | 0.19 | 0.066 | 0.3 | 0.036 |
| Benzo(e)pyrene | 1.1 | 5.4 | 0.054 | 0.068 | 0.11 | 0.086 | 0.16 | 0.055 | 0.26 | 0.027 |
| Benzo(a)pyrene | 1.5 | 7.1 | 0.063 | 0.077 | 0.17 | 0.11 | 0.19 | 0.054 | 0.29 | 0.03 |
| Perylene | 0.26 | 1.2 | 0.037 | 0.13 | 0.11 | 0.073 | 0.3 | 0.038 | 0.22 | 0.026 |
| Ideno(1,2,3-c,d)pyrene | 0.82 | 4.2 | 0.066 | 0.061 | 0.1 | 0.093 | 0.16 | 0.066 | 0.24 | 0.037 |
| Dibenzo(a,h)anthracene | 0.17 | 0.72 | 0.008 | 0.01 | 0.019 | 0.014 | 0.028 | 0.008 | 0.049 | 0.0069 |
| Benzo(g,h,i)perylene | 1.1 | 5.5 | 0.053 | 0.064 | 0.11 | 0.08 | 0.17 | 0.056 | 0.25 | 0.024 |
| Total PAH (µg/g) | 13.6 | 73.7 | 0.9 | 1.3 | 9.3 | 1.5 | 2.9 | 0.8 | 3.9 | 0.5 |
| 1987 | ||||||||||
| Station ID | 13-4-1 | 13-20-2 | 50-5-1 | 50-15-2 | 50-15-1 | 99-10-1 | ||||
| Depth (cm) | 47-77 | 42-62 | 28-35 | 1-10 | 12-29 | 36-43 | ||||
| Napthalene | 8.6 | 0.04 | 0.04 | 0.04 | 0.04 | 0.04 | ||||
| Acenapthylene | 3.8 | 0.2 | 0.09 | 0.09 | 0.09 | 0.09 | ||||
| Acenapthene | 8.7 | 0.05 | 0.05 | 0.05 | 0.05 | 0.05 | ||||
| Fluorene | 6.3 | 0.05 | 0.05 | 0.05 | 0.05 | 0.05 | ||||
| Phenanthrene | 21 | 0.3 | 0.3 | 0.14 | 0.14 | 0.14 | ||||
| Anthracene | 5.4 | 0.05 | 0.05 | 0.05 | 0.05 | 0.05 | ||||
| Fluoranthene | 7.9 | 0.3 | 0.06 | 0.06 | 0.06 | 0.06 | ||||
| Pyrene | 15 | 0.6 | 0.25 | 0.05 | 0.05 | 0.05 | ||||
| Benzo(a)anthracene + Chrysene | 10.5 | 0.5 | 0.3 | 0.12 | 0.12 | 0.12 | ||||
| Benzo(b) & (k) fluoranthene | 5.9 | 0.3 | 0.25 | 0.18 | 0.18 | 0.18 | ||||
| Benzo(a)pyrene | 12.1 | 0.07 | 0.07 | 0.07 | 0.07 | 0.07 | ||||
| Ideno(1,2,3-c,d)pyrene | 3.6 | 0.1 | 0.1 | 0.1 | 0.1 | 0.1 | ||||
| Dibenzo(a,h)anthracene | 0.7 | 0.7 | 0.7 | 0.7 | 0.7 | 0.7 | ||||
| Benzo(g,h,i)perylene | 5.4 | 0.11 | 0.11 | 0.11 | 0.11 | 0.11 | ||||
| Total PAH (µg/g) | 114.9 | 3.4 | 2.4 | 1.8 | 1.8 | 1.8 |
| Station ID | 99-20 | 100-10 | 100-20 | 100-20 | NDG-01 | NDG-01 | NDG-01 |
|---|---|---|---|---|---|---|---|
| Date Sampled | 12-Aug-09 | 12-Aug-09 | 12-Aug-09 | 12-Aug-09 | 24-Sep-09 | 24-Sep-09 | 24-Sep-09 |
| Depth (cm) | 0-7 | 0-11 | 0-14 | 14-19 | 0-8.5 | 8.5-19 | 19-30 |
| LIMS Number | C171006-0003 | C171006-0002 | C171006-0001 | C173573-0056 | C173573-0057 | C173573-0058 | C173573-0059 |
| 2009 | µg/g | µg/g | µg/g | µg/g | µg/g | µg/g | µg/g |
| Napthalene | 0 | 0 | 0 | 0.011 | 3.6 | 9.7 | 73 |
| Acenapthylene | 0 | 0 | 0 | 0.0022 | 4.1 | 6.2 | 11 |
| Acenapthene | 0 | 0 | 0 | 0.0036 | 6.2 | 18 | 35 |
| Fluorene | 0 | 0 | 0 | 0.006 | 5.1 | 16 | 54 |
| Phenanthrene | 0 | 0 | 0 | 0.031 | 28 | 79 | 240 |
| Anthracene | 0 | 0 | 0 | 0.0052 | 7.7 | 22 | 72 |
| Fluoranthene | 0 | 0 | 0 | 0.036 | 15 | 31 | 49 |
| Pyrene | 0 | 0 | 0 | 0.045 | 43 | 99 | 160 |
| Benzo(a)anthracene | 0 | 0 | 0 | 0.015 | 15 | 27 | 48 |
| Chrysene | 0 | 0 | 0 | 0.027 | 17 | 29 | 41 |
| Benzo(b)fluoranthene | 0 | 0 | 0 | 0.017 | 6.9 | 11 | 19 |
| Benzo(k)fluoranthene | 0 | 0 | 0 | 0.018 | 12 | 19 | 36 |
| Benzo(e)pyrene | 0 | 0 | 0 | 0.017 | 11 | 11 | 32 |
| Benzo(a)pyrene | 0 | 0 | 0 | 0.017 | 19 | 30 | |
| Perylene | 0 | 0 | 0 | 0.016 | 2.3 | 3.8 | 7.4 |
| Ideno(1,2,3-c,d)pyrene | 0 | 0 | 0 | 0.013 | 8.9 | 14 | 28 |
| Dibenzo(a,h)anthracene | 0 | 0 | 0 | 0.002 | 1.7 | 2.6 | 4.5 |
| Benzo(g,h,i)perylene | 0 | 0 | 0 | 0.018 | 12 | 18 | 29 |
| Total PAH (µg/g) | 0.0 | 0.0 | 0.0 | 0.3 | 218.5 | 453.3 | 1001.9 |
| 1987 | |||||||
| Station ID | 99-20-1 | 100-20-2 | 100-20-1 | ||||
| Depth (cm) | 10-36 | 12-18 | 20-38 | ||||
| Napthalene | 0.04 | 0.04 | 0.04 | ||||
| Acenapthylene | 0.09 | 0.09 | 0.09 | ||||
| Acenapthene | 0.05 | 0.05 | 0.05 | ||||
| Fluorene | 0.05 | 0.05 | 0.05 | ||||
| Phenanthrene | 0.14 | 0.14 | 0.14 | ||||
| Anthracene | 0.05 | 0.05 | 0.05 | ||||
| Fluoranthene | 0.06 | 0.06 | 0.06 | ||||
| Pyrene | 0.05 | 0.05 | 0.05 | ||||
| Benzo(a)anthracene + Chrysene | 0.12 | 0.12 | 0.12 | ||||
| Benzo(b) & (k) fluoranthene | 0.18 | 0.18 | 0.18 | ||||
| Benzo(a)pyrene | 0.07 | 0.07 | 0.07 | ||||
| Ideno(1,2,3-c,d)pyrene | 0.1 | 0.1 | 0.1 | ||||
| Dibenzo(a,h)anthracene | 0.7 | 0.7 | 0.7 | ||||
| Benzo(g,h,i)perylene | 0.11 | 0.11 | 0.11 | ||||
| Total PAH (µg/g) | 1.8 | 1.8 | 1.8 |
Appendix 5: Depth contours and visual contamination observations
| Distance(m) | Transect 3 | Transect 4 | Transect 5 | Transect 6 | Transect 7 | Transect 8 | Transect 9 | Transect 10 |
|---|---|---|---|---|---|---|---|---|
| 1 | 0.0 | 0.0 | 0.1 | 0.0 | 0.0 | 0.0 | 0.0 | 0.1 |
| 2 | 0.0 | 0.0 | 0.1 | 0.0 | 0.0 | 0.0 | 0.0 | 0.5 |
| 3 | 0.4 | 0.0 | 0.2 | 0.0 | 0.0 | 0.0 | 0.0 | 0.5 |
| 4 | 0.5 | 0.0 | 0.2 | 0.0 | 0.0 | 0.0 | 0.0 | 0.5 |
| 5 | 0.6 | 0.4 | 0.3 | 0.0 | 0.0 | 0.1 | 0.0 | 0.6 |
| 6 | 0.6 | 0.5 | 0.3 | 0.0 | 0.0 | 0.4 | 0.0 | 0.5 |
| 7 | 0.7 | 0.6 | 0.4 | 0.0 | 0.1 | 0.5 | 0.0 | 0.5 |
| 8 | 0.8 | 0.7 | 0.5 | 0.0 | 0.4 | 0.5 | 0.3 | 0.6 |
| 9 | 0.8 | 0.8 | 0.5 | 0.3 | 0.4 | 0.5 | 0.4 | 0.6 |
| 10 | 0.9 | 0.8 | 0.6 | 0.4 | 0.6 | 0.5 | 0.4 | 0.6 |
| 11 | 0.9 | 0.9 | 0.5 | 0.4 | 0.7 | 0.4 | 0.5 | 0.6 |
| 12 | 1.2 | 1.0 | 0.6 | 0.4 | 0.6 | 0.5 | 0.5 | 0.6 |
| 13 | 1.5 | 1.1 | 0.7 | 0.4 | 0.5 | 0.6 | 0.5 | 0.6 |
| 14 | 1.5 | 0.8 | 0.5 | 0.6 | 0.6 | 0.5 | 0.6 | |
| 15 | 0.8 | 0.6 | 0.6 | 0.6 | 0.5 | 0.6 | ||
| 16 | 0.8 | 0.6 | 0.6 | 0.6 | 0.5 | 0.6 | ||
| 17 | 1.2 | 0.6 | 0.6 | 0.6 | 0.5 | 0.6 | ||
| 18 | 1.5 | 0.6 | 0.6 | 0.6 | 0.5 | 0.6 | ||
| 19 | 0.7 | 0.7 | 0.6 | 0.5 | 0.6 | |||
| 20 | 0.8 | 0.7 | 0.7 | 0.6 | 0.6 | |||
| 21 | 0.8 | 0.7 | 0.7 | 0.6 | 0.6 | |||
| 22 | 1.0 | 0.7 | 0.8 | 0.6 | 0.6 | |||
| 23 | 1.5 | 0.8 | 0.9 | 0.6 | 0.7 | |||
| 24 | 1.0 | 1.0 | 0.7 | 0.7 | ||||
| 25 | 1.1 | 1.1 | 0.7 | 0.7 | ||||
| 26 | 1.5 | 1.5 | 0.6 | 0.7 | ||||
| 27 | 0.7 | 0.8 | ||||||
| 28 | 0.8 | 1.0 | ||||||
| 29 | 0.7 | 1.1 | ||||||
| 30 | 0.8 | 1.5 | ||||||
| 31 | 0.9 | |||||||
| 32 | 1.0 | |||||||
| 33 | 1.1 | |||||||
| 34 | 1.5 |
Note: Wadeable is to 1.5 m depth.
Bolded values: Sites where visible product was observed
Appendix 6: Depth to Sediment Surface - 1987 and 2009 survey
| Station ID | 1987 Water Level | Corrected 1987 Depth | 2009 Depth | Change in Depth |
|---|---|---|---|---|
| 3-12 | 150 | 114 | 120 | 6 cm deeper |
| 3-20 | 180 | 114 | >150 | No change |
| 4-11 | 150 | 114 | 90 | 24 cm shallower |
| 4-26 | 250 | 214 | >150 | No change |
| 5-10 | 100 | 64 | 60 | 4 cm shallower |
| 5-22 | 180 | 144 | >150 | No change |
| 6-10 | 100 | 64 | 40 | 24 cm shallower |
| 6-28 | 200 | 164 | 150 | 14 cm shallower |
| 7-10 | 80 | 44 | 60 | 16 cm deeper |
| 7-20 | 100 | 64 | 70 | 6 cm deeper |
| 8-10 | 80 | 44 | 50 | 6 cm deeper |
| 8-22 | 150 | 144 | 80 | 34 cm shallower |
| 9-10 | 50 | 14 | 30 | 16 cm deeper |
| 9-24 | 100 | 64 | 70 | 16 cm deeper |
| 9-24 | 100 | 64 | 70 | 6 cm deeper |
| 9-30 | 150 | 114 | 80 | 34 cm shallower |
| 10-28 | 200 | 164 | 100 | 64 cm shallower |
| 10-50 | 250 | 214 | >150 | No change |
Note: Only those stations showing >10 cm difference (those in bold) were used to identify areas of erosion and accretion.
Appendix 7: Benthic macroinvertebrate composition (individuals per Ekman grab) at sampling stations in lower Kettle Creek collected autumn of 1987.
See Figure 1 for location of sampling stations. Several stations are means of 2 replicates
Download Appendix 7
Appendix 8: Benthic macroinvertebrate composition (individuals per Ekman grab) at sampling stations in lower Kettle Creek collected spring of 2009.
See Figure 1 for location of sampling stations
Download Appendix 8
Appendix 9: Benthic macroinvertebrate composition (individuals per Ekman grab) at sampling stations in lower Kettle Creek collected autumn of 2009.
See Figure 1 for location of sampling stations
Download Appendix 9
Appendix 10: Sediment Samples < 55 cm from surface and > 80 µg/g
| Station ID | Depth (cm) | Total PAH (µg/g) |
|---|---|---|
| 5-10 | 6.5 to 25 | 190.1 |
| 6-10 | 16 to 18.5 | 123.1 |
| 7-10 | 18.5 to 25 | 205.1 |
| 7-10 | 25 to 30 | 240.2 |
| 8-10 | 9.5 to 26.5 | 109.4 |
| NGD-01 | 0 to 8.5 | 218.5 |
| NGD-01 | 8.5 to 19 | 453.3 |
| NGD-01 | 19 to 30 | 1011.9 |