Public Accounts 2018-19: Annual report
The annual report is a high-level summary of the fiscal year’s results. It includes financial statements, analyzes the state of the province’s finances and outlines achievements for the fiscal year.
Foreword
I am pleased to present the Province of Ontario’s Public Accounts for 2018–19. Each year, the government releases the Public Accounts to give the people of Ontario a clear and transparent view into their province’s finances.
Our government’s plan is focused on investing in front-line programs and services like health care and education, restoring trust in Ontario’s finances and making sure our province continues to be a great place to live, work and raise a family. This is our commitment that guides everything we do. From Windsor to Kenora, Ottawa to Moosonee, we are focused on building success today and prosperity for future generations.
The Public Accounts of Ontario 2018-2019 demonstrate that we can respect taxpayer dollars and focus on things like our world class health care, education and transportation systems.
While we continue to work to change the culture of government, we are investing in core programs and services. For example, this year we committed to invest a total of $18 billion in the hospital sector.
When our government assumed office, we knew that restoring trust and accountability to the province’s finances while investing in vital services that the people of Ontario depend on was our top priority. We acted immediately and put a freeze on discretionary spending, curbing things that could be put on hold without putting service delivery at risk.
In the months that followed, we have continued the hard work of ensuring public services are effective, efficient and sustainable for future generations by:
- Implementing measures to curb the “March Madness” — spending that governments typically see at the end of their fiscal year, as they attempt to use the remainder of their budgets — and saving $153 million in taxpayer dollars as a result of these and other expenditure management efforts;
- Removing fax and phone landlines across the Ontario Public Service;
- Creating an Independent Financial Commission of Inquiry to look into Ontario's past spending and accounting practices which concluded that the previous government left Ontario with a $15 billion deficit in 2018–19;
- Implementing a new Audit and Accountability Committee to add more scrutiny and accountability in government spending;
- Commissioning EY Canada’s line-by-line review and taking action to implement its recommendations to deliver value for money for the people of Ontario;
- Initiating a cross-government Multi-Year Planning process to help us take stock of all available opportunities to build a more sustainable government, both now and in the future.
Through these measures, we are tackling the deficit in a measured and responsible way.
Our government is working hard, every day, to restore trust and accountability to the province’s finances while maintaining the quality services that the people of Ontario expect and deserve. We will continue to be open, honest and transparent about the state of Ontario’s finances, and work to ensure that taxpayers are getting the most value for their hard-earned money.
Our government will continue to chart a prudent and responsible path to balance that will improve services, reduce the debt burden and build for the future. That is our commitment to the people of Ontario.
Original signed by
The Honourable Peter Bethlenfalvy
President of the Treasury Board
Introduction
The Annual Report is a key element of the Public Accounts of the Province of Ontario and is central to demonstrating the Province’s transparency and accountability in reporting its financial activities and position. Ontario’s Consolidated Financial Statements present the financial results for the 2018–19 fiscal year against the 2018 Restated Budget released in March 2018, and the financial position of the government as at March 31, 2019. As in previous years, the Annual Report also compares the current year’s results to the prior year’s results and provides a five-year trend analysis for a number of key financial ratios.
Producing the Public Accounts of Ontario requires the teamwork and collaboration of many stakeholders across Ontario’s public sector. The Office of the Auditor General plays a critical role in auditing and reporting on the Province’s financial statements, and the Standing Committee on the Public Accounts also plays an important role in providing legislative oversight and guidance. I would like to thank everyone for their contributions.
We welcome your comments on the Public Accounts. Please share your thoughts by email to infoTBS@ontario.ca, or by writing to the Office of the Provincial Controller, Re: Annual Report, Treasury Board Secretariat, Second Floor, Frost Building South, 7 Queen’s Park Crescent, Toronto, Ontario M7A 1Y7.
Original signed by
Kevin French
Deputy Minister, Treasury Board Secretariat
and Secretary of Treasury Board and
Management Board of Cabinet
Guide to the Public Accounts
The Public Accounts of the Province of Ontario comprise this Annual Report and two supporting volumes.
The Annual Report includes a Financial Statement Discussion and Analysis, the Consolidated Financial Statements of the Province and other supporting schedules and disclosures.
Financial Statement Discussion and Analysis
The first section of the Annual Report is the Financial Statement Discussion and Analysis section, which:
- Compares the Province’s financial results to both the 2018 Restated Budget and results for the previous year;
- Shows trends in key financial items and indicators of financial condition;
- Sets out key potential risks to financial results and strategies used to manage them;
- Includes descriptions of various assets and liabilities on the statement of financial position; and
- Presents non-financial activities results and discusses important initiatives related to enhancing transparency and accountability.
The Consolidated Financial Statements
The Consolidated Financial Statements show the Province’s financial position at the end of the previous fiscal year, its financial activities during the reporting period and its financial position at the end of the reporting fiscal year. The statements are linked, and figures that appear in one statement may affect another.
The Province’s financial statements are presented on a consolidated basis, meaning that the Province’s statement of financial position and statement of operations reflect the combination of ministry results as well as financial results for entities that are controlled by the government (see Note 1 to the Consolidated Financial Statements for more details). Therefore, reported revenues and expenses of the Province can be affected directly by the activities of ministries as well as the performance of controlled entities such as government business enterprises (GBEs) and broader public sector (BPS) organizations, i.e., hospitals, school boards and colleges. In addition, the Province’s results are also affected by transfer payments made to non-consolidated entities, such as municipalities and universities.
The financial statements comprise:
- The Consolidated Statement of Operations, which provides a summary of the government’s revenue for the period less its expenses, and shows whether the government incurred an operating deficit or surplus for the year. The results for the current year are presented along with the Restated Budget Plan, and the financial results for the prior fiscal period. The annual surplus/deficit has an impact on the Province’s financial position.
- The Consolidated Statement of Financial Position, which reports the Province’s assets and liabilities and is also known as the balance sheet. The Province’s total liabilities include debt and other long-term financing. Financial assets include cash, short-term investments, amounts due from others and investment in GBEs. The difference between total liabilities and financial assets is the Province’s net debt, which provides a measure of the future government revenues that will be required to pay for the government’s past transactions. Non-financial assets, mainly tangible capital assets such as highways, bridges and buildings, are subtracted from net debt to arrive at the accumulated deficit. A deficit in the year increases the accumulated deficit.
- The Consolidated Statement of Change in Net Debt, which shows how the Province’s net debt position changed during the year. The main factors impacting net debt are the annual surplus/deficit and additions to tangible capital assets.
- The Consolidated Statement of Change in Accumulated Deficit, which is a cumulative total of all the Province’s annual deficits and surpluses to date. It is mainly affected by the annual surplus/deficit in a year.
- The Consolidated Statement of Cash Flow, which shows the sources and uses of cash and cash equivalents over the year. Two major sources of cash are revenues and borrowings. Uses of cash include funding for operating costs, investments in capital assets and debt repayment. The statement is presented in what is referred to as the indirect method, meaning that it starts with the annual surplus or deficit and reconciles that to the cash flow from operations by adding or subtracting non-cash items, such as amortization of tangible capital assets. It also shows cash used to acquire tangible capital assets and investments, as well as cash generated from financing activities.
When reading the Consolidated Financial Statements, it is essential to also read the accompanying notes and schedules, which summarize the Province’s significant accounting policies and provide additional information on underlying financial activities, market value of investments, contractual obligations and risks.
Other elements of the Annual Report
- In the Statement of Responsibility, the government acknowledges its responsibility for the Consolidated Financial Statements and the Financial Statement Discussion and Analysis. The Statement, which appears on page 5, outlines the accounting policies and practices used in preparing the financial statements and acknowledges the government’s responsibility for financial management systems and controls.
- The Auditor General’s Report, which appears on page 47–49, expresses an opinion under the Auditor General Act as to whether the statements fairly present the annual financial results and financial position of the government in accordance with Canadian Public Sector Accounting Standards.
Supporting volumes
Volume 1 contains ministry statements and detailed schedules of debt and other items. Individual ministry statements compare actual expenses to the amounts appropriated by the Legislative Assembly. Appropriations are made through the Estimates, Supplementary Estimates and annual Supply Act (as modified by Treasury Board Orders), other statutes and special warrants, if any. The ministry statements include amounts appropriated to fund certain provincial organizations, including hospitals, school boards and colleges. The financial results of all provincial organizations included in the government reporting entity in accordance with Public Sector Accounting Standards are consolidated with those of the Province to produce the Consolidated Financial Statements in accordance with the accounting policies as described in Note 1 to the statements.
Volume 3 contains the details of payments made by ministries to vendors (including sales tax) and transfer payment recipients that exceed certain thresholds, including: payments to suppliers of temporary help services; payments made directly to a supplier by the ministry for employee benefits; travel payments for employees; total payments for grants, subsidies or assistance to persons, businesses, non-commercial institutions and other government bodies; other payments to suppliers of goods and services; and statutory payments.
Starting in 2018–19, Volume 2 no longer forms a part of the Public Accounts. Volume 2 previously contained the individual statements of significant provincial corporations, boards and commissions that are part of the government’s reporting entity, as well as other miscellaneous financial statements. These statements are available via web link to the organization’s website through ontario.ca/publicaccounts or upon request.
Statement of responsibility
The Consolidated Financial Statements are prepared by the Government of Ontario in accordance with the accounting principles for governments issued by the Public Sector Accounting Board (PSAB).
The Consolidated Financial Statements are audited by the Auditor General of Ontario in accordance with the Auditor General Act, and with Canadian generally accepted assurance standards. The Auditor General expresses an independent audit opinion on these Consolidated Financial Statements. Her report, which appears on pages 47–49, provides her audit opinion and the basis for this opinion.
Management prepares the Consolidated Financial Statements in accordance with generally accepted accounting principles for the public sector. Management is also responsible for maintaining systems of financial management and internal controls to provide reasonable assurance that transactions recorded in the Consolidated Financial Statements are within statutory authority, assets are properly safeguarded, and reliable financial information is available for preparation of these Consolidated Financial Statements.
Original signed by
Kevin French
Deputy Minister
Treasury Board Secretariat and Secretary of Treasury Board and Management Board of Cabinet
August 16, 2019
Original signed by
Greg Orencsak
Deputy Minister
Ministry of Finance
August 16, 2019
Original signed by
Maureen Buckley, CPA, CA
Assistant Deputy Minister and Provincial Controller,
Treasury Board Secretariat
August 16, 2019
The Government of Ontario is responsible for the Consolidated Financial Statements and accepts responsibility for the objectivity and integrity of these Consolidated Financial Statements and the Financial Statement Discussion and Analysis. Those charged with governance are responsible for overseeing the Government of Ontario’s financial reporting process.
Original signed by
The Honourable Peter Bethlenfalvy
President of the Treasury Board
August 16, 2019
Original signed by
The Honourable Rod A. Phillips
Minister of Finance
August 16, 2019
Financial Statement Discussion and Analysis
Highlights
The 2018 Restated Budget numbers have been adjusted, consistent with the Auditor General’s Review of the 2018 Pre-Election Report on Ontario’s Finances, which includes a change in the accounting treatment of pension expenses and global adjustment refinancing. In September 2018, the Independent Financial Commission of Inquiry (Commission) released its report, making recommendations to the government on its accounting practices and providing a revised baseline deficit of $15.0 billion for 2018–19. Subsequently, in the 2018 Ontario Economic Outlook and Fiscal Review (Fall Economic Statement) the government reported a deficit of $14.5 billion, an improvement of $0.5 billion relative to the Commission’s baseline, as a result of immediate government actions taken to drive efficiencies. The interim 2018–19 fiscal outlook was further improved by $2.8 billion to $11.7 billion as reported in the 2019 Budget.
Financial highlights
- The Province posted a $7.4 billion deficit for the fiscal year ended March 31, 2019; which is lower than the 2018–19 Restated Budget due to higher revenues and controlled spending. (see Table 1 on page 11)
- Total revenues are $153.7 billion, which are $1.2 billion or 0.8 per cent higher than the 2018–19 Restated Budget led by higher taxation revenues reflecting strong corporate profits, a growing job market, and higher consumer consumption (see details on pages 12-13).
- Total program expenses are $148.7 billion, which are $2.3 billion or 1.5 per cent lower than the 2018–19 Restated Budget. While investments are higher in health and postsecondary education, program expenses in other sectors are lower due to restrictions placed on discretionary spending across government and other factors such as scheduling changes in investments in municipal transit infrastructure and the cancellation of the cap and trade program (see details on pages 17-20).
- Interest on debt is slightly lower than the 2018–19 Restated Budget by $0.1 billion but higher by $0.5 billion, or 4.2 per cent from the previous year (see details on page 23).
- The net book value of Ontario’s capital assets, such as buildings and transportation infrastructures, grew by $7.0 billion during the year. The Province invested $13.0 billion in assets owned by the Province reflecting new capital investments, mainly in the transportation, health and education sectors. The Province also made $2.9 billion in additional investments in transfers to non-consolidated partners and other infrastructure expenditures (see details on pages 25-27).
- Total liabilities increased by $20.1 billion and total financial assets increased by $5.4 billion, resulting in an increase of $14.7 billion or 4.5 per cent in net debt from the previous year. Accumulated deficit increased by $7.6 billion or 3.6 per cent from the previous year mainly as a result of the reported deficit of $7.4 billion, and $0.2 billion of other adjustments related to Government Business Enterprises (see details on pages 28-29).
2018-19 financial highlights ($ Billions) - table 1
|
Consolidated statement of operations |
2018 Restated budget |
2018–19 |
2017–18 Restated actual |
Change from 2018 restated budget |
Change from |
|---|---|---|---|---|---|
|
Total revenue |
152.5 |
153.7 |
150.6 |
1.2 |
3.1 |
|
Expense |
|||||
|
Programs |
151.0 |
148.7 |
142.4 |
(2.3) |
6.3 |
|
Interest on debt |
12.5 |
12.4 |
11.9 |
(0.1) |
0.5 |
|
Total expense |
163.5 |
161.1 |
154.3 |
(2.4) |
6.8 |
|
Reserve |
0.7 |
– |
– |
(0.7) |
– |
|
Annual deficit |
(11.7) |
(7.4) |
(3.7) |
4.3 |
(3.7) |
|
Consolidated statement of financial position |
|||||
|
Financial assets |
87.2 |
81.8 |
5.4 |
||
|
Liabilities |
|
425.7 |
405.6 |
|
20.1 |
|
Net debt |
|
(338.5) |
(323.8) |
|
(14.7) |
|
Non-financial assets |
|
121.9 |
114.8 |
7.1 |
|
|
Accumulated deficit |
|
(216.6) |
(209.0) |
|
(7.6) |
Note: Numbers may not add due to rounding.
Analysis of 2018–19 Results
Details of 2018-19 actual results ($ Billions) - table 2
|
Item |
2018 Restated budget |
2018–19 Actual |
2017–18 Restated actual |
Change from 2018 restated budget |
Change from 2017–18 restated actual |
|---|---|---|---|---|---|
|
Revenue |
|||||
|
Taxation |
103.6 |
105.5 |
99.7 |
1.9 |
5.8 |
|
Government of Canada |
26.0 |
25.1 |
24.9 |
(0.9) |
0.2 |
|
Income from government business enterprises |
5.3 |
5.5 |
6.2 |
0.2 |
(0.7) |
|
Other non-tax revenue |
17.6 |
17.6 |
19.9 |
– |
(2.3) |
|
Total revenue |
152.5 |
153.7 |
150.6 |
1.2 |
3.1 |
Note: Numbers may not add due to rounding.
Revenue
Change from 2018 Restated Budget
In the 2018 calendar year, Ontario’s real GDP grew by 2.3 per cent, driven by gains in consumer spending and business investment in machinery and equipment. Growth was above the forecast of 2.2 per cent in the 2018 Restated Budget.
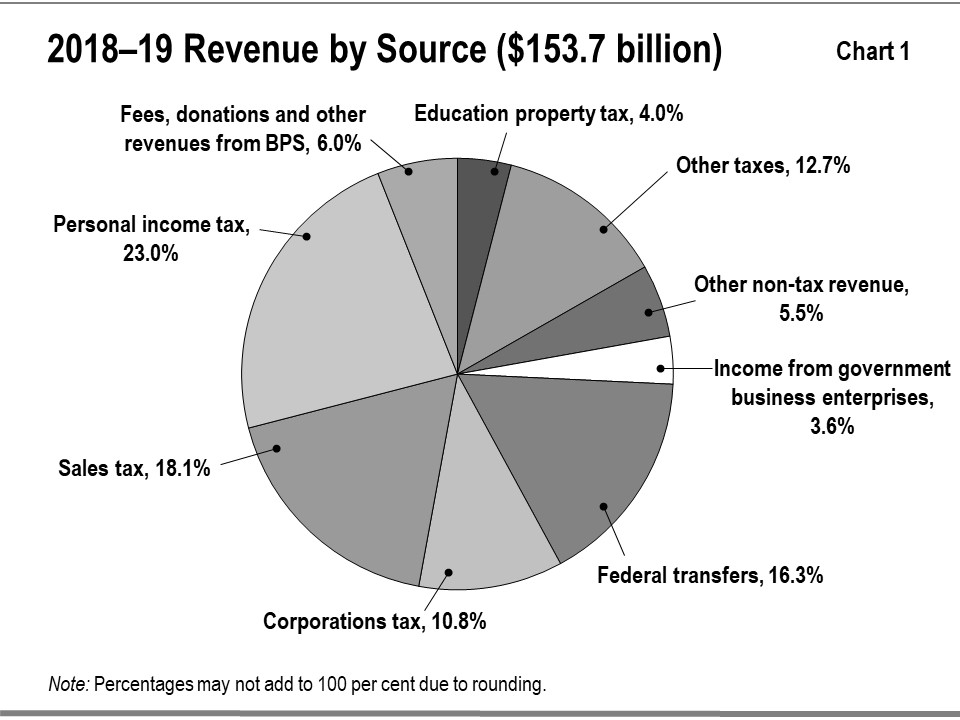
Revenues for 2018–19 were $153.7 billion, 0.8 per cent higher than the 2018 Restated Budget projection. See Chart 1 for a breakdown of revenues by source.
- Taxation revenues were $105.5 billion, 1.9 per cent higher-than-projected in the 2018 Restated Budget mainly due to higher Corporations Tax (CT) and Harmonized Sales Tax (HST), partially offset by lower Personal Income Tax (PIT), Ontario Health Premium (OHP) and Land Transfer Tax (LTT). CT was $1.5 billion higher reflecting higher amounts from processing tax returns for 2018 and prior years. HST was $1.0 billion higher due to higher levels of household spending in 2017 and 2018. PIT and OHP are $0.3 billion lower mainly due to tax measures such as Low-income Individuals and Families Tax (LIFT) Credit and lower amounts from the processing of tax returns for 2018 and prior years. LTT was $0.4 billion lower due to weaker-than-expected housing resales in 2018.
- Transfers from the Government of Canada were lower than the 2018 Restated Budget forecast by $0.9 billion, mainly reflecting lower-than-expected funding for infrastructure projects.
- Income from GBEs was $0.2 billion higher, reflecting higher-than-projected net income from the Ontario Lottery and Gaming Corporation (OLG), the Liquor Control Board of Ontario (LCBO) and Ontario Power Generation Inc. (OPG).
- Other non-tax revenues were on aggregate close to the restated budget forecast. Lower revenue from carbon allowance proceeds due to the cancellation of the cap and trade program is offset by higher revenue from other sources.
Change from 2017–18 restated actuals and earlier years
Total revenues for 2018–19 increased by $3.1 billion, or 2.1 per cent, from the previous year.
- Taxation revenues grew by $5.8 billion, or 5.8 per cent, mostly reflecting growth in PIT, CT and HST revenues. PIT revenue grew by $2.5 billion, or 7.5 per cent, mostly reflecting employment and wage growth in 2018. CT revenue grew by $1.0 billion (6.4 per cent) due to strong operating profit growth of 9.6 per cent in 2018–19. HST revenue grew by $1.7 billion (7.4 per cent) supported by nominal personal consumption growth of 4.8 per cent.
- Revenues from the Government of Canada were higher in 2018–19 by $0.2 billion, reflecting transfers to major federal funding programs including the Canada Health Transfer, the Canada Social Transfer, funding for home care and mental health, labour market programs, transfers for early learning and child care, and direct transfers to the Broader Public Sector. This increase was partially offset by lower Equalization payments and transfers for infrastructure programs.
- Income from GBEs was lower in 2018–19 by $0.7 billion largely reflecting one-time revenues in 2017–18 from OPG and OLG. Lower OPG net income was largely reflecting one-time revenues in 2017–18 arising from the sale of OPG’s head office properties and Lakeview lands, and OLG one-time gains in 2017–18 on sale of assets related to the transition of gaming bundles to service providers. Hydro One net income was lower primarily due to the write-down arising from a regulatory decision on sharing tax savings with ratepayers related to the Initial Public Offering of Hydro One.
- Other non-tax revenue was lower by $2.3 billion in 2018–19, mainly reflecting one-time revenue from Hydro One shares sold in 2017–18, the cancellation of the cap and trade program subsequent to the auction held on May 15, 2018, and ending of the Debt Retirement Charge in 2017–18. This decrease is partially offset by higher revenue from other sources.
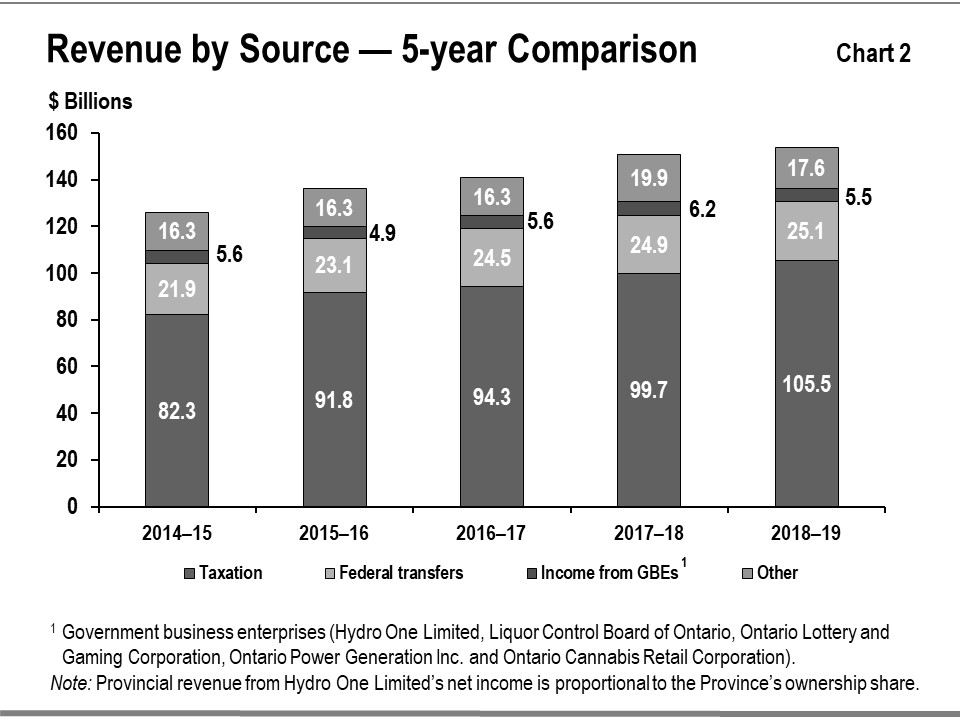
Revenue trend
Chart 2 shows the recent trends in revenue for the Province’s major revenue sources.
Taxation revenue
Between 2014–15 and 2018–19, taxation revenue grew at an annual average rate of 6.4 per cent, higher than the average annual nominal GDP growth of 4.2 per cent.
Although economic growth and increases in taxation revenue are closely linked, the relationship is affected by several factors. Growth in some revenue sources, such as corporations tax and mining tax, can diverge significantly from economic growth in any given year due to the inherent volatility of business profits as well as the use of tax provisions such as the option to carry losses forward or backward. The impact of housing completions and resales on HST and land transfer tax revenue is proportionately greater than their contribution to GDP. As well, changes in such sources as volume-based gasoline and fuel taxes are more closely aligned to growth in real as opposed to nominal GDP as these revenue sources are less influenced by price changes.
Much of the rising trend in taxation revenues between 2014–15 and 2018–19 reflects a growing economy.
Federal government transfers
Government of Canada transfers are based on existing federal-provincial funding arrangements and formulas. These include major federal transfers such as the Canada Health Transfer, Canada Social Transfer, and Equalization. There are also a number of federal transfers to the Province which are largely program-specific such as for social housing, infrastructure and labour market programs. Some transfers are ongoing while others are time-limited.
Between 2014–15 and 2018–19, Government of Canada transfers grew at an annual average rate of 3.4 per cent.
Income from government business enterprises
Revenue of the Province includes the net income of the following GBEs: Hydro One Limited
Between 2014–15 and 2018–19, income from GBEs decreased at an annual average rate of 0.7 per cent.
Other non-tax revenues
Other non-tax revenues arise from a number of sources, including vehicle and driver registration fees, sales and rentals of goods and services, other fees, licences and permits, reimbursements of provincial expenditures in delivering certain services, royalties for the use of Crown resources, and electricity sector revenues such as the debt retirement charge and power supply contract recoveries.
Other non-tax revenues grew at an annual average rate of 1.9 per cent between 2014–15 and 2018–19.
Expense
Details of 2018-19 actual results ($ Billions) - table 3
|
Item |
2018 Restated budget |
2018–19 Actual |
2017–18 Restated actual |
Change from 2018 restated budget |
Change from |
|
|---|---|---|---|---|---|---|
|
Expense |
||||||
|
Health sector |
61.2 |
61.5 |
59.1 |
0.3 |
2.4 |
|
|
Education sector |
29.0 |
28.7 |
27.3 |
(0.3) |
1.4 |
|
|
Children’s and social services sector |
17.9 |
17.2 |
16.4 |
(0.7) |
0.8 |
|
|
Postsecondary and training sector |
11.8 |
11.9 |
11.1 |
0.1 |
0.8 |
|
|
Justice |
4.5 |
4.4 |
4.2 |
(0.1) |
0.2 |
|
|
Other programs |
26.6 |
25.0 |
24.3 |
(1.6) |
0.7 |
|
|
Total program expense |
151.0 |
148.7 |
142.4 |
(2.3) |
6.3 |
|
|
Interest on debt |
12.5 |
12.4 |
11.9 |
(0.1) |
0.5 |
|
|
Total expense |
163.5 |
161.1 |
154.3 |
(2.4) |
6.8 |
|
|
Reserve |
0.7 |
– |
– |
(0.7) |
– |
|
Note: Numbers may not add due to rounding.
Change from 2018 Restated Budget
Total expense in 2018–19 was $161.1 billion, which was $2.4 billion lower than the 2018 Restated Budget. Program spending was $148.7 billion, down $2.3 billion from the plan of $151.0 billion. Spending in health, postsecondary and training was higher than planned, offset by lower spending in education, children’s and social services and justice programs (see Table 3). Interest on debt expense was $12.4 billion, which was $0.1 billion below the plan of $12.5 billion.
See Chart 3 for details of program expense by sector.
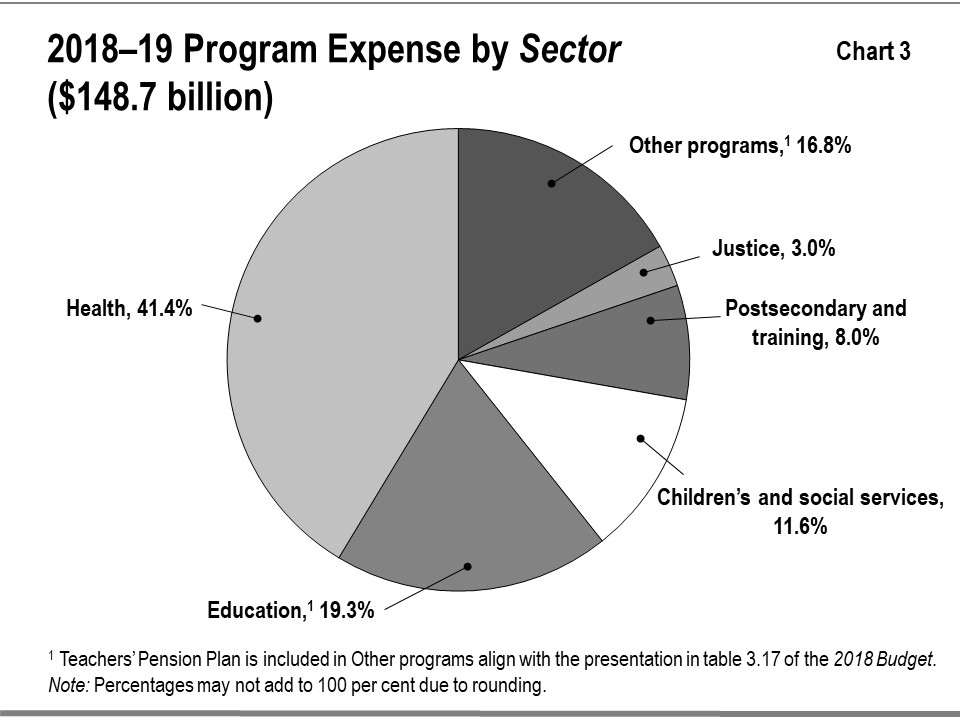
Total program spending was $2.3 billion lower than the 2018 Restated Budget, resulting in actual program expense of $148.7 billion. The decrease was attributable to:
- Education sector expense that was $0.3 billion lower than planned, which was mainly due to lower-than-forecast school board spending;
- Children’s and social services sector expense that was $0.7 billion lower than planned. The ministry implemented strategies to restrict discretionary and other spending as a result of holding social assistance rate of increases to the rate of inflation;
- Justice sector expense that was $0.1 billion lower than planned, mainly due to restrictions on discretionary spending (such as travel, meal and hospitality), and a comprehensive value for money review of the 2018 Restated Budget investments that was aimed at modernizing and transforming service delivery; and
- Other programs expense was $1.5 billion lower than planned mainly due to reduced transportation transfer payments resulting from revised timelines for municipal transit projects under the federal Public Transit Infrastructure and by the cancellation of cap and trade funded programs. The decrease in 2018–19 was partially offset by:
- higher than projected costs related to providing electricity rate mitigation;
- one-time costs related to the wind down and termination of about 750 renewable energy contracts;
- adjustments related to the Green Ontario Fund delivered by the Independent Electricity System Operator (IESO);
- the recognition of contingent liabilities for land and land-related settlements; and
- additional spending in Municipal Affairs and Housing, which includes a one-time investment to support small and rural municipalities in their modernization efforts and non-cash expenses related to the use of provincial lands to address housing affordability.
Lower program expenses were partially offset by:
- Health sector expense that was $0.3 billion above plan, mainly due to the physician services arbitration settlement awarded in February 2019, increased demand for cancer treatment services and assistive devices, as well as increased resources for the treatment of opioid and other drug addictions.
- Postsecondary and training sector expense that was $0.1 billion higher, primarily due to additional funding for the Ontario Student Assistance Program (OSAP) to support applications and awards for about 450,000 students in 2018–19. The increase in OSAP spending was mitigated by savings resulting from expenditure management activities and the Fall Economic Statement adjustments and a reduction in spending for capital projects.
Chart 4 shows spending by type of expense. Government spending related to salaries and benefits includes those expenses for organizations consolidated as part of the government reporting entity including hospitals, school boards and colleges as well as the Ontario Public Service. The expense labelled “Transfers” in Chart 4 do not include transfers to hospitals, school boards and colleges — these are reflected in the other expense types as reported by the organizations.
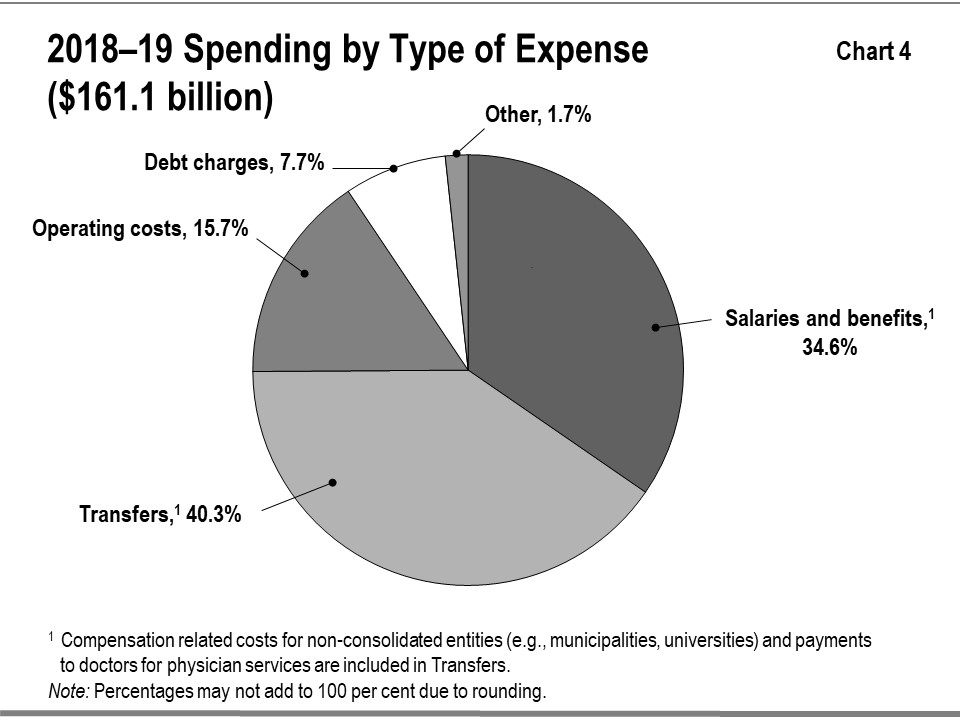
Transfers reflect payments to a variety of service providers that support the delivery of public services. These outside parties include for example, child care providers, social service agencies and health care professionals, including physicians. As service providers, a large share of the spending of these third parties typically goes to salaries and benefits.
Change from 2017–18 restated actuals and earlier years
Chart 5 shows the recent trends in spending for major program areas.
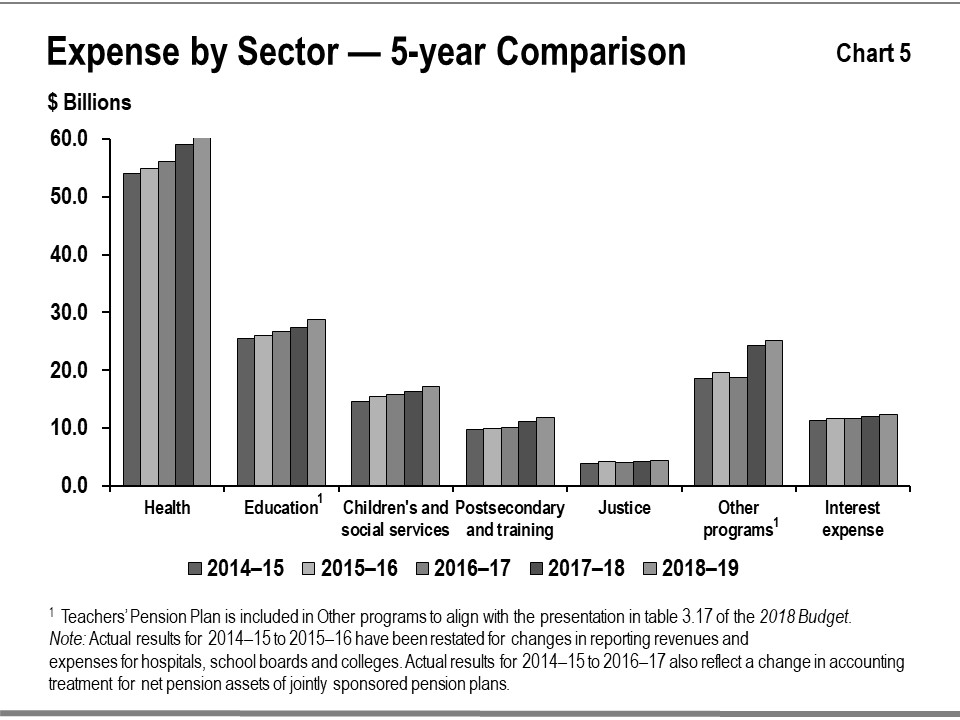
- Health sector expense increased from $54.0 billion in 2014–15 to $61.5 billion in 2018–19, or on average by 3.3 per cent per year. The increased expense reflects the increased demand for health services provided under the Ontario Health Insurance Plan (OHIP), increased usage and related expenses in the Ontario Public Drug Programs and cancer care treatment services, as well as additional funding for the long-term care homes and the hospital sector.
- Education sector expense increased from $25.5 billion in 2014–15 to $28.7 billion in 2018–19, or on average by 3.1 per cent per year. The increase is mainly due to investments such as increases in child care funding, negotiated labour enhancements and increases in capital investments.
- Children’s and social services sector expense increased from $14.7 billion in 2014–15 to $17.2 billion in 2018–19, or on average by 4.1 per cent per year. The increase primarily reflects social assistance rate increases and investments in developmental services, Child Protection Services, the Ontario Autism Program and Ontario Child Benefit as a result of growing demand and complexity of service needs.
- Postsecondary and training sector expense increased from $9.8 billion in 2014–15 to $11.9 billion in 2018–19, or on average by 5.0 per cent per year. The increase is mainly due to growth in continued funding to support postsecondary institutions.
- Justice sector expense increased from $3.9 billion in 2014–15 to $4.4 billion in 2018–19, or on average by 3.2 per cent per year. The increase is mainly due to the investments in the corrections system, providing police, prosecutors and justice partners with new tools and resources to protect the people of Ontario from drug-, gun- and gang-related violence, supporting regulatory and compliance activities to prepare for private cannabis retail operations, and compensation for the Ontario Provincial Police, correctional services workers and provincial lawyers. These investments improved conditions of confinement within correctional facilities, provided additional digital, investigative and analytical resources to fight drug gangs and criminals, and provided support for the development of a private cannabis retail system which is intended to combat the illegal market and protect children.
- Other programs expense increased mainly due to:
- investments in transit and highways, including time-limited federal infrastructure funding for municipal transit projects;
- the increase in support for small and rural municipalities and new program expenses related to the use of provincial lands to address housing affordability;
- electricity rate mitigation program costs and costs related to the wind-down and termination of about 750 renewable energy contracts and adjustments related to the Green Ontario Fund delivered by the Independent Electricity System Operator; and
- fluctuation of land-related settlements and land-related contingent liabilities.
Interest on Debt
Interest on debt expense was over $0.1 billion below plan in 2018–19, mainly as a result of lower-than-forecast interest rates and cost-effective borrowing and debt management.
Interest expense grew from $11.9 billion in 2017–18 to $12.4 billion in 2018–19 (see Table 3).
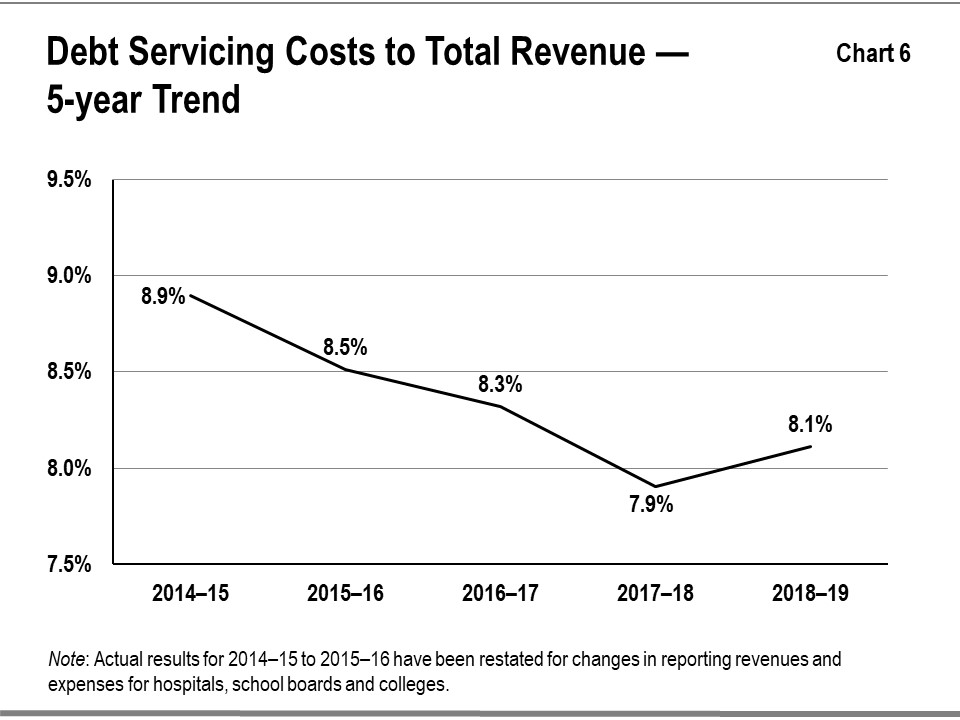
Chart 6 shows that the ratio of debt servicing costs to total revenue has fallen for Ontario over the past five years, from a high of 8.9 per cent in 2014–15 to the current level of 8.1 per cent. The increase from 7.9 per cent in 2017–18 to 8.1 per cent in 2018–19 is a result of the rate of increase in the Province’s total debt outstripping the increase in revenues.
Statement of financial position analysis
Financial assets
Financial assets ($ Billions) - table 4
|
Item |
2018–19 |
% of Total |
2017–18 Restated |
% of Total |
Variance |
|---|---|---|---|---|---|
|
Cash and cash equivalents |
13.4 |
15.4% |
11.5 |
14.0% |
1.9 |
|
Investments |
26.3 |
30.2% |
21.4 |
26.1% |
4.9 |
|
Accounts receivable |
12.2 |
14.0% |
13.5 |
16.5% |
(1.3) |
|
Loans receivable |
11.9 |
13.6% |
12.4 |
15.1% |
(0.5) |
|
Other assets |
1.2 |
1.4% |
1.0 |
1.3% |
0.2 |
|
Investment in government business enterprises |
22.2 |
25.4% |
22.0 |
27.0% |
0.2 |
|
Total financial assets |
87.2 |
100.0% |
81.8 |
100.0% |
5.4 |
Note: Numbers may not add due to rounding.
Financial assets consist of items such as: cash and cash equivalents and investments that are available to the Province to meet its expenditure needs; accounts and loans receivable, which are amounts it expects to receive from third parties; and other items including investment in GBEs.
The Province’s financial assets increased by $5.4 billion in 2018–19 over the prior year. These increases were attributable to (see Table 4):
- Cash and cash equivalents were $1.9 billion higher due to operating, investing capital, capital and financial activities; and
- Investment is $4.9 billion higher than prior year, which is mainly driven by an increase in the securities the Province sold and subsequently repurchased.
These increases were offset by:
- Accounts receivable that was $1.3 billion lower, mainly due a decrease in corporate tax receivable, and a decrease in receivables from proceeds of sale of investments; and
- Loans receivable that was $0.5 billion lower, mainly due to decrease in loans to GBEs and postsecondary students as more student grants were provided resulting in less issuance of student loans.
Chart 7 shows the recent trends in financial assets for the Province.
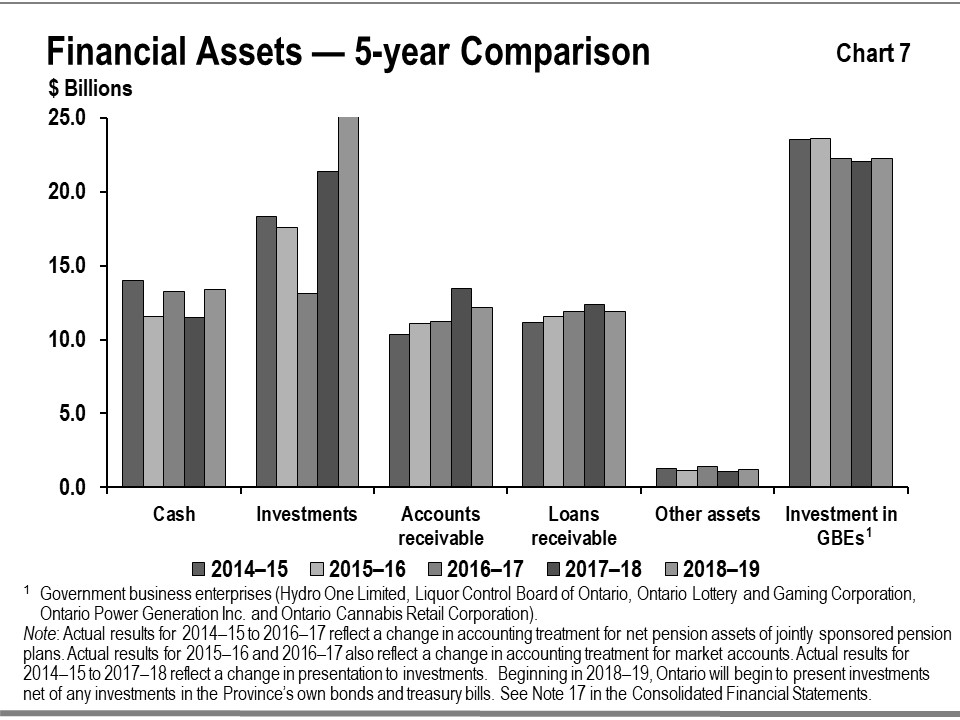
Total investment in GBEs was relatively unchanged from 2014–15 to 2015–16 and from 2016–17 to 2018–19. The net decreases were mainly due to the Province’s decreases in ownership interest in Hydro One Limited and the sale, in February 2017, of Hydro One Brampton Networks Inc.
The level of other financial assets including cash, accounts receivable and investments, tends to be more variable since these assets often reflect specific circumstances at year‑end such as pre-borrowing for the following period’s needs. Investments were higher in 2017–18 mainly due to the Province building up liquid reserves to address debt maturities in both 2018–19 and 2019–20; Investments were higher in 2018–19 due to an increase in the securities the Province sold and subsequently repurchased.
Tangible capital assets
The government is responsible for a large portfolio of non-financial assets which is almost entirely made up of tangible capital assets.
Tangible capital assets owned by the Province and its consolidated entities represent the largest component of Ontario’s infrastructure investments. These assets include those it owns directly, such as provincial highways, as well as the assets of hospitals, school boards, colleges and agencies that are consolidated in its financial statements. The assets of GBEs are reflected in the Province’s statement of financial position as an investment in GBEs under financial assets.
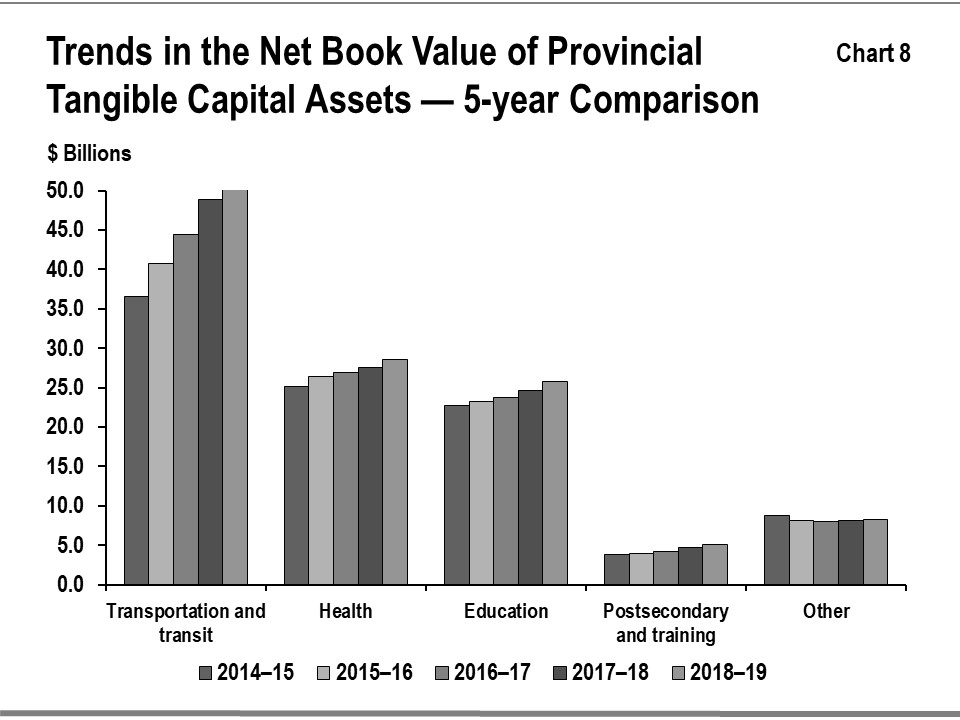
The reported net book value of Ontario’s tangible capital assets was $120.9 billion in 2018–19, increasing by $7.0 billion over the prior year. Buildings, including hospitals, schools and college facilities, make up the single largest share at $58.8 billion. The total also includes assets under construction, some of which are being built using the Public‑Private Partnership (P3) model, in which the private sector finances the assets during construction. The balance sheet includes assets under construction. The impacts of P3’s on balance sheet liabilities are discussed in “Other long-term financing” on page 29.
Growth in the net book value of capital assets has averaged 5.6 per cent annually over the period between 2014–15 and 2018–19. Most of the growth has been in new and renewed buildings and in transportation infrastructure including provincial highways, bridges and the transit network owned by Metrolinx, an agency of the Province.
See Chart 8 for the recent trends in the net book value of provincial tangible capital assets by sector.
Infrastructure expenditures
The Province’s infrastructure spending in 2018–19 was $15.9 billion (see Table 5). This included $13.0 billion invested in assets owned by the Province and its consolidated entities as discussed in “Tangible capital assets” on page 25, and $2.9 billion provided for capital investment to non-consolidated partners such as universities and municipalities, and other infrastructure expenditures. The total was lower than the $21.1 billion set out in the 2018 Restated Budget primarily driven by lower-than-forecast construction activity in the transportation and transit sector for projects such as GO Rail Expansion.
Infrastructure expenditures, 2018–19 ($ Billions) - table 5
|
Sector |
Investment in |
Transfers and Other Infrastructure Expenditures |
Total Infrastructure Expenditures |
|---|---|---|---|
|
Transportation and transit |
6.3 |
0.9 |
7.3 |
|
Health |
2.8 |
0.2 |
3.0 |
|
Education |
2.4 |
0.1 |
2.5 |
|
Postsecondary and training |
0.8 |
0.3 |
1.0 |
|
Other sectors |
0.6 |
1.4 |
2.1 |
|
Totals |
13.0 |
2.9 |
15.9 |
Note: Numbers may not add due to rounding.
Liabilities
The Province’s liabilities consist of debt and other financial obligations including accounts payable, unspent funds it received from the federal government and the estimated cost of future payments, including pensions and other employee future benefits liability (see Table 6).
Liabilities ($ Billions) - table 6
|
Item |
2018–19 Actual |
% of Total |
2017–18 Restated actual |
% of Total |
Variance increase (decrease) |
|---|---|---|---|---|---|
|
Accounts payable and accrued liabilities |
24.3 |
5.7% |
23.4 |
5.8% |
0.9 |
|
Debt |
354.3 |
83.2% |
337.4 |
83.2% |
16.9 |
|
Other long-term financing |
15.4 |
3.6% |
14.0 |
3.4% |
1.4 |
|
Deferred revenue and capital contributions |
12.9 |
3.0% |
12.5 |
3.1% |
0.4 |
|
Pensions and other employee future benefits liability |
11.6 |
2.7% |
11.5 |
2.8% |
0.1 |
|
Other liabilities |
7.3 |
1.7% |
6.9 |
1.7% |
0.4 |
|
Total liabilities |
425.7 |
100.0% |
405.6 |
100.0% |
20.1 |
Note: Numbers may not add due to rounding.
Debt
Debt and other long-term financing make up the largest share of liabilities. Debt increased by $16.9 billion in 2018–19 to $354.3 billion at year-end, primarily to finance the operating deficit and investments in infrastructure.
Table 7 summarizes how the Province used its net new financing in 2018–19.
Use of new financing by the Province, 2018–19 ($ Billions) - table 7
|
Item |
Amount |
|---|---|
|
Operating deficit and other transactions |
(1.6) |
|
Investment in capital assets owned by the Province and its consolidated organizations, |
12.2 |
|
Increase in the Province’s cash and investments funded by cash holdings |
7.0 |
|
17.6 |
|
|
Increase in other long-term financing, Tangible Capital Assets financed by Public-Private Partnership (P3) |
(0.7) |
|
Net new financing |
16.9 |
Note: Numbers may not add due to rounding.
The government completed an annual borrowing program of $39.6 billion in 2018–19.
Other long-term financing
This category includes debt incurred to finance construction of public assets including those procured through the Public-Private Partnership (P3) model. All assets that are owned by the Province and its consolidated entities, and the associated financing liabilities, are reflected on the Province’s balance sheet during construction and as the liabilities are incurred. For information on asset investments, refer to “Tangible capital assets” on page 25.
Other types of liabilities
Other types of liabilities include accounts payable, pensions and other employee future benefits, unspent transfers received from the federal government representing deferred revenues, and other liabilities.
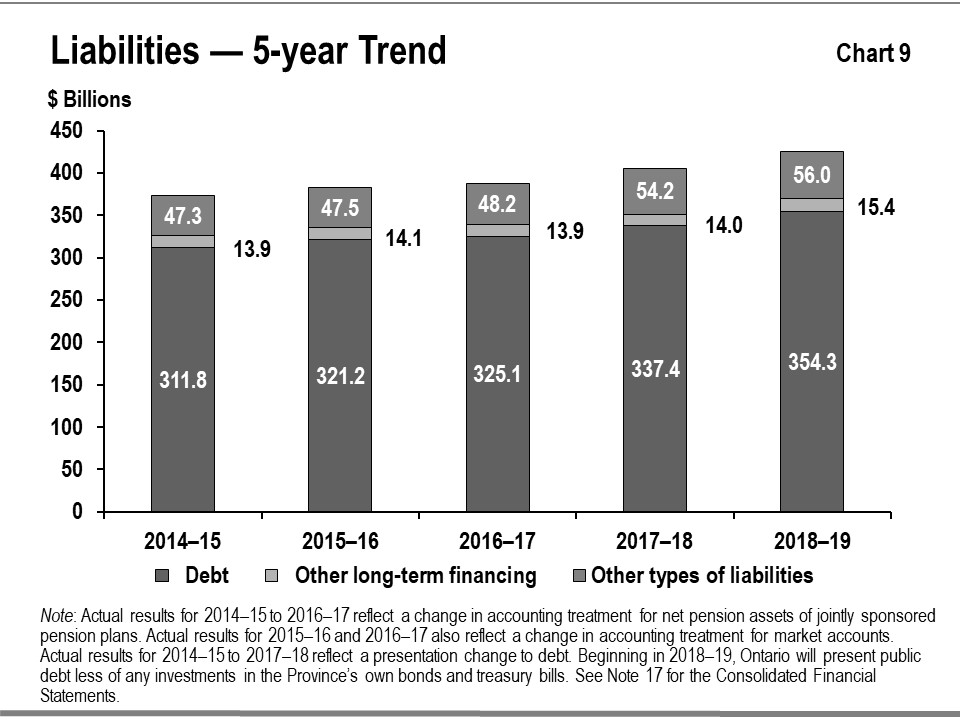
Chart 9 shows the recent trends in liabilities for the Province. This trend over the period between 2014–15 and 2018–19 shows public debt rising, mainly to fund capital investments and the annual deficit. There is an upward trend in other long-term financing with the exception of 2016–17, due to a substantial completion payment that year for the Highway 407 Phase 1 project. Other types of liabilities, including accounts payable and deferred revenue, tend to be more variable since they often reflect specific circumstances at year-end such as accrued liabilities for goods and services.
Risks and risk management
The Province’s financial results and financial reporting are subject to risks and uncertainties over which the government has limited or no control. These include:
- Actual economic and/or revenue growth that differs from forecast;
- Significant changes in financial statement items, especially taxation revenues, arising from actual results that differ from accounting estimates;
- Unforeseen changes in transfer payments from the federal government;
- Demand for entitlement-based public services or a change in other expense, including pension expense, that reflects actual experience that is significantly different than forecast;
- Unusual weather patterns, extreme weather events and natural disasters with major financial impacts;
- Security breaches or other malicious behaviour that could interrupt services, result in loss of information, compromise privacy and/or damage equipment or facilities;
- The outcomes of legal settlements, arbitration and negotiations, and possible defaults on projects and potential defaults affecting loan and funding guarantees;
- Financial market conditions, including access to capital markets, currency exchange rates and interest rates, that differ from expectations; and
- Changes in accounting standards.
Ontario’s revenues rely heavily on the level and pace of economic activity in the province. Ontario manages risks to the revenue forecast by consulting with private sector economists and tracking their economic forecasts to inform the government’s planning assumptions. For prudent fiscal planning, the Ministry of Finance’s real GDP growth projections are slightly below the average private sector forecast.
The Province monitors information flows regarding revenues on an ongoing basis to assess potential risks to its finances. It also works continually to enhance information flows for the same purpose. Collaboration with the Canada Revenue Agency, which administers approximately 77.0 per cent of Ontario’s taxation revenues, is essential to achieving this. As well, Ontario is currently leading a federal, provincial and territorial working group that is exploring ways to enhance corporate income tax revenue forecasting and monitoring.
There are also risks arising from other sources of revenue, such as federal transfers and income from GBEs. Since these represent a smaller share of total revenue, as compared to larger revenue sources such as tax revenue – the risks they present are relatively less material to the fiscal plan. In addition, these risks are difficult to predict and quantify, for example, the federal transfers are subject to federal policy changes while GBEs’ net incomes are subject to regulatory decisions and market conditions. Note 1 to the Consolidated Financial Statements provides additional details on measurement uncertainty.
On the expense side, the fiscal plan includes contingency funds to help mitigate risks. In the 2018 Budget these totalled $1.6 billion: $1.3 billion for operating and $0.3 billion for capital. Funds were used to support initiatives such as:
- Providing funding for the Ontario Student Assistance Program (OSAP) to support higher-than-forecast applications and awards;
- Supporting emergency forest firefighting;
- Recognition of liabilities for land claims that have a high likelihood of settlement and can be reasonably estimated;
- Supporting municipalities and the people of Ontario impacted by natural disasters (including those affected by tornadoes in Ottawa, Greater Madawaska, and Central Frontenac, and flooding in Caledon) through the Disaster Recovery Assistance for Ontarians and the Municipal Disaster Recovery Assistance programs; and
- Supporting the modernization efforts of small and rural municipalities with a one-time investment so that these communities can achieve efficiencies.
Provisions for losses that are likely to occur as a result of contingent liabilities such as ongoing litigation and land claims, and that can be reasonably estimated are expensed and reported as liabilities. Note 1 to the Consolidated Financial Statements provides further details.
Note 3 to the Consolidated Financial Statements explains the Province’s risk management strategies which are intended to ensure that exposure to borrowing-related risk is managed in a prudent and cost-effective manner.
Changes in Canadian generally accepted accounting principles (GAAP) for the public sector issued by the Public Sector Accounting Board can have an impact on the Province’s budgets, estimates and actual results. While changes in GAAP had no material impacts in the current year, the Treasury Board Secretariat actively monitors proposed changes and provides input to standard setters to support the development of standards that support sound public policy decision-making, transparency and accountability in reporting.
As required under the Fiscal Transparency and Accountability Act, 2004
Key financial ratios
In this section of the Annual Report, the use of key measures of financial position will be used to assess the financial position of the Province. The levels and trends of these measures indicate the impacts of economic and other events on the Province’s finances. The ratio and the level of each over the past five years are outlined in Table 8.
Key financial ratios - table 8
as at the end of the fiscal period
|
Item |
Item |
2014–15 |
2015–16 |
2016–17 |
2017–18 |
2018–19 |
|---|---|---|---|---|---|---|
|
Sustainability |
Net debt-to-GDP (%) |
40.6% |
40.3% |
39.6% |
39.2% |
39.6% |
|
Sustainability |
Net debt to total revenue (%) |
233.5% |
225.0% |
223.2% |
215.0% |
220.2% |
|
Sustainability |
Net debt per capita ($) |
$ 21,630 |
$ 22,350 |
$ 22,636 |
$ 23,014 |
$ 23,633 |
|
Flexibility |
Debt charges to total revenue (%) |
8.9% |
8.5% |
8.3% |
7.9% |
8.1% |
|
Flexibility |
Own-source revenue to GDP (%) |
14.4% |
14.9% |
14.7% |
15.2% |
15.1% |
|
Vulnerability |
Federal transfers to total revenue (%) |
17.4% |
17.0% |
17.4% |
16.5% |
16.3% |
|
Vulnerability |
Foreign currency debt to revised total debt (%) |
21.2% |
19.1% |
17.1% |
17.9% |
17.1% |
|
Vulnerability |
Unhedged foreign currency debt (%) |
0.3% |
0.3% |
0.2% |
0.2% |
0.2% |
Notes:
1) Actual results for 2014–15 to 2015–16 used for calculation have been restated to reflect the presentation change for hospitals, school boards and colleges, to classify third-party revenue with government revenue.
2) Actual results for 2014–15 to 2016–17 also reflects a change in accounting treatment for net pension assets of jointly sponsored pension plans.
3) Net debt was restated to reflect prepaid expenses and inventory supplies being reclassified as non-financial assets, as opposed to financial assets in prior years.
4) Beginning in 2018–19, Ontario will begin to present public debt less of any investments in the Province’s own bonds and treasury bills.
Sources: Nominal GDP is based on Ontario Economic Accounts, First Quarter 2019, released on July 12, 2019 by Ontario Ministry of Finance. Population estimates for July 1 are from Statistics Canada (table 17-10-0009-01 released on Sept 27, 2018).
Measures of sustainability
Net debt provides a measure of the future government revenues that will be required to pay for the government’s past transactions. Net debt as a percentage of the Province’s GDP shows the financial demands on the economy resulting from the government’s spending and taxation policies. A lower ratio of net debt-to-GDP indicates higher sustainability.
The Province’s net debt-to-GDP ratio was 39.6 per cent at the end of fiscal year 2018–19. The government has set out its objective for Ontario’s net-debt-to-GDP ratio to reach more sustainable levels. With the introduction of the debt burden reduction strategy in the 2019 Budget, the government has set a target for the Province’s net-debt-to-GDP ratio to be lower, by 2022–23, than the Independent Financial Commission of Inquiry’s forecast for 2018–19 of 40.8 per cent.
The ratio of net debt to total revenue is another key measure of sustainability, since net debt reflects the future revenue that is required to pay for past transactions and events. A lower net debt to revenue ratio indicates higher sustainability. From its peak in 2014–15 at 233.5 per cent, the ratio has declined by 2018–19 to 220.2 per cent, primarily due to revenue rising faster than net debt.
Measures of flexibility
The ratio of interest on debt to total revenue shows the share of provincial revenue that is being used to pay borrowing costs and therefore is not available for programs. A lower ratio indicates that a government has more flexibility to direct its revenues to programs. The ratio has fallen for Ontario over the past five years, from a high of 8.9 per cent in 2014–15 to the current level of 8.1 per cent. Lower interest rates, as well as the Province’s strategy of extending the term of its borrowing program and locking in historically low interest rates for a longer period, has also contributed to lower interest costs. This strategy has extended the weighted average term to maturity of provincially issued debt from approximately 8 years in 2009–10 to 13 years in 2018–19.
Own-source revenue as a share of Ontario’s GDP shows the extent to which the government is leveraging funds from the provincial economy collected through taxation, user fees and other revenue sources it controls. A high taxation burden makes a jurisdiction uncompetitive, therefore increases in the ratio can reduce future revenue flexibility. Ontario’s ratio was stable between 2014–15 and 2018–19.
Measures of vulnerability
Transfers from the federal government, as a percentage of total revenue, are an indicator of the degree to which the Province relies on the federal government for revenue. A very high ratio shows that a provincial government is reliant on federal transfers. Provinces may have limited control over the value of these transfers and changes in federal policies can result in shifts in federal revenues to provinces.
Ontario’s share of revenue from federal transfers (including direct transfers to the Broader Public Sector) has declined from 17.4 per cent in 2014–15 to 16.3 per cent in 2018–19, the lowest share in the past five years. The gradual decline over this period largely reflects lower Equalization entitlements and a lower rate of growth relative to past years in the Canada Health Transfer.
Foreign currency debt to total debt is a measure of vulnerability to changes in foreign currency exchange rates. Accessing borrowing opportunities in foreign currencies allows Ontario to diversify its investor base. It also ensures that the Province will continue to have access to capital in the event that domestic market conditions become more challenging. Ontario manages foreign currency risk by hedging its exposure to Canadian dollars through the use of financial instruments. Effective hedging has allowed the Province to consistently limit its exposure to foreign currency fluctuations to 0.3 per cent of debt issued for provincial purposes in 2014–15, declining to 0.2 per cent in 2018–19.
Fiscal management
Commission findings
The Independent Financial Commission of Inquiry (Commission) was established in July 2018 with a mandate to look at the Province’s past accounting practices and to provide a baseline for the Ontario’s fiscal outlook.
The Commission delivered its report to the government on August 30, 2018, and it was released to the people of Ontario on September 21, 2018.
The government accepted the Commission’s 14 recommendations and is acting on each one. The 2019 Budget indicated that ten of the recommendations have been implemented, the remainder are in progress
Multi-year business planning
The government has taken action to strategically drive change and embed a focus on fiscal sustainability. As part of this effort, the government procured an external consultant to conduct a line-by-line review of historical spending over the past 15 years. The results of the line-by-line review provided a modernization agenda to help drive efficiencies, find cost savings and enable the transformation of public services through Ontario’s multi-year business planning process. This includes:
- Consolidating transfer payments in multiple sectors to reduce administrative costs, increase value for money, enhance the client experience and improve outcomes;
- Conducting a review to explore options and possible implementation strategies for reducing duplication and ensuring best practices in the management of capital assets;
- Building a modern and more efficient workforce by expanding voluntary exit programs to non-bargaining staff, managers and senior executives, designed to streamline the overall size of the Ontario Public Service and achieve long‑term savings;
- Centralizing the supply chain across the OPS and the broader public sector;
- Applying a digital-first approach across government to make it easier for the people of Ontario to access programs and services, reduce government silos, and lower internal administrative burdens and costs; and
- Reviewing business supports programs to identify opportunities for better value for money.
The government has established a dedicated process that reviews all programs in order to provide the evidence base for further program modernization, efficiencies and effectiveness. Moving forward, the multi-year business planning process will build on this and other evidence to deliver meaningful improvements to the public programs and services the people of Ontario and businesses rely on.
Managing interest on debt
The interest on debt expense of $12.4 billion reported for 2018–19 was an improvement of over $0.1 billion over the 2018 Restated Budget. Through a combination of lower-than-forecast interest rates and cost-effective debt management, interest on debt has consistently come in below plan in each year since the 2010 Budget.
Non-financial activities
This section discusses key non-financial results of major sectors. The purpose is to provide highlights of government spending and the related activities in these sectors.
Health care
The government acts as a steward of the health care sector, providing overall direction and leadership for the system, including planning and resource management. The government also manages key provincial programs, including hospitals, long-term care, home and community care, the Ontario Health Insurance Program (OHIP), assistive devices program, drug programs, emergency services, independent health facilities and laboratory services.
Results reported in 2018–19 include:
- Created 1,100 beds and spaces in hospitals and in the community, including over 640 new beds and spaces in the short-term. This investment helped communities prepare for the flu season and reduced the strain on the health care system by creating new capacity.
- Investments in the hospital sector maintained critical hospital capacity, increased access to highly specialized and innovative treatments, and supported volume growth.
- Provided medical services to treat cancer detected from various provincial screening programs. The cancer treatments include cancer surgeries, chemotherapy radiation, stem cell transplants, related positron emissions tomography (PET) scans and gastrointestinal (GI) endoscopy screenings.
- Addition of 7,200 new long-term care beds across the province. This represents the first wave of more than 15,000 new long-term care beds that the government committed to build over the next five years.
- Committed to spending $1.9 billion over 10 years on mental health and addictions services, and supportive housing, matching the federal government’s 2017 Budget commitment. As part of this investment, Ontario has announced the creation of more than 50 new mental health beds at 12 hospitals across Ontario. These beds will help lower wait times for those in need of inpatient mental health and addictions treatment, helping to end hallway health care. Also, as part of this investment, a Mental Health and Addictions Centre of Excellence and a core services delivery model is proposed.
- Launched a strategy to advance the health care system towards an integrated delivery model which improves transitions in care and patient and provider experiences. The strategy would streamline health care governance oversight, increase the use of virtual care and digital tools, and create administrative efficiencies including the creation of a central procurement system to manage the purchasing of products and devices for hospitals, home and community care, and long-term care homes.
- Amended OHIP+, providing eligible prescription medications to children and youth under the age of 25 who are not covered by private plans.
- Wound down the Self-Directed Personal Support Services Ontario agency to reduce the administration burden of delivering home care.
Education
Ontario’s publicly funded early years and education system is focused on preparing Ontario’s children and students for success, ensuring young people can develop monetizable skills that they can apply to the labour market and get good, high paying jobs.
Results reported in 2018–19 include:
- For the 2018–19 school year, approximately two million students were enrolled in elementary and secondary education through Ontario’s publicly funded education system, an increase of approximately 1 per cent over 2017–18.
- Improving child care. In 2018–19, there were 446,496 licensed child care spaces for children age 0-12, a 5.0 per cent increase from 2017–18. Approximately 264,000 four- and five-year old children are benefiting from full-day kindergarten annually in approximately 3,500 schools across the province.
- Providing more before- and after-school care programs. In 2018–19, 85 per cent of elementary schools offered before- and after-school programs for children four to 12 years of age. There were more than 12,000 additional licensed care spaces for children in this age group than in 2017–18.
Postsecondary and training
Postsecondary and training helps prepare people with the knowledge and skills required for the modern workforce. Ontario’s economic prosperity and competitive advantage are increasingly dependent on a highly skilled, diverse and adaptive workforce.
Results reported in 2018–19 include:
- A 69 per cent postsecondary education attainment rate, up from 68 per cent in 2017–18.
- Supported training for over 72,900 apprentices, and certification for over 9,800 trade professionals, up from 71,000 apprentices and 8,200 trade professionals in 2017–18.
- Employment, training and labour market programs and services were provided to more than one million Ontarians through Employment Ontario.
- OSAP provided financial aid to about 450,000 students.
Children’s and social services
The Ministry of Children, Community and Social Services (MCCSS) funds as well as delivers programs and services that promote thriving and inclusive communities, and help the people of Ontario build independence and improve their quality of life. During the 2018–19 fiscal year, the Ministry’s focus was on streamlining program delivery and reducing costly and unnecessary administration work in an effort to improve outcomes for people.
Results reported in 2018–19 include:
- Ontario invested $1.6 million in more than 60 projects which will upgrade and repair community agencies that provide services for people with developmental disabilities, as well as women and children escaping domestic violence, Indigenous people, children with mental health needs, and others being supported in community settings.
- In 2018–19, about one million Ontarians received some form of social assistance on a monthly basis. Efforts were focused on service excellence, organizational effectiveness and accountability. The ministry also made technology advancements, enhanced staff training, developed stronger relationships with community partners and streamlined processes to improve service delivery and ensure fiscal responsibility.
- Through the Family Responsibility Office (FRO), the ministry collects and distributes court-ordered child and spousal support payments. In 2018–19, FRO collected approximately $13 for every $1 invested in the program.
- In January 2019, the Ontario government completed the provincial transfer of children’s rehabilitation services (speech-language pathology, occupational therapy and physiotherapy) for students in publicly funded schools from the Ministry of Health and Long-Term Care to MCCSS. The transfer is a step toward better integrated and more streamlined services that improve outcomes and service experiences for children with rehabilitation needs and their families.
- In May 2018, the Ontario government began to phase in an additional hearing screen for newborns, to further improve early identification of hearing loss through a partnership between the Infant Hearing Program (IHP) and Newborn Screening Ontario. Since July 29, 2019, all newborns born in Ontario have been offered this screen.
- The Ontario government is supporting low-and moderate-income families through an annual cost-of-living increase to the Ontario Child Benefit, to help assist with the cost of raising children.
- As part of the 2018 Fall Economic Statement, the government announced that it is taking measures to wind down the operations of the Ontario Child Advocate and to expand the scope and mandate of the Ontario Ombudsman. This includes transferring the investigative powers and staff from the Ontario Child Advocate to the Ontario Ombudsman in order to increase oversight responsibility for investigations related to Ontario’s children. The Ontario Ombudsman will be able to investigate services provided to children and youth by Children’s Aid Societies and in children’s residences. These changes came into effect on May 1, 2019.
- On January 28, 2019, the Youth Cannabis Diversion Program was opened for referrals. The program gives the courts and law enforcement offices the ability to refer youth to the Diversion Program in lieu of proceeding with a fine or criminal charges for certain cannabis-related offences.
- On November 26, 2018, the Minister announced the creation of three youth roundtables. Young people 18-25 years of age, including Indigenous youth, with lived experience in child welfare, residential services and the youth justice system will share ideas for improving Ontario’s child welfare and youth justice systems.
Justice
The justice sector supports the administration and delivery of justice services, including the administration of courts, prosecution of offences, provision of legal services, supports to victims and vulnerable persons, and administers the public safety, policing and correctional systems to ensure that Ontario’s diverse communities are supported and protected.
Results reported in 2018–19 include:
- Introduced a tightly regulated private retail system for cannabis overseen by the Alcohol and Gaming Commission of Ontario as the provincial regulator. The Province has also aligned cannabis consumption rules with the restrictions set out in the Smoke-Free Ontario Act, 2017.
- Passed the Comprehensive Ontario Police Services Act, 2019 which created the new Community Safety and Policy Act, 2019 (CSPA). The CSPA sets out core policing functions that must be provided by a member of a police service, reforms police oversight and introduces a framework to strengthen diversity training for police officers and police service board members.
- Invested in actions to combat gun- and gang-violence across the province, in particular in Toronto and Ottawa. Invested $25 million over 4 years to support Toronto in tackling gun- and gang-violence. This included $7.6 million to establish an Intensive Firearm Bail Support Team to ensure that the strongest possible evidence is placed before the court when the Crown is seeking detention for serious firearm charges. This is part of a comprehensive, multi-phased, multi-ministry strategy to help combat gun- and gang-violence across the province and keep communities safe including $18 million to provide additional digital, investigative and analytical tools to Toronto Police.
- Invested in justice sector infrastructure including courts, public safety communications, policing and correctional services infrastructure.
Condition of provincial tangible capital assets
Infrastructure investments should be made using an evidence-based approach including a focus on asset management which will ensure the delivery of high-quality public services while managing the cost of these services.
- The Province compiled its first asset inventory in 2016 as a key step in managing provincial assets more effectively. The inventory was updated in 2018 and currently contains information such as the location, age, condition and value of over 15,000 tangible capital assets including buildings and the entirety of the province’s bridges and road network. This covers the majority of the infrastructure assets owned or consolidated (i.e., certain broader public sector organizations) by the Province, as well as some other assets that are funded in part by the Province, but not owned or consolidated by the Province.
- The asset inventory is now updated annually to include additional asset classes and more information that is comparable across sectors establishing a baseline to measure change over time.
- The Province uses the inventory to track, monitor and report on the physical condition of assets. For example, the inventory contains indicators such as Facility Condition Indexes (FCIs), Bridge Condition Indexes (BCIs) and Pavement Condition Indexes (PCIs), which help to inform the state of infrastructure assets.
- Ontario is expanding infrastructure asset data management to include other relevant data such as the current and projected capacity and utilization of assets. This integrated data will provide a base to support evidence-based infrastructure planning decisions which help ensure that infrastructure investments provide value for money and are made at the right time and the right place.
Transparency and Accountability
Ontario continues to take steps that enhance government transparency and fiscal accountability in financial reporting.
Recent developments in public sector accounting standards
The Province’s financial reports are prepared in accordance with the accounting principles for governments issued by the Public Sector Accounting Board (PSAB) of the Chartered Professional Accountants of Canada (CPA Canada).
PSAB’s project on the concepts underlying financial performance remains a work in progress. Ontario, along with other senior Canadian governments, continues to monitor the work of the project’s task force and to provide input to support high-quality Canadian public sector accounting standards.
As described in Note 1 to the Consolidated Financial Statements, future changes in both public sector and private sector accounting standards may affect how assets, liabilities, revenues and expenses are reported in the Province’s consolidated financial reports. Other current projects that are being closely monitored by Ontario include PSAB’s review of its employment benefits standard which includes accounting for pensions as well as accounting for financial instruments, foreign currency translation, asset retirement obligations, revenue reporting and public-private partnerships.
The C.D. Howe Institute Fiscal Accountability Report
In May 2019, the C.D. Howe Institute issued its annual commentary on fiscal reporting transparency of senior Canadian governments, with a focus on the relevance, accessibility, timeliness, and reliability of these government financial reports. Each government is assigned a letter grade based on the quality of the numbers presented in these reports, access and user friendliness, and the ability to use them for various decision-making purposes.
The May 2019 report covers the 2017–18 Public Accounts. In it, Ontario experienced a “marked improvement” on its grading as a result of the unqualified audit opinion that it received on the 2017–18 Public Accounts.
Footnotes
- footnote[1] Back to paragraph Expenses reported in 2018 Restated Budget have been adjusted for changes in accounting policy. See Note 17 of the Consolidated Financial Statements.
- footnote[2] Back to paragraph Financial assets and liabilities have been restated for changes in presentation. See Note 17 of the Consolidated Financial Statements.
- footnote[3] Back to paragraph Provincial revenue from Hydro One Limited’s net income is proportional to the Province’s ownership share.
- footnote[5] Back to paragraph Expenses reported in 2018 Restated Budget have been adjusted for changes in accounting policy. See Note 17 of the Consolidated Financial Statements.
- footnote[4] Back to paragraph Ontario Teachers’ Pension Plan impact is included in Other programs to align with the presentation in table 3.17 of the 2018 Budget. In the Consolidated Financial Statements, this item appears under the Education sector. Schedule 4 to the financial statements provides details.
- footnote[6] Back to paragraph A presentation change was made to Investments. Beginning in 2018–19, Ontario will begin to present investments net of any investments in the Province’s own bonds and treasury bills. See Note 17 in the Consolidated Financial Statements.
- footnote[7] Back to paragraph Includes adjustments for the net book value of assets disposed during the year, as well as changes in valuation.
- footnote[8] Back to paragraph Mainly transfers for capital purposes to municipalities and universities and expenditure for capital repairs.
- footnote[9] Back to paragraph Includes government administration, natural resources, social, culture and tourism sectors.
- footnote[10] Back to paragraph Includes third-party investments in consolidated entities such as hospitals, colleges and schools.
- footnote[11] Back to paragraph A presentation change was made to Debt. Beginning in 2018–19, Ontario will present public debt less of any investments in the Province’s own bonds and treasury bills. See Note 17 for the Consolidated Financial Statements.
- footnote[12] Back to paragraph Increase in cash from a net increase of $9.0 billion in changes to assets and liabilities net of the Province’s operating deficit of $7.4 billion. See the Consolidated Statement of Cash Flow.
- footnote[13] Back to paragraph New TCA investments of $12.4 billion less proceeds of $0.2 billion from the sale of tangible capital assets.
- footnote[14] Back to paragraph Decrease in cash due to Investment purchases in excess of retirement of $5.1 billion and the build- up of cash reserve of $1.9 billion.
- footnote[15] Back to paragraph Including net increase in financing of capital projects through Public-Private Partnership (P3). See Note 4 to the Consolidated Financial Statements.
- footnote[16] Back to paragraph As of May 29, 2019, the Financial Transparency and Accountability Act, 2004 was repealed and replaced by the Fiscal Sustainability, Transparency and Accountability Act, 2019. The reserve requirements have not changed between these two acts.