Public Accounts 2022–23: Annual report
The annual report is a high-level summary of the fiscal year’s results. It includes financial statements, analyzes the state of the Ontario government’s finances and outlines achievements for the fiscal year.
Foreword
I am pleased to present the 2022–23 Public Accounts for the Province of Ontario. The Public Accounts provide the people of Ontario a clear and comprehensive view of the province’s finances. This document outlines the prudent actions that were taken to strengthen and safeguard the province’s economic position during the past fiscal year.
As Ontario continues to face economic challenges and uncertainties, including the pressure of rising costs and interest rate hikes, our government is working hard to support families, businesses, and workers today, while also laying a strong fiscal foundation for future generations.
We are taking a targeted, responsible approach to our fiscal plan — creating the conditions to attract jobs and investments, investing in the critical infrastructure that our growing province needs and at the same time, providing Ontarians with the services they deserve.
The 2022–23 Public Accounts illustrates that the government is delivering on its Plan to Build by investing $186.4 billion across all programs. This represents a $15.9 billion or 9.3% increase over program spending in the previous fiscal year.
As Ontario’s population continues to grow, much-needed investments have been made to provide meaningful support in high-priority areas and communities across the province.
For example, to help more people find good jobs and address the historic labour shortages facing Ontario, the government invested $1.6 billion in employment services and training. This includes enhancements to the Skills Development Fund to help train the workforce of the future.
Our government continued to strengthen Ontario’s competitiveness, including a $364 million increase in targeted investments to support the province’s growing automotive manufacturing sector and the hundreds of thousands of direct and indirect jobs that depend upon it every day.
Investing in affordable housing, transit, highways, hospitals, long-term care homes, schools and day cares continues to be a key part of the government’s Plan to Build. To support the most ambitious capital plan in Ontario’s history that will touch every corner of the province, the government invested $1.5 billion or 8.5% more in infrastructure compared to the previous year.
Our government is also connecting the people of Ontario to the care they need closer to home. In 2022–2023, base programs in the health care sector increased by $5.6 billion or 8% to provide convenient care to people in communities across the province.
As well, investments made in the education sector grew by $4.5 billion or 15% to support Ontario families. This increase includes the implementation of the Canada-wide Early Learning and Child Care Agreement, which reduces average out-of-pocket child care fees for parents across the province.
The results in the 2022–23 Public Accounts show that targeted investments are building a stronger, more resilient economy and a stronger Ontario. Our government will continue with its responsible approach by making targeted choices that will help build Ontario for families and businesses — today and tomorrow.
Original signed by:
The Honourable Caroline Mulroney
President of the Treasury Board
Introduction
The Annual Report is a key element of the Public Accounts of the Province of Ontario and is central to demonstrating the Province’s transparency and accountability in reporting its financial activities and position. Ontario’s Consolidated Financial Statements present the financial results for the 2022–23 fiscal year against the 2022 Budget released on April 28, 2022, and the financial position of the government as of March 31, 2023. As in previous years, the Annual Report also compares the current year’s results to the prior year’s results and provides a five-year trend analysis for many key financial ratios.
Producing the Public Accounts of Ontario requires the teamwork and collaboration of many stakeholders across Ontario’s public sector. The Office of the Auditor General plays a critical role in auditing and reporting on the Province’s financial statements, and the Standing Committee on the Public Accounts also plays an important role in providing legislative oversight and guidance. I would like to thank everyone for their contributions and collaboration.
We welcome your comments on the Public Accounts. Please share your thoughts by email to infoTBS@ontario.ca, or by writing to the Office of the Provincial Controller, Re: Annual Report, Treasury Board Secretariat, Second Floor, Frost Building South, 7 Queen’s Park Crescent, Toronto, Ontario M7A 1Y7.
Original signed by:
Deborah Richardson
Deputy Minister and Secretary of the
Treasury Board and Management Board of Cabinet
Treasury Board Secretariat
Statement of responsibility
The Consolidated Financial Statements are prepared by the Government of Ontario in accordance with the accounting principles for governments issued by the Public Sector Accounting Board (PSAB).
The Consolidated Financial Statements are audited by the Auditor General of Ontario in accordance with the Auditor General Act, and with Canadian generally accepted assurance standards. The Auditor General expresses an independent audit opinion on these Consolidated Financial Statements. Her report, which appears on pages 49–55, provides her audit opinion and the basis for this opinion.
Management prepares the Consolidated Financial Statements in accordance with generally accepted accounting principles for the public sector. Management is also responsible for maintaining systems of financial management and internal controls to provide reasonable assurance that transactions recorded in the Consolidated Financial Statements are within statutory authority, assets are properly safeguarded, and reliable financial information is available for preparation of these Consolidated Financial Statements.
Original signed by:
Deborah Richardson
Deputy Minister,
Treasury Board Secretariat
August 29, 2023
Original signed by:
Greg Orencsak
Deputy Minister,
Ministry of Finance
August 29, 2023
Original signed by:
Beili Wong, FCPA, FCA
Comptroller General and Associate Deputy Minister,
Office of the Comptroller General
Treasury Board Secretariat
August 29, 2023
Original signed by:
Maureen Buckley, CPA, CA
Assistant Deputy Minister and Provincial Controller,
Treasury Board Secretariat
August 29, 2023
The Government of Ontario is responsible for the Consolidated Financial Statements and accepts responsibility for the objectivity and integrity of these Consolidated Financial Statements and the Financial Statement Discussion and Analysis. Those charged with governance are responsible for overseeing the Government of Ontario’s financial reporting process.
Original signed by:
The Honourable Prabmeet Sarkaria
President of the Treasury Board
August 29, 2023
Original signed by:
The Honourable Peter Bethlenfalvy
Minister of Finance
August 29, 2023
Financial statement discussion and analysis
Highlights
2022–23 Financial highlights (billion dollars) — Table 1
| Item | 2022 Budget $ |
2022–23 actual $ |
2021–22 restated actual $ |
Change from 2022 Budget $ |
Change from 2021–22 restated actual $ |
|---|---|---|---|---|---|
| Total revenue | 179.8 | 192.9 | 185.1 | 13.1 | 7.8 |
| Expense — Programs | 185.1 | 186.4 | 170.5 | 1.3 | 15.9 |
| Expense — Interest on debt | 13.6 | 12.4 | 12.6 | (1.2) | (0.2) |
| Total expense | 198.6 | 198.8 | 183.1 | 0.2 | 15.7 |
| Reserve | 1.0 | - | - | (1.0) | - |
| Annual surplus/(deficit) | (19.9) | (5.9) | 2.0 | 14.0 | (7.9) |
| Item | 2022–23 actual $ |
2021–22 restated actual $ |
Change from 2021–22 restated actual $ |
|---|---|---|---|
| Financial assets | 133.9 | 130.4 | 3.5 |
| Liabilities | 534.3 | 513.3 | 21.0 |
| Net debt | (400.5) | (382.8) | (17.7) |
| Non-financial assets | 153.7 | 144.7 | 9.0 |
| Accumulated deficit | (246.8) | (238.2) | (8.6) |
| Item | 2022–23 actual $ |
2021–22 restated actual $ |
Change from 2021–22 restated actual $ |
|---|---|---|---|
| Accumulated operating deficit | (247.1) | (238.2) | (8.90) |
| Accumulated remeasurement gains/(losses) | 0.3 | - | 0.3 |
Note: Numbers may not add due to rounding.
Financial highlights
Change from 2021–22 actuals
- The Ontario government recorded a $5.9 billion deficit for the fiscal year ended March 31, 2023, compared to the previous year’s restated surplus of $2.0 billion, mainly due to higher program spending partially offset by higher revenues (see Table 1 above).
- Total revenues are $192.9 billion, which are $7.8 billion or 4.2% higher than the previous year, largely due to increases in taxation revenues, transfers from the Government of Canada, and revenues reported by ministries and the broader public sector. This was partially offset by lower net income from Government Business Enterprises. See details on pages 8–9.
- Total program expenses are $186.4 billion, which is $15.9 billion or 9.3% higher than the previous year. Expenses are higher in the health sector mainly due to increased investments in base programs to address the needs of an aging population and meet the growing demand of health care services. Year-over-year program expenses in the children’s and social services, education, postsecondary education, and other program sectors are higher mainly due to demand-driven programs in the social services sector; the implementation of the Canada-wide Early Learning and Child Care plan; higher college spending; liabilities and the recognition of contingent liabilities associated with Treaty rights and Aboriginal rights and other claims against the Crown; costs to bring new and expanded transit service online and assistance to support municipal transit; increased investments for broadband and the Investing in Canada Infrastructure Program (ICIP); and variability in demand-driven Business Risk Management programming. See details on pages 13–17.
- Interest on debt is lower than the previous year by $0.2 billion, or 1.6%, mainly due to higher interest capitalization from consolidated entities as well as an increase in interest income from the broader public sector. See details on page 23.
- Non-financial assets, including capital assets, increased by $9.0 billion from the previous year. The net book value of Ontario’s capital assets, such as buildings and transportation infrastructure, grew by $8.8 billion during the year. Ontario invested $16.3 billion in assets owned by the government and its consolidated entities, which reflect new capital investments in the transportation, health, education and other program sectors. The government also made $2.9 billion in additional capital investments in transfers to non-consolidated partners and other infrastructure expenditures. See details on pages 27–29.
- Total liabilities increased by $21.0 billion and total financial assets increased by $3.5 billion, resulting in an increase of $17.7 billion or 4.6% in net debt from the previous year (see details on pages 26–31). The increase of liabilities is mainly due to the recognition of contingent liabilities associated with Treaty rights and Aboriginal rights, and other claims against the Crown. The accumulated deficit increased by $8.6 billion, or 3.6%, from the previous year mainly as a result of the reported deficit of $5.9 billion. See details on page 60.
Change from the 2022 Budget
- The Ontario government recorded a $5.9 billion deficit for the fiscal year ended March 31, 2023, compared to a forecasted deficit of $19.9 billion in the 2022 Budget, primarily due to higher revenues (see Table 1 above).
- Total revenues of $192.9 billion, are $13.1 billion or 7.3% higher than projected in the 2022 Budget, mainly due to higher taxation revenues reflecting strong economic growth and higher than expected inflation. Higher revenues were also reported by ministries and the broader public sector, as well as higher-than-expected transfers from the Government of Canada. This was partially offset by weaker-than-expected net income from Government Business Enterprises. See details on page 10.
- Total program expenses of $186.4 billion, are $1.3 billion or 0.7% higher than the 2022 Budget. Program expenses are higher in the education, postsecondary education and other program sectors mainly due to one-time Catch Up Payments in 2022–23 that provided direct funding to parents to help fill student learning gaps that emerged during the COVID‑19 pandemic, higher-than-forecasted college spending, and the recognition of liabilities and contingent liabilities associated with Treaty rights and Aboriginal rights and other claims against the Crown. Investments are lower in the health sector mainly due to lower COVID‑19 spending. See details on pages 18–19.
- Interest on debt is lower than the 2022 Budget by $1.2 billion, or 8.8%, due to a reduction in the borrowing program of approximately $9.3 billion and a lower than forecast deficit for 2022–23, as well as higher than budgeted interest capitalization and interest income from rising interest rates. See details on page 23.
Analysis of 2022–23 results
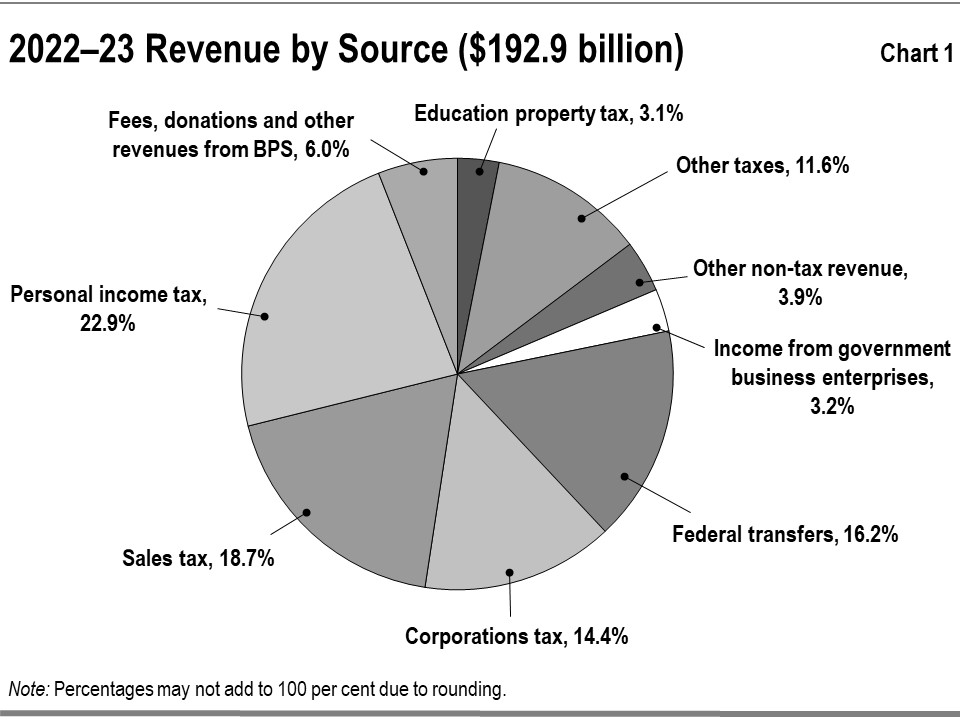
Revenue
| Revenue | 2022 Budget $ |
2022–23 actual $ |
2021–22 restated actual $ |
Change from 2022 Budget $ |
Change from 2021–22 restated actual $ |
|---|---|---|---|---|---|
| Personal income tax | 44.6 | 44.2 | 46.8 | (0.4) | (2.6) |
| Sales tax | 32.3 | 36.1 | 30.4 | 3.8 | 5.7 |
| Corporations tax | 19.7 | 27.8 | 25.2 | 8.1 | 2.6 |
| Employer health tax | 7.8 | 7.8 | 7.2 | - | 0.6 |
| Education property tax | 5.7 | 6.0 | 5.7 | 0.3 | 0.3 |
| Ontario health premium | 4.7 | 4.4 | 4.4 | (0.3) | - |
| Gasoline and fuel tax | 2.8 | 2.7 | 3.0 | (0.1) | (0.3) |
| Other taxes | 8.8 | 7.5 | 9.0 | (1.3) | (1.5) |
| Total taxation revenue | 126.4 | 136.5 | 131.7 | 10.1 | 4.8 |
| Government of Canada | 31.0 | 31.3 | 30.6 | 0.3 | 0.7 |
| Income from Government Business Enterprises | 6.3 | 6.1 | 6.4 | (0.2) | (0.3) |
| Fees, donations and other revenues from Broader Public Sector Organizations | 9.4 | 11.5 | 9.7 | 2.1 | 1.8 |
| Other non-tax revenue | 6.7 | 7.5 | 6.7 | 0.8 | 0.8 |
| Total revenue | 179.8 | 192.9 | 185.1 | 13.1 | 7.8 |
Note: Numbers may not add due to rounding.
Change from 2021–22 actuals
Total revenues for 2022–23 increased by $ 7.8 billion or 4.2% from the previous year.
- Taxation revenue increased by $4.8 billion or 3.6% in 2022–23, mostly reflecting strong economic growth. This was moderated by lower Personal Income Tax (PIT), mainly by lower tax assessments from the Canada Revenue Agency (CRA) for prior years, following the release of the Public Accounts 2021–22. axation revenues were also moderated by lower Land Transfer Tax (LTT) due to a weaker housing market in 2022, and lower Gasoline and Fuel taxes reflecting the temporary reduction to the Gasoline Tax by 5.7 cents per litre and Fuel Tax by 5.3 cents per litre.
- Transfers from the Government of Canada increased by $0.7 billion or 2.3% in 2022–23, mostly reflecting higher transfers from major federal funding programs, including the Canada Health Transfer, the Canada Social Transfer, support for early learning and child care and infrastructure. This increase was partially offset by the wind-down of COVID‑19 time-limited funding.
- Income from Government Business Enterprises (GBEs) decreased by $0.3 billion or 4.7% in 2022–23, mainly due to lower net income from Ontario Power Generation (OPG), reflecting lower realized returns from the Ontario Nuclear Funds and an increase in asset retirement costs, compared to the same period last year. Net income from the LCBO was also lower reflecting higher costs driven by global supply chain disruptions. This was partially offset by higher net income from the Ontario Lottery and Gaming Corporation (OLG), and the Ontario Cannabis Retail Corporation (OCRC), also known as the Ontario Cannabis Store (OCS) and a newly consolidated GBE in 2022–23, iGaming Ontario (iGO).
- Fees, donations and other revenues from Broader Public Sector Organizations (BPS) increased by $1.8 billion or 18.6% in 2022–23, mainly due to higher third-party revenue from BPS organizations driven by business operations normalizing after the COVID‑19 pandemic. It also reflects a newly consolidated BPS sector, Children’s Aid Societies.
- Other non-tax revenue increased by $0.8 billion or 11.9% in 2022–23, mainly from Vehicle Licensing and Registrations Fees reflecting continuing fees on heavy commercial vehicles, and the impact of lower revenues booked in the previous year from the elimination and one-time refund of passenger and light commercial vehicle permit and sticker validation fees back to March 2020.
Change from the 2022 Budget
Ontario’s nominal GDP grew 9.2% in the 2022 calendar year, up from a projection of 6.7% at the time of the 2022 Budget reflecting higher-than-expected inflation in 2022.
Revenues for 2022–23 were $13.1 billion or 7.3% higher than expected in the 2022 Budget.
- Taxation revenues were $10.1 billion or 8.0% higher than projected in the 2022 Budget, as a result of higher net tax assessments and entitlements for 2022 and prior years, based on new information received from the federal government since the release of the 2022 Budget.
- Transfers from the Government of Canada were $0.3 billion or 1.0% higher, mainly due to the recognition of in-kind federal revenue associated with donated COVID‑19 supplies, partially offset by a reprofiling of funding under the ICIP due to slower-than-expected delivery of projects.
- Income from GBEs was $0.2 billion or 3.2% lower, mainly reflecting weaker revenue from OPG and LCBO. Net income from OPG was lower due to lower realized returns from the Ontario Nuclear Funds and an increase in asset retirement costs. LCBO net income was impacted by lower-than-expected sales because of a rapid normalization of consumer purchasing patterns following the COVID‑19 pandemic. This was partially offset by higher-than-expected net income from the OLG, OCS and iGO, a newly consolidated GBE in 2022–23.
- Fees, donations, and other revenues from BPS were $2.1 billion or 22.3% higher, mainly due to growth in third-party revenue from the colleges and hospitals driven by the normalization of operations post-COVID‑19. It also reflects a newly consolidated BPS sector in 2022–23, Children’s Aid Societies.
- Other non-tax revenues increased by $0.8 billion or 11.9%, mainly reflecting higher recoveries of Prior Year Expenditures, as well as higher than expected revenue from fees, licenses, and permits, and miscellaneous revenue sources reported by ministries and consolidated government organizations.
Revenue trend
Chart 2 shows the recent trends in revenue for Ontario’s major revenue sources.
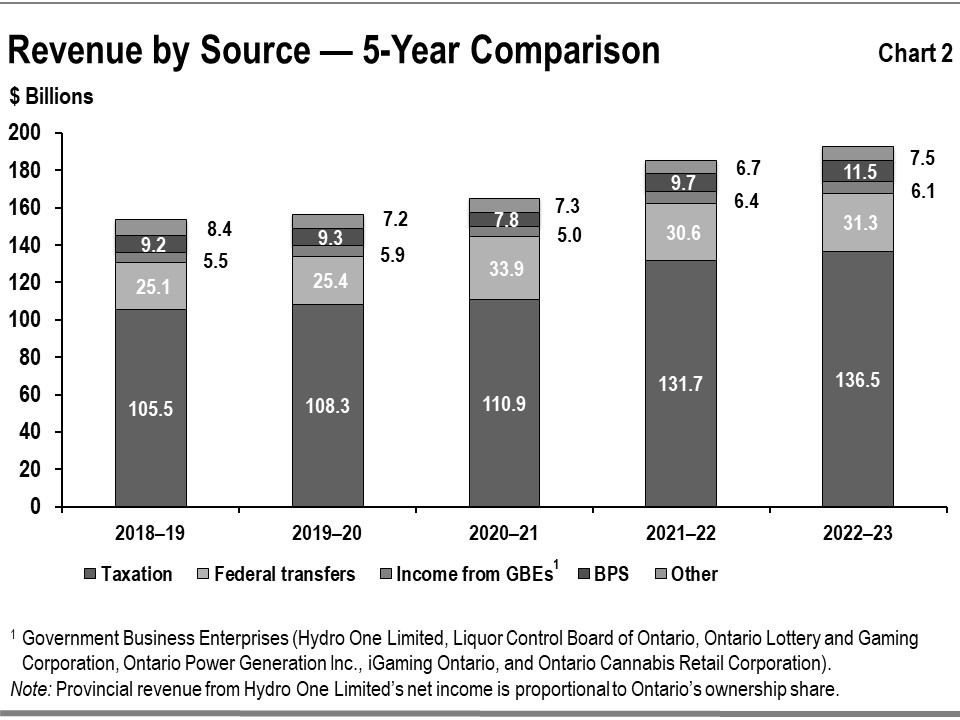
Taxation revenue
Between 2018–19 and 2022–23 taxation revenue grew at an average annual rate of 6.6%, higher than the average annual rate of nominal GDP growth of 5.0%.
Although economic growth and taxation revenue growth are closely linked, the relationship is affected by several factors, including but not limited to:
- Growth in some revenue sources, such as Corporations Tax and Mining Tax, which can diverge significantly from economic growth in any given year due to the inherent volatility of business profits as well as the use of tax provisions, such as the option to carry losses forward or backward;
- The impact of housing completions and resales on HST and Land Transfer Tax revenue which is proportionately greater than their contribution to GDP; and
- Changes in volume-based gasoline and fuel taxes which are more closely aligned to growth in real GDP as opposed to nominal GDP since these revenue sources are not directly influenced by price changes.
Federal government transfers
Government of Canada transfers are based on existing federal-provincial funding arrangements and formulas. These include major federal transfers such as the Canada Health Transfer, Canada Social Transfer, and Equalization, as applicable. There are also a number of federal transfers to the Province which are largely program-specific such as for social housing, infrastructure and labour market programs. Some transfers are ongoing while others are time-limited.
Between 2018–19 and 2022–23, Government of Canada transfers grew at an annual average rate of 5.7%.
Income from Government Business Enterprises
Income from GBEs include OPG, Hydro One Limited (HOL), LCBO, OLG, OCS and iGO, a newly consolidated GBE in 2022–23.
Between 2018–19 and 2022–23, income from GBEs increased at an annual average rate of 2.9%.
Fees, donations and other revenues from Broader Public Sector Organizations
Between 2018–19 and 2022–23, revenue from BPS increased at an average annual rate of 5.6%. This increase mainly reflects growth in third-party revenue from the colleges and hospitals as well as revenue from Children’s Aid Societies which is consolidated for the first time with the Ontario financial statements in the 2022–23 Public Accounts.
Other non-tax revenues
Other non-tax revenues arise from a number of sources, including fees, sales and rentals of goods and services, licences and permits, reimbursements of provincial expenditures in delivering certain services, royalties for the use of Crown resources and power supply contract recoveries.
Other non-tax revenue s decreased at an annual average rate of 2.8% between 2018–19 and 2022–23.
Expense
| Expense | 2022 Budget $ |
2022–23 actual $ |
2021–22 restated actual $ |
Change from 2022 Budget $ |
Change from 2021–22 restated actual $ |
|---|---|---|---|---|---|
| Health sector | 79.9 | 78.5 | 75.8 | (1.4) | 2.7 |
| Education sector |
33.0 | 34.5 | 30.0 | 1.5 | 4.5 |
| Postsecondary education sector | 10.8 | 11.6 | 10.6 | 0.8 | 1.0 |
| Children’s and social services sector | 18.3 | 18.1 | 17.1 | (0.2) | 1.0 |
| Justice sector | 5.4 | 5.4 | 5.0 | - | 0.4 |
| Other programs | 37.6 | 38.2 | 32.1 | 0.6 | 6.1 |
| Total program expense | 185.1 | 186.4 | 170.5 | 1.3 | 15.9 |
| Interest on debt | 13.6 | 12.4 | 12.6 | (1.2) | (0.2) |
| Total expense | 198.6 | 198.8 | 183.1 | 0.2 | 15.7 |
| Reserve | 1.0 | - | - | (1.0) | - |
Note: Numbers may not add due to rounding.
Change from 2021–22 actuals
Total program expenses for 2022–23 increased by $15.9 billion or 9.3%, from $170.5 billion in the previous fiscal year to $186.4 billion.
- Health sector expense increased by $2.7 billion or 3.6% over the previous fiscal year, mainly due to increased spending in base health sector programs to meet growing demand. Key health sector investments included:
- $1.1 billion in additional base hospital funding primarily to support core clinical services, health human resources, surgical recovery and additional acute, post-acute and critical care beds to respond to Ontario’s aging and growing population. This also supported connecting patients to the right care in the right place by moving those patients that no longer need hospital treatment, out of hospitals and into more appropriate community care settings;
- $1.0 billion in additional Ontario Health Insurance Plan (OHIP) funding primarily to support increased utilization of health care services, including more visits to physicians;
- $0.4 billion primarily to support the Long-Term Care Staffing Plan to increase the daily direct care for long-term care residents to improve quality of care;
- $0.3 billion in investments to expand and stabilize home and community care services; and
- The variance also reflects the lower COVID‑19 spending as well as the contingent liabilities related to the Protecting a Sustainable Public Sector for Future Generations Act, 2019 as a result of the November, 29, 2022, Ontario Superior Court decision.
- Education sector expenses increased by $4.5 billion or 15.0% over the previous fiscal year. This is mainly due to spending to continue implementation of the Canada‐wide Early Learning and Child Care Agreement that reduces average out‐of‐pocket childcare fees, funding to support enrolment growth and commitments consistent with labour agreements reached and contingent liabilities related to the Protecting a Sustainable Public Sector for Future Generations Act, 2019 as a result of the November, 29, 2022, Ontario Superior Court decision.
- Postsecondary education sector expenses increased by $1.0 billion or 9.4% over the previous fiscal year. This is mainly due to higher college spending from the complete re-opening of campuses after easing of public health restrictions, increased overall student enrolment and higher spending on student financial assistance.
- Children’s and social services sector expenses increased by $1.0 billion or 5.8% over the previous fiscal year, primarily due to increasing the monthly core allowances for the Ontario Disability Support Program and the maximum monthly amount for the Assistance for Children with Severe Disabilities program by 5% as of September 2022, as well as year-over-year increases in demand-driven programs such as Social Assistance and Developmental Services.
- Justice sector expenses increased by $0.4 billion or 8.0% over the previous fiscal year, mainly due to additional funding for public safety including community safety policing and the Ontario Provincial Police, supports — such as nursing services — at Ontario’s correctional facilities, and investments to reduce the backlog of cases and active tribunal applications.
- Other programs expenses increased by $6.1 billion or 19.0% over the previous fiscal year, mostly reflecting:
- $6.25 billion increase primarily due to liabilities and recognition of contingent liabilities for Treaty rights and Aboriginal rights;
- $860 million increase primarily due to costs to bring new and expanded transit services and higher amortization expenses associated with more transportation assets in service, as well as increased time-limited support to help municipal transit systems recover from the COVID‑19 pandemic;
- $364 million increase due to strategic investments in industrial support and land development, including Ontario’s auto manufacturing sector;
- $303 million increase due to the transfer of the Motor Vehicle Accident Claims Fund program from a stand-alone reporting entity to a component of the Ministry of Government and Consumer Services;
- $237 million increase due to cultural media and domestic tourism tax credits;
- $235 million increase related to funding provided to the City of Toronto to address a portion of its 2022 operating deficit;
- $144 million increase due to higher uptake from the agricultural sector for demand-driven Business Risk Management programming, driven by various factors such as commodity prices, weather and market conditions;
- $138 million increase in infrastructure programs primarily under the Broadband and Cellular Infrastructure Program and the ICIP;
- $52 million increase due to temporary doubling of the Guaranteed Annual Income System payment for all recipients in 2023;
- $39 million increase primarily due to increased visitation to Ontario Parks and increased delivery of services by the Ontario Clean Water Agency; and
- This also reflects contingent liabilities related to the Protecting a Sustainable Public Sector for Future Generations Act, 2019 as a result of the November, 29, 2022, Ontario Superior Court decision.
- The increase in 2022–23 is partially offset by:
- $1.5 billion decrease due to lower Employee and Pensioner Benefits primarily due to prior-year accounting adjustments for actuarial valuations and updates to liabilities for the Workplace Safety and Insurance Board (WSIB) and Retired Employees’ Benefits expenses;
- $454 million decrease primarily due to less funding required to maintain the government’s support under the suite of electricity price mitigation programs;
- $244 million decrease in COVID‑19 related Ontario Small Business Support / Relief Grant programming;
- $164 million decrease primarily due to a less active than average fire season in 2022–23, and a reduced contaminated sites liability after reassessments; and
- $159 million decrease primarily due to lower uptake of the Ontario COVID‑19 Worker Income Protection Benefit program which reimbursed employers for COVID‑19 paid leave days and winding down the time-limited Ontario Jobs Training Tax Credit at the end of 2022 which supported hiring, training, retraining and upskilling workers.
See Chart 3 for details of program expenses by sector.
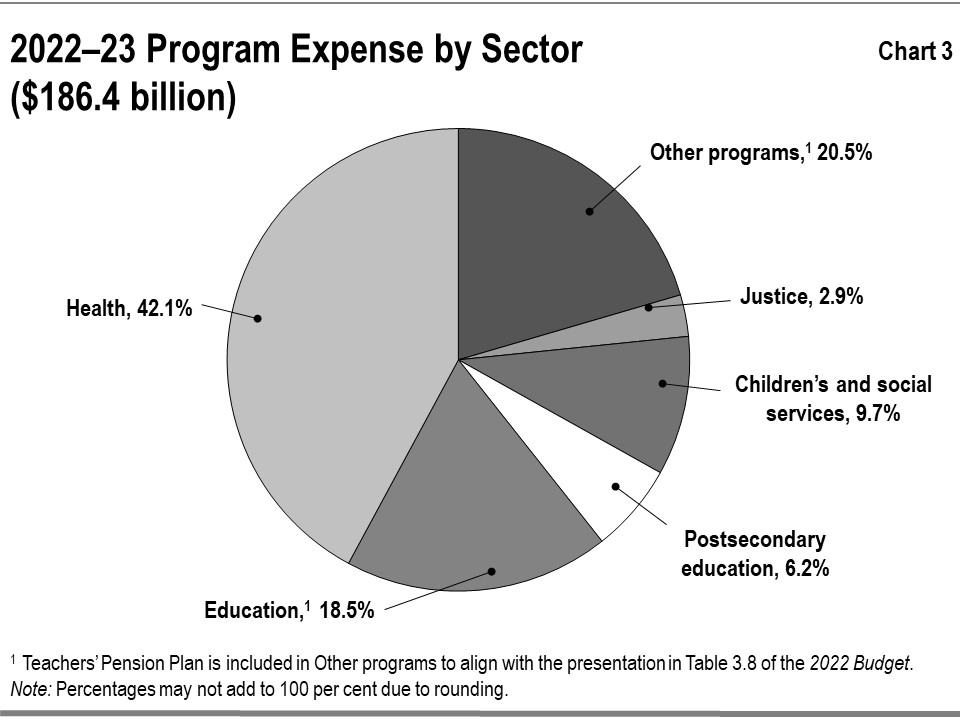
Chart 4 shows spending by type of expense. Government spending related to salaries and benefits includes those expenses for organizations consolidated as part of the government reporting entity, including hospitals, school boards, colleges and Children’s Aid Societies, as well as the Ontario Public Service.
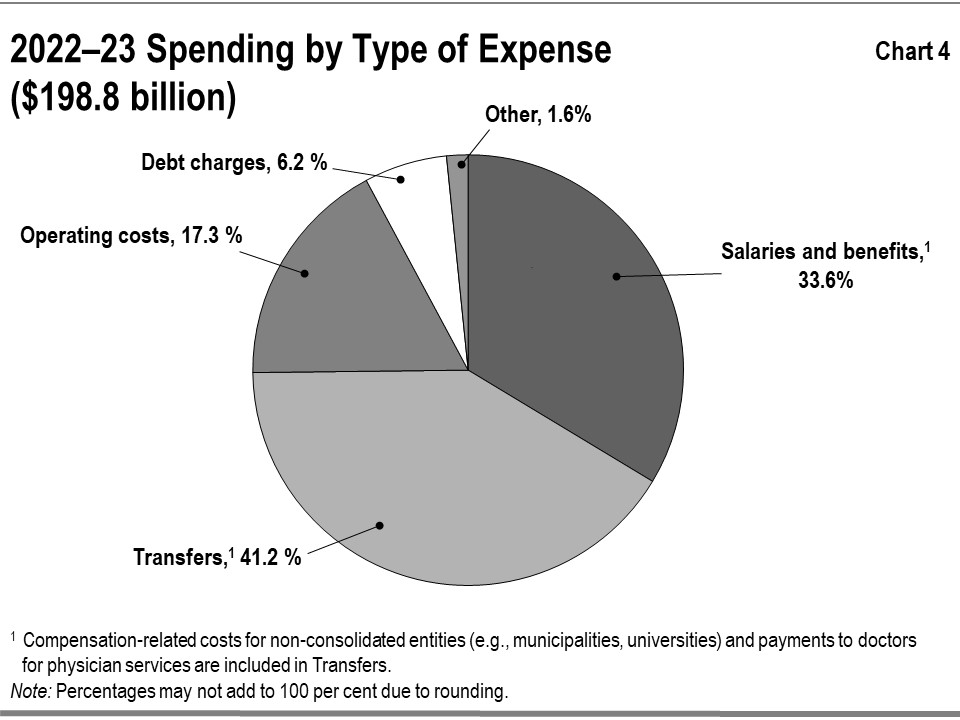
The expense labelled “Transfers” in Chart 4 reflects payments to a variety of service providers that support the delivery of public services. These third-party funding recipients consist of health care professionals including physicians, social service agencies, universities, childcare providers and municipalities. As service providers, a large share of the spending of these third parties typically goes to salaries and benefits, i.e., compensation-related costs. Transfers do not include transfers to hospitals, school boards, colleges, and Children’s Aid Societies — these are reflected in the other expense types such as operating costs and salaries and benefits, as reported by the organizations.
Change from the 2022 Budget
Total program spending for 2022–23 was $186.4 billion, which is $1.3 billion or 0.7% higher than the 2022 Budget. Changes in program spending were primarily attributed to the following factors:
- Health sector expense was $1.4 billion or 1.8% below plan, mainly due to lower COVID‑19 spending on vaccine administration and testing as a result of lower public demand. There was also lower spending for Ontario Drug Benefit programs as more generic alternative drugs became available and deferred capital spending in 2022–23 for hospital and long-term care projects due to changes in construction schedules. The variance also reflects increased spending for OHIP due to increased utilization of health care services and costs, including more visits to physicians, as well as an increase in contingent liabilities related to the Protecting a Sustainable Public Sector for Future Generations Act, 2019 as a result of the November, 29, 2022, Ontario Superior Court decision.
- Education sector expense was $1.5 billion or 4.5% above plan, primarily due to one-time Catch Up Payments in 2022–23 that provided direct funding to parents to help fill student learning gaps that emerged during the COVID‑19 pandemic and contingent liabilities related to the Protecting a Sustainable Public Sector for Future Generations Act, 2019 as a result of the November, 29, 2022, Ontario Superior Court decision.
- Postsecondary education sector expense was $0.8 billion or 7.4% above plan, mainly due to higher-than-forecasted college spending from the complete re-opening of campuses after easing of public health restrictions and increased overall student enrolment. This also reflects lower-than-expected costs for provincial student financial assistance as a result of continued federal supports and lower-than-projected uptake of students receiving financial assistance.
- Children’s and social services sector expense was $0.2 billion or 1.1% below plan, primarily due to stronger labour market conditions that contributed to lower than expected demand for social assistance programs such as Ontario Works and the Ontario Disability Support Program.
- Justice sector expense was $0.1 billion or 1% above plan, primarily due to funding for the COVID‑19 Vaccine Distribution Secretariat, payments made under the Crown Liability and Proceedings Act, 2019, and resources to support safe operations of correctional facilities. This also reflects decreases due to revised implementation timelines for the Public Safety Radio Network and decreased provincial funding requirements for Legal Aid Ontario due to increased funding from the Law Foundation of Ontario.
- Other program expense was $0.6 billion or 1.6% above plan, mainly due to the following factors:
- $6.25 billion increase associated with liabilities and the recognition of contingent liabilities for Treaty rights and Aboriginal rights;
- $281 million increase due to strategic investments in industrial support and land development, including Ontario’s auto manufacturing sector;
- $235 million increase due to addressing a portion of the City of Toronto’s 2022 operating deficit;
- $67 million increase primarily due to the Contaminated Sites Liability adjustment based on environmental site assessments and rehabilitation projects;
- $58 million increase due to higher uptake from the agricultural sector for demand-driven Business Risk Management programming, driven by various factors such as commodity prices and weather conditions;
- $49 million increase due to temporary doubling of the Guaranteed Annual Income System payment for all recipients in 2023; and
- This also reflects increases due to contingent liabilities related to the Protecting a Sustainable Public Sector for Future Generations Act, 2019 as a result of the November, 29, 2022, Ontario Superior Court decision.
- The increase was partially offset by:
- $4.6 billion decrease in the contingency funds that were used during the fiscal year to fund program expenses in various sectors to respond to emerging needs for health care, workers, infrastructure and businesses, and unforeseen events;
- $943 million decrease in infrastructure programs primarily due to revised agreements and realignment to construction timelines for Broadband and Cellular Infrastructure Program and the ICIP;
- $503 million decrease primarily due to less than forecasted cost to sustain the suite of electricity rate mitigation programs;
- $492 million decrease primarily due to underspending in the ICIP — Public Transit stream — driven by changes in project funding profiles and timing for municipal transit projects;
- $412 million decrease in Employee and Pensioner Benefits primarily due to accounting adjustments for actuarial valuations and updates to liabilities; and
- $100 million decrease due to the Invest Ontario allocation being moved to future years
Expense trend
Chart 5 shows the recent trends in spending for major program areas.
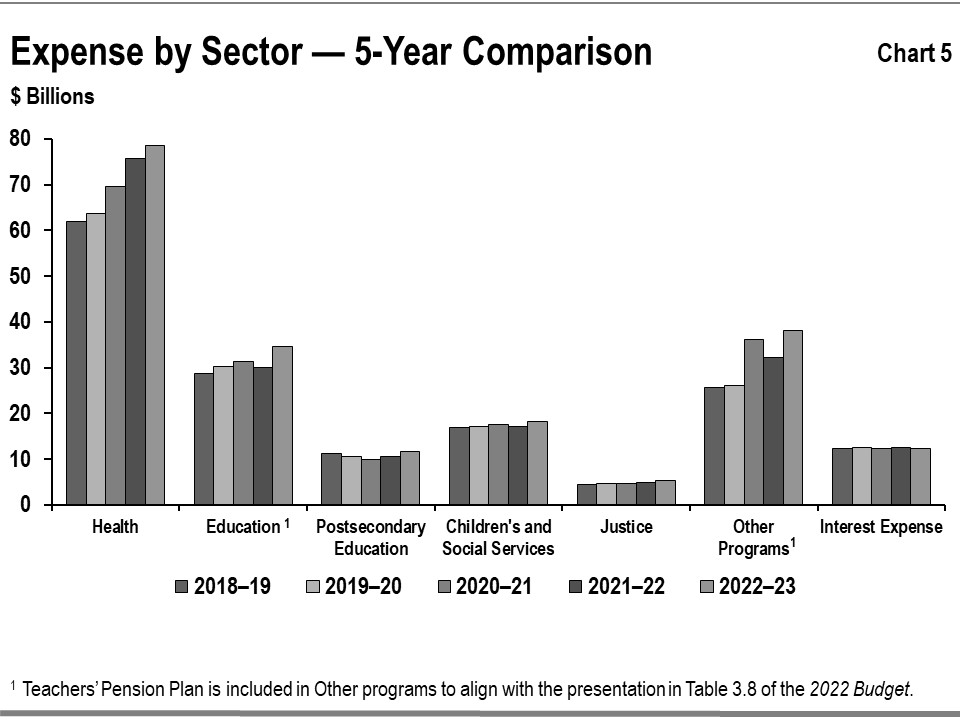
- Health sector expense increased from $61.9 billion in 2018–19 to $78.5 billion in 2022–23, or on average by 6.1% per year. The increase includes:
- Support for Ontario hospitals to expand capacity, increase access to high-quality care and support surgical recovery;
- Additional funding for home and community care services to get more people connected to care in the comfort of their own home and community;
- Investments to meet demand for health care services arising from population growth and increased utilization of drug programs and cancer care treatments;
- Support for health human resources initiatives to stabilize the existing workforce and recruit and retain health care providers;
- Additional funding to improve access to mental health and addiction services;
- Investments to provide a permanent wage enhancement to personal support workers who deliver publicly-funded support services in home and community care, long‐term care and public hospitals;
- Investments to build new long-term care beds, increase the daily direct care for long-term care residents and improve quality of care; and
- Time-limited investments to respond and manage the COVID‑19 pandemic including funding to support hospitals, testing and vaccines as well as to prevent and contain the spread of COVID‑19 in long-term care homes.
- Education sector expense increased from $28.7 billion in 2018–19 to $34.5 billion in 2022–23, or on average by 4.7% per year. The increase is mainly due to:
- Implementing the Canada-wide Early Learning and Child Care system;
- Modernizing the school curriculum and additional funding for reading and math programs; and
- Providing funding to support enrolment growth and commitments consistent with labour agreements reached.
- Postsecondary education sector expense increased from $11.2 billion in 2018–19 to $11.6 billion in 2022–23, or on average by 0.9% per year. This increase is mainly due to higher college spending as a result of increased overall student enrolment. This also reflects the wind-down of time-limited federal infrastructure investments and changes in uptake of student financial assistance programs. .
- Children’s and social services sector expenses increased from $16.8 billion in 2018–19 to $18.1 billion in 2022–23, or on average by 1.9% per year. This increase primarily reflects:
- Higher social assistance funding to address demand and to increase the monthly core allowances for the Ontario Disability Support Program and the maximum monthly amount for the Assistance for Children with Severe Disabilities program by 5% as of September 2022;
- Increased investment to support client needs in the Ontario Autism Program and Developmental Services programs; and
- COVID‑19 supports such as enhanced cleaning and personal protective equipment.
- Justice sector expense increased from $4.4 billion in 2018–19 to $5.4 billion in 2022–23, or on average by 5.4% per year. The increase is primarily due to:
- Investments in programs such as Next Generation 9-1-1, the Guns, Gangs and Violence Reduction Strategy, the Criminal Case Backlog Reduction Strategy, and Ontario’s Anti-Human Trafficking Strategy; and
- Funding for the COVID‑19 Vaccine Distribution Secretariat and to support the safe operation of courts and correctional facilities during the COVID‑19 pandemic.
- Other program expenses increased from $25.7 billion in 2018–19 to $38.2 billion in 2022–23, or on average by 10.4% per year. The increase is primarily due to:
- Increased investments under the suite of electricity price mitigation programs, which help to keep energy bills low and affordable for Ontarians;
- Growth in amortization expense related to new transportation assets entering into service, increased investments in transit services and highway operations, and time-limited assistance to help municipalities as they recover from the COVID‑19 pandemic;
- Funding to support the Francophone community and businesses through the Francophone Community Grants program and the time-limited COVID‑19 Relief Fund for Francophone non-profit organizations;
- Infrastructure program investments such as the Ontario Community Infrastructure Fund, Broadband Cellular Infrastructure Program and ICIP;
- Funding to support the hiring, training, retraining, and upskilling of workers through the Skills Development Fund and the time-limited Ontario Jobs Training Tax Credit, as well as funding to provide paid sick days through the Ontario COVID‑19 Worker Income Protection Benefit program;
- Additional investments in housing and homelessness programs, and investments to streamline development approvals and help municipalities achieve efficiencies; and
- Recognition of settlements, liabilities and contingent liabilities related to Treaty rights, Aboriginal rights and land-related claims.
Interest on debt
Interest on debt expense decreased from $12.6 billion in 2021–22 to $12.4 billion in 2022–23 as a result of higher interest capitalization from consolidated entities, as well as an increase in interest income from rising interest rates from the broader public sector, which offset the increase in interest on debt from long-term borrowing.
Interest on debt expense was $1.2 billion below plan from the 2022 Budget in 2022–23, mainly as a result of a reduction in the borrowing program of approximately $9.3 billion and a lower-than-budgeted deficit for 2022–23, as well as higher-than-budgeted interest capitalization and interest income from rising interest rates.
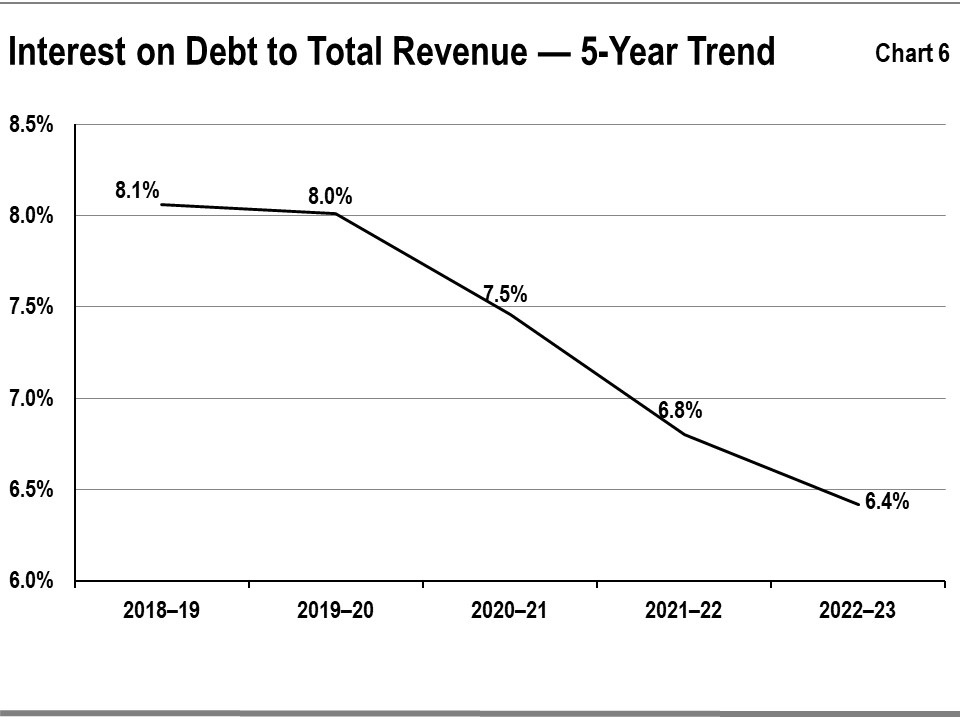
Chart 6 shows that the ratio of interest on debt to total revenue has fallen for Ontario over the period between 2018–19 to 2022–23, from a high of 8.1% in 2018–19 to the current level of 6.4%. The decrease from 6.8% in 2021–22 to 6.4% in 2022–23 is due to the rate of increase in Ontario’s total revenues outpacing the rate of change in the interest on debt expense.
COVID‑19 analysis
| Expense | 2022–23 actual $ |
2021–22 actual $ |
Change from 2021–22 actual $ |
|---|---|---|---|
| Health sector | 3.3 | 6.2 | (2.8) |
| Education sector | 0.9 | 1.1 | (0.1) |
| Postsecondary education sector | 0.0 | 0.1 | (0.1) |
| Children’s and social services sector | 0.0 | 0.3 | (0.2) |
| Justice sector | 0.1 | 0.3 | (0.2) |
| Other programs | 1.8 | 2.9 | (1.1) |
| Total expense | 6.3 | 10.9 | (4.6) |
Note: Numbers may not add due to rounding.
Total COVID‑19 spending in 2022–23 decreased by $4.6 billion from $10.9 billion in the previous fiscal year to $6.3 billion.
- COVID‑19 spending in the health sector decreased by $2.8 billion over the previous fiscal year, mainly due to lower COVID‑19 hospital expenses, lower spending on time-limited COVID‑19 initiatives, such as prevention and containment funding, and lower spending on COVID‑19 vaccine administration and testing.
- COVID‑19 spending in the education sector decreased by $0.1 billion over the previous fiscal year, mainly due to the wind-down of prior year COVID‑19 initiatives including support for Emergency Child Care in 2021–22.
- COVID‑19 spending in the postsecondary education sector decreased by $0.1 billion over the previous fiscal year mainly due to lower spending by colleges on goods and services required to support operations for meeting public health requirements related to COVID‑19.
- COVID‑19 spending in the children’s and social services sector decreased by $0.2 billion over the previous fiscal year, mainly due to lower spending on time-limited COVID‑19 programs. In addition, the temporary wage enhancement was made permanent for eligible personal support workers and direct support workers in the social services sector and is reflected in base expense starting in 2022–23.
- COVID‑19 spending in the justice sector decreased by $0.2 billion over the previous fiscal year, mainly due to lower spending on time-limited COVID‑19 programs and services, including requirements to support safe operation of the courts and correctional facilities during the pandemic.
- COVID‑19 spending in other programs decreased by $1.1 billion over the previous fiscal year, mainly due to the following reasons:
- $484 million decrease mainly due to lower uptake of the Ontario COVID‑19 Worker Income Protection Benefit program that reimbursed employers for COVID‑19 paid leave days, winding down the time-limited Ontario Jobs Training Tax Credit at the end of 2022 which supported hiring, training, retraining and upskilling workers, as well as a shift of the Skills Development Fund to base funding to support post-pandemic economic recovery;
- $314 million decrease primarily due to the winding down of COVID‑19 funding in the Ontario Small Business Support Grant program;
- $272 million decrease due to the winding down of COVID‑19 time-limited supports such as the Ontario Business Costs Rebate program, Time of Use Off Peak Pricing COVID‑19 Response and COVID‑19 Business Supports; and
- $176 million decrease in time-limited COVID‑19 investments primarily for the Social Services Relief Fund and funding for Isolation Centres.
This also reflects:
- Increase of $240 million primarily to support municipalities with COVID‑19 related impacts on transit systems; and
- The one-time investment of $235 million for the City of Toronto for a portion of its 2022 operating deficit.
Note: These totals are inclusive of federal support. Some federal funding received also supported increased spending for base programs, including in the health sector, to meet increased demand. See section below for more information.
Federal-provincial COVID‑19 response programs
In 2022–23, Ontario continued to work in partnership with the federal government to secure federal investments to support the people of Ontario. In total, Ontario received $1.7 billion in COVID‑19 time-limited operating and in-kind support in 2022–23 from the federal government down from $3.7 billion in 2021–22. The 2022–23 amount includes:
- A one-time payment of $776 million in funding through the federal Budget Implementation Act, 2022, and amendments to the Federal-Provincial Fiscal Arrangements Act to support COVID‑19 recovery.
- $316 million in funding through the federal Budget Implementation Act, 2022 to support critical municipal services like transit and municipal shelters; and
- Various supports for the education and health sectors, recognition of the value of personal protective equipment (PPE), and COVID‑19 rapid antigen tests received in-kind from the federal government.
No new federal COVID‑19 funding was committed beyond 2022–23.
Statement of financial position analysis
| Item | 2022–23 actual $ |
% of total |
2021–22 restated actual $ |
% of total |
Variance increase (decrease) $ |
|---|---|---|---|---|---|
| Cash and cash equivalents | 39.9 | 29.8 | 34.2 | 26.2 | 5.7 |
| Investments | 34.0 | 25.4 | 27.1 | 20.8 | 6.9 |
| Derivative assets | 4.6 | 3.4 | - | 0.0 | 4.6 |
| Accounts receivable | 12.3 | 9.2 | 27.0 | 20.7 | (14.7) |
| Loans receivable | 11.9 | 8.9 | 11.8 | 9.0 | 0.1 |
| Other assets | 1.3 | 1.0 | 1.4 | 1.1 | (0.1) |
| Investment in Government Business Enterprises | 30.0 | 22.4 | 28.8 | 22.1 | 1.2 |
| Total financial assets | 133.9 | 100.0 | 130.4 | 100.0 | 3.5 |
Note: Numbers may not add due to rounding.
Financial assets consist of items that include cash and cash equivalents and investments that are available to the government to meet its expenditure needs; accounts and loans receivable, which are amounts it expects to receive from third parties; and other items including investment in GBEs.
Total financial assets increased by $3.5 billion in 2022–23 over the prior fiscal year. The increase was attributable to (see Table 5):
- Cash and cash equivalents were $5.7 billion higher mainly due to operating, investing, capital and financing activities that included pre-borrowing of $14.5 billion as well as building up adequate liquid reserves to fund large impending single-day maturities due in the next fiscal year;
- Investments were $6.9 billion higher, mainly as a result of pre-borrowing activities and maturity payment management as well as an increase in investments by government organizations and BPS. Examples of investments include investments in Government of Canada Bonds and fixed-income securities, such as Guaranteed Investment Certificates;
- In 2022–23, the Province recognized $4.6 billion of derivative assets on existing derivative contracts due to implementation of new Public Sector Accounting Standards on Financial Instruments (Section 3450) and Foreign Currency Translation (Section 2601); and
- Investment in GBEs was $1.2 billion higher, mainly due to higher OPG net assets, as well as HOL and OCRC.
The increase in 2022–23 is partially offset by:
- Decrease in accounts receivable of $14.7 billion, mainly due to a decrease in receivables relating to payments from the Government of Canada for programs and projects, and a decrease in tax receivables, transfer payments and other receivables.
Chart 7 shows the recent trends in financial assets for the government.
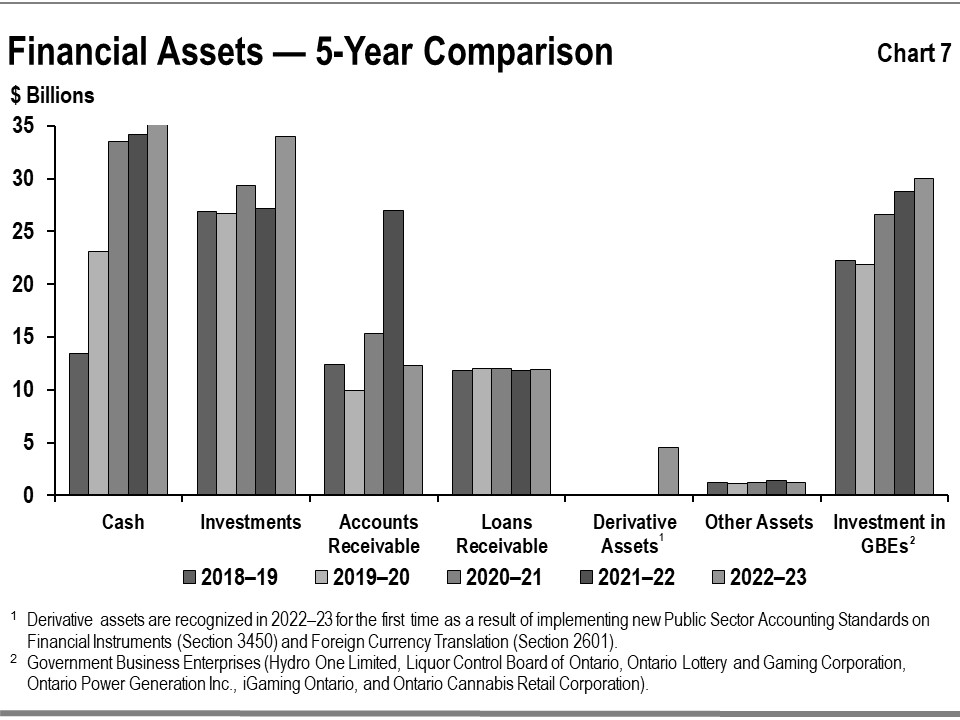
The level of financial assets, including cash, accounts receivable and investments tends to be more variable since these assets year-over-year often reflect specific circumstances at the fiscal year-end such as pre‑borrowing for the following period’s needs.
After a large increase in total net investments in GBEs in 2020–21, total investment in GBEs showed smaller increases in 2021–22 and 2022–23. The net increases were mainly due to the increases in net assets in GBEs, including investment earnings from the Ontario Nuclear Funds for nuclear waste management fund and decommissioning.
Tangible capital assets
The government is responsible for a large portfolio of non-financial assets, which is almost entirely made up of tangible capital assets.
Tangible capital assets owned by the government and its consolidated entities represent the largest component of Ontario’s infrastructure investments. These assets include those it owns directly, such as provincial highways, as well as the assets of hospitals, school boards, colleges, Children’s Aid Societies, and agencies that are consolidated in its financial statements. The assets of GBEs are reflected in Ontario’s statement of financial position as an investment in GBEs under financial assets.
The reported net book value of Ontario’s tangible capital assets was $150.4 billion in 2022–23, increasing by $8.8 billion, or 6.2% over the prior fiscal year. Buildings, including hospitals, schools and college facilities, make up the single largest share at $69.3 billion in aggregate. The total on the balance sheet also includes assets under construction, some of which are being built using the public private partnership (P3) model, in which the private sector finances the assets during construction. The impacts of P3s on balance sheet liabilities are discussed in the Other Long-Term Financing section.
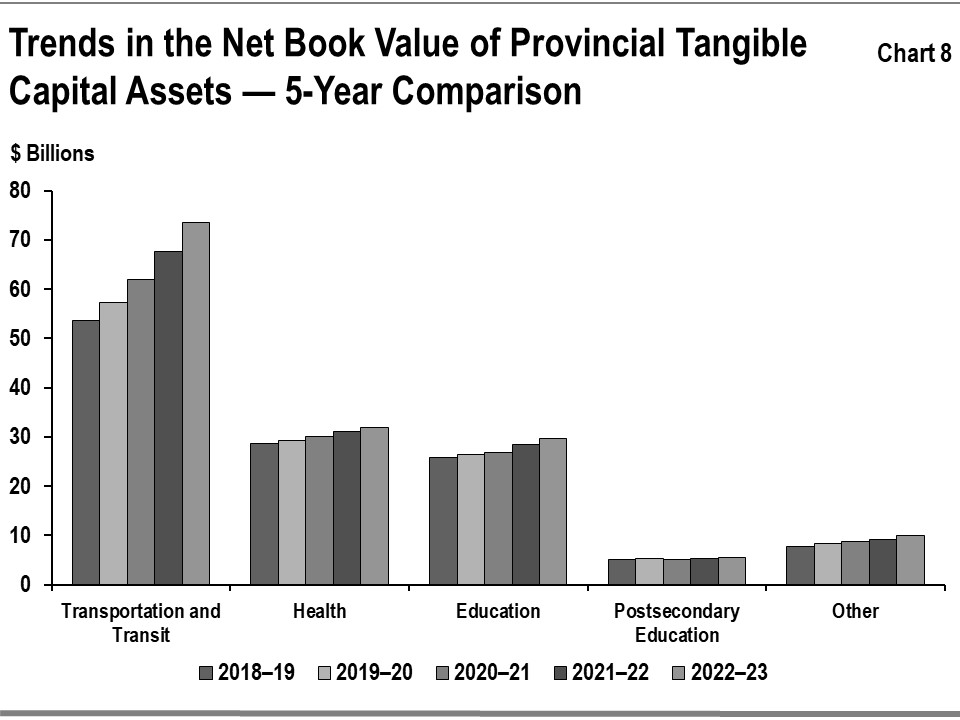
Growth in the net book value of capital assets has averaged 5.6% annually over the period between 2018–19 and 2022–23. Most of the growth has been in new and rehabilitated buildings and transportation infrastructure including provincial highways and bridges, and the transit network owned by Metrolinx, an agency of the government.
See Chart 8 for the recent trends in the net book value of provincial tangible capital assets by sector.
Infrastructure expenditures
Ontario’s infrastructure spending in 2022–23 was $19.2 billion (see Table 6). This includes $16.3 billion invested in assets owned by the government and its consolidated entities as discussed in the Tangible Capital Assets section, and $2.9 billion provided for capital investment to non‑consolidated partners such as universities and municipalities as well as other infrastructure expenditures.
Total infrastructure spending in 2022–23 was $1.5 billion higher than the previous year, with increased expenditures across all sectors, excluding the health sector. Increased investments include public transit, schools, correctional and court facilities, broadband and repairs on existing provincial assets, partially offset by decreased spending in the health sector.
The total was lower than the $22.6 billion set out in the 2022 Budget, primarily driven by decreases due to deferred capital spending as a result of revised construction schedules in the transportation, health, education and other sectors. These decreases are partially offset by an increase in the postsecondary education sector due to higher-than-forecasted college capital investments.
| Sector | Investment in capital assets $ |
Transfers and other infrastructure expenditures $ |
Total infrastructure expenditures $ |
2022 Budget total infrastructure expenditures $ |
|---|---|---|---|---|
| Transportation and transit | 8.5 | 0.9 | 9.5 | 11.4 |
| Health | 2.8 | 0.3 | 3.1 | 3.2 |
| Education | 2.9 | 0.0 | 2.9 | 2.9 |
| Postsecondary education | 0.6 | 0.2 | 0.8 | 0.6 |
| Other sectors |
1.4 | 1.6 | 3.0 | 4.4 |
| Totals |
16.3 | 2.9 | 19.2 | 22.6 |
Note: Numbers may not add due to rounding.
Liabilities
Ontario’s liabilities consist of debt and other financial obligations, including accounts payable and the estimated cost of future payments, including pensions and other employee future benefits liability. See Table 7.
| Item | 2022–23 actual $ |
% of total |
2021–22 restated actual $ |
% of total |
Variance increase (decrease) $ |
|---|---|---|---|---|---|
| Accounts payable and accrued liabilities | 46.3 | 8.7 | 30.0 | 5.8 | 16.3 |
| Debt | 421.8 | 78.9 | 425.9 | 83.0 | (4.1) |
| Other long-term financing | 17.6 | 3.3 | 18.0 | 3.5 | (0.4) |
| Deferred revenue and capital contributions | 17.9 | 3.4 | 16.5 | 3.2 | 1.4 |
| Pensions and other employee future benefits liability | 14.1 | 2.6 | 14.4 | 2.8 | (0.3) |
| Derivative liabilities |
7.7 | 1.4 | - | 0.0 | 7.7 |
| Other liabilities | 8.9 | 1.7 | 8.5 | 1.7 | 0.4 |
| Total liabilities | 534.3 | 100.0 | 513.3 | 100.0 | 21.0 |
Note: Numbers may not add due to rounding.
Debt
Debt makes up the largest share of liabilities. From 2021–22 to 2022–23, debt decreased by $4.1 billion to $421.8 billion at fiscal year-end, primarily due to an increase in the Province's holdings of its own bonds and treasury bills offset by investments in infrastructure as well as operating cash requirements and a presentation change due to new accounting standards.
Table 8 summarizes the government’s financing in 2022–23.
| Item | Amount $ |
|---|---|
| Operating deficit and other transactions |
(32.7) |
| Investment in capital assets owned by the government and its consolidated organizations, including hospitals, school boards, colleges and Children’s Aid Societies |
15.3 |
| Increase in the government’s cash and investments funded by cash holdings |
12.6 |
| Subtotal | (4.8) |
| Decrease in other long-term financing, Tangible Capital Assets financed by Public Private Partnership (P3) |
0.8 |
| Settlement of financing | (4.0) |
Note: Numbers may not add due to rounding.
The government completed an annual borrowing program of $32.2 billion in 2022–23, compared to the $41.1 billion borrowed in 2021–22.
Other long-term financing
This category includes obligations to finance construction of public assets including those procured through the P3 model and total debt of BPS. All assets that are owned by the Ontario government and its consolidated entities, and the associated financing liabilities, are reflected on Ontario’s balance sheet during construction and as the liabilities are incurred. For information on asset investments, see the Tangible Capital Assets section.
Other types of liabilities
Other types of liabilities include accounts payable, pensions and other employee future benefits, unspent transfers received from the federal government representing deferred revenues, derivative liabilities, and other liabilities.
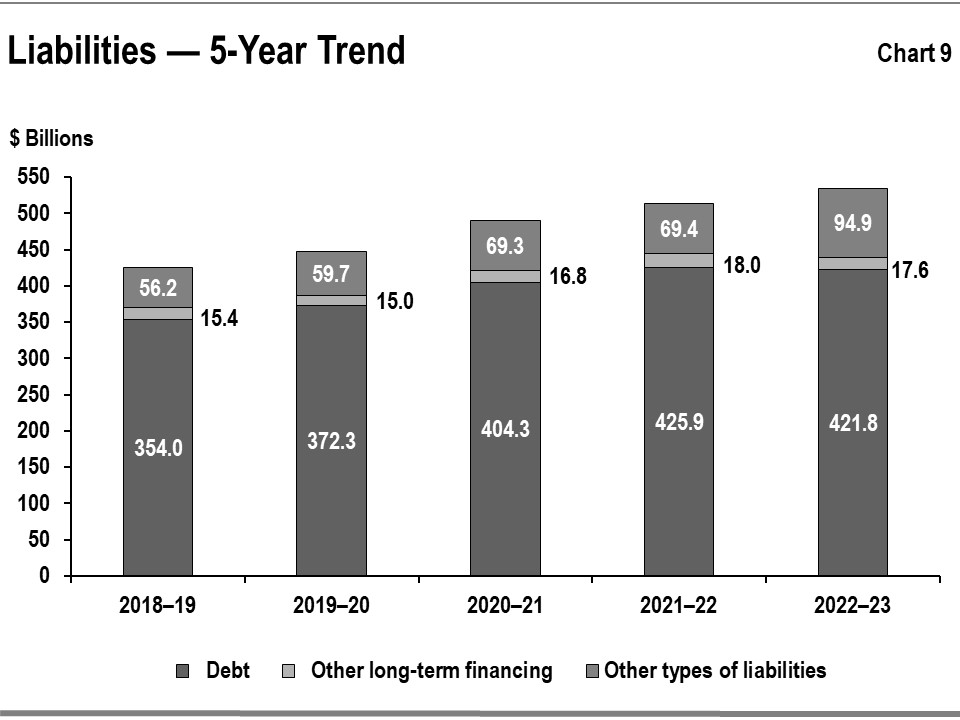
Chart 9 shows the recent trends in liabilities for Ontario. This trend over the period between 2018–19 and 2022–23 shows public debt rising, mainly to fund capital investments and the annual deficits. Other types of liabilities, including accounts payable and deferred revenue, tend to be more variable since they often reflect specific circumstances at the fiscal year-end such as accrued liabilities for goods and services.
Risks and risk management
Ontario’s financial results and financial reporting are subject to various risks and uncertainties over which the Provincial government may have limited or no control.
A majority of Ontario’s taxation revenue is administered and collected by the federal government through various tax collection agreements. Actual tax assessments from the Canada Revenue Agency for the current tax year and prior years are provided to the Ontario Ministry of Finance well after the tax year has ended. In the absence of actual tax data from the Federal government, the Ministry of Finance uses economic driven models to produce the forecasts for federally-administered taxes. Ontario manages risks to the revenue forecast by consulting with private-sector economists to inform the government’s planning assumptions. For prudent fiscal planning, the Ontario Ministry of Finance’s GDP growth projections are typically set slightly below the average private-sector forecast. Ontario’s revenues rely heavily on the level and pace of economic activity in the province.
The ongoing monitoring of revenues allows the government to assess potential risks to its finances. Collaboration with the Canada Revenue Agency, which administers approximately 78% of Ontario’s taxation revenues, is essential to achieving this. As well, Ontario continues to explore ways to enhance its tax revenue forecasting and monitoring.
There are also risks arising from other sources of revenue, such as federal transfers and income from GBEs. Since these represent a smaller share of total revenue compared to larger revenue sources such as tax revenue — the risks they present are relatively less material to the fiscal plan. In addition, these risks are difficult to predict and quantify; for example, federal transfers are subject to federal policy changes while GBE net incomes are subject to regulatory decisions and market conditions. Note 1 to the Consolidated Financial Statements provides additional details on measurement of uncertainty.
Additionally, with the current pace of change and the interdependent nature of the external and emerging risk environment, Ontario, along with governments worldwide, needs to consider potential threats and opportunities as it sets priorities and works toward meeting the needs of the people of Ontario. Areas like cybersecurity, infrastructure, sustainability, supply chain challenges and the changing workforce create a dynamic environment that introduces risks to government and requires targeted responses and mitigation to support the government’s ability to achieve its priorities.
To address these challenges, critical investments and additional expenditures enabled the provision of services and the delivery of programs that the people of Ontario depend on. This included the development of responsive policies and enhancements to existing programs across areas such as the health, education, and justice sectors, as well as a continued focus on modernizing government services to support economic development, enable digital transformation, and address key infrastructure needs.
Other risk management tools the government utilized include contingency funds to address risks that materialized. In the 2022 Budget, the government committed a total of $4.6 billion ($4.3 billion for operating and $0.2 billion for capital) for the standard contingency fund. Funds from the standard contingency fund were used to support initiatives such as:
- Liabilities and the recognition of contingent liabilities for Treaty rights and Aboriginal rights;
- Investments to help long-term care homes prevent and contain the spread of COVID‑19, including increased staffing supports;
- Additional funding to Emergency Management Ontario to manage emergency declarations for municipalities and First Nations; and
- The Ontario COVID‑19 Worker Income Protection Benefit to reimburse eligible employers for infectious disease emergency leave paid to employees;
As part of the Ontario government’s effort to combat COVID‑19 and support the recovery of the province, the government also made available time-limited funding and extraordinary contingencies through the Time-Limited COVID‑19 Fund. As of the 2022 Budget, the Time-Limited COVID‑19 Fund ($2.8 billion) has been fully allocated for the 2022–23 fiscal year.
Funds from the Time-Limited COVID‑19 Fund were used for investments such as:
- Supporting municipal transit systems as they recover from the COVID‑19 pandemic;
- Investments to help long-term care homes prevent and contain the spread of COVID‑19;
- Additional funding for the COVID‑19 vaccination program;
- Funding to support the public health sector as well as investments to enhance COVID‑19 monitoring and case and contact management and the continuation of Infection Prevention and Control Hubs; and
- Help for students to recover from the disruptions of COVID‑19 through supports for learning.
As required under the Fiscal Sustainability, Transparency and Accountability Act, 2019, a reserve is included in the projected surplus/deficit each year to guard against unforeseen revenue and expense changes that could have a negative impact on the government’s fiscal performance. The 2022 Budget included a $1.0 billion reserve for 2022–23. Excluding this reserve, the projected deficit for 2022–23 in the 2022 Budget was $18.9 billion.
Provisions for losses that are likely to occur as a result of contingent liabilities, such as ongoing litigation and land claims, and that can be reasonably estimated are expensed and reported as liabilities. Note 1 to the Consolidated Financial Statements provides further details.
Note 3 to the Consolidated Financial Statements explains the government’s risk management strategies which are intended to ensure that exposure to borrowing-related risk is managed in a prudent and cost-effective manner.
Changes in Canadian generally accepted accounting principles (GAAP) for the public sector issued by the Public Sector Accounting Board (PSAB) can have an impact on Ontario’s budgets, estimates and actual results. While changes in Canadian GAAP had no material impacts in the current fiscal year, the Office of the Comptroller General, Treasury Board Secretariat actively monitors proposed changes and provides input to standard setters to support the development of standards that support sound public policy decision-making, transparency and accountability in reporting.
Key financial ratios
In this section of the Annual Report, the use of key measures of financial position will be used to assess Ontario’s financial position. The levels and trends of these measures indicate the impacts of economic and other events on the Ontario government’s finances. The ratio and level of each over the past five fiscal years are outlined in Table 9.
| Item | 2018–19 | 2019–20 | 2020–21 | 2021–22 | 2022–23 |
|---|---|---|---|---|---|
| Sustainability — Net debt-to-GDP (%) | 39.4 | 39.6 | 43.1 | 40.0 | 38.3 |
| Sustainability — Net debt to total revenue (%) | 220.2 | 226.4 | 226.5 | 206.8 | 207.6 |
| Sustainability — Net debt per capita ($) | 23,657 | 24,293 | 25,368 | 25,852 | 26,506 |
| Flexibility — Interest on debt to total revenue (%) | 8.1 | 8.0 | 7.5 | 6.8 | 6.4 |
| Flexibility — Own-Source revenue to GDP (%) | 15.0 | 14.6 | 15.1 | 16.2 | 15.5 |
| Vulnerability — Federal transfers to total revenue (%) | 16.3 | 16.3 | 20.6 | 16.5 | 16.2 |
| Vulnerability — Foreign currency debt to total debt (%) | 17.1 | 16.1 | 15.8 | 16.1 | 14.0 |
| Vulnerability — Unhedged foreign currency debt (%) | 0.2 | 0.2 | 0.1 | 0.1 | 0.1 |
Notes:
- Beginning in 2019–20, Ontario is presenting public debt less of any investments in its own bonds and treasury bills.
- The forecasts of net debt and related ratios in the annual Budget are based on a calculation that includes the reserve.
Sources: Nominal GDP is based on Ontario Economic Accounts, First Quarter 2022, released by the Ontario Ministry of Finance. Population estimates are from Statistics Canada.
Measures of sustainability
Net debt provides a measure of the future government revenues that will be required to pay for the government’s past transactions. Net debt as a percentage of Ontario’s GDP shows the financial demands on the economy resulting from the government’s spending and taxation policies. A lower ratio of net debt-to-GDP generally indicates higher sustainability.
The government’s net debt-to-GDP ratio was 38.3% at the end of fiscal year 2022–23, lower than the 41.4% forecast in the 2022 Budget. As shown in Table 9, this ratio has decreased by 1.7 percentage points over the prior year, largely due to the rate of increase in Ontario’s GDP outpacing the rate of increase in the net debt. The ratio of net debt to total revenue is another key measure of sustainability, since net debt reflects the future revenue that is required to pay for past transactions and events. A lower net debt-to-revenue ratio generally indicates higher sustainability. This ratio was 207.6% at the end of fiscal year 2022–23, lower than the 238.4% forecast in the 2022 Budget. The ratio increased by 0.8 percentage points from the prior year primarily due to revenues rising slower than net debt.
Measures of flexibility
The ratio of Interest on Debt to Total Revenue shows the share of provincial revenue that is being used to pay interest expense on debt and therefore is not available for programs. A lower ratio generally indicates that a government has more flexibility to direct its revenues to programs. The ratio has fallen for Ontario over the past five years, from a high of 8.1% in 2018–19 to the current level of 6.4%. Despite upward movements in interest rates from the previous year, the government’s strategy of extending duration terms of its borrowing program and locking in interest rates that continued to be historically low, for a longer period, has also contributed to lower interest costs. This strategy has extended the weighted-average term to maturity of provincially issued debt from approximately 8 years in 2009–10 to approximately 15 years in 2022–23.
Own-source revenue as a share of Ontario’s GDP shows the extent to which the government is leveraging funds from the provincial economy collected through taxation, user fees and other revenue sources it controls. A high taxation burden may make a jurisdiction less competitive, therefore increases in this ratio may reduce future revenue flexibility. During 2020–21 and 2021–22, financial support from all levels of government was provided to people and businesses in response to COVID‑19, which contributed to growth in Personal and Corporate Income Tax revenues. As this support did not directly increase GDP, it led to an increase in the ratio.
Measures of vulnerability
Transfers from the federal government as a percentage of total revenue is an indicator of the degree to which Ontario relies on the federal government for revenue. A higher ratio may imply that a provincial government is more reliant on federal transfers. Provinces may have limited control over the value of these transfers, and changes in federal policies can result in shifts in federal revenues to provinces.
Ontario’s share of revenue from federal transfers (including direct transfers to the BPS) is 16.2% in 2022–23, close to the same level as 2018–19.
Foreign currency debt to total debt is a measure of vulnerability to changes in foreign currency exchange rates. Accessing borrowing opportunities in foreign currencies allows Ontario to diversify its investor and funding base. It also ensures that the government will continue to have adequate access to capital in the event that domestic market conditions become more challenging. Ontario manages foreign currency risk by hedging its exposure to foreign currencies through the use of financial instruments. Effective hedging has allowed the government to consistently limit its exposure to foreign currency fluctuations to 0.2% of debt issued for provincial purposes in 2018–19, declining to 0.1% in 2020–21 and remaining unchanged in 2022–23.
Fiscal management
Use of taxpayer dollars
To support long-term economic growth and sustainable public finances, the government remains committed to ensuring taxpayer dollars are managed appropriately. In this regard, the government continuously reviews programs for opportunities to modernize, improve outcomes, and become fiscally sustainable and efficient. This process has resulted in new and improved programs through service modernization, increased efficiencies and oversight, revised policies and reduced red tape.
The Audit and Accountability Committee (AAC) plays an important role in supporting the government’s efforts to ensure the effectiveness and efficiency of operations, and sound stewardship of public funds through effective risk management, governance and internal control practices. The AAC supports enhanced governance by providing input and direction to ensure internal audit services continue to align with emerging risks and government priorities, based on independent strategic advice provided by the Ontario Internal Audit Committee (OIAC), an advisory audit committee of the AAC.
Non-financial activities
This section discusses key non-financial results of major sectors. The purpose is to provide highlights of Ontario government spending and the related activities in these sectors.
Health sector
The government acts as a steward of the health sector, providing overall direction and leadership for the system. Throughout 2022–23, the primary focus has been to build a stronger, stable and modernized health system that provides more connected and convenient care for patients. The government also took decisive actions to manage COVID‑19, leading the successful vaccination rollout across the province. It continues to support modernization and innovation in the health sector to better meet the needs of people in Ontario.
Results reported in 2022–23 include:
- Launching Your Health: A Plan for Connected and Convenient Care in February 2023 to deliver connected and convenient care through three pillars; The Right Care in the Right Place, Faster Access to Care and Hiring More Health Care Workers.
- Introducing the second phase of the Plan to Stay Open in August 2022 to support providing the best care possible to patients and ensure the resources and supports were in place to keep the province and economy open.
- Introducing new legislation, Your Health Act, 2023, to enable pharmacists to prescribe medications for 13 common ailments to patients across Ontario.
- Launching Health811 (previously known as Health Connect Ontario), a new tool that lets the people of Ontario call or chat online with a registered nurse and find the health care services and information they need all in one, easy-to-use website.
- Expanding hospital capacity by supporting the continuation of over 3,500 acute, post-acute and critical care beds to increase access to high-quality care and support surgical recovery.
- Improving access to diagnostic imaging services while reducing wait times by supporting the addition of 27 new magnetic resonance imaging (MRI) machines in hospitals across Ontario.
- Investing $1.0 billion more over three years to stabilize and further expand home care. This will benefit the nearly 700,000 families who rely on home care annually, by helping them avoid unnecessary hospital visits and long-term care home admissions and shortening hospital stays.
- Providing a permanent wage enhancement to 158,000 publicly funded personal support workers and direct support workers to bolster Ontario’s health care workforce.
- Making it easier and quicker for foreign-credentialled health care workers to begin practising in Ontario and making additional investments to expand enrolment in nursing programs.
- Expanding the Learn and Stay program to include paramedic and medical laboratory technologists in priority communities.
- Adding three new Ontario Health Teams in Northern Ontario to provide connected and more convenient care, bringing the total number of Ontario Health Teams to 54.
- Continuing to support the province’s high vaccination rates through booster doses as well as ensuring the availability of antivirals to reduce the impact of COVID‑19.
- Expanding the “One Stop Talk” virtual counselling program to connect children, youth and their families with more convenient and timely ways to access mental health counselling no matter where they live.
Education sector
Ontario’s publicly funded early years and education system is focused on preparing Ontario’s children and students for success, ensuring that young people develop in-demand skills that can be applied to the labour market for good, high-paying jobs. The government is committed to ensuring Ontario continues to have a leading education system, both in English and French, that focuses on important, life-long skills like reading, writing and math.
Results reported in 2022–23 include:
- Improving childcare. As of April 1, 2022, there were 472,997 licensed child care spaces for children 0–12 years of age, a 1.8% increase over the previous year.
- Supporting students’ return to a normal classroom experience following pandemic disruptions by:
- Announcing the Plan to Catch-Up in July 2022 for the 2022–23 school year, which included getting students back in classrooms in September 2022, new tutoring supports to fill gaps in learning, preparing students for the jobs of tomorrow, providing more money to build schools and improve education, and providing necessary mental health supports; and
- Announcing the next steps to the Plan to Catch Up in October 2022 with a special focus on catching up in math, reading and writing.
- Continuing to modernize curriculum to ensure students have foundational and transferable skills that prepare them for work and life. This includes:
- Revising the Grade 6 Social Studies curriculum to strengthen Holocaust education for September 2023.
- Offering newly developed online learning courses to support secondary school students with meeting the online learning graduation requirement.
- Expanding the Dual Credit program to allow more eligible students to take apprenticeship and technological education courses that count towards their Ontario Secondary School Diploma and a college credential, or Certificate of Apprenticeship.
- Announcing revisions to the curriculum in Computer Studies for September 2023 and Technological Education for September 2024, to strengthen STEM education and better prepare students for jobs in science and technology.
- Announcing the introduction of a new Ontario Secondary School Diploma graduation requirement for students to earn a Grade 9 or 10 Technological Education credit, starting with students entering Grade 9 in September 2024.
- Continuing to work with Indigenous partners on revisions to the Grades 1–3 Social Studies Curriculum for September 2023 to include more learning on First Nations, Métis and Inuit histories, perspectives and contributions.
Postsecondary education sector
Ontario’s postsecondary education system prepares students and job seekers with the high-quality education, skills and opportunities needed to get good jobs, and provides Ontario’s employers with the skilled workforce and talent they need to thrive and prosper.
Results reported in 2022–23 include:
- Providing financial assistance through the Ontario Student Assistance Program to more than 410,000 full-time students in the 2022–23 fiscal year.
- Increasing postsecondary education attainment rate in 2022–23 to 74% — up from 73% in 2021–22.
- Supporting the training of more doctors with an expansion of 260 undergraduate seats and 449 postgraduate positions in medical schools over the next five years.
- Training more nurses by creating 3,000 additional enrolment spaces for Practical Nursing and Bachelor of Science in Nursing students starting in Fall 2023.
- Helping Ontario researchers and companies maximize the value of their intellectual property and compete in global markets through Intellectual Property Ontario, a new board-governed agency to provide services and build capacity for intellectual property expertise in Ontario.
- Supporting ground-breaking work at ten leading research institutes/organizations across the province and supporting 163 research projects at colleges, universities and research hospitals through the Ontario Research Fund and Early Researcher Awards.
Children’s and social services sector
The Ministry of Children, Community and Social Services funds and delivers programs and services that promote thriving and inclusive communities, help the people of Ontario build independence and improve their quality of life.
Results reported in 2022–23 include:
- Implementing the first full year of Ontario Autism Program (OAP) services and supports, including urgent response services and AccessOAP, the independent intake organization for the OAP.
- Increasing Ontario Disability Support Program (ODSP) income support rates and the maximum monthly amount for the Assistance for Children with Severe Disabilities program by 5%, with both being tied to inflation going forward.
- Increasing the earnings exemption for people with disabilities on ODSP who are able to work by 400%.
- Continuing to implement Pathways to Safety: Ontario’s Strategy in Response to the Final Report of the National Inquiry into Missing and Murdered Indigenous Women and Girls — a comprehensive plan of violence prevention initiatives developed in partnership with the Indigenous Women’s Advisory Council and 12 partner ministries.
- Extending the mandate of the Indigenous Women’s Advisory Council to March 2025 to support Indigenous voices in program and policy developments.
- Continuing the reform of Ontario’s child welfare system to focus on services that prioritize safety and early intervention, are high-quality and culturally appropriate, and are responsive to the needs of children, youth and families.
- Investing in Indigenous-led child welfare programs that improve the health and well-being of Indigenous children, youth, families and communities and funding culturally relevant mental health and wellness services for Indigenous youth at risk of, or in conflict with the law.
- Investing in community-based agencies across the province, including:
- Services and supports to women and their children who have experienced violence, or are at risk of experiencing violence, including gender-based domestic violence;
- Victim services to support victims of crime and create safer communities.
- Anti-human trafficking community supports to protect and prevent at-risk individuals from being exploited; and
- The Investing in Women’s Futures program to deliver services to prevent gender-based violence, promote healing and wellness and assist women in gaining the skills they need to become economically self-sufficient and secure.
Justice sector
The justice sector supports the administration and delivery of justice services, including the administration of courts, prosecution of offences, provision of legal services and supports to victims and vulnerable persons, as well as administering the public safety, policing and correctional systems to ensure that Ontario’s diverse communities are supported and protected.
Results reported in 2022–23 include:
- Continuing the largest transformation of the justice sector in Ontario’s history to bring more services online and to where the people of Ontario live. This included:
- Completion of an additional 50 installations, as well as 34 satellite units, to support virtual court proceedings in 18 First Nation fly-in communities in Northern Ontario. This ensures that video and audio court hearings are available in every region, including more rural, northern, and Indigenous communities;
- Launched a new jury notification system that sends jurors and potential jurors text messages and emails about important updates such as court cancellations, date, time and location changes; and
- Laid the groundwork for implementation of the Courts Digital Transformation initiative, which will allow court users to digitally access court information from anywhere.
- Supporting the Next Generation 9-1-1 initiative to create a safer, faster and more informed emergency response system, allowing the public to communicate through real-time-text to 9-1-1 and emergency operators and dispatchers to identify the location of a call using GPS coordinates.
- Investing in Automated License Plate Recognition technology to capture vehicles of interest such as those involved in Amber Alerts, drivers with suspended licences and stolen vehicles.
- Completing the new Ontario Court of Justice — Toronto, a fully accessible, state-of-the-art courthouse with specialty courts, such as those for drug treatment, Indigenous justice, youth and mental health.
- Launching Ontario’s regulated iGaming market, expanding the market to more than 40 operators across 70 gaming websites and generating $35.6 billion in total wagers and $1.4 billion in total gaming revenue.
- Recruiting and retaining critical frontline corrections staff in the North through the Northern Attraction Incentive Program, supporting the recruitment of 129 new employees and relocation of 52 employees to northern institutions and probation and parole offices.
- Opening the Kenora Justice Centre in collaboration with Indigenous leaders, the Ontario Court of Justice and community partners. The Centre holds individuals accountable for their offences, while providing culturally appropriate wrap-around programs delivered by specialized teams, including Indigenous-led organizations.
- Building a better-connected justice system through Ontario’s eIntake digital platform to expedite the process for law enforcement officers to file criminal charges electronically, streamline information sharing amongst police, other enforcement agencies and courts in real time; and enter decisions, sign documents and request information online.
- Fighting cybercrime, including online hate crimes, human trafficking, and fraud, by investing in education campaigns and community resources.
Condition and capacity of provincial tangible capital assets
Infrastructure investments should be made using an evidence-based approach. This includes a focus on asset management to ensure the delivery of high-quality public services, while efficiently managing the costs.
- The Province compiled its first infrastructure asset inventory in 2016 as a key step in managing provincial assets more effectively. The infrastructure asset inventory is now updated annually and currently contains information such as the location, age, condition and value of over 15,000 tangible capital assets, including buildings and Ontario’s entire road and bridge network. This covers the majority of the infrastructure assets owned or consolidated (i.e., certain BPS organizations) by the Ontario government, as well as some other assets that are funded in part, but not owned or consolidated, by the government.
- The Province uses the infrastructure asset inventory to track, monitor and report on the physical condition of assets. For example, the infrastructure asset inventory contains indicators such as Facility Condition Indexes (FCIs), Bridge Condition Indexes (BCIs) and Pavement Condition Indexes (PCIs), which help to inform the state of infrastructure assets.
- Ontario has expanded its infrastructure asset data to include other relevant data and analysis, such as the current and projected capacity and utilization of assets. This integrated data provides a base to support evidence-based infrastructure planning decisions which help ensure that infrastructure investments provide value for money and are made at the right time and the right place.
Transparency and accountability
Ontario continues to take steps that enhance government transparency and fiscal accountability in its financial reporting. Throughout the fiscal year, the government provides regular updates on Ontario’s finances. The Annual Report and Consolidated Financial Statements, along with supplementary information, are central to demonstrating the government’s transparency and accountability in reporting its financial activities and its position at the end of the fiscal year.
Recent developments in public sector accounting standards
The Ontario government’s financial reports are prepared in accordance with the accounting standards for governments set by the Public Sector Accounting Board (PSAB) and contained in the Chartered Professional Accountants of Canada (CPA Canada) Public Sector Accounting Handbook.
Asset retirement obligations
In August 2018, PSAB issued a standard, Section PS 3280, Asset Retirement Obligations effective for fiscal years beginning on or after April 1, 2022. Asset retirement obligations are liabilities when a legal obligation exists to incur retirement costs in relation to a tangible capital asset. Effective April 1, 2022, the Province adopted Section PS 3280 using the modified retroactive method with restatement of 2021–22 figures. The significant accounting policy disclosures are included in Note 1(e) and Note 7.
Financial statement presentation
Effective April 1, 2022, the Province adopted Public Accounting Standard PS 1201, Financial Statement Presentation. As a result of adoption of Section PS 1201, a new statement of remeasurement gains and losses was presented for the year ended March 31, 2023. This statement presents remeasurement gains and losses arising from portfolio investments, derivative financial instruments, foreign currency transactions, other comprehensive income from GBEs, and Ontario Nuclear Funds.
Financial instruments
Effective April 1, 2022, the Province adopted Public Accounting Standards Section PS 3450, Financial Instruments. In accordance with the transitional provisions, the standards were adopted prospectively from the date of adoption and comparative figures were not restated.
As described in Note 1 to the Consolidated Financial Statements, future changes in both public-sector and private-sector accounting standards may affect how assets, liabilities, revenues and expenses are reported in Ontario’s consolidated financial reports. Other current projects that are being closely monitored by Ontario include concepts underlying financial performance, employee benefits, government not-for-profit strategy and annual improvements projects.
The C.D. Howe Institute Fiscal Accountability Report
Annually, the C.D. Howe Institute issues its commentary on the fiscal reporting transparency of senior Canadian governments, with a focus on the relevance, accessibility, timeliness and reliability of these government financial reports, including the Public Accounts. Each government is assigned a letter grade based on the quality of the numbers presented in these reports, access and user friendliness, and the ability to use them for various decision-making purposes.
The last report was released in September 2022. In the report, for the third consecutive year, Ontario had maintained its grade.
At the time of the Auditor General opinion date for the 2022–23 Public Accounts, the 2022 Fiscal Accountability Report covering the Public Accounts of Ontario 2021–2022 ad not been issued.
Chart descriptions
Chart 1: 2022–23 Revenue by source
This chart shows the percentage composition of Ontario’s Total Revenues in 2022–23 by source. Total revenue is $192.9 billion.
Personal Income Tax accounts for 22.9%. Sales Tax accounts for 18.7%. Federal Transfers account for 16.2%. Other taxes account for 11.6%. Corporations Tax accounts for 14.4%. Fees, donations and other revenues from BPS accounts for 6.0%. Other non-tax revenue accounts for 3.9%. Education Property Tax accounts for 3.1%. Income from Government Business Enterprises accounts for 3.2%.
Note: Percentages may not add to 100% due to rounding.
Chart 2: Revenue by source — 5-year comparison
This bar graph shows recent trends in revenue for Ontario’s major revenue sources. The source categories include taxation, federal transfers, income from Government Business Enterprises, fees, donations and other revenues from Broader Public Sector Organizations, and other revenues for the period between 2018–19 to 2022–23.
Notes: Government Business Enterprises are: Hydro One Limited, Liquor Control Board of Ontario, Ontario Lottery and Gaming Corporation, Ontario Power Generation Inc., iGaming Ontario, and Ontario Cannabis Retail Corporation. Provincial revenue from Hydro One Limited’s net income is proportional to the government’s ownership share.
Chart 3: 2022–23 Program expense by sector
This chart shows the percentage composition of Ontario’s program expenses in 2022–23 by sector. Program expense equals total expense minus interest on debt expense. Total program expense in 2022–23 was $186.4 billion.
The detail of the program expenses by sector is as follows: Health accounts for 42.1%; Education accounts for 18.5%; Other programs account for 20.5%; Children’s and social services account for 9.7%; Postsecondary education accounts for 6.2%; and Justice accounts for 2.9%.
Notes: The Teachers’ Pension Plan expense is included in Other programs and align with the presentation in Table 3.8 of the 2022 Budget. Percentages may not add to 100% due to rounding.
Chart 4: 2022–23 Spending by type of expense
This chart shows the percentage composition of Ontario’s total expenses in 2022–23 by type of expense. Total expense is $198.8 billion.
Transfers account for 41.2%. Salaries and benefits account for 33.6%. Operating costs account for 17.3%. Debt charges account for 6.2%. Other expenses account for 1.6%.
Notes: Compensation related costs for non-consolidated entities (for example, municipalities, universities) and payments to doctors for physician services are included in Transfers. Percentages may not add to 100% due to rounding.
Chart 5: Expense by sector — 5-year comparison
This bar graph shows the trend in total spending for major program areas: Health, Education, Children’s and social services, Postsecondary education, Justice, Other programs, and interest expense for the period between 2018–19 to 2022–23.
Notes: The Teachers’ Pension Plan is included in Other programs to align with the presentation in Table 3.8 of the 2022 Budget.
Chart 6: Interest on debt to total revenue — 5-year trend
Chart 6 shows that the ratio of interest on debt to total revenue has fallen for Ontario over the past four years, from a high of 8.1% in 2018–19 to the current level of 6.4%.
Chart 7: Financial assets — 5-year comparison
This bar graph shows the trend in Ontario’s financial assets by category: cash, investments, accounts receivable, loans receivable, derivative assets, other assets, and investment in Government Business Enterprises from 2018–19 to 2022–23.
Note: Government Business Enterprises include: Hydro One Limited, Liquor Control Board of Ontario, Ontario Lottery and Gaming Corporation, Ontario Power Generation Inc., iGaming Ontario, and Ontario Cannabis Retail Corporation..
Chart 8: Trends in the net book value of Provincial Tangible Capital Assets — 5-year comparison
This bar graph shows the trends in net book value of provincial tangible capital assets by sector: transportation and transit, health, education, postsecondary education and other for the period between 2018–19 to 2022–23.
Chart 9: Liabilities — 5-year trend
This bar graph shows the recent trends in total liabilities for Ontario by type: debt, other long-term financing and other types of liabilities from 2018–19 to 2022–23.
Footnotes
- footnote[1] Back to paragraph Comparatives on Budget and prior year Actuals have been reclassified to be reflected on the same basis as that used to report the actual current year expenses. Actual results for 2021–22 are also restated to reflect the consolidation of the Pension Benefits Guarantee Fund (PBGF) into the Financial Services Regulatory Authority of Ontario (FSRA), as well as the implementation of PS 3280 Asset Retirement Obligations (ARO). The change in classification of the PBGF from trust under administration to other government organization resulted in a line‐by‐line consolidation of the fund on a retroactive basis, including restatement of prior year. See Note 17 to the Consolidated Financial Statements
- footnote[2] Back to paragraph Comparatives on Budget and prior year Actuals have been reclassified to be reflected on the same basis as that used to report the Actual current year expenses. Actual results for 2021–22 are also restated to reflect the consolidation of the Pension Benefits Guarantee Fund into the Financial Services Regulatory Authority of Ontario (FSRA). See Note 17 to the Consolidated Financial Statements.
- footnote[3] Back to paragraph For presentation purposes, one-time COVID‑19-related spending was shown separately within COVID‑19 Time-Limited Funding in the 2022 Budget, which has been included in the respective sectors in this table. The change in presentation does not impact ministry allocations or ministry structure(s).
- footnote[4] Back to paragraph Ontario Teachers’ Pension Plan impact is included in Other programs to align with the presentation in Table 3.8 of the 2022 Budget. In the Consolidated Financial Statements, this item appears under the Education sector. Schedule 4 to the financial statements provides details.
- footnote[5] Back to paragraph Comparatives on Budget and prior year Actuals have been reclassified to be reflected on the same basis as that used to report the actual current year expenses. Actual results for 2021–22 are also restated to reflect the consolidation of Pension Benefits Guarantee Fund into the Financial Services Regulatory Authority of Ontario (FSRA), as well as the implementation of PS 3280 Asset Retirement Obligations (ARO). See Note 17 to the Consolidated Financial Statements.
- footnote[6] Back to paragraph Includes adjustments for the net book value of assets disposed during the year, as well as changes in valuation.
- footnote[7] Back to paragraph Mainly transfers for capital purposes to municipalities and universities and expenditure for capital repairs.
- footnote[8] Back to paragraph Includes social and justice sectors, broadband infrastructure, government administration, natural resources, and the culture and tourism industries.
- footnote[9] Back to paragraph Includes Other partner Funding which refers to third-party investments primarily in consolidated entities such as hospitals, colleges, school boards and Children’s Aid Societies.
- footnote[10] Back to paragraph Includes Federal/Municipal contributions to provincial infrastructure investments.
- footnote[11] Back to paragraph Actual results for 2021–22 are restated to reflect consolidation of Pension Benefits Guarantee Fund into Financial Services Regulatory Authority of Ontario (FSRA), as well as implementation of PS 3280 Asset Retirement Obligations (ARO). Prior year comparatives have been reclassified to be reflected on the same basis as that used to report the actual current year expenses. See Note 17 to the Consolidated Financial Statements.
- footnote[12] Back to paragraph In 2022–23, the Province recognized derivative liabilities on existing derivative contracts due to implementation of new Public Sector Accounting Standards on Financial Instruments (Section 3450) and Foreign Currency Translation (Section 2601)
- footnote[13] Back to paragraph Increase in cash from a net increase of $38.6 billion in changes to assets and liabilities net of the government’s operating deficit of $5.9 billion. See the Consolidated Statement of Cash Flow.
- footnote[14] Back to paragraph New Tangible Capital Asset (TCA) investments of $15.7 billion less proceeds of $0.4 billion from the sale of tangible capital assets.
- footnote[15] Back to paragraph Increase in cash reserve of $5.7 billion and cash used to fund investment purchases in excess of retirements of $6.9 billion.
- footnote[16] Back to paragraph Including net decrease in financing of capital projects through Public Private Partnership (P3). See Note 4 to the Consolidated Financial Statements.