Summary of results from the 2020 recreational fishing survey in Ontario
Learn about the 2020 recreational fishing survey of anglers in Ontario and how we assess the economic and social importance of Ontario’s recreational fisheries.
This technical report should be cited as follows:
Hunt, L.M., H. Ball, A. Ecclestone and M. Wiebe. 2022. Selected results from the 2020 recreational fishing survey in Ontario. Ontario Ministry of Natural Resources and Forestry, Science and Research Branch, Peterborough, Ontario. Science and Research Technical Report TR-50. 33p. + appendices.
Abstract
The 2020 recreational fishing survey was the tenth in a series of surveys conducted in Ontario every five years since 1975. We focused the survey primarily on three populations of anglers: Ontario resident (fishing licence purchasers from Ontario), other Canadian (fishing licence purchasers from other Canadian provinces), and Ontario senior anglers (65 to 70-year-old former fishing licence purchasers from Ontario). Some information was also estimated for non-resident (fishing licence purchasers from outside Canada) and younger (less than 18 years old) anglers. Relative to 2015 survey results, the number of active anglers, days fished, and fish caught and harvested declined in 2020. This decline was largely driven by the 89% decrease in licence sales to non-resident anglers between 2019 and 2020. Among Ontario resident anglers, licence sales increased by 7% between 2019 and 2020 resulting in more days fished and fish caught between 2015 and 2020 for this group. While younger anglers were also estimated to increase their days fished, more Ontario senior anglers were estimated to have fished fewer days between 2015 and 2020, suggesting that the COVID‑19 pandemic effects on fishing activity differed by angler age and residency.
We estimated that 1.15 million anglers actively fished in 2020, spending about 15.6 million days fishing and about $1.74 billion on consumables and investments wholly attributable to fishing. Excluding anglers who were non-residents of Canada or under 18 years of age, these about 782,000 active anglers fished for 13.6 million days, 87% of which were during the open water season. Anglers targeted walleye (Sanders vitreus) at over twice the rate of any other species and harvested about 19% of the 51 million caught fish. Ontario senior anglers had the highest rate of harvesting their caught fish while other Canadian anglers had the lowest. Ontario resident anglers from Northwestern Ontario and anglers with a sport fishing licence tended to prefer and target walleye, to consume fish, and to use live baitfish more than other anglers. Finally, while the sampled anglers’ stated adherence to various fishing and boating-related advice and rules was high, non-adherence rates were not trivial:
- about 20% of anglers reported releasing live baitfish into a waterbody
- 57% of anglers who fished multiple waterbodies in 2020 with the same watercraft did not always wash their watercraft
- 55% of anglers who were aware of a fish consumption guide did not always follow the advice
Consequently, opportunities exist to increase adherence and compliance of anglers with advice and rules designed to limit unwanted outcomes from recreational fishing in Ontario.
Acknowledgements
Thank you to all the anglers who completed this survey and provided the data needed for this report. A very large team of individuals contributed to the design, implementation, data entry and coding, and/or analyses. These Ministry of Natural Resources and Forestry (MNRF) individuals include Zaur Aliyev, Lindsay Brown, Dak de Kerckhove, Sibley Duckert, Victoria Kopf, Cam Leitrants, Kristeen McGowan, Graydon McKee, Mary Garvey, Lecia Makkinga, Jenny Rodgers, Jamien Sandhu, Emma Schubert, Katie Tripp, Blair Wasylenko, and Will Wistowsky. We also appreciate the efforts by Rob Davis, Karen Hartley, and Adam Gryck from the Ministry of Environment, Conservation, and Parks (MECP) to review earlier versions of the questionnaires. We thank Matt Garvin and Dan Taillon (MNRF) for reviewing the entire report and Satyendra Bhavsar (MECP), Jeff Brinsmead (MNRF), and Scott Gibson (MNRF) for reviewing parts of the report. Finally, we thank Lisa Buse for editing the report.
Introduction
Recreational fishing is a very popular pastime in Ontario. In 2015, the estimated number of anglers between 18 and 70 years old was 1.2 million (OMNRF 2020a). These anglers obtain many benefits from recreational fishing including food, recreational services, and the physical and psychological benefits associated with nature contact (Arlinghaus et al. 2020). Besides these benefits, angling can affect aquatic resources through harvesting fish along with other effects on fish, fish communities, and aquatic ecosystems (read Lewin et al. 2006 for details).
An angler survey is one method to help understand the benefits and impacts associated with recreational fishing. While individuals and agencies have conducted one-off surveys of anglers in Ontario since 1959 (such as Cox and Straight 1975, Drake et al. 2014, Hunt et al. 2021a), Fisheries and Oceans Canada and the Ministry of Natural Resources and Forestry (MNRF) have conducted a regular survey with a large-sized sample of anglers every five years since 1975. Here, we report results from the 2020 survey of recreational fishing in Ontario (delivered solely by MNRF) and, where appropriate, compare results to those from previous surveys to understand changes over time.
The benefits of conducting a broad scale and long-term survey are the richness of information for the year in question and trends over time. Here, we focus primarily on the richness of the information in 2020. Nevertheless, we compare some results from 2020 to results from more recent surveys (2010 and 2015). These comparisons help the reader to understand changes to recreational fishing in Ontario in 2020 that might have arisen from societal responses to the COVID‑19 pandemic or ongoing changes to Ontario’s demographics.
The effects of the COVID‑19 pandemic on recreational fishing in Ontario are not well understood. Although research from the United States suggests that fishing activity increased during the pandemic (Midway et al. 2021), research from Ontario suggests that while fishing activity declined during the spring of 2020, many new anglers were attracted to fishing during the year (Howarth et al. 2021). A large share of recreational fishing in Ontario comes from anglers who are non-residents of Canada (such as non-residents accounted for 24% of anglers 18 and older in 2015; OMNRF 2020a). Federal government decisions to close the Canada-United States. land border to non-essential travel made it difficult for non-residents to fish in Ontario in 2020. Emerging evidence from Denmark also suggests that the pandemic might have affected older anglers more negatively than younger anglers (Gundelund and Skov 2021). Thus, the effect of the pandemic on recreational fishing in Ontario is unknown and may vary depending on residency and age. Here, we begin to address this gap using information from licence sales and survey results.
The 2020 survey also affords an opportunity for a richer understanding of recreational fishing and anglers in Ontario. In past surveys (2010 and 2015; OMNRF 2014, 2020a), this nuanced perspective was provided by separating anglers into populations based on residency and age. We also provide a more detailed examination of purchasers of Ontario resident fishing licences from 2020 (Ontario resident anglers) by examining responses by subpopulations of these anglers based on their fishing licence and origin.
The origin of Ontario resident anglers might help to explain the diversity in anglers’ behaviours, benefits, and impacts. This diversity likely arises from the social-ecological context that confronts any given angler. This context includes density of human populations, availability and accessibility of lakes and rivers, availability and abundance of different fish species, and different norms within communities of anglers. For example, urbanites are less likely to engage in angling and they participate less frequently in angling than do individuals from more rural settings (Hunt et al. 2017, Arlinghaus et al. 2020). In Ontario, walleye (Sanders vitreus) is the most highly sought species by anglers (OMNRF 2014, 2020a). The distribution and abundance of walleye is uneven throughout Ontario with higher abundance and opportunities available in northern Ontario (OMNDMNRF 2022). Thus, anglers from Northern Ontario might behave differently, resulting in different effects and benefits than other anglers (such as Northern Ontario anglers might target walleye at higher rates, catch and harvest more walleye, and be more satisfied with their fishing experience than other anglers). Conversely, anglers from Southern Ontario may target different species or travel longer distances to reach waterbodies containing their most preferred species.
A detailed analysis of the 2020 survey involves not only a more thorough examination of the key statistics associated with recreational fishing, but also other aspects of angler behaviours and perspectives. One such aspect is anglers’ self-reported adherence to regulations and advice. Regulations and advice are developed for more reasons than addressing concerns with overharvesting fish by anglers. One reason is to reduce the likelihood that anglers will illegally release baitfish in or nearby a waterbody in Ontario (Drake et al. 2014) or will introduce invasive species by inadvertently moving species to a new waterbody when trailering watercraft (Bossenbroek et al. 2001). In 2020, anglers were only advised to clean, drain and dry their watercraft before moving it to a new waterbody (Canadian Council on Invasive Species 2022). A second reason is to reduce the exposure of anglers and family members to contaminants through consumption of fish. Advice about fish consumption for Ontario anglers is provided by a Guide to Eating Sport Fish in Ontario (Ministry of Environment, Conservation and Parks (MECP) 2017). This guide, which is now available only online as a mapping application, provides information about safe levels of consumption for groups of people with different sensitivities to contaminants. Consumption recommendations are based on different fish species, sizes of fish and locations where fish are caught. We examine the self-reported adherence of anglers to these rules and advice to better understand the types of impacts that might arise from lack of adherence.
Methods
Study area and populations of interest
Our focus was the entire recreational fishery in Ontario, which consists of about 250,000 lakes and 490,000 kilometres of rivers (OMNDMNRF 2022). Walleye, which is the most targeted and preferred fish species by anglers in Ontario (OMNRF 2014, 2020a), are more abundant in lakes in Northern than Central and Southern Ontario (OMNDMNRF 2022). The same difference in abundance generally holds for other popular game fish including lake trout (Salvelinus namaycush) and northern pike (Esox lucius), although smallmouth bass (Micropterus dolomieu) are more abundant in Southern Ontario lakes (OMNDMNRF 2022). The Laurentian Great Lakes also are sources of much sought after species such as:
- walleye and yellow perch (Perca flavescens)
- smallmouth and largemouth bass (Micropterus salmoides)
- lake trout
- anadromous Pacific salmonids including:
- rainbow trout (Oncorhynchus mykiss)
- Chinook salmon (Oncorhynchus tshawytchscha)
- coho salmon (Oncorhynchus kisutch) (OMNRF 2020b)
Ontario’s population and its population of anglers are not evenly distributed. Ontario’s 2021 population of more than 14 million (Statistics Canada 2022) was heavily concentrated in Southern Ontario and especially around the city of Toronto. Although the rate of Ontario’s population that participates in recreational fishing is negatively associated with population density (Hunt et al. 2017), most anglers reside in highly populated parts of Ontario (OMNRF 2020a).
We sampled three populations of anglers in Ontario:
- Ontario resident anglers who purchased a fishing licence for 2020
- other Canadian anglers who purchased an Ontario fishing licence for 2020
- Ontario senior anglers who previously purchased an Ontario fishing licence and were between 65 and 70 years old (read Appendix 1 for definitions of these and other common groups and terms).
Ontario senior anglers are deemed fishing licence holders because those 65 years and older are not required to purchase a license. These 3 populations of interest exclude other deemed licence holders (such as individuals less than 18 or more than 70 years old, military veterans, individuals with a disability), members of Indigenous communities exercising an Aboriginal or treaty right, and non-residents of Canada. Non-resident anglers were omitted from the sample because of the closure of the Canada-United States land border to non-essential travel, preventing most anglers from travelling into Canada for the open water season in 2020.
Within our Ontario resident and other Canadian angling populations, we stratified anglers by licence type:
- three year or annual sport fishing licences
- three year or annual conservation licences
- one day licence holders
A sport fishing licence is more expensive and provides higher catch and possession limits for harvesting fish than a conservation licence. For the Ontario resident population, anglers were also stratified by their origin using the first character of the postal code of their mailing address, and postal code P, which encompasses Northern Ontario, was divided into northwest and northeast areas with the northwest comprising postal codes starting with P0T, P0V, P0W, P0X, P0Y, P7, P8, and P9 and the northeast comprising all other postal codes beginning with P.
We sampled 32,000 anglers from these populations and subpopulations. The number of samples was chosen from considerations of the expected reliability of survey estimates (i.e. power analyses) and pragmatic considerations of financial cost and respondent burden. A total of 2,000 samples were drawn for Ontario senior anglers while the remaining 30,000 samples were drawn in exact proportion to the number of licensed anglers in the other Canadian and Ontario resident angler populations and stratification by licence type and geographic strata. The exception to this sampling approach was an oversampling of Ontario resident anglers who resided in the northwest. This oversampling enabled us to obtain reliable estimates for individuals from this origin without increasing the overall sample size and the survey cost.
The estimated number of unique anglers for each population and stratum are provided in Table 1. These estimates exclude individuals who purchased multiple licences that were valid for 2020. Individuals with duplicate licences valid for 2020 represented only about 1% of Ontario resident anglers but about 13% of other Canadian anglers. These duplicates primarily occurred when the same individual purchased multiple, 1 day fishing licences.
Table 1. Estimated number of unique anglers from sampled populations and, for Ontario residents, subpopulations in a 2020 survey of anglers in Ontario. (N/A = not applicable or not available)
| Population | Sport fishing licence |
Conservation licence |
One day licence |
Overall |
|---|---|---|---|---|
| Ontario senior | N/A | N/A | N/A | 82,370 |
| Other Canadian | 16,144 | 14,302 | 15,392 | 45,838 |
| Ontario resident |
511,260 | 371,335 | 19,453 | 902,048 |
| Southeast (K) | 81,085 | 79,206 | 2,196 | 162,487 |
| Greater Toronto (L) | 138,712 | 140,369 | 7,631 | 286,712 |
| Toronto (M) | 39,332 | 35,924 | 4,933 | 80,189 |
| Southwest (N) | 117,590 | 90,784 | 3,302 | 211,676 |
| Northeast (east P) | 88,978 | 21,620 | 761 | 111,359 |
| Northwest (west P) | 45,563 | 3,432 | 630 | 49,625 |
| Total (excluding non-residents) | 527,404 | 385,637 | 34,845 | 1,030,256 |
| Non-resident |
N/A | N/A | N/A | 35,175 |
| Total (all above) | N/A | N/A | N/A | 1,065,341 |
Survey Process
The survey process followed Dillman’s (2000) Tailored Design Method with up to three contacts with selected anglers. Anglers were contacted by mail on January 8, 2021 and provided with an option to respond to the survey online using a passcode and keywords to find the survey.
On February 4, 2021, a second letter was sent to all individuals who had not yet responded to the online survey. This mailing comprised a cover letter, paper copy of the questionnaire, and a postage-paid self-addressed envelope. Anglers were reminded that they could complete the questionnaire online using the passcode and keywords. Paper copies of the questionnaire included unique numbers to remove survey respondents from receiving a third contact.
On March 12, 2021, a third contact was made to all non-respondents who had already been randomly preassigned to receive either a letter or full mailing contact. The letter contact used the same methods as the first contact (i.e. a letter to encourage online responses and reminder to complete the questionnaire). The full mailing contact used the approach for the second contact (i.e. a letter, hard copy questionnaire, and return postage paid envelope). These letter and full mailing contacts were conducted to assess the financial costs and benefits (i.e. increased response rates) of these approaches.
Questionnaire development
The survey was developed and reviewed by the authors and many others from MNRF and MECP (read acknowledgements). These reviews focused on reducing the complexity and number of questions that any single respondent had to answer. We classified all questions from the 2010 and 2015 questionnaires as:
- important and time sensitive
- important but less time sensitive
- less important
This classification helped us to narrow the focus and number of the questions for 2020 survey. Despite these efforts, the number of important and time sensitive questions resulted in a long and complex questionnaire. Therefore, we further identified a set of core questions that were important, time-sensitive, and would require many responses to produce reliable estimates. These core questions were presented on both versions of two different questionnaires, with the remaining questions divided between the different questionnaires (read Appendix 2 for copies of both).
Draft questionnaires were tested in September 2020 with two focus groups of MNRF staff: one with avid and the other with less avid anglers. These focus groups provided feedback and advice about the questionnaire length and specific questions. The questionnaires were finalized for print in October 2020 and for online in December 2020.
Individuals whose preferred language of correspondence was specified as French in the Fish and Wildlife Licensing Service database received a French version of the questionnaire. The final print questionnaires were compiled into an 8-page booklet. The online questionnaires were developed, tested, and posted to an Ontario.ca web address. While this web address was public facing, a passcode was required to begin the online questionnaire.
Study variables
The survey consisted of four main types of questions:
- fishing activity including catch and harvest
- angler perspectives and their other behaviours
- benefits from fishing
- angler characteristics
The questions about fishing activity included whether anglers participated in fishing in 2020 and, if yes, the number of days and hours they fished during the open water and ice fishing seasons. Anglers also provided detailed information about the waterbodies that they fished in Ontario in 2020. For the 4 most fished waterbodies for a respondent, this detailed information was where they fished, the number of days fished by season, fish species targeted by season, overall catch and harvest of fish, and the modes (i.e. by shore or watercraft) and time of day that they fished during the open water season. For additional waterbodies fished, the angler was only asked for details about where they fished, the number of days fished by season, and the target species for the open water season. Finally, anglers were asked questions about engagement in fishing tournaments and fishing activities of other household members.
The section on angler perspectives and other behaviours focused on themes of bait and tackle, fish consumption, watercraft movement, comparisons to 2019, preferred fish species and preferred information sources. The bait and tackle questions focused on the frequency of using (i.e. did not use, sometimes, often) various bait and tackle in 2020, the source of obtaining any live baitfish (i.e. purchased from a commercial retailer, self-harvested, other) and how often (i.e. never, sometimes, often) the angler used different means to handle or dispose of leftover baitfish at the end of a fishing day. The fish consumption questions included the frequency of consuming fish meals and awareness of and adherence to the Guide to Eating Sport Fish in Ontario (Ministry of Environment, Conservation and Parks MECP 2017). Watercraft movement-related questions included whether the individual used the same watercraft to fish more than one waterbody in 2020 and, for those who did, their frequency (i.e. never, sometimes, always) of following clean, drain, and dry precautions and the rationale for not following these precautions. Finally, the questions about comparing fishing activity in 2019 provide another crude indicator of the potential effect of the COVID‑19 pandemic on recreational fishing in Ontario. Anglers who fished in Ontario in both 2019 and 2020 were asked whether their fishing activity, expenses, and information sought in 2020 was less, the same, or more compared to 2019.
The section on benefits included questions related to satisfaction and expenditures. Anglers were asked five questions related to their experience that were loosely tied to their satisfaction, including their overall experience and the catch rates and average fish sizes for both their most- and second-most preferred species. Experience was measured using the scale of excellent, very good, good, fair, poor, and very poor.
Expenditures are not typically defined as benefits. Instead, they are the building blocks to estimate economic impacts from fishing and the economic value of recreational fishing. In terms of impacts, direct expenditures by anglers provide the base input to understand how fishing-related expenditures cycle through the provincial and/or regional economies. In terms of value, expenditures provide a conservative estimate of the value of recreational fishing. Simply put, the value of recreational fishing must be at least equal to what anglers spend or they would likely not participate in this activity. The real value of recreational fishing is likely much higher given no actual market exists for recreational fishing destinations other than angling packages.
As was done for previous surveys of anglers, we estimated expenditures at the household scale and separated these expenditures into consumables (trip-related) and investments (gear, equipment and building-related) categories. This household estimate requires the researcher to estimate the number of unique households associated with each angling population and subpopulation. We estimated these numbers by asking anglers about the number of other household members aged 18 to 64 who fished in 2020 and whether anyone in the household fished without a licence during a free fishing day in 2020. This approach, which is similar but not identical to the approach used in past surveys, resulted in an estimate of fewer unique households in 2020 than did an estimate based on a thorough search for duplicate mailing addresses in the licence database in 2020. In other words, the methods used here and for previous surveys to estimate households might underestimate the number of households and thus total expenditures. Finally, for all non-fishing equipment investments, we asked the individual to estimate the proportion of total investments attributable to fishing. This approach differed from that used in previous surveys where respondents estimated the percentage attributable to fishing for each investment category separately.
We omitted 64 expenditure reports (less than 0.5% of responses) as not valid because of excessive expenditures being reported (such as reporting spending more than $5000 in consumables per day of fishing by all individuals in the household). Excluding these individuals results in a conservative estimate of recreational fishing expenditures.
Questions about angler characteristics were limited to age, gender, origin, household size, and licence type. We use origin and licence type as moderator variables to help understand differences in behaviours, impacts, and benefits among anglers.
Weighting and non-response bias
Respondents were assigned both an individual and household weight for previous surveys. These weights were used to provide population level estimates for the questions (such as multiplying expenditures by the household weight for each respondent and then summing over all respondents). However, this weighting approach does not correctly account for non-item responses. In other words, if a respondent did not answer a question such as the amount of money spent fishing in Ontario, the respondent was assumed to have incurred no expense. To address this issue, we first estimated the average response to a question for each population and subpopulation of anglers. Next, we multiplied these averages by the number of unique anglers in each population and stratum.
Sometimes the individuals who respond to a survey differ in characteristics and behaviours from individuals who do not respond. Past surveys of recreational fishing in Ontario have accounted for these non-response biases when reporting numbers of active anglers, effort, catch, harvest, and expenditures (OMNRF 2014, 2020a). We assessed non-response bias here by comparing individuals who responded before the final survey contact (before March 12, 2021) to individuals responding after this date. The belief is that late responders are more like non-respondents, and thus one can assess non-response bias using this extrapolation method (Armstrong and Overton 1977) that is commonly used in survey-based, marketing research (Collier and Bienstock 2007). Of course, what one can infer about people who do not complete requests for a voluntary survey is limited.
Non-response bias adjustments were only made in the presence of a statistically significant difference (P<0.05) when comparing early and late responders for their rate of actively fishing in 2020 (z-test of proportions), total days fished (independent samples t-test), and total expenditures reported (independent samples t-test). Any adjustment to the rate of active anglers affects many other estimates including overall and seasonal days fished, fish caught, and fish harvested. An adjustment to the total days fished also affects seasonal estimates of days fished, fish caught and fish harvested.
Analyses
Estimates for different survey questions and themes are provided for Ontario resident, Ontario senior and other Canadian angler populations. When combined, we refer to these three populations as all sampled anglers. We also provide some estimates that include non-resident and younger (i.e. less than 18 years old) along with all sampled anglers.
Estimates for non-resident anglers were derived using the known number of unique licence holders for 2020 (Table 1). We then estimated the number of active anglers using both the reported rate from 2015 and by allowing only 8% of non-residents who purchased a three-year licence in 2018 or 2019 to be a potentially active angler in 2020. This 8% value came from the number of one year and 8-day licence holders in 2020 divided by the average numbers from 2018 and 2019. Given an estimate of the number of active anglers, we then used per active angler estimates from 2015 for days fished, fish caught, fish harvested, and expenditures to estimate these key statistics for non-resident anglers in 2020. It is possible that non-resident fishing activity in Ontario was more concentrated in January and February in 2020 than 2015 given that the main onset of the pandemic began in March for Ontario. We did not adjust the estimates from the non-resident anglers to account for this belief. For younger anglers, we estimated the number of active anglers and days fished using survey responses from all sampled anglers about any younger anglers in their household.
The results presented in the main body of the text are often aggregated into groups of fish instead individual species. This aggregation was undertaken to:
- help the reader contrast preferences and target species among different populations and subpopulations of anglers
- address the tendency for respondents to report general names rather than fish species (such as bass, trout, salmon)
- report multiple species in the same family (such as largemouth bass and smallmouth bass)
- report the wrong species (such as confusing smallmouth, largemouth, and rock bass).
Species-specific results are provided in Appendix 3 and if an angler reported more than one species, we selected the first species mentioned.
We present the reliability of the survey estimates through relative standard errors (RSEs). Following past efforts (OMNRF 2014, 2020a), we defined estimates as reliable if RSE was less than 16.5%, somewhat reliable if RSE was between 16.5 and 33%, and unreliable if RSE was higher than 33%. Estimates for RSEs for key statistics are provided in Appendix 4. Note that RSEs may give a false impression of reliability when the average value for a statistic is about zero, such as for estimating species-specific catch and harvest rates per day of fishing.
Results
Response rates and non-response bias
From the 32,000 randomly selected anglers invited to participate in this survey, 14,561 individuals provided at least some usable responses. After accounting for the 1,341 individuals who were removed because of either an undeliverable address or being deceased, the final response rate was 47%. This response rate is higher than the rates for comparable samples from the 2015 (18%) and 2010 (36%) surveys.
In 2020, Ontario senior anglers had the highest (64%) while other Canadian anglers had the lowest (38%) response rates. The rate for Ontario resident anglers was 47%. About 75% of all responses were received online. This rate of online response was highest for other Canadian (81%) and lowest for Ontario senior anglers (62%).
The survey design included a split-sample approach with different treatments for individuals who had not yet responded and were sent a third survey contact. Among all individuals who received the full mail package for their contact, about 17% responded to the survey with 34% of these responses submitted online. For the individuals who only received a letter for their third contact, about 15% responded with about 58% submitted online. These results suggest that using a letter for the third contact produced about the same response as using the more costly full mail contact.
Non-response bias tests were conducted between individuals who responded early (before the third contact) and late for each sampled angler population for actively fishing in 2020, days fished, and total expenditures, which here and elsewhere are reported in 2020 Canadian dollars (CAD) (Table A3.1). Based on the non-response bias assessment, the estimates for the number of active anglers were adjusted for two populations:
- a reduction of 2.2% for Ontario resident and
- an increase of 4.5% for other Canadian anglers (Table 2).
No evidence indicated that days fished by active anglers or expenditures differed between the early and late responders, so no other adjustments were made. By contrast, the adjustments for the 2010 survey, which were applied to the 2015 survey data, were 1.8, 16.6, and 6% reductions to active anglers, days fished, and expenditures, respectively, for all populations except other Canadian anglers (OMNRF 2020a).
Table 2. Adjustments to 2020 Ontario angler survey data from non-response bias assessment. Days fished are based on average days by respondents who actively fished in 2020, while total expenditures are based on Canadian dollars for the same year. Not statistically significant (NS) are figures under P>0.05.
| Population | Active fishing (%) | Days fished | Total expenditures (CAD 2020) |
|---|---|---|---|
| Ontario resident | −2.23 | NS | NS |
| Ontario senior | NS | NS | NS |
| Other Canadian | 4.53 | NS | NS |
Characteristics of responding anglers
Survey respondents were asked to provide information about their gender and age. About 1% of all sampled anglers preferred not to answer the question about gender identity. Of those who provided an answer, 78.3% identified as male, 21.6% identified as female and 0.1% selected other, respectively. These rates were consistent among the various populations (such as 21.7%, 20.9%, and 22.2% of Ontario resident, Ontario senior, and other Canadian anglers who identified as female).
Most (52%) of the survey respondents were aged 50 years and older with only 11% younger than 30 (Table A3.2). By contrast, only 40% of the entire sample of 32,000 anglers were between 50 to 69 years while 24% were less than 30 years. Much of this overrepresentation of older anglers in the sample was handled with the stratification of anglers into the Ontario resident and Ontario senior angler groups. However, the Ontario resident angler sample is still overrepresented by older anglers.
The age distribution percentages for all sampled anglers were about the same between Ontario resident and other Canadian anglers. The distribution of Ontario senior anglers was, by design, much different and obviously older than the distributions for the other angling populations.
Activity, catch and harvest
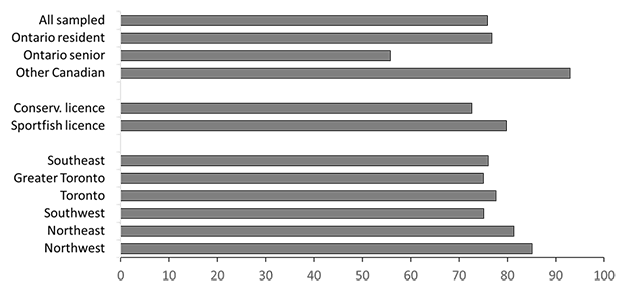
Only 76% of all sampled anglers reported actively fishing in Ontario in 2020 (Figure 1, Table A3.3). Active fishing rates were highest for other Canadian anglers (93%), and among Ontario resident anglers, sport fishing licence holders (80%) and residents of northeast (81%) or northwest (85%) Ontario. Ontario senior anglers were the least likely (56%) to report actively fishing in Ontario in 2020. These activity rates were much lower than those for 2015 (86, 87, 95 and 65% for all sampled, Ontario resident, other Canadian, and Ontario senior anglers, respectively).
The number of active anglers including all sampled, non-resident, and younger anglers fishing in Ontario in 2020 was estimated to be 1.16 million. Most of these anglers were Ontario resident (693,000), followed by younger (~345,000), Ontario senior (~46,000), other Canadian (~43,000), and finally non-resident (~27,000) anglers. This overall estimate of active anglers for 2020 was much lower than for 2015 and 2010 (1.51 and 1.63 million, respectively). This large decline was primarily driven by non-resident (91% decline) and to lesser extents other Canadian (28% decline) and Ontario senior (20% decline) anglers. Active Ontario resident anglers in 2020 only declined by 8% while active younger anglers increased by 6% from 2015.
Days fished by all sampled, non-resident, and younger anglers in Ontario in 2020 was about 15.6 million (Tables 3 and A3.3). This 2020 estimate was about 3% and 19% less than the estimates for 2015 and 2010, respectively. These declines were driven by non-resident and Ontario senior anglers who spent 90% and 12% fewer days fishing in Ontario in 2020 than in 2015. By contrast, days fished was estimated to be 27% and 9% higher in 2020 than 2015 for younger and Ontario resident anglers while days fished by other Canadian anglers was largely unchanged (3% increase).
For all sampled anglers, most fishing activity occurred during the open water season with 87 and 84% of all days and hours fished, respectively. The percentage of all days and hours spent ice fishing was highest for Ontario resident anglers. For all sampled anglers, ice fishing activity was much higher in 2020 than 2015.
Table 3. Estimated days and hours fished (in thousands) in Ontario in 2020 during different seasons by population. (ON = Ontario; N/A = not available)
| Population | Open water days | Ice days | Total days | Open water hours | Ice hours | Total hours |
|---|---|---|---|---|---|---|
| ON resident | 10,466 | 1,689 | 12,155 | 43,771 | 9,157 | 52,928 |
| ON senior | 705 | 80 | 785 | 2,875 | 400 | 3,275 |
| Other Canadian | 393 | 34 | 427 | 2,134 | 208 | 2,342 |
| All sampled | 11,563 | 1,803 | 13,367 | 48,780 | 9,765 | 58,545 |
| Non-resident | N/A | N/A | 203 | N/A | N/A | N/A |
| Younger | N/A | N/A | 2,044 | N/A | N/A | N/A |
| All sampled, non-resident and younger | N/A | N/A | 15,614 | N/A | N/A | N/A |
The average days fished per active angler was 16.1 days with 14.8 of these days occurring during the open water season. Ontario resident anglers fished the most days on average (17.5) followed by Ontario senior (17.1) and other Canadian (10.0) anglers. These estimates were much higher than those in 2015 (15, 16, and 7 days for Ontario residents, Ontario seniors, and other Canadians, respectively).
Fishing during the open water season occurs from a watercraft such as a boat or from shore including from docks or wading in the water. Anglers provided detailed information about the waterbodies they fished, including whether the days that they reported open water fishing were from a watercraft, shore, or both. Most (55%) of fishing activity occurred from only a watercraft with 25% of activity occurring from both the shore and watercraft and the remaining 20% only from the shore (Table 4). Ontario resident anglers fished only from the shore at the highest rate while other Canadian anglers were least likely to fish only from the shore.
Table 4. Open-water fishing activity (%) in Ontario in 2020 by mode and population.
| Mode | Ontario resident | Ontario senior | Other Canadian | All sampled |
|---|---|---|---|---|
| Only from watercraft | 53.3 | 71.5 | 72.2 | 55.2 |
| Only from shore | 25.8 | 13.2 | 19.8 | 20.0 |
| Both watercraft and shore | 21.0 | 15.3 | 8.0 | 24.8 |
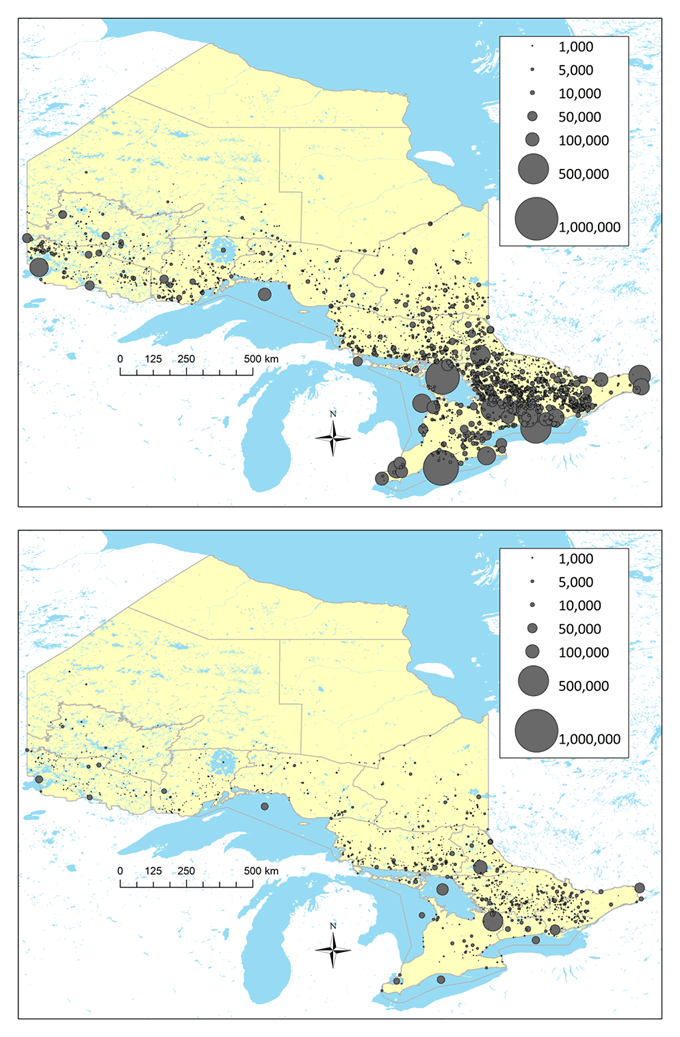
The detailed information that all sampled anglers provided about the waterbodies they fished provides insights into fishing activity across Ontario in 2020 (Figure 2).
- Much more activity occurred during the open water than the ice fishing seasons.
- More activity was evident at waterbodies in southern than northern areas of Ontario.
- Some key waterbodies, such as individual Great Lakes, Lake Simcoe, Lake Nipissing, Ottawa River, Lake of the Woods, and Grand River, attracted a large share of fishing activity (see Table A3.4 for a list of most fished waterbodies).
- During the ice fishing season, Lake Simcoe and to a lesser extent Lake Nipissing were favoured destinations.
Walleye was the most targeted species by all sampled anglers in 2020 (Table 5 and for species specific details see Table A3.5). Other Canadian anglers targeted walleye at the highest rate, and walleye was a much more likely target during the ice than the open water fishing season. Bass, sunfish (Lepomis peltastes), and crappie (Pomoxis sp.) were the second most targeted species group in the open water season in Ontario in 2020 but were targeted at a rate almost 10 times less during the ice fishing season. Among the remaining species groups, trout and salmon, yellow perch, and whitefish (Coregonus clupeaformis) were targeted relatively more often during the ice fishing season, with other Canadian anglers targeting pike and muskellunge (Esox masquinongy) at a higher rate than did other angling populations.
Table 5. Fishing activity targeting fish species groups (%) in Ontario in 2020 by population and season.
| Species group | Ontario resident | Ontario senior | Other Canadian | All sampled | All sampled open | All sampled ice |
|---|---|---|---|---|---|---|
| Walleye | 33.9 | 39.7 | 56.3 | 35.0 | 34.1 | 40.2 |
| Bass, sunfish, and crappie | 30.9 | 24.3 | 16.2 | 30.1 | 34.2 | 3.4 |
| Trout and salmon | 16.6 | 15.1 | 12.8 | 16.4 | 15.5 | 22.1 |
| Pike and muskellunge | 9.3 | 8.5 | 13.8 | 9.4 | 9.4 | 9.2 |
| Yellow perch | 4.7 | 6.2 | 0.1 | 4.6 | 3.0 | 15.4 |
| Multiple species | 2.3 | 3.2 | 0.1 | 2.2 | 2.4 | 1.5 |
| Whitefish | 1.3 | 2.7 | 0.2 | 1.4 | 0.4 | 7.7 |
| Catfish | 0.4 | 0.0 | 0.0 | 0.4 | 0.5 | 0.0 |
| Other | 0.5 | 0.3 | 0.5 | 0.5 | 0.5 | 0.5 |
The most targeted fish species by all sampled anglers was also the most caught fish species in 2020 (Table 6). The top 3 most caught fish species in 2020 (i.e. walleye, yellow perch, and smallmouth bass) aligned with the top 3 from 2015 and 2010. This order differed for other Canadian anglers in 2020 who most often reported catching walleye, smallmouth bass, and northern pike.
Over a quarter of all caught coldwater species such as brook trout (Salvelinus fontinalis), Chinook salmon, coho salmon, lake trout, lake whitefish, rainbow trout and splake (Salvelinus namaycush X Salvelinus fontinalis), were harvested by all sampled anglers in Ontario in 2020 (Table 6). By contrast, fewer than 10% of all caught warmwater species (such as largemouth bass, muskellunge, smallmouth bass and sunfish) were harvested. Coolwater species including walleye and yellow perch also had harvest rates above 25%. Among the specific angling populations, Ontario senior anglers tended to harvest fish at the highest rate (24% overall) for all species while other Canadian anglers harvested fish at the lowest rate (about 15% overall).
We also asked all sampled anglers about their participation in fishing tournaments in 2020. Participation in a fishing tournament was very low with a rate of only 2.5% of all sampled, active anglers in Ontario. Participation in fishing tournaments occurred at the highest rate among other Canadian anglers (3.6%) and the lowest rate among Ontario senior anglers (0.6%), with Ontario resident anglers falling in the middle (2.5%).
Table 6. Estimated catch and harvest of fish species in Ontario in 2020 by population (numbers are in thousands while numbers in parentheses are per cent harvested)
| Species group | Ontario resident | Ontario senior | Other Canadian | All sampled |
|---|---|---|---|---|
| Walleye | 9,413 (29.6) |
551 (40.2) |
1,115 (20.4) |
11,080 (29.2) |
| Yellow perch | 9,129 (28.0) |
709 (23.0) |
228 (7.4) |
10,066 (27.2) |
| Smallmouth bass | 8,125 (9.7) |
367 (19.1) |
410 (4.8) |
8,903 (9.8) |
| Northern pike | 4,027 (11.4) |
173 (16.7) |
318 (4.5) |
4,518 (11.1) |
| Sunfish |
5,125 (8.8) |
373 (5.5) |
15 (0.0) |
5,514 (8.6) |
| Largemouth bass | 4,374 (9.0) |
221 (15.6) |
94 2.1 |
4,688 (9.2) |
| Black crappie | 1,181 (30.8) |
92 (28.1) |
37 (26.6) |
1,309 (30.5) |
| Other | 949 (13.4) |
54 (20.0) |
5 (11.1) |
1,008 (13.7) |
| Lake trout | 786 (31.4) |
27 (51.5) |
23 (45.9) |
837 (32.5) |
| Rainbow trout | 782 (24.5) |
30 (46.1) |
24 (57.8) |
837 (26.3) |
| Brook trout | 456 (31.0) |
23 (60.8) |
9 (35.9) |
488 (32.5) |
| Lake whitefish | 409 (34.3) |
23 (48.2) |
4 (27.0) |
436 (35.0) |
| Chinook salmon | 416 (25.3) |
15 (28.7) |
25 (72.7) |
456 (28.0) |
| Muskellunge | 203 (0.7) |
10 (7.3) |
13 (0.0) |
226 (1.0) |
| Coho salmon | 96 (39.0) |
3 (16.7) |
11 (95.6) |
110 (44.3) |
| Splake | 77 (48.7) |
2 (66.7) |
5 (67.2) |
83 (50.2) |
| Total | 45,548 (19.4) |
2,674 (23.8) |
2,337 (15.0) |
50,559 (19.4) |
Finally, we asked anglers whether anyone from their household aged 18 to 64 fished without a licence during a free fishing day in 2020. More than one in twenty of all sampled anglers (6.1%) stated that someone aged 18 to 64 in their household fished without a licence during a free fishing day in Ontario in 2020. This rate of participation was highest for Ontario resident anglers (6.3%), with other Canadian anglers (4.7%) and Ontario senior anglers (4.8%) reporting about the same rate.
Angler perspectives and other behaviours
Bait and tackle
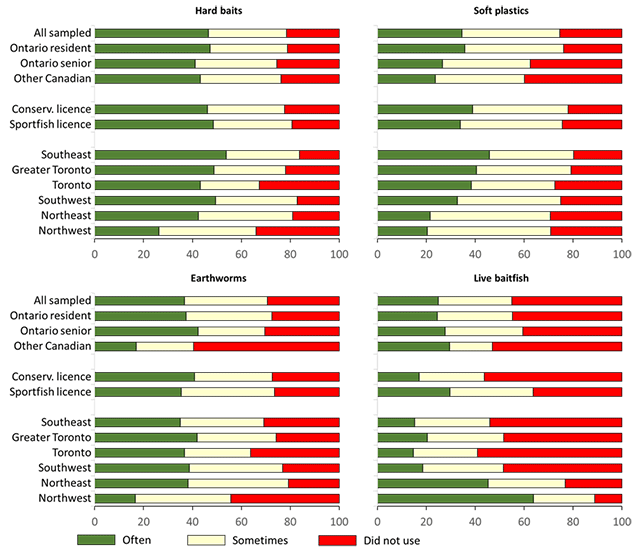
Most of the active, all sampled anglers reported using hard baits (such as crankbaits), soft plastics, earthworms, or live baitfish sometimes or often in Ontario in 2020 (Figure 3). No other types of bait and tackle (such as leeches or fish parts) were used by more than 20% of all sampled anglers (see Table A3.6 for details). Among the four most popular bait and tackle types, artificial lures (including hard baits and soft plastics) were used more often than natural baits (including earthworms and live baitfish). Ontario resident anglers were most likely to have used soft plastics (76% stating often or sometimes) while other Canadian anglers were least likely to have used earthworms for fishing in Ontario in 2020 (40% stating often or sometimes). Among Ontario resident anglers, sport fishing licence holders and those residing in the northeast and northwest were most likely to have used live baitfish while northwest anglers were least likely to have used hard baits or soft plastics.
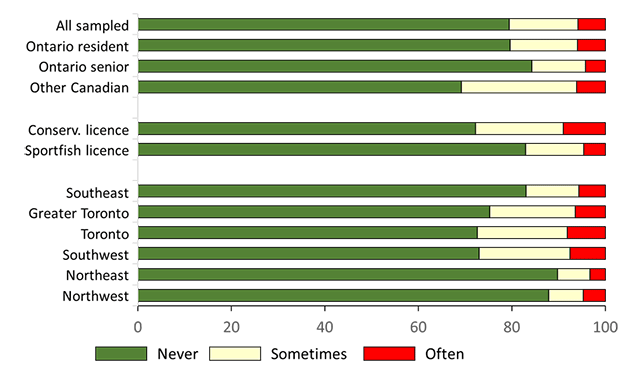
Information on where live baitfish were obtained and the frequency of using different methods to handle or dispose of leftover baitfish is provided in tables A3.7 and A3.8. Here, we focus on one concerning way that some anglers reported handling or disposing of their leftover baitfish: releasing them into the waterbody that they fished (Figure 4). Overall, about 20% of live baitfish users from all sampled anglers reported releasing baitfish sometimes or often into the waterbody that they fished in 2020. This rate was highest for other Canadian anglers (31%), and among Ontario resident anglers, lowest for sport fishing licence holders (17%) and anglers from the northeast (10%) and northwest (12%) parts of the province.
Fish consumption
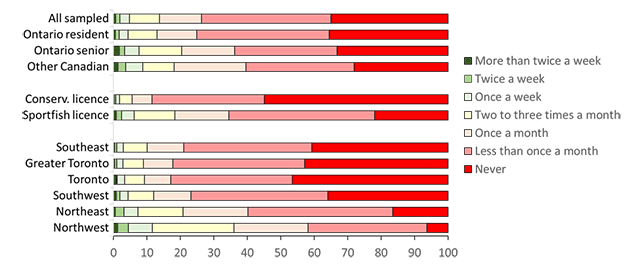
Anglers who actively fished in Ontario in 2020 were asked how often they ate sport fish, their awareness of the Guide to Eating Sport Fish in Ontario, and, for those who were aware of the guide, their adherence to it. Fish consumption was measured by stated frequency of meals over the year. More than 33% of all sampled anglers stated that they never consumed a fish meal in 2020 while 39% stated that they consumed fish meals less than once per month (Figure 5). Ontario resident anglers were least likely to report consuming fish meals. However, among Ontario resident anglers, sport fishing licence holders and anglers from the northeast and northwest were most likely to report eating fish meals.
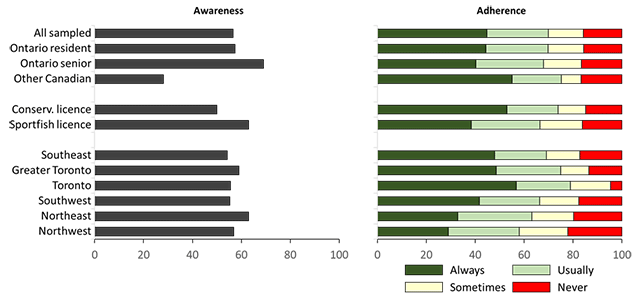
Awareness levels of the Guide to Eating Sport Fish in Ontario were generally low (57% for all sampled anglers) and especially low for other Canadian anglers (28%) and Ontario resident anglers with a conservation licence (50%; Figure 6, Table A3.9). About 70% of anglers who were aware of the guide stated that they always or usually adhered to the guide (Figure 6, Table A3.9). However, Ontario resident anglers with sport fishing licences (64%) and those residing in northeast (60%) and northwest (58%) Ontario stated lower levels of always or usually adhering to the guide than did other anglers.
Watercraft precautions
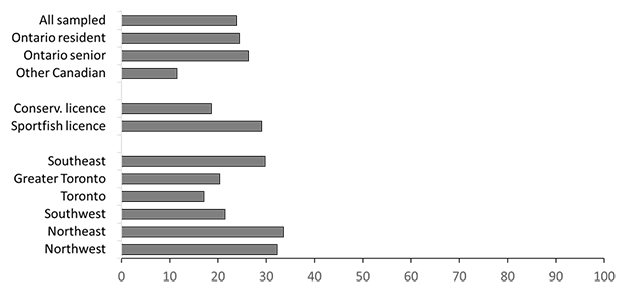
Anglers who actively fished in Ontario in 2020 were asked whether they fished multiple waterbodies with the same watercraft. About one-quarter (24%) of all sampled anglers stated that they did (Figure 7). Rates of fishing multiple waterbodies were lowest among other Canadian anglers (12%). Among Ontario resident anglers, rates of fishing multiple waterbodies were highest for sport fishing licence holders (29%) and anglers from southeast (30%), northwest (32%) and northeast (34%) areas.
For anglers fishing multiple waterbodies from the same watercraft, we asked about their adherence to precautions when moving the watercraft between waterbodies. Stated adherence to always follow the precautions among all sampled anglers was very good (>80%) for cleaning their boat and draining water from their watercraft and engine, good (almost 70%) for allowing the watercraft to dry, and poor (<50%) for washing the watercraft with hot or high-pressure water (Figure 8, Table A3.10). Adherence for washing their boat was lowest for Ontario senior anglers, with only 25% stating they always adhere to the advice.
The main reason for not always following advice for watercraft precautions was a lack of awareness (38%) followed by a belief that no aquatic invasive species were present in fished waterbodies (16%), and that aquatic invasive species are not a problem (7%). Few of all sampled anglers stated that they lack access to the right equipment (4%), that it is inconvenient (2%) or that their actions will not make a difference (1%).
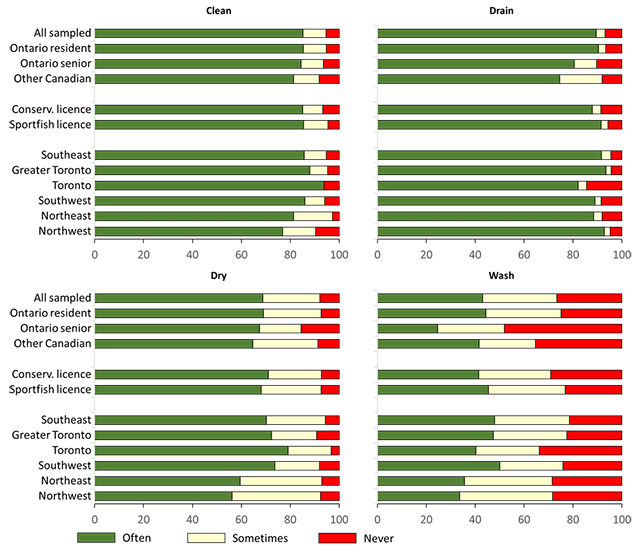
- Top left panel: cleaning vegetation from boat and trailer.
- Top right panel: draining water from watercraft.
- Bottom left panel: allowing watercraft to thoroughly dry before moving.
- Bottom right panel: washing watercraft with high pressure or hot water.
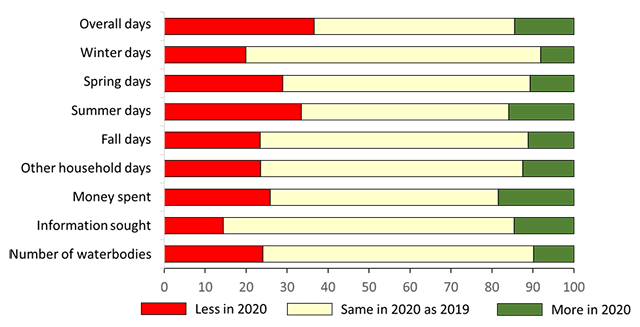
Comparing angling in 2019 and 2020
To further understand potential effects of the COVID‑19 pandemic on angling beyond changes to licence sales and comparisons from the 2015 and 2020 surveys, we asked anglers who reported fishing in both 2019 and 2020 to compare their 2020 activity, expenditures, and information-seeking behaviours to those in 2019. Most of all sampled anglers indicated no change in their fishing activity between 2019 and 2020. A higher percentage of all sampled anglers stated a decrease in 2020 compared to 2019 (Figure 9, see Table A3.11 for details). These anglers reported fishing less days in 2020 than 2019, especially in the spring and summer.
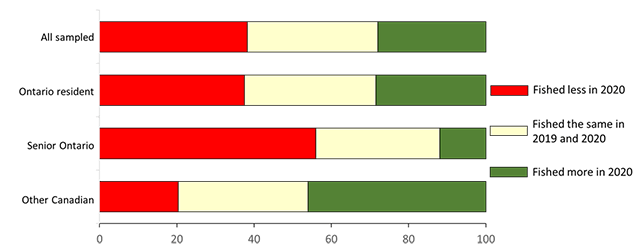
The analysis of angling activity changes (Figure 9) focuses only on anglers who actively fished in 2019 and 2020. In Figure 10, we account for anglers who only actively fished in 2020 but not 2019, those who fished in 2019 but not 2020 and evaluated change to overall fishing in 2020. Combining all these anglers, 38% of all sampled anglers reported fishing less in 2020 than 2019 while 28% fished more. The Ontario senior angler population had the highest difference with 56% of these anglers fishing less while only 12% fished more in 2020 than in 2019 (Figure 10).
Other behaviours and perspectives
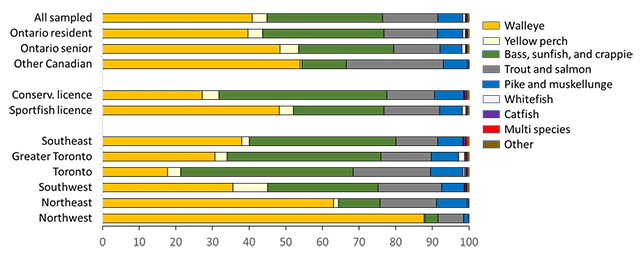
We provide some information about angler preferences by grouping fish species (see tables A3.12 to A3.14 for species-specific results). Overall, walleye (41%) was most preferred by all sampled anglers followed by bass, sunfish, and crappie (32%), trout and salmon (15%), and northern pike and muskellunge (7%) (Figure 11) with northern pike being far more preferred than muskellunge (Table A3.12). Walleye was most preferred by Ontario resident anglers with a sport fishing licence (48%) and who resided in northeast (63%) and northwest (88%) Ontario. Fishing for trout and salmon was most preferred by other Canadian anglers (27%) and Ontario resident anglers from Toronto (21%) and bass, sunfish, and crappie were most preferred by those Ontario resident anglers with a conservation licence (46%) from southeast (40%), Greater Toronto (42%), and Toronto (47%).
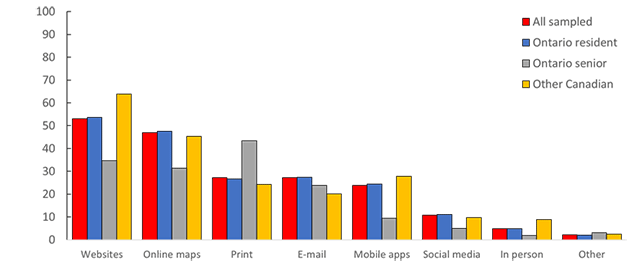
Anglers were asked about their preferred sources to obtain fishing-related information from government agencies. More than 45% of all sampled anglers preferred websites or online maps (Figure 12). When compared relatively among the specific angling populations, Ontario senior anglers were most likely to prefer receiving their information by print (44%) and least likely to prefer receiving it from websites (35%).
Benefits from angling
Satisfaction with fishing
Benefits from recreational fishing are measured through the satisfaction type questions and expenditures. Overall, 73% of active, all sampled anglers rated their fishing experience as excellent, very good, or good (Figure 13, see Table A3.15 for details). Other Canadian anglers were most satisfied among the specific populations (86% rating their experience as excellent, very good, or good). Among Ontario resident anglers, those with sport fishing licences (74%) and who resided in northwest Ontario (85%) were most satisfied with their overall fishing experience.
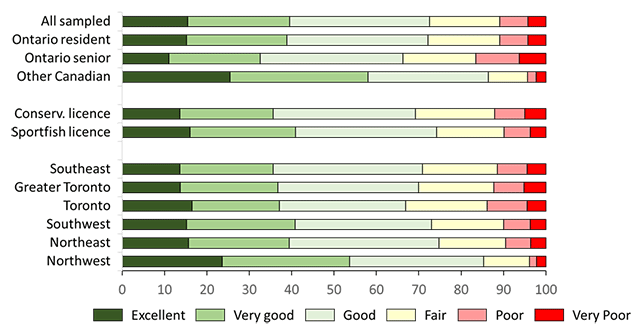
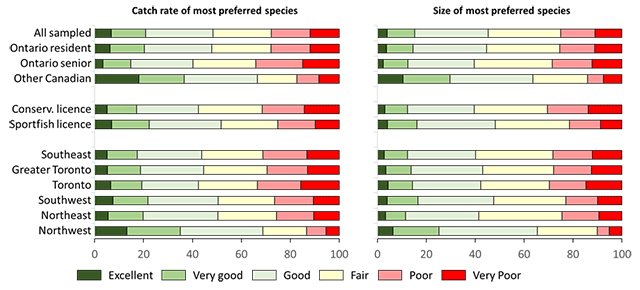
Active anglers were also asked to evaluate the catch rate and size of the caught fish for their most and second most preferred species. Here, we focus only on catch rates and size of the most preferred species (Figure 14, see Table A3.15 for details). Among all sampled anglers, satisfaction (the combined ratings of excellent, very good, and good) was higher for the overall experience (73%) than the catch rates (48%) or size of caught fish (45%) for the most preferred species. Other Canadian anglers were most satisfied with the catch rate (66%) and size (64%) of their most preferred species. Among Ontario resident anglers, sport fishing licence holders (52 and 48%) and anglers residing in the northwest (69 and 65%) were most satisfied with catch rates and size of their most preferred species, respectively.
Expenditures
For each angling population, we estimated household expenditures for angling in Ontario in 2020. These expenditures include investments (such as gear, equipment, and building-related) wholly attributable to fishing and consumables (such as trip-related costs), which are reported here as angling packages and others (Table 7, see tables A3.16 and A3.17 for more details). For the online survey, respondents were asked whether they had no household expenditures to report in 2020. Almost half (49%) of online respondents stated that they did not have any expenditures to report while only 26% of respondents to the print survey reported no expenditures. Even among active anglers, more than 40% compared to 15% of individuals responding online and print, respectively, stated they had no expenditures. Given this very high rate of stated zero expenditures by online respondents, our expenditure estimates for 2020 should be viewed as conservative.
Household expenditures by all sampled anglers were estimated to be $1.70 billion in 2020 with $1.0 billion in investments wholly attributable to fishing, $631 million in consumables including licence sales, and 60 million in angling packages. This total increases to $1.74 billion when combining all sampled and non-resident anglers if we assume that the average non-resident angler for 2020 spent the same amount as in 2015 after adjusting for inflation. While total expenditures in 2020 in by all sampled anglers increased from an inflation adjusted $1.49 billion in 2015 to $1.70 billion in 2020, these total expenditures declined when adding non-resident anglers to all sampled anglers (an inflation adjusted $1.89 billion in 2015 to $1.74 billion in 2020). We caution readers that these comparisons might be affected by the high rate of reporting no expenditures by online respondents in 2020 and revisions to methods to estimate expenditures between 2015 and 2020 (such as the slightly different approach to estimate investments wholly attributable to fishing in 2020 than 2015).
Table 7. Estimated fishing-related expenditures (millions of dollars) in Ontario in 2020 by population. (Totals for non-resident and all sampled anglers assume that average expenditures for non-resident anglers in 2015 when adjusted for inflation apply to 2020)
| Population | Consumables (trip-related) | Angling packages | Investments (gear and equipment) | Total |
|---|---|---|---|---|
| Ontario resident | 559 | 52 | 899 | 1,510 |
| Ontario senior | 40 | 3 | 60 | 104 |
| Other Canadian | 32 | 5 | 51 | 87 |
| All sampled | 631 | 60 | 1,011 | 1,701 |
| Non-resident | 38 | Note |
2 | 40 |
| All sampled and non-resident | 669 | 60 | 1,013 | 1,741 |
The average household spent $2,356 on consumables, angling packages, and investments wholly attributable to fishing. These averages were highest for other Canadian anglers ($2,664), lowest for Ontario senior anglers ($1,383), and for Ontario resident anglers was $2,458.
About 9% of all sampled anglers reported purchasing an angling package in Ontario in 2020 (Table 8). This rate was highest for other Canadian anglers and lowest for Ontario senior anglers. Among the anglers who participated in an angling package, most indicated that they took an overnight trip to a road accessible lodge or outpost camp. Other Canadian anglers were most likely to have participated in a day fishing trip with a charter or guide, but they reported taking no ice angling packages in Ontario in 2020. Note that our definition of an angling package in 2020 differed from that in 2015 so results may not be comparable.
Table 8. Participation (%) in angling packages and among participants, types of packages in Ontario in 2020 by population.
| Type of angler package | Ontario resident | Ontario senior | Other Canadian | All sampled |
|---|---|---|---|---|
| Participated in angling package | 7.0 | 3.9 | 18.5 | 7.3 |
| Overnight, remote lodge/camp | 9.9 | 10.8 | 3.0 | 9.1 |
| Overnight, road lodge/camp | 50.5 | 54.1 | 37.5 | 49.1 |
| Overnight, ice fishing hut | 12.0 | 13.5 | 0.0 | 10.1 |
| Day, ice fishing hut | 12.9 | 16.2 | 0.0 | 11.5 |
| Day, charter boat/guide | 24.5 | 35.1 | 73.0 | 30.5 |
| Other | 5.0 | 2.7 | 3.0 | 4.7 |
Discussion
Between 2015 and 2020, the number of all sampled and non-resident anglers declined by 21% while the corresponding active anglers in Ontario declined by 32% (274,000 and 379,000, respectively). These declines were primarily driven by the 89% reduction in licensed non-resident anglers from 2019 to 2020. While license sales during the same period for other Canadian anglers declined by 13%, sales for Ontario resident anglers increased by 7%. The decline in active anglers was also driven by lower rates of anglers reporting that they fished in 2020 compared to 2015. The reported rates of actively fishing in 2020 were 77 and 56% compared to 87 and 66% in 2015 for Ontario resident and Ontario senior anglers, respectively. These structural changes help to explain why estimates of days fished, fish caught, and fish harvested were lower in 2020 than 2015 when all sampled and non-resident anglers were combined.
For non-resident anglers, the COVID‑19 pandemic was associated with large declines in days fished, fish catch and harvest, and expenditures relative to 2015. The causal factor for the declines was obvious (i.e. the pandemic and associated land border closure for non-essential travel between the United States and Canada prevented most non-resident anglers from fishing in Ontario). Expenditures were estimated to have declined from an inflation adjusted $426 million in 2015 to $39 million in 2020. While the 2020 estimates are uncertain as we did not sample this population, the sheer magnitude of the difference along with the 89% decline to licensed non-resident anglers provides overwhelming evidence that COVID‑19 greatly reduced the number of non-resident anglers and thus, the associated economic impacts of fishing from non-resident anglers. These effects were most evident in northwestern Ontario where non-resident angling activity typically represents a large share of all activity (OMNRF 2020b; also see estimates of fishing activity for Lake of the Woods in Table A3.2).
When we exclude non-resident anglers from the overall estimates, 7% and 13% increases in days fished and fish caught occurred between 2015 and 2020 (harvest was estimated to decline by 6%). These increases were driven largely by Ontario resident anglers who had increases of 9% and 16% for days fished and fish caught, respectively, despite fewer active anglers in 2020 than 2015. Expenditures by these Ontario resident anglers were also estimated to increase from about an inflation adjusted $1.3 billion in 2015 to $1.5billion in 2020.
Combined with increases for younger anglers in terms of the number of active (6%) and days fished (27%), the effect of the pandemic on recreational fishing in Ontario in 2020 varied among different angling populations. For Ontario resident anglers less than 65 years old, the pandemic was associated with increased fishing activity (and increased fish catch), which is consistent with the overall increase of fishing activity in the United States during the onset of the pandemic (Midway et al. 2021).
For Ontario senior anglers, the estimated decline in fishing activity from 2015 and 2020 is consistent with results from Denmark (Gundelund and Skov 2021) indicating older anglers to be more negatively affected by the pandemic than younger anglers. Expenditures for Ontario senior anglers, however, appeared to increase from an inflation adjusted $90 million in 2015 to $104 million in 2020. Time will tell whether these effects associated with the pandemic are ephemeral or represent a persistent change.
Surveys of anglers provide relevant information about how different social-ecological contexts such as the availability and abundance of different species influence anglers. For example, while walleye remained the most preferred fish species by Ontario resident anglers, this preference was more pronounced in Northern Ontario where walleye abundance is highest (OMNDMNRF 2022). Ontario resident anglers from the northwest also rated their fishing experience as better (more satisfying) than other anglers. The increased rating likely reflects the higher abundance of walleye as catch-related fishing quality including harvest is known to be strongly and positively associated with satisfaction (Arlinghaus 2006, Birdsong et al. 2021). Likewise, use of live baitfish and consumption of fish tended to be highest in northern Ontario where walleye populations were more abundant. This latter point is consistent with the finding that Minnesota anglers who targeted walleye used live baitfish at higher rates than anglers who targeted largemouth bass (McEachran et al. 2022).
Walleye preference was not universal among Ontario resident anglers as anglers from Toronto and Greater Toronto areas were most likely to prefer the group of bass, sunfish, and crappie. Again, this preference is understandable given that smallmouth (and largemouth) bass abundance is highest in southern Ontario (OMNDMNRF 2022).
The importance of context is also revealed through differences in rates of harvesting fish. While we cannot clearly separate anglers’ voluntary (such as size is too small to harvest) from mandatory (such as size-based limits) reasons for harvesting caught fish, the results imply that voluntary release of fish caught by anglers differs among contexts and angler populations. Coldwater fish species such as trout, salmon, and whitefish were harvested at rates above 25% and often above 30% by all sampled anglers in 2020. Likewise, popular coolwater fish species including walleye, yellow perch, and black crappie were harvested at rates above 25%. By contrast, warmwater species including bass and sunfish were harvested at rates less than 10%. This almost three-fold difference in harvest rates between coldwater and warmwater species largely held for the 2015 and 2010 surveys (OMNRF 2002a, 2014). These results suggest that anglers’ decisions about harvesting fish are likely influenced by individual species, catch rates (such as high catch rates for sunfish), regulations and norms and preferences for eating different fish species. These norms are present in other contexts such as Wisconsin where voluntary release rates for smallmouth bass were much higher than those for walleye (Gaeta et al. 2013). The differences in harvest rates between cold and coolwater versus warmwater species is important. Overharvesting concerns might be more paramount for cold and coolwater species because of high release rates by anglers for warmwater species. This result suggests that managing solely for a harvest perspective for warmwater species might fail to provide non-harvest aspects of recreational fishing that anglers seek for species with very high catch-and-release rates.
Another important difference in harvest rates was among populations of anglers. Ontario senior anglers reported the highest level of harvest rates among all angling populations. This result implies that while Ontario seniors might make up a small percentage of all Ontario anglers (i.e. 8% of all sampled anglers in 2020), their per day fishing activity could have more effects than those of other angler populations, especially since their deemed licenses have the higher limits associated with sport fishing licences. For example, Ontario senior anglers reported harvesting about 10% more fish per day than did Ontario resident anglers. Thus, understanding the numbers and types of anglers can be important for understanding potential impacts to fish populations and fisheries.
Target species differed between the open water and ice fishing seasons. Fishing activity targeting smallmouth bass, largemouth bass, or bass in general represented about 32% of all activity during the open water season, but just 0.7% during the ice fishing season. This lack of target in winter is strongly influenced by the fishing closure for largemouth and smallmouth bass during ice conditions in much of southern Ontario (OMNRF 2020c) and a perceived decline in activity by smallmouth bass in winter. By contrast, many cool and coldwater species represented a larger share of the targeted fishing during the ice than the open water season. Notable increases from open water to ice fishing seasons were estimated for yellow perch (from 3.1% to 15.3%), lake trout (from 3.7% to 13.4%), walleye (from 33.6% to 40.1%), and lake whitefish (from 0.4% to 8.0%). These differences are important as ice fishing activity in 2020 represented a larger share of all fishing activity (13%) than in 2015 (10%). Consequently, species such as lake whitefish were estimated to have more targeted fishing activity and catch in 2020 than in 2010 or 2015. These increases relate to the importance of ice fishing for lake whitefish along with its prominent role as an important species to harvest by anglers fishing Lake Simcoe (Dunlop et al. 2019).
Important differences also arose when comparing Ontario resident anglers by their licence type and origin. Anglers who held a sport fishing tended to be more committed and active in fishing 2020 (such as higher rates of actively fishing, numbers of days fishing, using watercraft in multiple waterbodies and consuming fish along with using live baitfish) than those with a conservation licence. This commitment is consistent with findings that centrality of angling to their lifestyle is, on average, higher for sport fishing than conservation licence holders (Hunt et al. 2021a). As a key source to describe angler diversity, recreation specialization (Bryan 1977, Ditton et al. 1992) comprises commitment, behaviour and cognition or skill dimensions (Scott and Shafer 2001). Given that, relative to conservation licence holders, sport fishing licence holders are more committed and avid (behavioural dimension), the type of fishing licence likely is a good proxy for recreation specialization in Ontario. Therefore, by monitoring sales for different fishing licence types, it is possible to understand how commitment, avidity, and other angler behaviours might be changing.
Anglers reported their adherence to 3 different rules and advice:
- not disposing leftover baitfish in the waterbody they fished
- following the advice for cleaning, draining, and drying watercraft before moving it to new waterbodies
- following advice for consuming sport fish in Ontario
Stated adherence varied by the type of rule or advice and characteristics of the angler. Adherence was highest for draining water from and cleaning watercraft before moving it to a new waterbody (90% to 95%), followed by not releasing live baitfish into waterbodies (about 80%), fish consumption advice and drying watercraft before moving (about 70%) and finally washing watercraft with a pressure washer or hot water before moving it (about 40%).
The adherence rates were not related to potential penalties. In 2020, the only adherence rate for a rule with a defined penalty was not releasing live baitfish into a waterbody. However, anglers’ stated adherence was highest for cleaning vegetation and draining water from watercraft. The fact that 20% of live baitfish users in Ontario reported sometimes or often releasing live baitfish into waterbodies is concerning. The lack of adherence to this rule has not appreciably improved over time. In a reanalysis of data for Ontario resident anglers from the 2010 and 2015 recreational fishing surveys, the adherence rates for releasing live baitfish were 22.2%, 24.3%, and 19.0% for 2010, 2015, and 2020, respectively, however, live baitfish use declined from 70.8% to 61.1% to 58.1% for 2010, 2015, and 2020, respectively with evidence that the rate of live baitfish use was even higher before 2010 (see Fera et al. 2014).
The adherence rates for clean, drain, dry also provide timely information from which to assess the effectiveness of a regulation for watercraft in Ontario that began on January 1,2022 (Ontario Regulation 354/16, 2022). The regulation codifies the best management practices of cleaning vegetation and mud and draining water from watercraft and associated trailers into law. Future surveys of anglers can provide information on compliance with the new regulation that should provide insights into the effectiveness of changing a best management practice to a regulation.
The adherence to clean, drain, and dry principles in 2020 appeared to increase relative to 2003 (Fera et al. 2014) although this conclusion is affected by the slightly different ways that statements were worded in these surveys. The statements in 2020 nested the statements in 2003 (such as “allow boat to dry for 5 days” in 2003 became “allow the watercraft and fishing equipment to dry thoroughly for at least 5 days” in 2020). Consequently, we expected that adherence rates in 2020 should decline given that the statements in 2020 required more actions on the part of the angler. In three instances, however, the per cent of anglers stating that they always followed the principles was much higher in 2020 than 2003 (i.e. 84% to 61%, 68% to 46%, and 42% to about 10% for clean, dry, and wash, respectively, in 2020 compared to 2003 (Fera et al. 2014). Only for the principle of drain did we observe no improvement in stated adherence between 2020 and 2003 likely because the adherence rate was about 90%.
The estimated rates of adherence by anglers to follow rules and advice should be viewed with caution. On the one hand, social desirability bias likely results in overestimated rates as people tend to bias their self reports towards perceptions that they believe are correct or socially desirable (Fisher 1993). On the other hand, lack of awareness of rules and advice can influence adherence. For example, only 57% of all sampled anglers were aware of the Guide to Eating Sport Fish in Ontario, and thus, adherence could be improved through efforts to make anglers more aware of the guide. However, increased awareness is not always associated with increased adherence (Hunt et al. 2021c). While the estimates of adherence presented here may be upwardly biased, we believe that monitoring changes to stated adherence over time and among different rules and advice are relevant and needed. If anglers report increasing adherence to the rules and advice over time, it suggests that anglers are at a minimum, becoming increasingly aware that the behaviour in question is desirable.
Long-term monitoring of key statistics associated with recreational fishing in Ontario depends on the comparability of estimates over time. Nevertheless, when confronted with decreasing response rates, high levels of item non-response, and highly complex and lengthy surveys, it is incumbent for researchers to review and where necessary revise the survey design and questionnaires. Given the very poor response rate for the 2015 survey, we modified the survey design and re-evaluated questions and questionnaires for the 2020 survey. With a focus on maintaining comparability of estimates over time, we revised the survey design (such as three contacts and personalization), reduced costs to deliver the survey (such as reducing content and presenting questions in two versions, ensuring that mail packages would not require additional postage), and reduced the cognitive burden for the angler (such as reviewed the survey and questions with focus groups of anglers). These revisions likely explain the marked improvement to the response rate (47% in 2020 compared to 18% and 35% in 2015 and 2010, respectively, for all sampled anglers). We also saw that in 2020 about 75% of all survey responses were provided online. While our survey revisions made the comparability of some estimates such as expenditures more challenging, we believe they enhance the validity of the survey estimates for 2020.
For the 2025 survey, further revisions to the design and questions could be considered. At minimum, efforts should be spent to achieve high levels of response without incurring high levels of printing and postage costs. We also recommend reviewing three long-standing practices with the survey. First, the expenditure questions should be reviewed to assess the current focus on reporting household rather than individual expenditures and to reconsider the expenditure categories included. It might be desirable to revise the future survey such that it is comparable with surveys of hunters in Ontario. A need also exists to ensure consistency in the ways that online and print respondents report their expenditures. Second, a more direct satisfaction question could be asked to anglers. In 2015, a set of traditional satisfaction questions along with the overall evaluation question was asked (OMNRF 2020a) and these traditional satisfaction questions are comparable with those from ministry hunting surveys. The current experience rating question adopts an asymmetric scale, which likely results in an inflated perspective about the benefits that anglers obtain from fishing. Finally, reconsidering the ability of respondents to recall specific details of their fishing trips over the course of an entire year is warranted. Combined with the increased number of responses provided online, the design of future surveys should consider using proxies for measures such as number of fish caught and harvested rather than asking anglers for exact numbers, which are likely to be significantly upwardly biased (Hogg et al. 2010).
Conclusions
We estimated a net loss to fishing activity, days fished, fish caught, fish harvested and expenditures in 2020 relative to 2015. However, these average effects blur the nuanced changes among angler populations. While the numbers of active anglers and fishing activity declined among non-resident and Ontario senior anglers, activity increased for Ontario resident and younger anglers. It is likely that these differences between recreational fishing in Ontario between 2015 and 2020 were influenced by the onset of the COVID‑19 pandemic.
Fishing activity, other behaviours, and preferences were influenced by the type of angler and the context they faced. While anglers most preferred and targeted walleye, these preferences and targeting rates were most evident for northwest Ontario anglers and anglers holding a sport fishing licence. These 2 groups of anglers were also more likely to have used live baitfish, consumed sport fish, been more satisfied and spent more days fishing per angler in 2020 than other anglers. These differences confirm that anglers are a diverse community and accounting for this diversity is important for effectively managing the behaviours, impacts, and benefits from recreational fishing.
We also examined anglers’ stated adherence towards following advice or rules to prevent unwanted impacts to aquatic ecosystems and anglers. While most anglers stated that they adhered to the advice, a sizeable per cent of anglers did not (such as 20% of live baitfish users reporting releasing baitfish into a waterbody). Given the more than one million anglers in Ontario in 2020, even a small rate of anglers not following advice and rules can lead to significant impacts to resources and people.
References
Arlinghaus, R., Ø. Aas, J. Alós, I. Arismendi, S. Bower, S. Carle, T. Czarkowski, K.M.F., Freire, J. Hu, L.M. Hunt, R. Lyach, A. Kapusta, P. Salmi, A. Schwab, J. Tsuboi, M. Trella, D. McPhee, W. Potts, A. Wołos and Z.-J. Yang. 2020. Global participation in and public attitudes toward recreational fishing: International perspectives and developments. Reviews in Fisheries Science & Aquaculture 29: 1–38.
Arlinghaus, R. 2006. On the apparently striking disconnect between motivation and satisfaction in recreational fishing: The case of catch orientation of German anglers. North American Journal of Fisheries Management 26(3): 592–605.
Armstrong, J.S. and T.S. Overton. 1977. Estimating non-response bias in mail surveys. Journal of Marketing Research 14: 396–402.
Birdsong, M., L.M. Hunt and R. Arlinghaus. 2021. Recreational angler satisfaction: What drives it? Fish and Fisheries 22(4): 682–706.
Bossenbroek, J.M., C.E. Kraft and J.C. Nekola. 2001. Prediction of long-distance dispersal using gravity models: Zebra mussel invasion of inland lakes. Ecological Applications 11(6): 1778–1788.
Bryan, H. 1977. Leisure value systems and recreational specialization: The case of trout fishermen. Journal of Leisure Research 9: 174–187.
Canadian Council on Invasive Species. 2022. Clean, drain, dry: Prevent the spread of aquatic invasive species. Canadian Council on Invasive Species, Williams Lake, BC. <https://canadainvasives.ca/programs/clean-drain-dry>. Accessed April 2022.
Collier, J.E. and C.C. Bienstock. 2007. An analysis of how nonresponse error is assessed in academic marketing research. Marketing Theory 7: 163–183.
Cox, E.T. and W.J. Straight. 1975. Ontario angling: facts and figures. Ontario Ministry of Natural Resources, Toronto, ON.
Dillman, D.A. 2000. Mail and internet surveys: The tailored design method. John Wiley & Sons, Toronto, ON. 464p.
Ditton, R.B., D.K. Loomis and S. Choi. 1992. Recreation specialization: Re-conceptualization from a social world's perspective. Journal of Leisure Research 24: 33–51.
Drake, D.A.R. and N.E. Mandrak. 2014. Bycatch, bait, anglers, and roads: quantifying vector activity and propagule introduction risk across lake ecosystems. Ecological Applications 24(4): 877–894.
Dunlop, E.S., D. Goto and D.A. Jackson. 2019. Fishing down then up the food web of an invaded lake. Proceedings of the National Academy of Sciences 116(40): 19995–20001.
Fera, S., T.B. Johnson and S. Arnott. 2014. Ontario’s invading species awareness program: Analysis of provincial boater and angler survey results. Ontario Ministry of Natural Resources, Science and Research Branch, Peterborough ON. Aquatic Research and Monitoring Technical Report 2014-06. 26p.
Fisher, R.J. 1993. Social desirability bias and the validity of indirect questioning. Journal of Consumer Research 20(2): 303.
Gaeta, J.W., A.B. Beardmore, A.W. Latzka, W. Provencher and S.R. Carpenter. 2013. Catch‐and‐release rates of sport fishes in northern Wisconsin from an angler diary survey. North American Journal of Fisheries Management 33(3): 606–614.
Gundelund, C. and C. Skov. 2021. Changes in angler demography and angling patterns during the COVID‑19 lockdown in spring 2020 measured through a citizen science platform. Marine Policy 131: 104602.
Hogg, S.E., N.P. Lester and H. Ball. 2010. The effectiveness of the 2005 recreational fishing survey to deliver spatially explicit estimates of fishing effort and harvest: Analysis for selected Ontario lakes. Ontario Ministry of Natural Resources, Applied Research and Development Branch. Peterborough, ON. 23p. + appendices.
Howarth, A., A.L. Jeanson, A.E.I. Abrams, C. Beaudoin, I. Mistry, A. Berberi, N. Young, V.M. Nguyen, S.J. Landsman, A.N. Kadykalo, A.J. Danylchuk and S.J. Cooke. 2021. COVID‑19 restrictions and recreational fisheries in Ontario, Canada: Preliminary insights from an online angler survey. Fisheries Research 240: 105961.
Hunt, L.M., A.E. Bannister, D.A.R. Drake, S.A. Fera and T.B. Johnson. 2017. Do fish drive recreational fishing license sales? North American Journal of Fisheries Management 37(1): 122–132.
Hunt, L.M., D.J. Phaneuf, J.K. Abbott and E.P. Fenichel. 2021a. Per trip changes to the economic value of Ontario, Canada anglers fishing the Laurentian Great Lakes under target species transitions. Human Dimensions of Wildlife 26(2): 132–147.
Hunt, L.M., D.J. Phaneuf, J.K. Abbott, E.P. Fenichel, J.A. Rodgers, J.D. Buckley, D.A.R. Drake and T.B. Johnson. 2021b. The influence of human population change and aquatic invasive species establishment on future recreational fishing activities to the Canadian portion of the Laurentian Great Lakes. Canadian Journal of Fisheries and Aquatic Sciences 78(3): 232–244.
Hunt, L.M., J.A. Rodgers, C. Godwin, L. Makkinga, C. Mondoux and K.W. Morrison. 2021c. Ontario white-tailed deer hunters in 2019: Perspectives, benefits, characteristics, and hunting styles. Ontario Ministry of Northern Development, Mines, Natural Resources and Forestry, Science and Research Branch, Peterborough, ON. Science and Research Technical Report TR-44. 31p. + appendices.
Lewin, W.C., R. Arlinghaus and T. Mehner. 2006. Documented and potential biological impacts of recreational fishing: Insights for management and conservation. Reviews in Fisheries Science 14(4): 305–367.
McEachran, M.C., A. Hofelich Mohr, T. Lindsay, D.C. Fulton and N.B.D. Phelps. 2022. Patterns of live baitfish use and release among recreational anglers in a regulated landscape. North American Journal of Fisheries Management 42(2): 295–306.
[MECP] Ministry of Environment, Conservation and Parks. 2017. Guide to eating Ontario Fish. Ministry of Environment, Conservation and Parks, Toronto, ON. <https://www.ontario.ca/page/eating-ontario-fish-2017-18>. Accessed April 2022.
Midway, S.R., A.J. Lynch, B.K. Peoples, M. Dance and R. Caffey. 2021. COVID‑19 influences on US recreational angler behavior. PLOS ONE 16(8): e0254652.
[OMNRF] Ontario Ministry of Natural Resources and Forestry. 2014. 2010 Survey of recreational fishing in Canada: Selected results for Ontario fisheries. Ontario Ministry of Natural Resources and Forestry, Biodiversity Branch, Peterborough, ON.
[OMNRF] Ontario Ministry of Natural Resources and Forestry. 2020a. 2015 Survey of recreational fishing in Canada: Selected results for Ontario fisheries. Ontario Ministry of Natural Resources and Forestry, Fish and Wildlife Branch, Peterborough, ON. 47p. + appendices.
[OMNRF] Ontario Ministry of Natural Resources and Forestry. 2020b. 2015 Survey of recreational fishing in Canada: Results for fisheries management zones of Ontario. Ontario Ministry of Natural Resources and Forestry, Fish and Wildlife Policy Branch, Peterborough, ON. 61p.
[OMNRF] Ontario Ministry of Natural Resources and Forestry. 2020c. 2020 fishing Ontario fishing regulations summary. Ontario Ministry of Natural Resources and Forestry, Peterborough, ON. <https://files.ontario.ca/mnrf-fishing-regulations-summary-en-2019-12-13.pdf>. Accessed June 2022.
[OMNDMNRF] Ontario Ministry of Northern Development, Mines, Natural Resources and Forestry. 2022. Ontario’s State of Natural Resources Report 2021. Ontario Ministry of Northern Development, Mines, Natural Resources and Forestry, Peterborough, ON. <https://www.ontario.ca/files/2022-03/ndmnrf-state-of-natural-resources-report-2021-en-2022-03-11.pdf>. Accessed April 2022.
Ontario Regulation 354/16. 2022. Regulating 13 invasive species and watercraft as a carrier of invasive species under the Ontario Invasive Species Act, 2015. <https://ero.ontario.ca/notice/019-3465>. Accessed April 2022.
Scott, D. and C.S. Shafer. 2001. Recreational specialization: A critical look at the construct. Journal of Leisure Research 33: 319–343.
Statistics Canada. 2022. (Table). Census Profile. 2021 Census. Statistics Canada Catalogue no. 98-316-X2021001. Ottawa, ON. Released February 9, 2022. <https://www12.statcan.gc.ca/census-recensement/2021/dp-pd/prof/index.cfm?Lang=E>. Accessed April 2022.
Appendix 1. Glossary
Definitions are provided to clarify usage for select terms in this report.
All sampled anglers consist of Ontario resident, Ontario senior, and other Canadian anglers.
An angler is an individual who participates in recreational fishing regardless of method.
An angling package consists of purchases made for fishing from or through a lodge, outfitter, or their agent that includes services such as lodging, food, transportation, and guiding.
An active angler is a person who fished in Ontario in the year they were surveyed.
The bass, sunfish, and crappie group consist of all fish species from the Centrarchidae family.
The catfish group consists of all fish species from the Ictaluridae family.
Consumables are expenditures on goods and services (such as food, accommodation, licence fees) incurred during the process of fishing in Ontario.
Days fished represents a day, or any part of a day, during which an angler fished in Ontario.
A deemed licence holder is a person who did not purchase a fishing licence, but who is considered licensed given age (under 18 years or over 64 years) or other criteria (such as disability status).
Fish caught equals the total number of fish caught in 2020.
Fisheries management zone is one of 20 areas into which Ontario is divided to support fisheries management.
A household consists of individuals residing in the same dwelling.
Investments are expenditures on gear, equipment, and land that support angling activities. Only the percentage of these investments that are attributable to fishing (wholly attributable) are reported.
The multi species group consists of cases where an angler targeted or preferred fish from multiple groups (such as walleye and yellow perch or smallmouth bass and northern pike).
A non-resident angler is a non-resident of Canada who purchased a fishing licence for Ontario during the survey year.
An other Canadian angler is a Canadian but not Ontario resident who purchased a fishing licence for Ontario during the survey year.
An Ontario resident angler is an Ontario resident who purchased a fishing licence for Ontario during the survey year.
An Ontario senior angler is an Ontario resident who purchased a fishing licence for Ontario in the past but now because of their age (65 to 70 years old) are considered a deemed fishing licence holder.
The pike and muskellunge group consists of all fish species from the Esocidae family.
Recreational fishing is a non-commercial fishing activity. Ceremonial and subsistence fishing are not covered by the survey, and no attempt was made to include these fishing activities in our results.
The trout and salmon group consists of all species of fish from the Salmoninae family except Coregonids.
The walleye and perch group consists of all fish species from the Percidae family.
A younger angler is an individual less than 18 years old who resided with a sampled angler and was identified to have fished in Ontario during the survey year.
Appendix 2. Copy of the 2020 Ontario Recreational Fishing Surveys
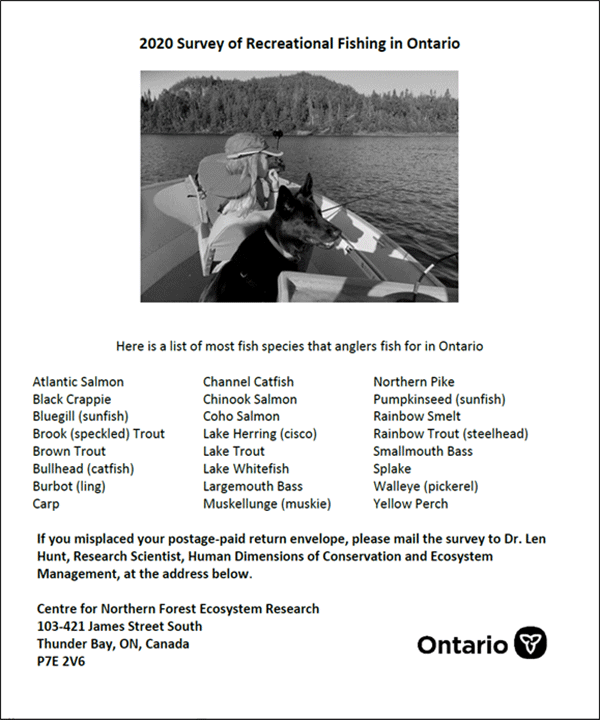
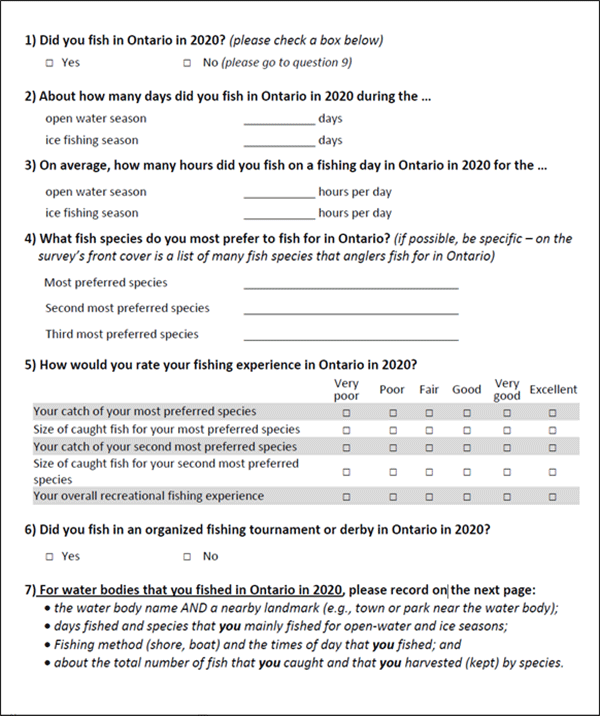
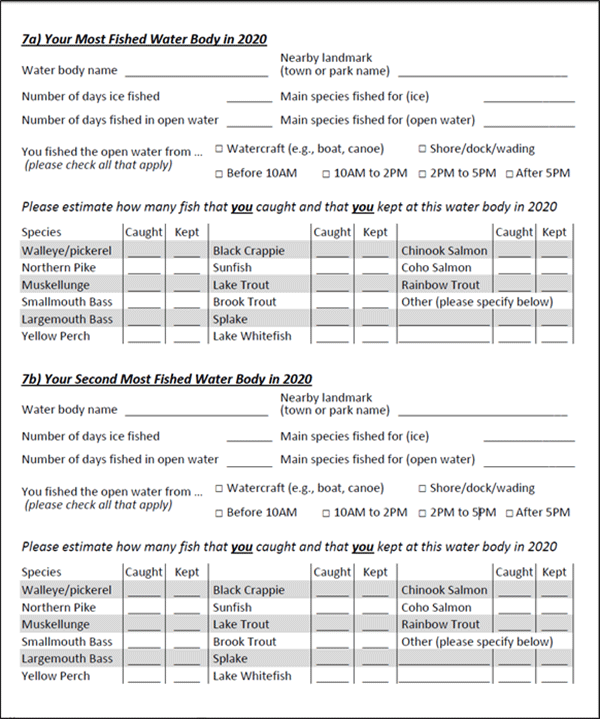
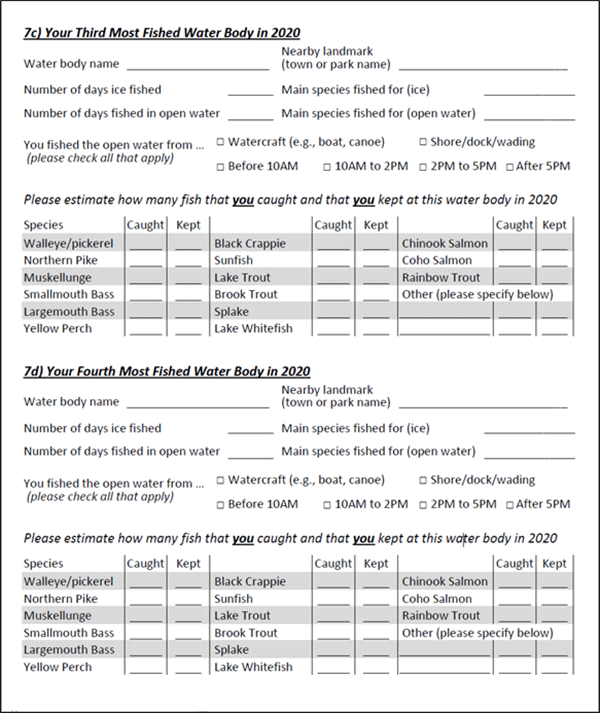
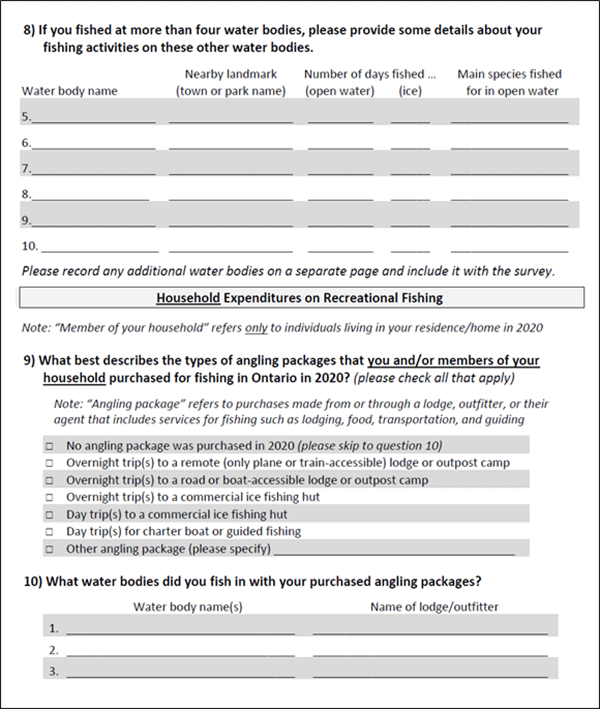
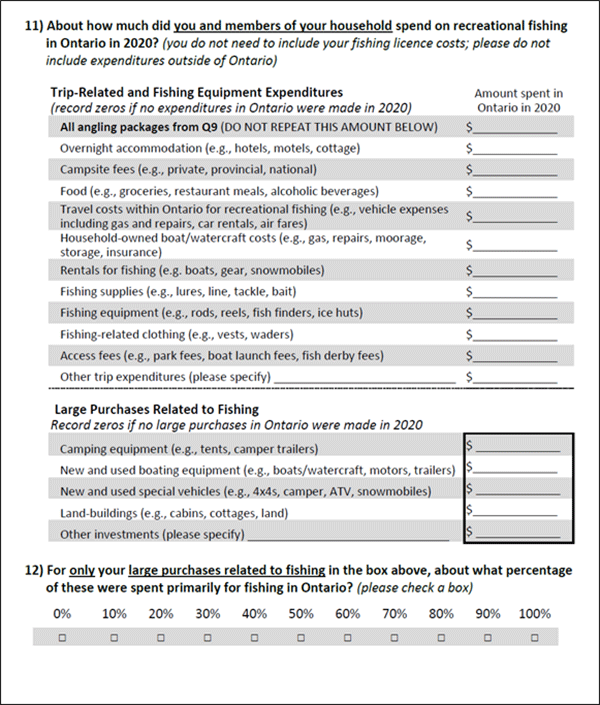
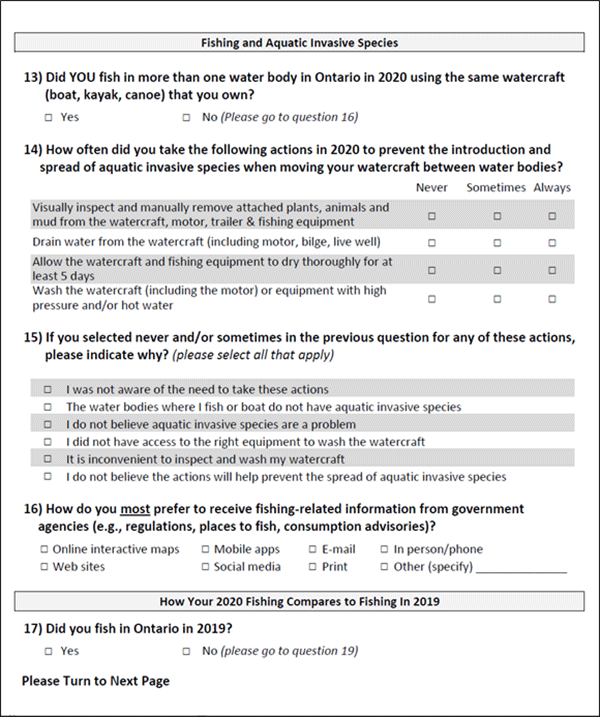
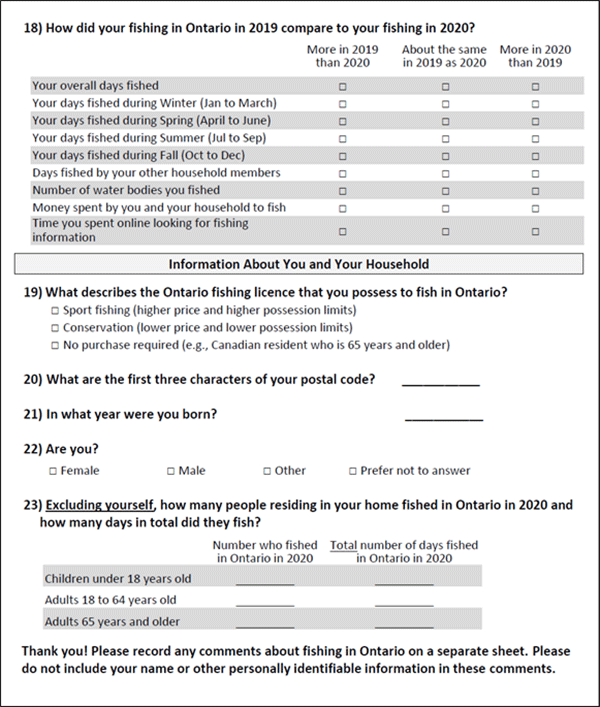
The final two pages of the questionnaire from the second version of the survey with questions that differed from version 1. (Note that question six from version 1 was not asked in version 2.)
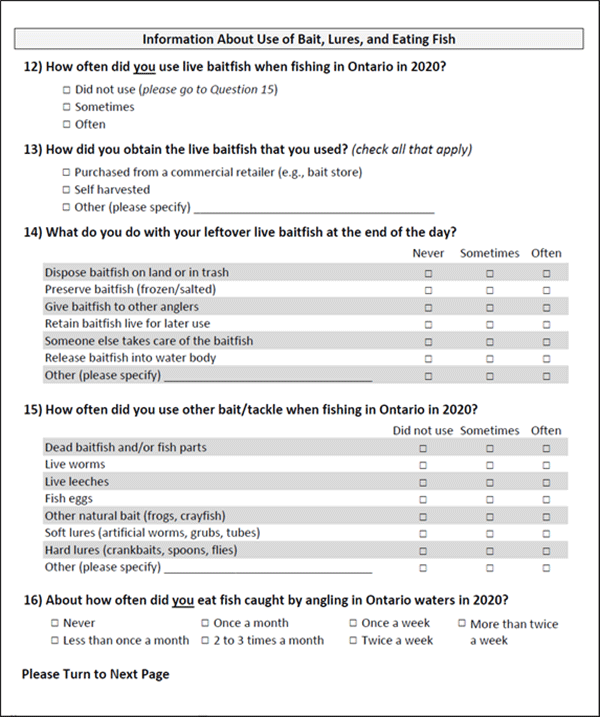
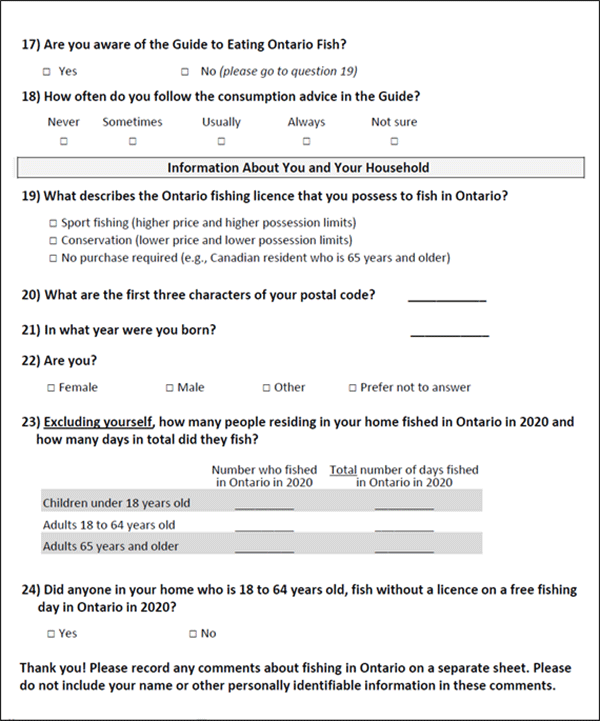
Appendix 3. Detailed results of angler surveys
Table A3.1. Non-response bias tests between early and late responders to the 2020 survey of Ontario anglers
| Variable | Ontario resident | Ontario senior | Other Canadian | All sampled |
|---|---|---|---|---|
| Fished in 2020, early (%) | 79.9 | 56.4 | 87.5 | 78.3 |
| Fished in 2020, late (%) | 75.9 | 52.1 | 95.2 | 74.9 |
| Fished in 2020, Z-value | 4.10 |
1.05 | −2.05 |
3.60 |
| Fished in 2020, Df | 12,893 | 1,147 | 507 | 14,551 |
| Days fished early (average) | 18.1 | 17.1 | 10.8 | 17.8 |
| Days fished late (average) | 18.1 | 17.2 | 10.8 | 17.7 |
| Days fished t-value | 0.07 | −0.04 | −0.02 | 0.13 |
| Days fished | 10,222 | 639 | 450 | 11,315 |
| Expenditures, early (average) | 2,604.52 | 1,384.10 | 3,058.04 | 2,529.10 |
| Expenditures, late (average) | 2,515.73 | 1,348.08 | 2,527.33 | 2,440.24 |
| Expenditures, t-value | 0.28 | 0.07 | 0.45 | 0.31 |
| Expenditures, days fished | 12,462 | 1,027 | 503 | 13,996 |
Table A3.2. Age (%) of respondents to the 2020 survey of Ontario anglers by population. Values are based on unweighted responses.
| Age group | Ontario resident | Ontario senior | Other Canadian | All sampled |
|---|---|---|---|---|
| 18 to 29 years | 12.3 | 0.0 | 10.8 | 11.3 |
| 30 to 39 years | 17.6 | 0.0 | 19.8 | 16.3 |
| 40 to 49 years | 22.3 | 0.0 | 22.0 | 20.5 |
| 50 to 59 years | 27.8 | 0.0 | 27.0 | 25.6 |
| 60 to 69 years | 19.5 | 94.3 | 20.2 | 25.3 |
| 70 or more years | 0.5 | 5.7 | 0.2 | 0.9 |
Table A3.3. Fishing activity estimates in Ontario by population and survey year. (* = 2020 estimates assume averages from 2015 hold for 2020; ** = estimates for younger anglers in 2020 exclude non-residents.)
| Population (2020) | Ontario resident | Ontario senior | Other Canadian | Non-resident | Younger |
|---|---|---|---|---|---|
| Number of anglers | 902,048 | 82,370 | 45,838 | 35,175 | N/A |
| Active anglers | 709,059 | 45,912 | 40,762 | 27,338* | 344,508** |
| Open water anglers | 678,144 | 44,701 | 41,661 | N/A | N/A |
| Ice anglers | 196,590 | 9,336 | 5,715 | N/A | N/A |
| Fishing effort open (days) | 10,466,250 | 704,534 | 392,571 | N/A | N/A |
| Fishing effort ice (days) | 1,688,787 | 80,472 | 33,799 | N/A | N/A |
| Total fishing effort (days) | 12,155,037 | 785,006 | 426,370 | 202,782* | 2,043,649** |
| Fishing effort open (hours) | 43,770,862 | 2,874,961 | 2,133,812 | N/A | N/A |
| Fishing effort ice (hours) | 9,156,743 | 400,123 | 208,044 | N/A | N/A |
| Total fishing effort (hours) | 52,927,605 | 3,275,084 | 2,341,856 | N/A | N/A |
| Population (2015) | Ontario resident | Ontario senior | Other Canadian | Non-resident | Younger |
|---|---|---|---|---|---|
| Number of anglers | 867,683 | 88,913 | 62,071 | 321,684 | N/A |
| Active anglers | 756,371 | 57,114 | 59,057 | 315,489 | 324,253 |
| Open water anglers | 741,931 | 55,939 | 57,302 | 312,326 | N/A |
| Ice anglers | 198,753 | 12,584 | 5,523 | 9,037 | N/A |
| Fishing effort open (days) | 9,975,730 | 806,515 | 374,352 | 1,951,503 | N/A |
| Fishing effort ice (days) | 1,181,122 | 82,563 | 21,485 | 35,975 | N/A |
| Total fishing effort (days) | 11,156,852 | 889,078 | 415,837 | 1,987,478 | 1,615,785 |
| Fishing effort open (hours) | 47,609,879 | 3,592,478 | 2,101,187 | 13,629,569 | N/A |
| Fishing effort ice (hours) | 6,874,202 | 376,511 | 120,894 | 252,115 | N/A |
| Total fishing effort (hours) | 54,484,082 | 3,968,989 | 2,222,081 | 13,881,684 | N/A |
| Population (2010) | Ontario resident | Ontario senior | Other Canadian | Non-resident | Younger |
|---|---|---|---|---|---|
| Number of anglers | 1,051,332 | 63,761 | 31,468 | 313,446 | N/A |
| Active anglers | 877,200 | 56,350 | 29,899 | 308,211 | 370,435 |
| Open water anglers | 846,947 | 45,832 | 28,888 | 304,616 | N/A |
| Ice anglers | 244,805 | 13,965 | 5,396 | 10,110 | N/A |
| Fishing effort open (days) | 11,772,246 | 750,711 | 275,809 | 2,204,915 | N/A |
| Fishing effort ice (days) | 1,673,759 | 117,602 | 27,637 | 46,232 | N/A |
| Total fishing effort (days) | 13,445,005 | 868,313 | 303,446 | 2,251,147 | 2,386,861 |
| Fishing effort open (hours) | N/A | N/A | N/A | N/A | N/A |
| Fishing effort ice (hours) | N/A | N/A | N/A | N/A | N/A |
| Total fishing effort (hours) | N/A | N/A | N/A | N/A | N/A |
Table A3.4. Estimated fishing activity (thousands of days) at most heavily fished waterbodies in Ontario in 2020 by all sampled anglers. (2015 and 2010 estimates include fishing activity by non-resident anglers).
| Waterbody | Open water | Ice | Total | 2015 total | 2010 total |
|---|---|---|---|---|---|
| Lake Huron (includes Georgian Bay) | 815 | 90 | 905 | 602 | 867 |
| Lake Ontario (includes Bay of Quinte) | 691 | 87 | 778 | 631 | 803 |
| Lake Erie | 683 | 34 | 716 | 713 | 809 |
| Lake Simcoe | 316 | 218 | 534 | 483 | 648 |
| Lake Nipissing | 219 | 103 | 322 | 271 | 315 |
| Ottawa River | 258 | 56 | 314 | 267 | 383 |
| Rice Lake | 215 | 17 | 233 | 177 | 333 |
| Lake of the Woods | 192 | 29 | 221 | 381 | 488 |
| Lake St. Clair | 173 | 21 | 194 | 198 | N/A |
| Grand River | 180 | 4 | 183 | 250 | 236 |
| St. Lawrence River | 148 | 11 | 159 | 254 | 201 |
| Pigeon Lake | 140 | 3 | 143 | 105 | 124 |
| Rideau River | 109 | 10 | 119 | 102 | 177 |
| Lake Superior | 92 | 27 | 119 | 66 | 46 |
| Scugog Lake | 96 | 15 | 111 | 97 | 201 |
| Detroit River | 97 | 3 | 100 | 155 | 141 |
| Trent River | 95 | 4 | 99 | 122 | NA |
| Saugeen River | 95 | 4 | 98 | 48 | 66 |
| French River | 78 | 7 | 85 | 116 | 117 |
| St. Clair River | 78 | 5 | 83 | 54 | 73 |
| Thames River | 81 | 1 | 82 | 61 | 98 |
| Big Rideau Lake | 71 | 6 | 77 | 65 | 98 |
| Sturgeon Lake | 69 | 4 | 72 | 63 | 48 |
| Buckhorn Lake | 66 | 1 | 67 | 76 | 67 |
| Niagara River | 63 | 1 | 64 | 52 | 132 |
| Rainy Lake | 48 | 15 | 63 | 91 | 111 |
| Balsam Lake | 60 | 2 | 62 | 67 | 54 |
| Chemong Lake | 54 | 6 | 60 | 44 | 84 |
| Lake Muskoka | 47 | 10 | 57 | 53 | 72 |
| Lake Couchiching | 43 | 12 | 56 | 39 | 25 |
Table A3.5. Fishing activity (%) targeting species in Ontario in 2020 by population and season.
| Species | Ontario resident — open | Ontario resident — ice | Ontario senior — open | Ontario senior — ice | Other Canadian — open | Other Canadian — ice | All sampled — open | All sampled — ice |
|---|---|---|---|---|---|---|---|---|
| Walleye | 32.1 | 40.7 | 42.6 | 23.6 | 56.0 | 50.4 | 33.6 | 40.1 |
| Smallmouth bass | 15.8 | 0.6 | 12.5 | 0.0 | 11.1 | 1.0 | 15.4 | 0.6 |
| Largemouth bass | 11.3 | 0.0 | 6.9 | 0.0 | 3.4 | 0.0 | 10.8 | 0.0 |
| Northern pike | 7.8 | 9.1 | 7.2 | 10.8 | 6.8 | 1.6 | 7.7 | 9.1 |
| Lake trout | 3.6 | 13.1 | 4.8 | 16.2 | 4.1 | 22.4 | 3.7 | 13.4 |
| Bass (any) | 5.7 | 0.1 | 6.7 | 0.0 | 2.3 | 0.0 | 5.6 | 0.1 |
| Yellow perch | 3.1 | 15.4 | 4.6 | 18.7 | 0.0 | 0.8 | 3.1 | 15.3 |
| Rainbow trout | 4.5 | 1.6 | 2.3 | 2.5 | 0.7 | 2.0 | 4.2 | 1.6 |
| Anything | 3.4 | 1.5 | 1.8 | 0.4 | 1.4 | 1.2 | 3.2 | 1.4 |
| Chinook salmon | 3.1 | 0.0 | 1.1 | 0.0 | 2.2 | 0.0 | 3.0 | 0.0 |
| Brook trout | 1.4 | 4.2 | 2.2 | 4.7 | 0.5 | 6.6 | 1.4 | 4.2 |
| Muskellunge | 1.7 | 0.3 | 1.3 | 0.0 | 7.9 | 0.0 | 1.9 | 0.3 |
| Lake whitefish | 0.3 | 8.0 | 1.7 | 10.4 | 0.0 | 2.3 | 0.4 | 8.0 |
| Trout (any) | 1.3 | 0.9 | 1.5 | 4.7 | 0.0 | 0.0 | 1.3 | 1.1 |
| Sunfish |
1.1 | 0.3 | 0.6 | 4.1 | 0.0 | 0.0 | 1.0 | 0.4 |
| Black crappie | 0.7 | 2.2 | 0.5 | 1.2 | 0.3 | 4.1 | 0.7 | 2.2 |
| Coho salmon | 0.5 | 0.0 | 0.1 | 0.0 | 2.7 | 0.0 | 0.5 | 0.0 |
| Splake | 0.2 | 1.5 | 0.1 | 2.8 | 0.1 | 2.3 | 0.2 | 1.5 |
| Catfish | 0.5 | 0.0 | 0.0 | 0.0 | 0.0 | 0.0 | 0.4 | 0.0 |
| Common carp | 0.4 | 0.0 | 0.2 | 0.0 | 0.0 | 0.0 | 0.4 | 0.0 |
| Brown trout | 0.3 | 0.0 | 0.2 | 0.0 | 0.0 | 0.0 | 0.3 | 0.0 |
| Other coldwater | 0.7 | 0.1 | 0.9 | 0.0 | 0.5 | 5.3 | 0.7 | 0.2 |
| Other warmwater | 0.4 | 0.1 | 0.0 | 0.0 | 0.0 | 0.0 | 0.3 | 0.1 |
| Other coolwater | 0.1 | 0.2 | 0.0 | 0.0 | 0.0 | 0.0 | 0.1 | 0.1 |
| Other | 0.1 | 0.1 | 0.0 | 0.0 | 0.1 | 0.0 | 0.1 | 0.1 |
Table A3.6. Use of bait and tackle (%) to fish in Ontario in 2020 by active anglers from different angling populations (some = sometimes; never = 100 − often − some).
| Bait/tackle | All Sampled — Often | All Sampled — Some | Ontario Resident — Often | Ontario Resident — Some | Ontario Senior — Often | Ontario Senior — Some | Other Canadian — Often | Other Canadian — Some |
|---|---|---|---|---|---|---|---|---|
| Hard baits | 46.6 | 31.8 | 47.2 | 31.7 | 41.1 | 33.4 | 43.2 | 33.0 |
| Soft plastics | 34.6 | 40.0 | 35.8 | 40.4 | 26.7 | 35.9 | 23.7 | 36.4 |
| Earthworms | 36.7 | 34.0 | 37.5 | 35.0 | 42.0 | 27.7 | 17.0 | 23.3 |
| Live baitfish | 24.9 | 30.1 | 24.5 | 30.7 | 27.7 | 31.7 | 29.5 | 17.6 |
| Live leeches | 4.3 | 11.4 | 4.0 | 11.2 | 4.0 | 12.0 | 9.1 | 12.9 |
| Dead baitfish | 3.0 | 12.9 | 2.9 | 13.1 | 1.2 | 10.1 | 7.7 | 13.5 |
| Eggs | 1.8 | 5.9 | 1.9 | 6.4 | 1.8 | 4.9 | 0.0 | 0.0 |
| Other natural | 0.8 | 6.1 | 0.8 | 6.3 | 1.5 | 7.1 | 0.4 | 2.3 |
| Other | 0.5 | 0.5 | 0.5 | 0.6 | 0.0 | 0.3 | 0.4 | 0.0 |
Table A3.7. Source of live baitfish (%) in Ontario in 2020 by live baitfish users from different populations. Commercial purchase and self-harvest include cases where respondents also stated other.
| Population | Commercial purchase | Self harvest | Commercial and self harvest | Only other |
|---|---|---|---|---|
| Ontario resident | 79.0 | 8.0 | 12.0 | 1.0 |
| Ontario senior | 81.5 | 7.2 | 10.3 | 1.0 |
| Other Canadian | 89.8 | 1.0 | 2.9 | 6.3 |
| All sampled | 79.6 | 7.6 | 11.5 | 1.3 |
Table A3.8. Ways of handling leftover live bait (%) in Ontario in 2020 by live baitfish users from different populations (some = sometimes; never = 100 − often − some).
| Action | All sampled — Often | All sampled — Some | Ontario resident — Often | Ontario resident — Some | Ontario senior — Often | Ontario senior — Some | Other Canadian — Often | Other Canadian — Some |
|---|---|---|---|---|---|---|---|---|
| Threw away | 22.5 | 21.7 | 22.9 | 22.3 | 24.7 | 16.8 | 11.8 | 16.3 |
| Gave away | 18.8 | 38.8 | 18.9 | 39.3 | 14.1 | 33.0 | 23.2 | 36.5 |
| Retained | 27.9 | 31.5 | 27.6 | 32.7 | 28.3 | 24.6 | 34.7 | 18.5 |
| Preserved | 8.7 | 17.1 | 8.7 | 17.5 | 7.3 | 8.9 | 11.6 | 21.3 |
| Released | 5.8 | 14.7 | 5.9 | 14.4 | 4.2 | 11.5 | 6.2 | 24.6 |
| Other handled it | 7.7 | 17.3 | 7.2 | 18.1 | 7.3 | 9.4 | 18.5 | 13.4 |
Table A3.9. Awareness (%) of Guide to Eating Sport Fish in Ontario in 2020 by population and adherence (%) to the advice in the guide among aware anglers. ‘Not sure’ was excluded from the per cent estimates for ‘always’, ‘usually’, ‘sometimes’ and ‘never’.
| Guide | All sampled | Ontario resident | Ontario senior | Other Canadian |
|---|---|---|---|---|
| Awareness | 56.6 | 57.4 | 69.0 | 28.2 |
| Adherence to advice — always | 44.7 | 44.4 | 40.3 | 55.1 |
| Adherence to advice — usually | 25.2 | 25.3 | 27.7 | 20.2 |
| Adherence to advice — sometimes | 14.3 | 14.6 | 15.5 | 8.1 |
| Adherence to advice — never | 15.8 | 15.7 | 16.5 | 17.0 |
| Adherence to advice — not sure | 9.9 | 10.1 | 8.4 | 7.0 |
Table A3.10. Adherence (%) to principles of “clean, drain, and dry” in Ontario in 2020 by anglers from different populations who fished multiple waterbodies with the same watercraft (some = sometimes; never = 100 − always − some).
| Precaution | All sampled — always | All sampled — some | Ontario resident — always | Ontario resident — some | Ontario senior — always | Ontario senior — some | Other Canadian — always | Other Canadian — some |
|---|---|---|---|---|---|---|---|---|
| Clean | 85.2 | 9.4 | 85.4 | 9.4 | 84.4 | 9.1 | 81.4 | 10.5 |
| Drain | 89.5 | 3.7 | 90.5 | 2.9 | 80.5 | 9.1 | 74.6 | 17.3 |
| Dry | 68.8 | 23.3 | 69.0 | 23.7 | 67.5 | 16.9 | 64.7 | 26.7 |
| Wash | 43.0 | 30.3 | 44.4 | 30.8 | 24.7 | 27.3 | 41.6 | 23.0 |
Table A3.11. Reported change (%) in fishing activity and other behaviours in Ontario by anglers actively fishing in 2019 and 2020 from different populations. (Less = less in 2020 than 2019; More = more in 2020 than 2019; about the same = 100 − less – more.)
| Fishing activity or other | All sampled — less | All sampled — more | Ontario resident — less | Ontario resident — more | Ontario senior — less | Ontario senior — more | Other Canadian — less | Other Canadian — more |
|---|---|---|---|---|---|---|---|---|
| All days | 36.6 | 14.4 | 37.0 | 14.9 | 36.5 | 9.1 | 28.5 | 13.0 |
| Winter days | 19.9 | 8.1 | 20.7 | 8.3 | 13.3 | 6.0 | 11.0 | 5.5 |
| Spring days | 29.0 | 10.6 | 29.0 | 10.9 | 31.4 | 6.4 | 22.5 | 11.1 |
| Summer days | 33.4 | 15.9 | 33.6 | 16.4 | 33.9 | 9.7 | 28.3 | 14.5 |
| Fall days | 23.4 | 11.1 | 23.5 | 11.6 | 24.7 | 6.7 | 18.0 | 6.9 |
| Days by others in household | 23.6 | 12.5 | 23.9 | 12.8 | 21.0 | 8.0 | 20.7 | 12.5 |
| Money spent | 25.9 | 18.4 | 26.4 | 19.1 | 24.6 | 13.8 | 18.7 | 10.9 |
| Information | 14.4 | 14.5 | 14.5 | 15.2 | 13.3 | 8.7 | 15.4 | 8.5 |
| Waterbodies | 24.1 | 9.9 | 25.0 | 10.2 | 18.3 | 7.6 | 12.2 | 6.1 |
Table A3.12. Reported most preferred fish species (%) in Ontario in 2020 by active anglers from different populations. When multiple species were listed by a respondent, the first species recorded was selected for this table.
| Fish group | Ontario resident | Ontario senior | Other Canadian | All sampled |
|---|---|---|---|---|
| Walleye | 38.5 | 47.9 | 53.0 | 39.8 |
| Smallmouth bass | 13.7 | 11.6 | 7.3 | 13.2 |
| Largemouth bass | 13.5 | 9.2 | 3.4 | 12.7 |
| Northern pike | 5.6 | 5.1 | 3.0 | 5.4 |
| Lake trout | 4.0 | 2.9 | 4.3 | 4.0 |
| Yellow perch | 3.9 | 4.9 | 0.4 | 3.8 |
| Anything/not sure | 3.9 | 1.1 | 1.9 | 3.6 |
| Rainbow trout | 3.6 | 2.9 | 0.9 | 3.4 |
| Bass (unspecified) | 2.8 | 3.8 | 0.9 | 2.8 |
| Brook trout | 2.6 | 4.0 | 1.2 | 2.6 |
| Chinook salmon | 1.8 | 0.6 | 8.1 | 2.1 |
| Muskellunge | 1.1 | 1.0 | 3.5 | 1.2 |
| Coho salmon | 0.5 | 0.2 | 9.7 | 1.0 |
| Black crappie | 0.7 | 1.1 | 0.2 | 0.7 |
| Sunfish | 0.8 | 0.0 | 0.0 | 0.7 |
| Other | 2.4 | 3.0 | 2.0 | 2.4 |
Table A3.13. Reported second most preferred fish species (%) in Ontario in 2020 by active anglers from different populations. When multiple species were listed by a respondent, the first species recorded was selected for this table.
| Fish group | Ontario resident | Ontario senior | Other Canadian | All sampled |
|---|---|---|---|---|
| Smallmouth bass | 17.4 | 19.4 | 14.6 | 17.3 |
| Walleye | 14.3 | 16.6 | 12.1 | 14.3 |
| Northern pike | 14.0 | 11.2 | 19.6 | 14.1 |
| Largemouth bass | 13.1 | 10.7 | 4.4 | 12.5 |
| Yellow perch | 9.6 | 11.0 | 3.7 | 9.4 |
| Lake trout | 7.0 | 6.1 | 8.3 | 7.0 |
| Rainbow trout | 4.6 | 2.9 | 12.3 | 4.9 |
| Anything/not sure | 3.7 | 1.7 | 3.1 | 3.6 |
| Brook trout | 2.9 | 3.6 | 1.6 | 2.9 |
| Bass (unspecified) | 2.7 | 4.8 | 1.6 | 2.7 |
| Chinook salmon | 1.7 | 1.2 | 3.0 | 1.7 |
| Black crappie | 1.6 | 2.5 | 2.2 | 1.7 |
| Muskellunge | 1.5 | 0.8 | 4.8 | 1.7 |
| Sunfish | 1.0 | 0.8 | 0.2 | 1.0 |
| Coho salmon | 0.7 | 0.8 | 4.2 | 0.9 |
| Other | 3.1 | 5.4 | 4.1 | 3.3 |
Table A3.14. Reported third most preferred fish species (%) in Ontario in 2020 by active anglers from different populations. When multiple species were listed by a respondent, the first species recorded was selected for this table.
| Fish group | Ontario resident | Ontario senior | Other Canadian | All sampled |
|---|---|---|---|---|
| Northern pike | 16.2 | 14.5 | 22.5 | 16.4 |
| Smallmouth bass | 11.6 | 12.6 | 10.3 | 11.6 |
| Walleye | 11.7 | 11.0 | 4.9 | 11.3 |
| Yellow perch | 9.4 | 10.9 | 5.6 | 9.3 |
| Largemouth bass | 8.8 | 9.1 | 6.3 | 8.7 |
| Anything/not sure | 8.8 | 4.7 | 10.4 | 8.7 |
| Lake trout | 6.7 | 7.0 | 7.4 | 6.8 |
| Rainbow trout | 5.0 | 4.7 | 8.1 | 5.1 |
| Muskellunge | 3.2 | 3.3 | 6.9 | 3.4 |
| Brook trout | 3.2 | 4.1 | 1.9 | 3.2 |
| Black crappie | 2.6 | 3.9 | 1.1 | 2.6 |
| Bass (unspecified) | 2.4 | 4.8 | 2.2 | 2.5 |
| Chinook salmon | 1.8 | 1.7 | 5.6 | 2.0 |
| Sunfish | 2.0 | 0.8 | 0.3 | 1.8 |
| Lake whitefish | 1.6 | 1.4 | 1.1 | 1.6 |
| Other | 4.1 | 5.4 | 2.4 | 4.1 |
Table A3.15. Evaluations (%) of angling in Ontario in 2020 by active anglers from different populations.
| Angler group overall experience | Excellent | Very good | Good | Fair | Poor | Very poor |
|---|---|---|---|---|---|---|
| All sampled | 15.5 | 24.0 | 33.0 | 16.6 | 6.6 | 4.3 |
| Ontario resident | 15.2 | 23.7 | 33.2 | 17.0 | 6.7 | 4.2 |
| Ontario senior | 11.0 | 21.6 | 33.7 | 17.2 | 10.2 | 6.3 |
| Other Canadian | 25.4 | 32.6 | 28.4 | 9.3 | 2.0 | 2.3 |
| Catch rate for most preferred species | Excellent | Very good | Good | Fair | Poor | Very poor |
|---|---|---|---|---|---|---|
| All sampled | 6.8 | 14.1 | 27.5 | 23.9 | 15.9 | 11.9 |
| Ontario resident | 6.3 | 14.0 | 27.4 | 24.2 | 16.1 | 11.9 |
| Ontario senior | 3.3 | 11.4 | 25.5 | 25.7 | 19.2 | 14.9 |
| Other Canadian | 18.1 | 18.6 | 29.9 | 16.2 | 9.0 | 8.3 |
| Size of most preferred fish species caught | Excellent | Very good | Good | Fair | Poor | Very poor |
|---|---|---|---|---|---|---|
| All sampled | 4.0 | 11.3 | 30.1 | 29.6 | 14.0 | 11.1 |
| Ontario resident | 3.7 | 10.9 | 30.0 | 29.9 | 14.2 | 11.2 |
| Ontario senior | 2.4 | 10.0 | 27.2 | 31.9 | 16.3 | 12.1 |
| Other Canadian | 10.5 | 19.1 | 33.9 | 22.3 | 6.5 | 7.6 |
| Catch rate for second most preferred species | Excellent | Very good | Good | Fair | Poor | Very poor |
|---|---|---|---|---|---|---|
| All sampled | 4.0 | 11.2 | 27.4 | 26.9 | 16.5 | 14.0 |
| Ontario resident | 3.7 | 11.2 | 27.5 | 27.2 | 16.6 | 13.9 |
| Ontario senior | 2.2 | 8.3 | 22.1 | 28.4 | 20.7 | 18.3 |
| Other Canadian | 10.1 | 15.3 | 31.5 | 20.2 | 11.3 | 11.5 |
| Size of second most preferred fish species caught | Excellent | Very good | Good | Fair | Poor | Very poor |
|---|---|---|---|---|---|---|
| All sampled | 3.5 | 10.3 | 28.4 | 28.3 | 15.7 | 13.7 |
| Ontario resident | 3.3 | 10.2 | 28.4 | 28.5 | 15.9 | 13.6 |
| Ontario senior | 1.6 | 8.5 | 23.2 | 31.4 | 17.5 | 17.9 |
| Other Canadian | 9.4 | 15.0 | 34.2 | 21.4 | 9.1 | 10.9 |
Table A3.16. Angler expenditures (in thousands CAD) on consumables including angling packages in Ontario in 2020 by population.
| Expenditure item | All sampled | Ontario resident | Ontario senior | Other Canadian |
|---|---|---|---|---|
| Angling packages | 59,508 | 51,919 | 3,055 | 4,534 |
| Accommodation | 61,208 | 51,863 | 4,289 | 5,057 |
| Campsite fees | 40,171 | 33,454 | 4,822 | 1,896 |
| Food | 98,780 | 86,520 | 5,890 | 6,369 |
| Travel costs | 114,312 | 102,144 | 6,591 | 5,577 |
| Watercraft costs | 160,690 | 143,049 | 11,672 | 5,969 |
| Fishing rentals | 11,667 | 9,861 | 737 | 1,069 |
| Fishing supplies | 71,490 | 65,616 | 3,681 | 2,194 |
| Fishing clothing | 26,374 | 24,314 | 1,211 | 849 |
| Access fees | 18,401 | 16,567 | 1,136 | 698 |
| Other | 1,780 | 1,392 | 200 | 188 |
| Fishing licences | 25,727 | 23,992 | 0 | 1,734 |
| Total | 690,108 | 610,692 | 43,282 | 36,135 |
Table A3.17. Angler expenditures (in thousands CAD) on investments wholly attributable to angling in Ontario in 2020 by population.
| Expenditure item | All sampled | Ontario resident | Ontario senior | Other Canadian |
|---|---|---|---|---|
| Fishing equipment | 118,603 | 110,531 | 4,943 | 3,129 |
| Camping equipment | 81,342 | 75,746 | 3,627 | 1,969 |
| Boating equipment | 380,342 | 333,732 | 22,150 | 24,460 |
| Special vehicles | 176,127 | 164,383 | 9,721 | 2,023 |
| Land-buildings | 252,558 | 213,239 | 19,844 | 19,474 |
| Other | 1,553 | 1,394 | 76 | 83 |
| Total | 1,010,612 | 899,113 | 60,361 | 51,137 |
Appendix 4. Reliability of angler survey estimates
Table A4.1. Relative standard errors (%) for key statistics in Ontario in 2020 by population.
| Statistic | All sampled | Ontario resident | Ontario senior | Other Canadian |
|---|---|---|---|---|
| Days fished open water | 1.3 | 1.4 | 5.2 | 7.0 |
| Days fished ice season | 2.7 | 2.7 | 14.7 | 15.7 |
| Days fished total | 1.3 | 1.3 | 5.2 | 6.8 |
| Hours fished open water | 0.5 | 0.6 | 2.3 | 2.3 |
| Hours fished ice season | 1.1 | 1.2 | 4.3 | 4.6 |
Table A4.2. Relative standard errors (%) for angler expenditures on consumables in Ontario in 2020 by population.
| Expenditure item | All sampled | Ontario resident | Ontario senior | Other Canadian |
|---|---|---|---|---|
| Angling packages | 5.2 | 5.6 | 25.0 | 17.8 |
| Accommodation | 4.0 | 4.0 | 18.4 | 16.0 |
| Campsite fees | 5.1 | 5.3 | 19.8 | 24.0 |
| Food | 2.3 | 2.4 | 10.8 | 10.6 |
| Travel costs | 2.4 | 2.5 | 11.2 | 12.0 |
| Watercraft costs | 3.5 | 3.7 | 12.3 | 17.4 |
| Fishing rentals | 6.9 | 7.2 | 24.6 | 31.6 |
| Fishing supplies | 2.8 | 2.9 | 8.7 | 11.9 |
| Fishing clothing | 3.5 | 3.6 | 17.9 | 18.3 |
| Access fees | 5.2 | 5.5 | 23.3 | 21.0 |
| Other | 32.8 | 37.7 | 77.8 | 82.9 |
| Total | 1.9 | 2.0 | 8.3 | 8.9 |
Table A4.3. Relative standard errors (%) for angler expenditures on investments wholly attributable to fishing in Ontario in 2020 by population.
| Expenditure item | All sampled | Ontario resident | Ontario senior | Other Canadian |
|---|---|---|---|---|
| Fishing equipment | 14.7 | 15.7 | 13.3 | 20.4 |
| Camping equipment | 10.2 | 10.6 | 49.0 | 58.4 |
| Boating equipment | 6.3 | 6.4 | 21.3 | 27.5 |
| Special vehicles | 6.4 | 6.6 | 29.5 | 53.4 |
| Land-buildings | 17.7 | 19.6 | 61.6 | 50.8 |
| Other | 38.2 | 43.9 | 77.3 | 85.2 |
| Total | 6.2 | 6.5 | 26.5 | 26.7 |
Table A4.4. Relative standard errors (%) for catch and harvest in Ontario in 2020 by population. Estimates are based on waterbody specific reports and not individuals; * = no reported catch or harvest.
| Statistic | All sampled | Ontario resident | Ontario senior | Other Canadian |
|---|---|---|---|---|
| All catch | 2.4 | 2.6 | 11.5 | 10.1 |
| All harvest | 3.3 | 3.6 | 8.5 | 9.0 |
| Walleye catch | 5.0 | 5.6 | 15.0 | 13.6 |
| Walleye harvest | 3.1 | 3.4 | 10.5 | 10.7 |
| Yellow perch catch | 5.3 | 5.5 | 23.5 | 24.3 |
| Yellow perch harvest | 8.3 | 8.8 | 19.6 | 43.9 |
| Smallmouth bass catch | 3.3 | 3.5 | 10.7 | 14.3 |
| Smallmouth bass harvest | 4.5 | 4.9 | 12.5 | 29.8 |
| Sunfish catch | 4.4 | 4.3 | 27.7 | 31.8 |
| Sunfish harvest | 13.2 | 13.6 | 47.4 | * |
| Northern pike catch | 3.3 | 3.5 | 12.6 | 12.7 |
| Northern pike harvest | 4.7 | 4.8 | 21.6 | 28.2 |
| Largemouth bass catch | 4.2 | 4.4 | 12.5 | 30.0 |
| Largemouth bass harvest | 4.8 | 5.1 | 16.0 | 56.2 |
| Black crappie catch | 9.1 | 9.5 | 38.4 | 44.2 |
| Black crappie harvest | 10.1 | 10.6 | 43.2 | 57.9 |
| Other catch | 2.3 | 2.4 | 9.3 | 6.3 |
| Other harvest | 5.6 | 6.1 | 11.8 | 11.2 |
| Lake trout catch | 1.7 | 1.7 | 11.4 | 12.3 |
| Lake trout harvest | 2.5 | 2.7 | 4.6 | 17.2 |
| Rainbow trout catch | 10.0 | 10.6 | 25.4 | 23.7 |
| Rainbow trout harvest | 7.0 | 7.4 | 35.9 | 23.6 |
| Brook trout catch | 12.6 | 13.4 | 22.1 | 65.2 |
| Brook trout harvest | 10.0 | 10.8 | 27.3 | 53.4 |
| Lake whitefish catch | 24.3 | 25.9 | 45.2 | 63.8 |
| Lake whitefish harvest | 16.1 | 17.2 | 42.8 | 50.1 |
| Chinook salmon catch | 10.0 | 10.7 | 35.2 | 34.0 |
| Chinook salmon harvest | 9.4 | 9.8 | 31.3 | 31.9 |
| Muskellunge catch | 10.9 | 11.6 | 36.0 | 45.5 |
| Muskellunge harvest | 36.1 | 31.8 | 87.8 | * |
| Coho salmon catch | 9.5 | 10.6 | 49.7 | 20.4 |
| Coho salmon harvest | 10.3 | 11.9 | 59.5 | 20.9 |
| Splake catch | 14.4 | 15.3 | 42.5 | 54.0 |
| Splake harvest | 14.4 | 15.6 | 48.8 | 45.2 |
Footnotes
- footnote[1] Back to paragraph Numbers were estimated using rates of each type of licence holder purchasing multiple fishing licences for 2020.
- footnote[2] Back to paragraph Letters following Ontario regions indicate first letter of license holder’s household postal code.
- footnote[3] Back to paragraph No information was available to estimate numbers of different licence holders.
- footnote[4] Back to paragraph sunfish include sunfish and bluegill
- footnote[5] Back to paragraph cannot separate from consumables and is reported as consumables here.
- footnote[6] Back to paragraph statistically significant difference between early and late responders at P<0.05.