Forest resources of Ontario 2021
Learn more about Ontario forests and forest resources. Find statistics describing the area of land and water, forest types and the distribution of tree species across Ontario summarized in tables, charts and maps.
Ontario’s forests
This report, The Forest Resources of Ontario
(FRO), summarizes the area of land and water, forest types, and the distribution of tree species across Ontario in tables, charts and colour maps.
FRO has been produced since the 1920s with each version building on the previous by considering user feedback and improvements in information. This version continues to respond to the questions received about Ontario's forests.
Canada occupies over 998 million hectares of the earth's surface and includes 347 million hectares of forests. This represents about 9% of the world's forests.
Ontario has 70.5 million hectares of forest which is 4.8 hectares of forest for every Ontarian. This represents about 2% of the world's forests and 20% of Canada's forests.
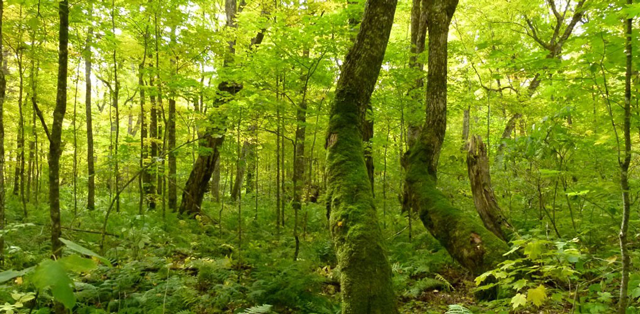
What is a forest?
A forest is A dense growth of trees and underbrush covering a large tract
according to Webster's online dictionary. Forests can range from a small plot of trees in an urban park to large uninhabited tracts of trees. Forests are a complex community of living things including mosses, plants, shrubs, trees and wildlife.
The United Nations Food and Agriculture Organization defines forest as land more than a half hectare with 10% tree canopy and able to reach five metres in height at maturity.
A forest that has been harvested is still a forest. Under Ontario's forest policy framework, Crown forests that are harvested must be regrown. There is no change in land use. Harvested areas are seeded, planted or regenerated naturally back to a forested state.
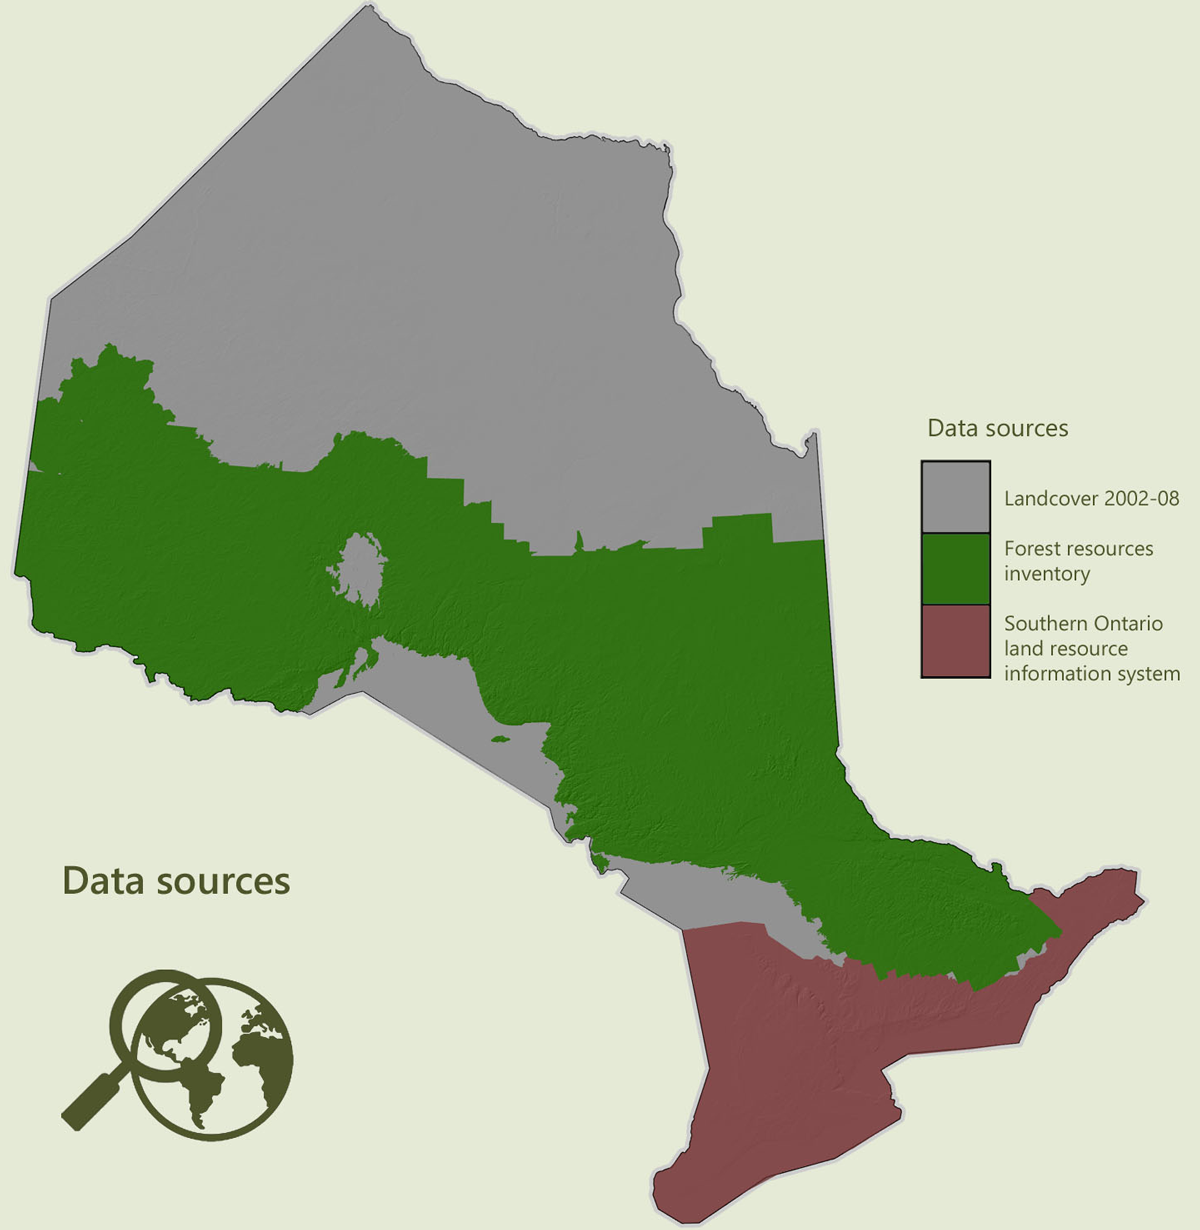
Data sources
The accuracy of FRO 2021 has been enhanced using spatial data that is continually compiled and refined across the Ontario Public Service. Ministry of Natural Resources (MNR) staff and forest industry partners contribute by providing forest resource and management information. Land Information Ontario (LIO) provides current provincial data layers.
There are three main data sources for this report:
- satellite imagery for the province's broad land classes (2008 and 2015)
- forest resources inventories for management units and the large parks in the central part of the province (2018-2020)
- detailed geospatial layers for administrative boundaries and other details of the province, such as ownership, parks classifications, ecozones
It is important to note that many of the data sources used to compile this report originated from varying scales, accuracies and vintages. Class or data definitions between data sources also varied, and not all data elements line up. These issues were addressed while compiling the data to minimize error.
Satellite imagery
The Forest Resources of Ontario 2001 was the first report in the series to use satellite data that allowed for a complete breakdown of all the land and water in the province. Although more detail is available in classified imagery, land classes have been simplified to allow for more reliability and easier tracking. The satellite data used in this report are:
- landcover - Landsat imagery and updates compiled by the ministry between 2002 and 2008
- Southern Ontario Land Resource Information System (SOLRIS) – updated by the ministry in 2016
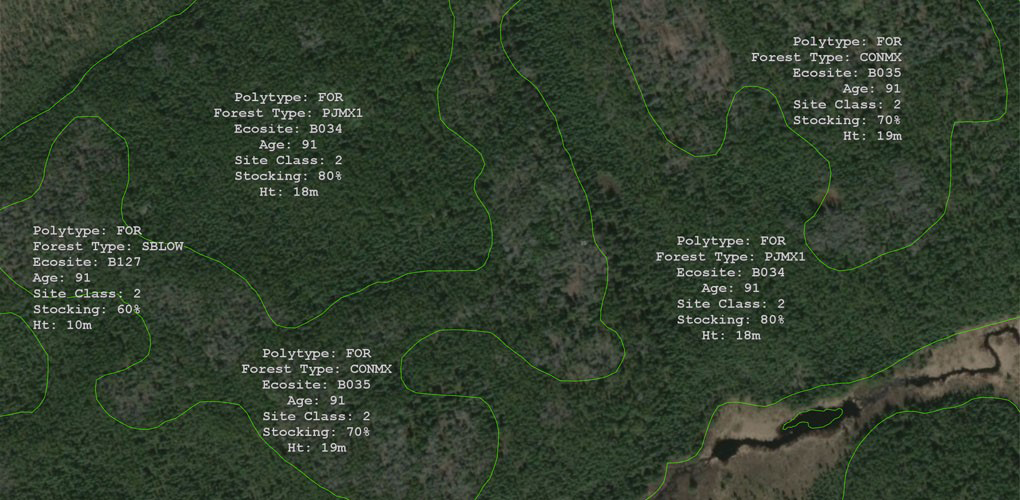
Forest inventories
Ontario monitors the area, type and age of the forest using Forest Resources Inventory (FRI) within the province's Managed Forest Zone (see section on administrative zones). The Forest Resources of Ontario report series uses the FRI to summarize provincial statistics on forest cover as well as land and water classes.
The forest inventories used in this report are:
- FRI for each management unit sourced from the most current forest management plans (plan years span from 2018 to 2021); and updated for harvest, fire and insect damage, as well as silviculture activities and renewal surveys up to 2019-20
FRI for the large parks found around the extent of the Managed Forest Zone conducted from 2010 to 2015 (not exactly the same as management unit inventories however the base values are the same).
Generating summaries for the Forest Resources series prior to the 1990s was a significant undertaking using paper maps and ledgers. Geographic information systems are now used to create digital inventories with detailed spatial information and to analyze Ontario's forests.
Methods
Comparison to past reports: evolving methods vs. forest changes
For the purposes of this report, Ontario's total area is 107,646,859 hectares, which is slightly higher than reported in 2016.
As the methods for measuring our landbase and forest improve, this sometimes affects the areas reported in the FRO series. Ontario has not increased in size, the improved technology and geographic information systems used to produce the report have simply provided a more accurate measure.
Newer forest inventories use higher quality digital imagery and improved methods for defining canopy structure resulting in some species, age and height shifts that are based on methodology not actual forest changes.
To help with comparison to past reports, historical comparisons are provided in each data visualization.
Projections and units
Due to curvature of the Earth, maps distort the Earth's surface. The larger the area represented by a map, the greater the distortion can be. Ontario covers a very large area and is over 1,500 kilometres north to south and east to west. The spatial data used in this report was moved to the Lambert Conformal Conic Projection (NAD83) for consistency. The standard units of measure are hectares (ha) for area and cubic metres (m3) for growing stock or wood volume.
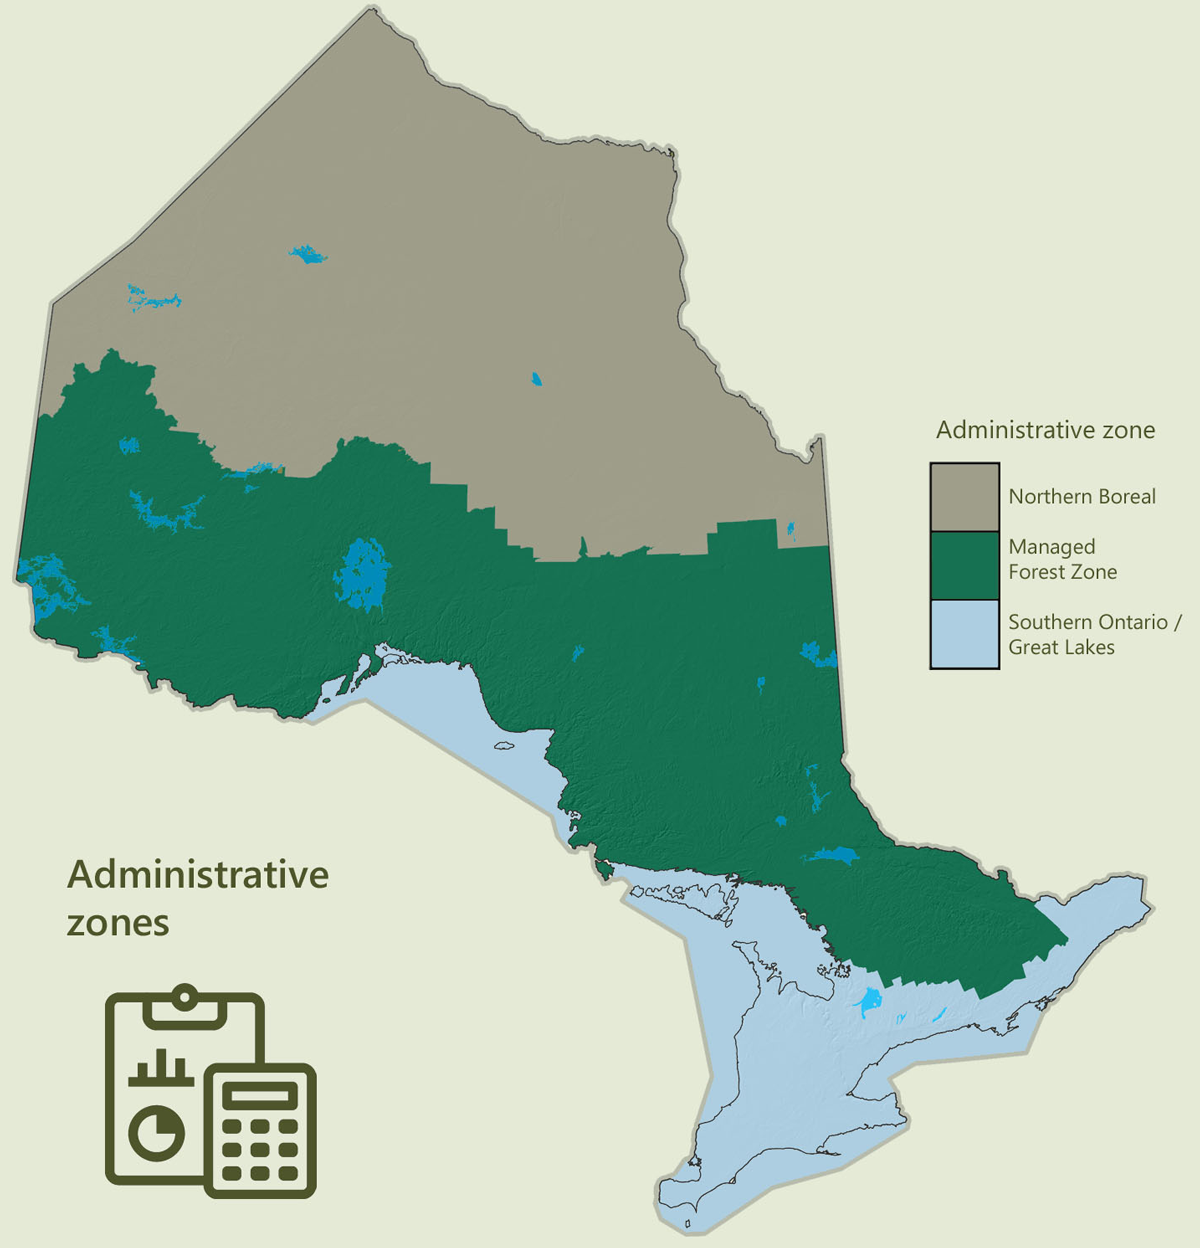
Administrative zones
For the purposes of this report, we subdivide the province into three broad administrative zones. How forests are managed within each zone differs as does the availability and resolution of landbase and forest data.
- Northern Boreal – all area north of the Managed Forest Zone (mostly Crown land and low productivity forests to tundra)
- Managed forest Zone – all area within the central portion of the province (Crown forests are sustainably managed within this zone)
- Southern Ontario / Great Lakes – all area south of the Managed Forest Zone including southern Ontario and the islands and water of the great lakes (little Crown forest but contains privately managed forest, dominated by agriculture and urban area)
The Managed Forest Zone (MFZ) is similar to the Area of the Undertaking (AOU) referenced in previous versions of this report. The MFZ aligns with the landscape guide regions referenced in Ontario's Forest Management Guides for Boreal and Great Lakes – St. Lawrence Landscapes. The Managed Forest Zone (MFZ) consists of designated management units and adjacent large protected areas including Woodland Caribou, Quetico, Wabakimi and Lake Superior Provincial Parks and Pukaskwa National Park.
In the MFZ, within each management unit, Crown forests are sustainably managed by the province under Ontario's forest policy framework. All components of the MFZ have a detailed forest inventory that allows for a much more detailed summary of their forests.
It should be noted that management of these forests for forestry does not occur in the parks listed with the exception of the utilization zone of Algonquin Park Forest, nor any parks or protected areas within designated management units.
Classifying lands and forests
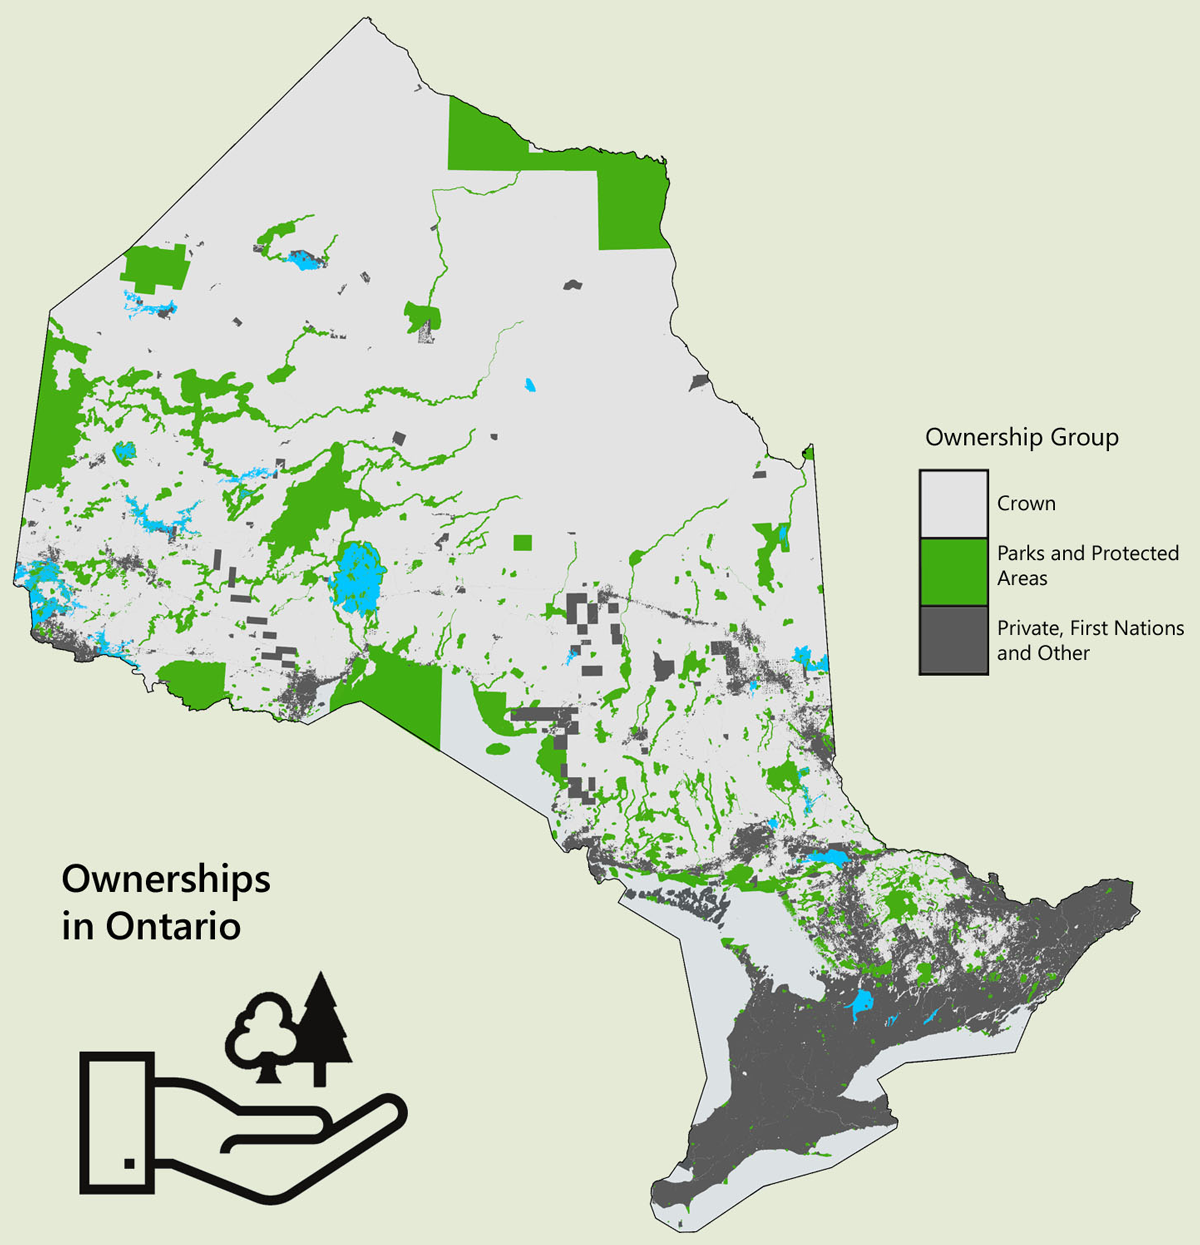
Ownership classes
The data for land ownership is complex. Multiple ownership values for an area are sometimes encountered as a result of conflicting sources, pending changes in ownership, or pending changes to the official designation of parks and protected areas. This report attempts to present the most current and accurate information on ownership.
The ownership classes used in this report are:
- Crown: public owned lands and waters
- parks and protected areas: forest/land within all proposed and existing provincial and federal parks, recreation reserves and conservation reserves. The utilization zone of Algonquin Park Forest is excluded (it is classed as Crown)
- other: Patent or privately-owned land, First Nation reserves and federally owned lands
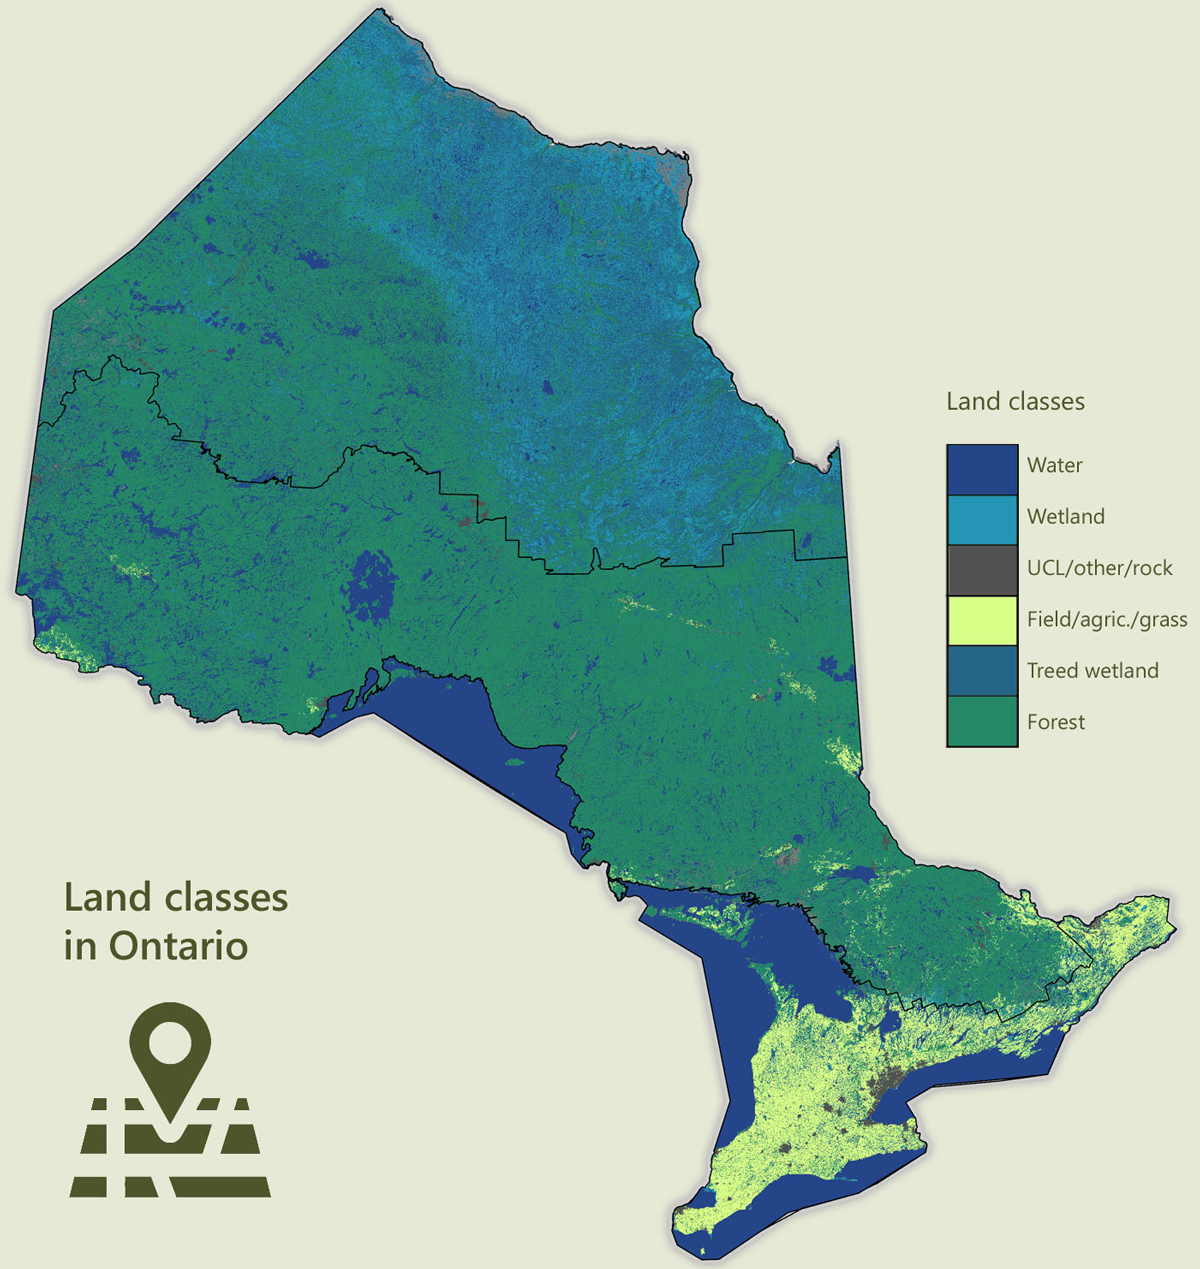
Land classes based on satellite imagery
Combining data from satellite imagery and other sources, the 2021 version of this report offers the most up to date and detailed breakdown of land classes in the report's history.
The broad land classes summarized in this report include:
- water – all inland and great lakes water
- wetland – open wetlands including bogs, fens and marshes
- field/agriculture/grass – field, agricultural land and crops as well as grass lands
- UCL/other – unclassified or urban areas, cloud cover and missing data
- rock – exposed bedrock with less than 10% tree cover
- treed wetland – wetland containing tree cover such as muskeg and treed fen and treed bog
- brush/hedgerows – alder, brush or low stocked forest, as well as fence or hedgerows in the south
- forest – productive forest
Land types based on FRI
Forest resources inventories also break the landscape into broad land types such as bodies of water, swamps and forest. This is similar to land classes found in satellite imagery but is based on human interpretation and is subject to rules related to the FRI. In Ontario's inventory system, these land types are called polygon type or polytype. Polytype land classes include:
- water – lakes, ponds and two-sided rivers
- open muskeg – areas of wet mosses, plants with open water
- treed muskeg – areas of stunted trees such as bog
- brush/alder – areas of non-commercial trees/shrubs
- grass – farm areas for grazing, grass lands and meadows
- agriculture – lands cultivated for growing crops
- rock – areas of exposed rock which may have scattered tree cover
- islands – small islands less than 8 hectares in size
- unclassified – non-forested areas such as roads, utility corridors or gravel pits
- forest – areas of productive forest that can support tree growth
Summaries for the Managed Forest Zone use FRI where possible. When there are gaps in FRI, satellite landcover information is used. Gaps only occur in small portions of the zone including Lake Nipigon and its islands, small islands within inventories, and where some management units meet.
Forests classes based on FRI
Forest stands are groups of trees occupying a specific area that are uniform enough in species, age and arrangement to be distinguishable from an adjacent group of trees. Provincial forest types are groupings of forest stands with similar composition. Some are more homogenous, such as the jack pine forest type which is mostly pure upland jack pine stands. Others, such as mixedwood or tolerant hardwoods, contain a wide variety of tree species.
There are eight provincial forest types:
- white and red pine – all white and red pine mixedwood stands
- jack pine – predominantly jack pine stands
- upland conifers – predominantly mixed spruce, jack pine and fir stands on upland sites
- lowland conifers – predominantly black spruce stands on low, poorly drained sites
- mixedwood – mixed stands made up mostly of spruce, jack pine, fir, poplar and white birch
- poplar – predominantly poplar stands
- white birch – predominantly white birch stands
- tolerant hardwoods – predominantly hardwoods such as maple and oak, found mostly in the Great Lakes – St. Lawrence forest region
Seral stages or development stages are a grouping based on stand age and ecosite, which vary by forest type. Because each forest type develops differently, their seral stages begin at different ages. For example, poplar is a shorter-lived forest type than lowland conifer, so the late successional, or old growth, stage of poplar starts at 95 years of age, while lowland conifer starts at 135 years.
The seral stages are:
- pre-sapling
- sapling
- immature
- mature
- late successional
Another method of summarizing forests is by individual tree species, regardless of the forest type in which they occur. For example, to measure black spruce species we combine the black spruce that is found within the lowland conifer forest type along with the black spruce within upland conifer, mixedwood, and anywhere else it may occur.
Many tree species in Ontario occur in a wide variety of stands, in varying amounts. Some species like jack pine are often found in large homogenous stands, while other species can be found in smaller amounts across the forested landscape. For example, white pine can be found within stands on 3.6 million hectares of forest, but as a leading or dominant species is only found on 977 thousand hectares, and as a provincial forest type (red and white pine) is only found on 1.4 million hectares. This version of FRO summarizes sixteen common tree species found in Ontario:
- white pine - Pinus strobus
- red pine - Pinus resinosa
- jack pine - Pinus banksiana
- black spruce - Picea mariana
- white spruce - Picea glauca
- balsam fir - Abies balsamea
- white cedar - Thuja occidentalis
- larch (tamarack) - Larix laricina
- hemlock - Tsuga canadensis
- poplar (aspen) - Populus species
- white birch - Betula papyrifera
- sugar maple - Acer saccharum
- red maple - Acer rubrum
- oak - Quercus species
- yellow birch - Betula alleghaniensis
- ash - Fraxinus species
Growing stock volumes
Growing stock volumes have been included in the Forest Resources of Ontario series since the 1950s, using Plonski's normal yield tables. The ministry’s Growth and Yield Program continues to refine and research forest yields to this day and has recently updated merchantable volume biomass calculations.
The three main volume calculations summarized in this report include:
- gross total volume (GTV): Volume of the main stem, including stump and top as well as defective and decayed wood, of trees or stands
- net merchantable volume (NMV): Volume of the main stem, excluding stump and top but including defective and decayed wood, of trees or stands
- current annual increment (CAI): Volume of growth observed in a tree in a specific one-year period