Evaluating the performance of small ruminant operations
Learn about the benefits of performance evaluation and how to get started setting goals and benchmarking for small ruminant operations.
ISSN 1198-712X, Published September 2022
Introduction
Evaluating performance is a critical step towards increasing production efficiency and profitability of Ontario small ruminant operations. Small changes in production can have a big impact on overall profitability.
This fact sheet describes the benefits of performance evaluation and how to get started with setting goals and benchmarking for small ruminant operations. The companion fact sheet Measuring productivity of the sheep flock describes production targets for Ontario sheep flocks.
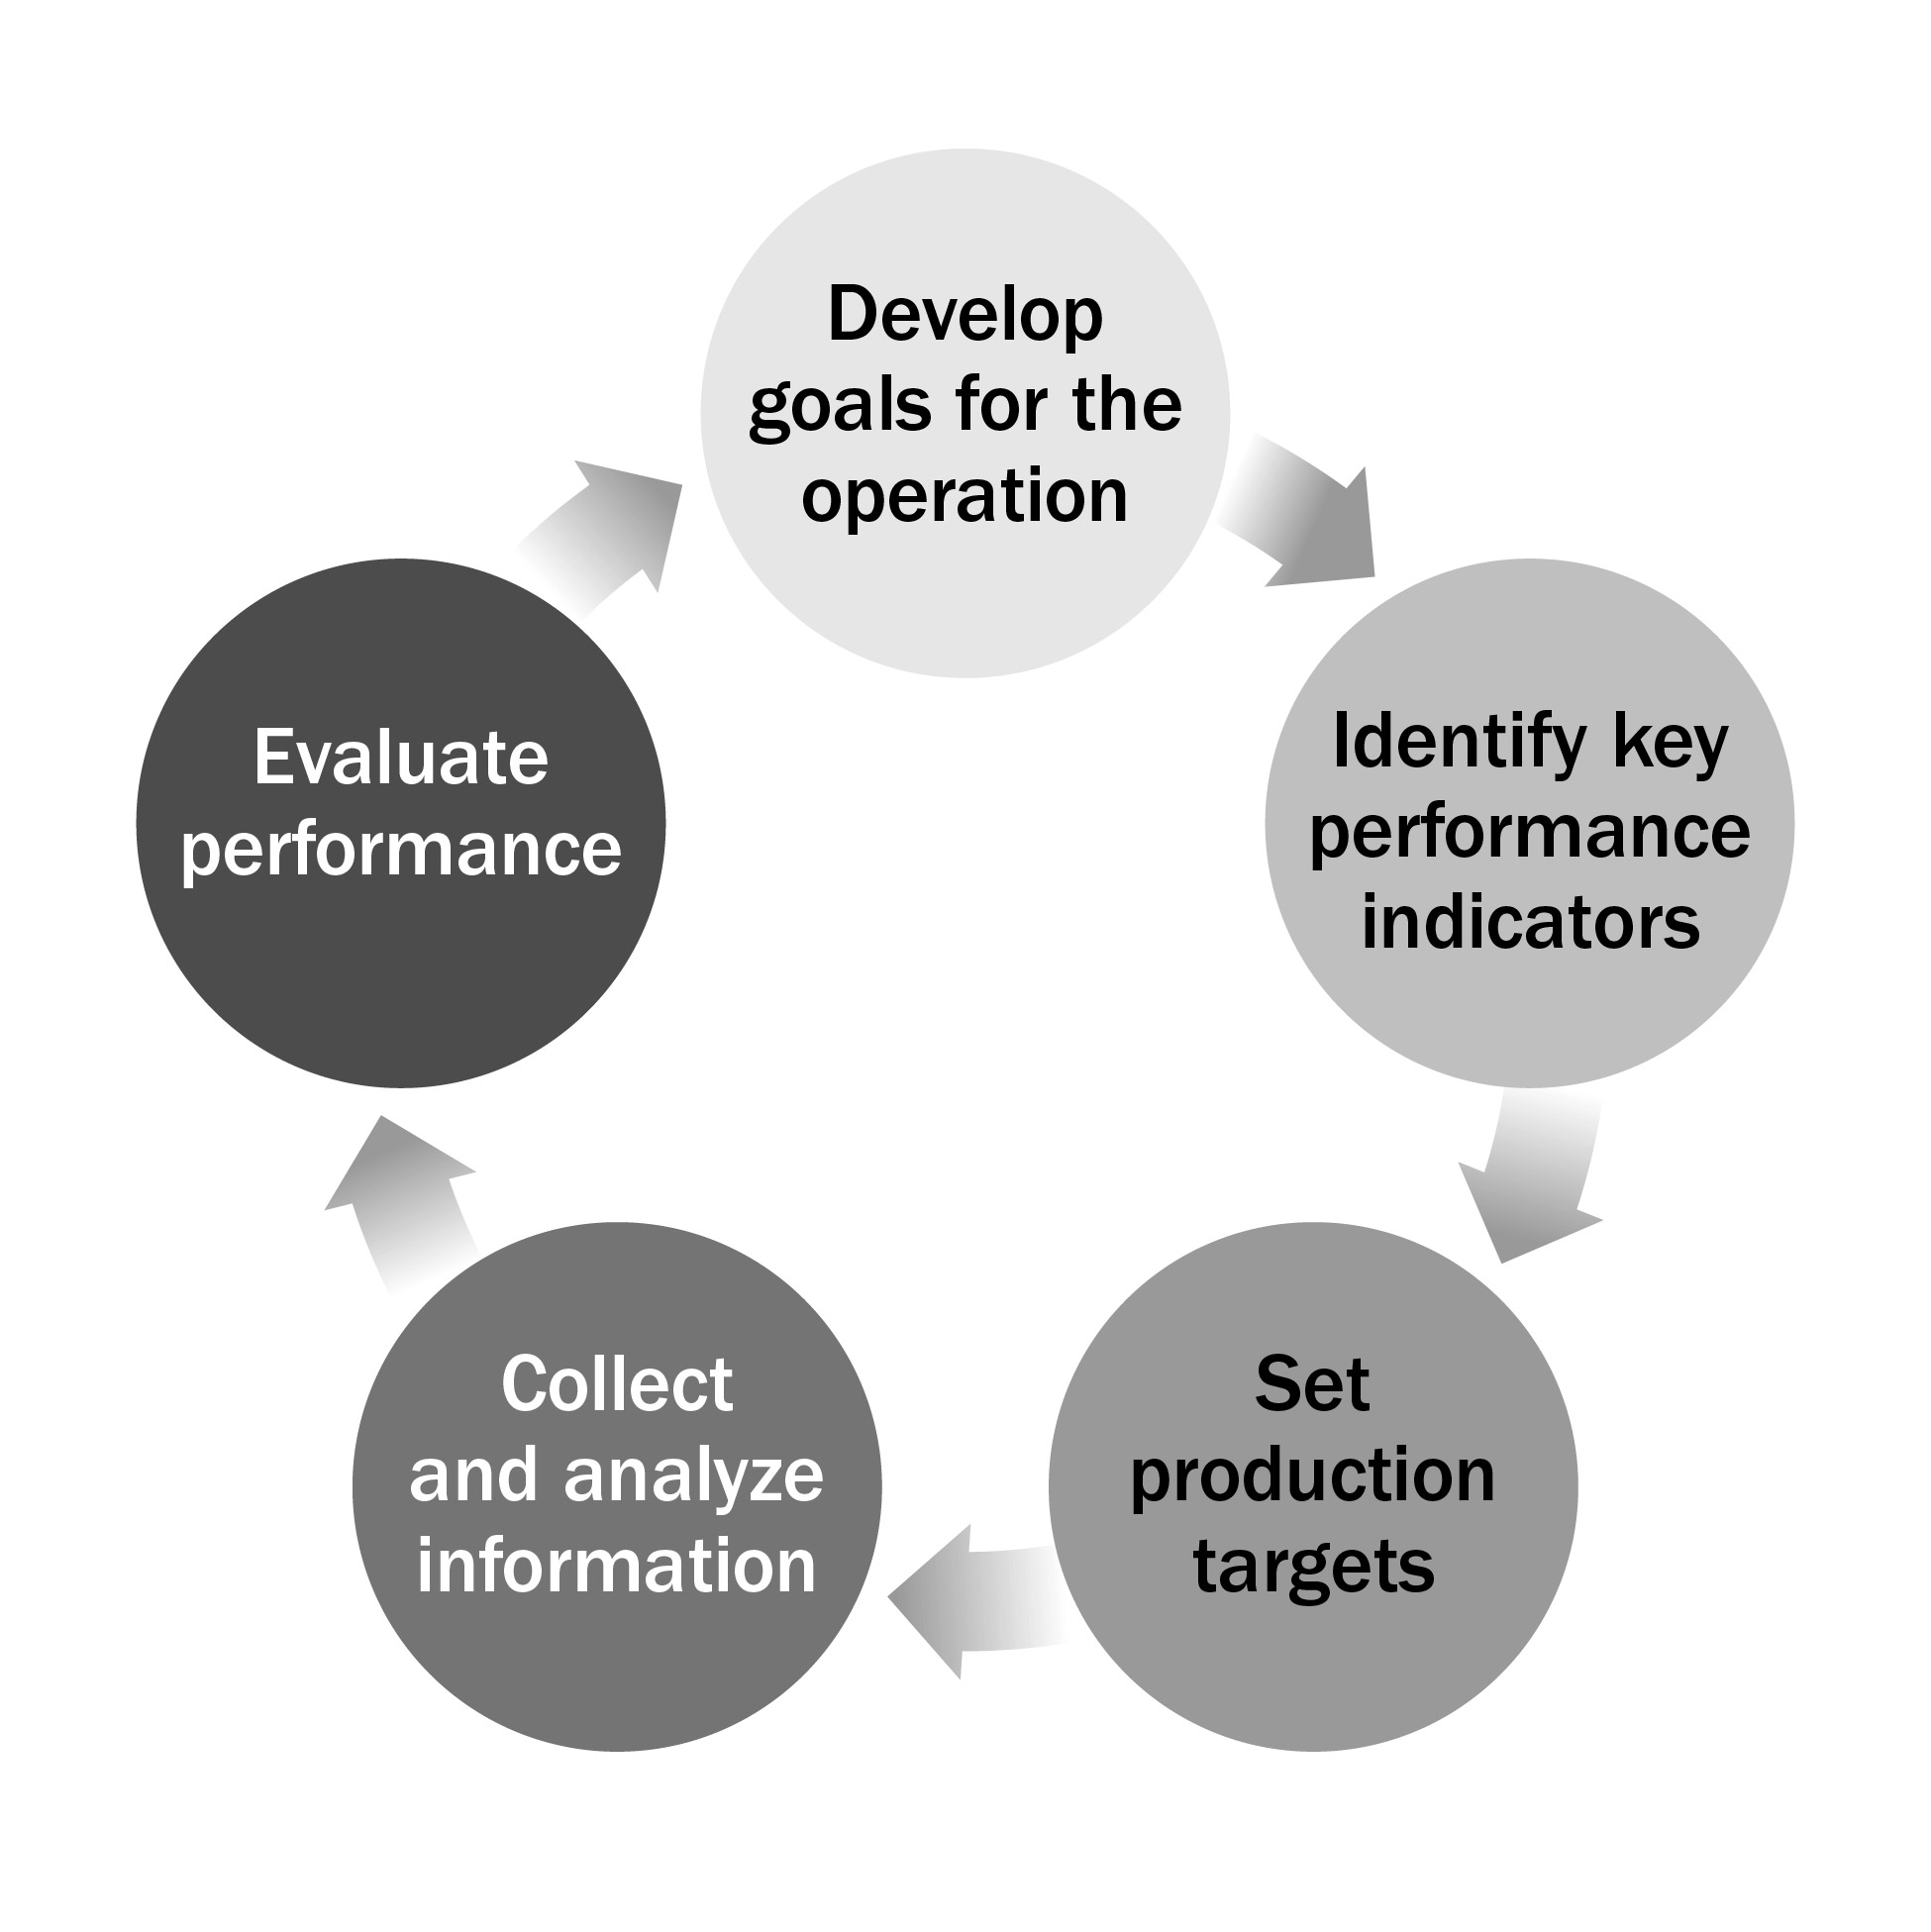
Recording information and evaluating performance also helps determine the operation’s strengths and weaknesses, allowing time and resources to be prioritized into improving the areas of the operation that will have the biggest impact on profitability (Figure 1).
Benchmarking is the term for the process of comparing an operation’s performance to others in the sector or established industry benchmarks. Operations will also have their own goals for important aspects of the operation (for example, lambing percentage, average daily gain, milk yield). These measures are referred to as key performance indicators (KPI) and they can be used to evaluate production trends and track progress towards goals.
Benefits of performance evaluation
There are many benefits to evaluating performance:
- Forecasting revenue — Forecasting the market crop will help the operation understand expected cash flow and assist in day-to-day budgeting.
- Financial planning — Having evidence of the flock’s performance will strengthen business plans.
- Identifying problems — Identifying areas of the management cycle that may be reducing production efficiency will help catch problems earlier and reduce their impact on the operation.
- Tracking progress — Routine performance evaluations will track progress towards an operation’s goals.
- Increasing profitability — Identifying and correcting areas of the production cycle that are not ideal can increase profitability.
Getting started with performance evaluation
It can be challenging to get started with performance evaluation. However, a few steps can help set an operation up for success:
- Make a plan — Collecting information will not be useful if the operation has not considered its goals, why collecting this information is important to those goals and how it will be used to improve flock performance.
- Keep it simple — It’s best to start with a simple system to avoid the process being overwhelming. Select a few KPI that are important to the operation and fit within its recordkeeping capabilities and goals.
- Make it a routine — Decide who will be responsible for collecting and analyzing performance information and how frequently evaluation will occur. Assign this as a task so it isn’t forgotten.
- Record information efficiently — The time and effort of performance evaluation will strongly depend on the operation’s recordkeeping practices.
Evaluating flock or herd performance is a continuous process as the goals of the operation will change overtime (Figure 2).
It’s important to think about both the long-term and short-term goals. Long-term goals determine the operation’s priorities and where it’s headed. For example, some long-term goals might include:
- expand the herd or flock to enable full-time employment
- increase the land base of the operation to reduce reliance on purchased feeds
- transition to a new production system that better utilizes farm resources (for example, confinement versus pasture-based, annual versus accelerated production)
- improve herd or flock genetics to market breeding stock
- build a brand for the operation through farm-gate sales of value-added products to diversify revenue streams
Shorter-term goals are also important as they are often the building blocks necessary to achieve these longer-term priorities. The SMART goal framework can help with setting both short and long-term goals.
Developing SMART goals
Although the overall goals of the operation may be broad, it’s important to break these down into specific goals that allow an operation to evaluate performance. A SMART goal is one that is Specific, Measurable, Achievable, Relevant and Time-bound. When developing goals or production targets, consider the SMART framework:
- Specific — What do you want to accomplish?
- Measurable — How will you evaluate progress towards this goal?
- Achievable — Is this goal realistic or are there barriers that may make it unattainable?
- Relevant — How does this goal fit within the broader objectives of the operation in terms of profitability, sustainability or animal health and welfare?
- Time-bound — When is a reasonable target to meet this goal?
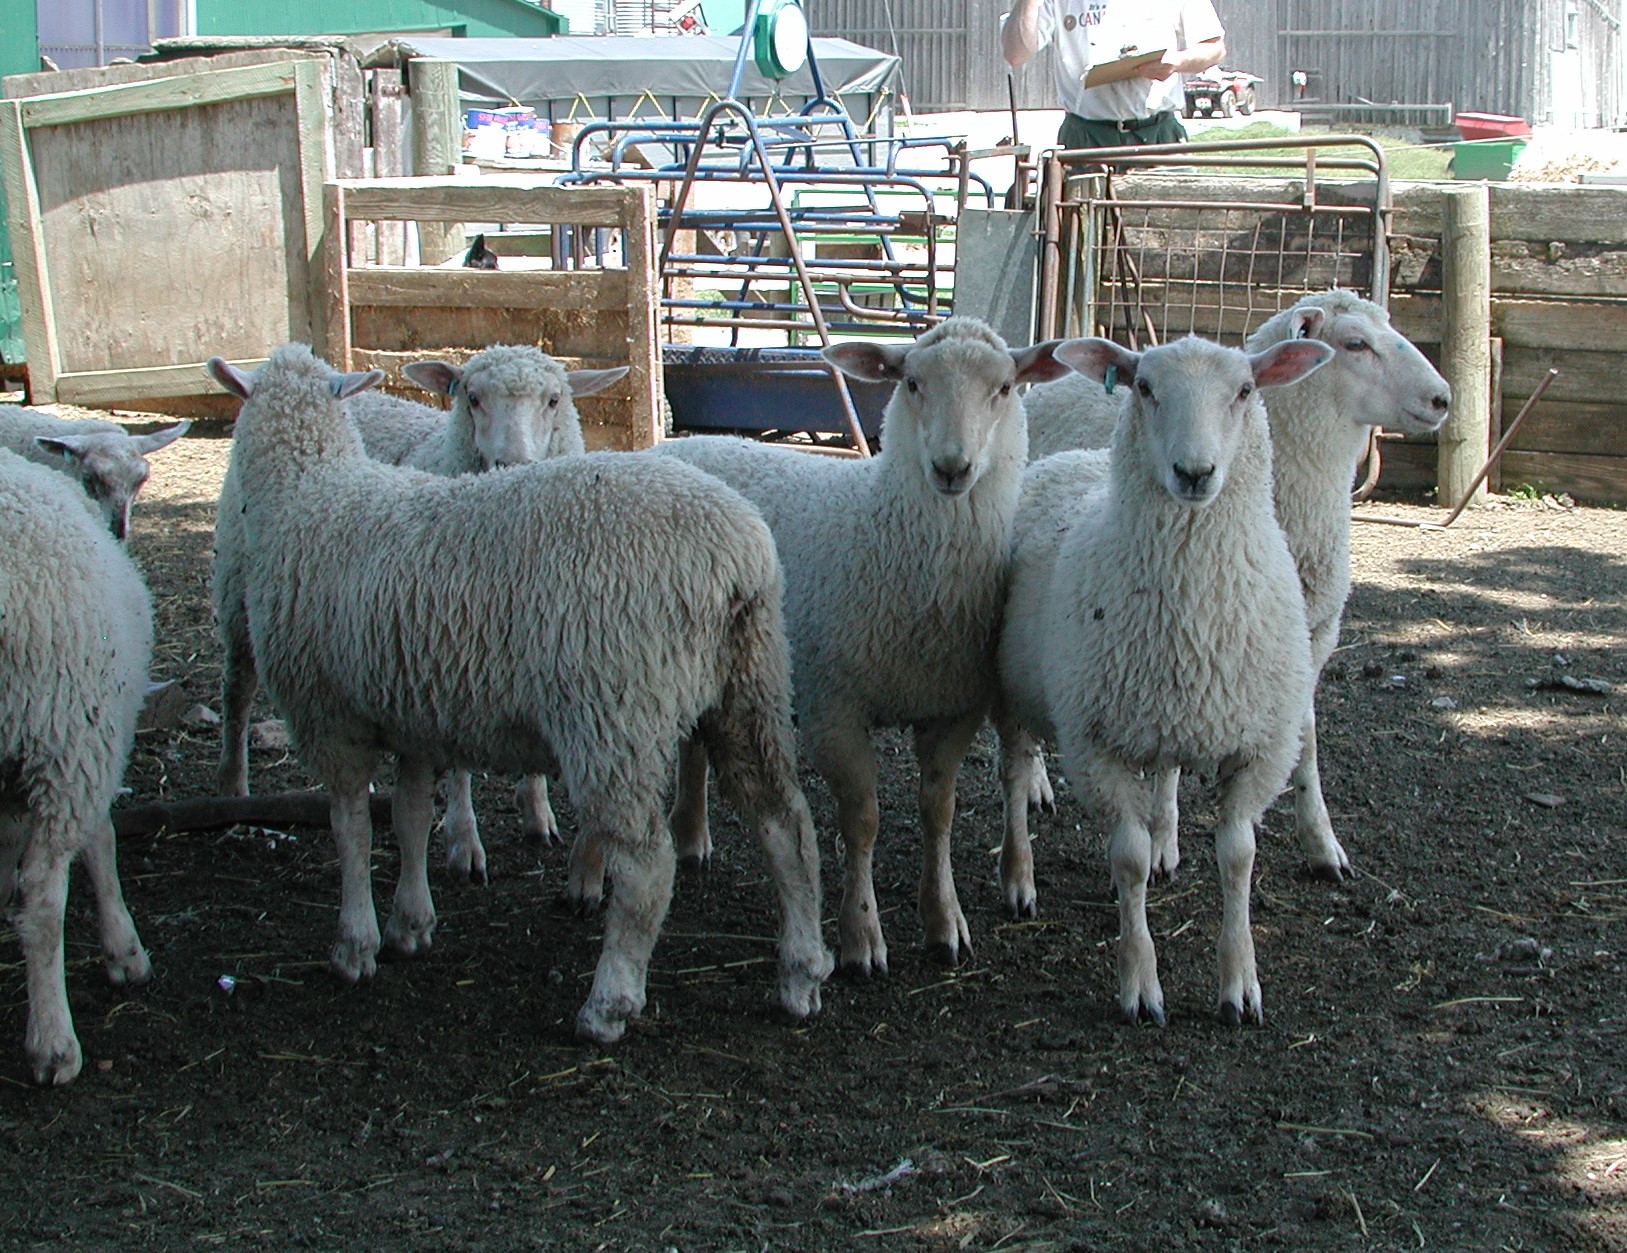
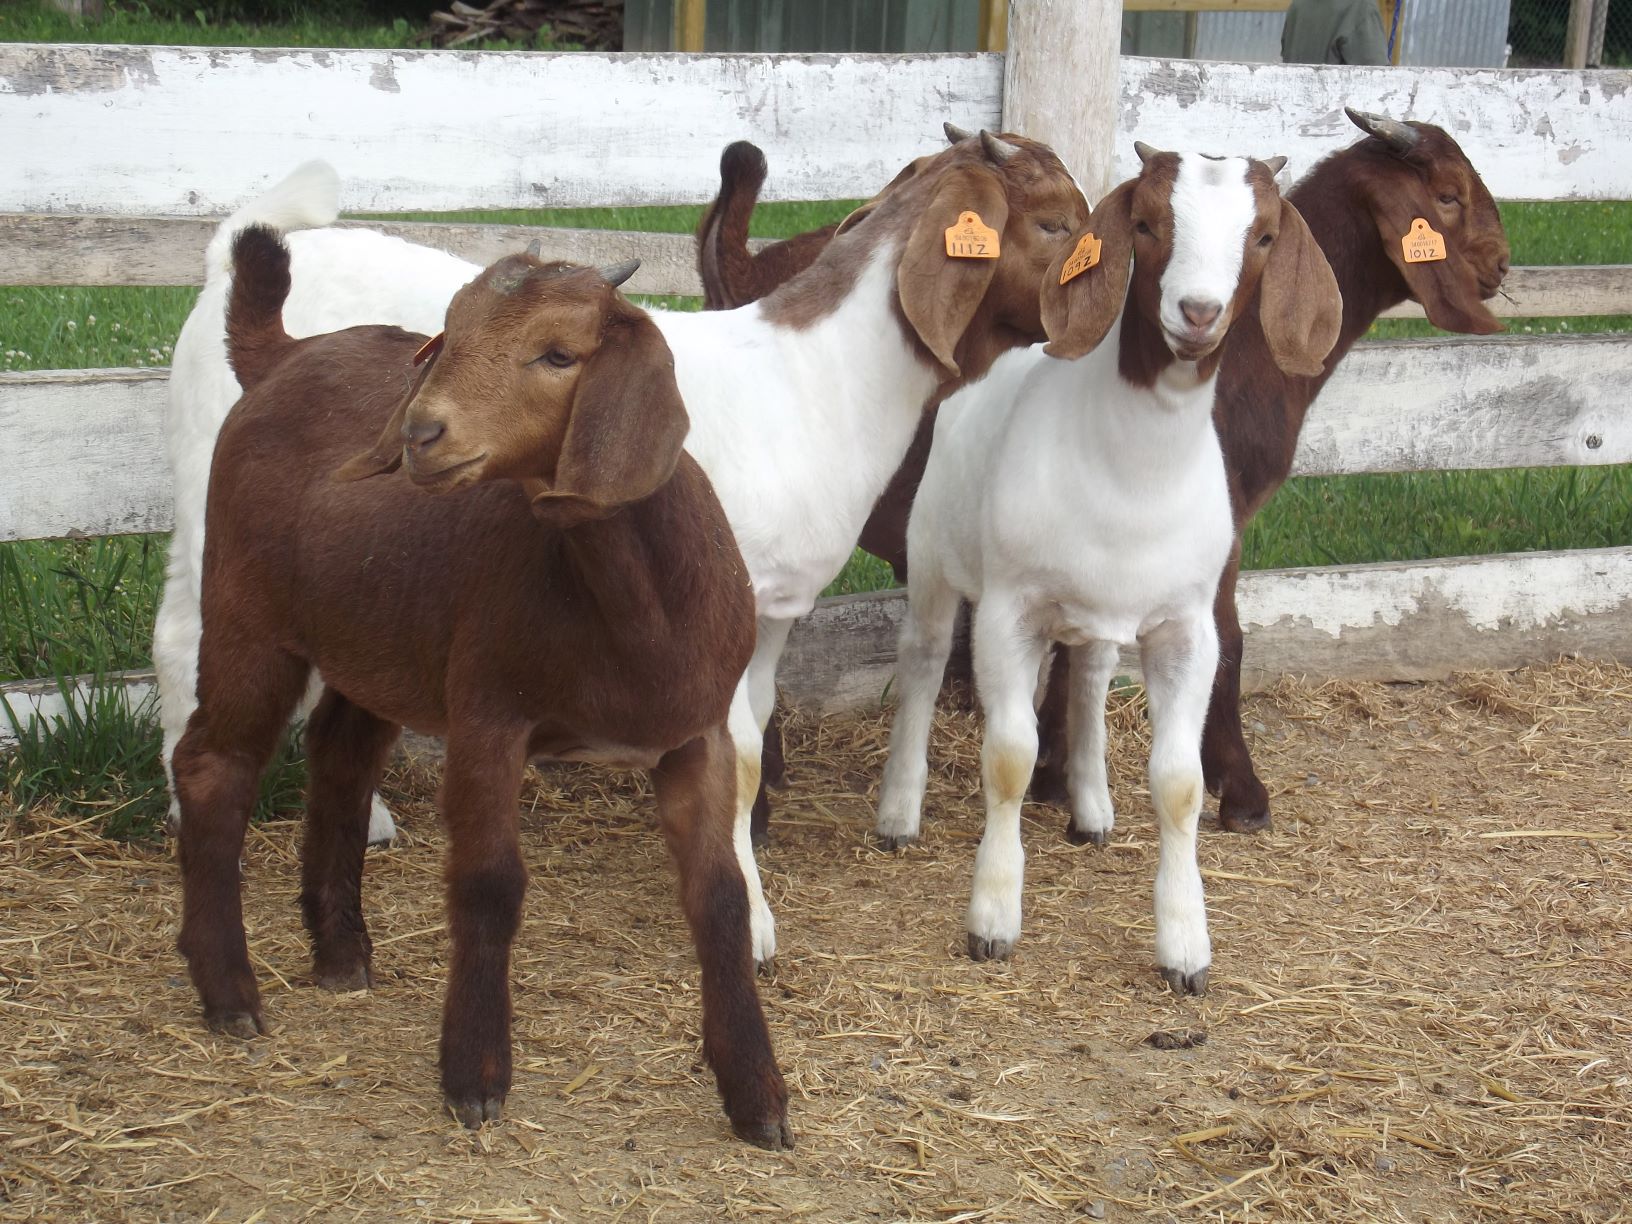
In many commercial meat sheep or goat operations (Figure 3), an overall goal may be to improve the market lamb or kid crop. To improve the market crop, an operation may aim to:
- increase the number of marketable lambs or kids
- improve growth to increase the amount of marketable product
- reduce the time and resources it takes to reach market
There are many factors (management, environment and genetic) that will have an impact on improving the market crop. Consequently, it’s important to break down this overall goal into SMART goals. For example:
- achieve a conception rate of at least 90% in the next in-season breeding group
- reduce pre-weaning lamb or kid mortality to less than 10% in the next 3 years
- increase the average weaning weight by 2 lb in the next market crop
- increase growth rates to reduce the days to market by 5 days in the next 2 years
Identifying key performance indicators (KPIs)
Production targets identify the level of production you want to achieve in the operation, and KPIs are the statistics calculated to measure this. The KPIs and production targets used to evaluate performance will be unique to the operation and depend on the production system, genetics of the flock or herd, and which market the operation plans to meet. See the Ministry of Agriculture, Food and Rural Affairs (OMAFRA) fact sheets Evaluating farm resources and sheep production systems and Choosing breeds for producing profitable market lambs for more information.
The KPIs are often statistics that are easy to calculate, evaluating the average performance of the flock/herd (for example weaning percentage = number of lambs or kids weaned/number of ewes lambing or does kidding), or the percentage of the flock that meets a certain criteria (for example, conception rate = number of ewes lambed or does kidded/number of ewes or does bred). Tables 1–4 lists some common KPIs for small ruminant operations. The KPIs may be evaluated for each breeding group individually, or as an average level of performance across the production year.
Some of these KPIs and possible production targets for a meat sheep operation are described in more detail in the companion fact sheet Measuring productivity of the sheep flock.
| KPI | Meat production | Dairy production |
|---|---|---|
| Conception rate | Yes | Yes |
| Pregnancy scanning rate | Yes | Yes |
| Age at first lambing or kidding | Yes | Yes |
| Interval between births | Yes | N/A |
| Average number of litters per year | Yes | N/A |
| Lambing or kidding percentage | Yes | Yes |
| Weaning percentage | Yes | Yes |
| KPI | Meat production | Dairy production |
|---|---|---|
| Adult mortality and involuntary culling rates | Yes | Yes |
| Flock or herd turnover rates | Yes | Yes |
| Average body condition score | Yes | Yes |
| Average productive lifespan | Yes | Yes |
| Pre- and post-weaning mortality rates | Yes | Yes |
| Prevalence of diseases | Yes | Yes |
| KPI | Meat production | Dairy production |
|---|---|---|
| Average weaning weight | Yes | Yes |
| Average market weight | Yes | N/A |
| Average daily gain | Yes | Yes |
| Average days to market | Yes | N/A |
| Average feed-to-gain ratio | Yes | Yes |
| Total weight weaned or marketed per ewe or doe | Yes | N/A |
| Total weight weaned or marketed per ewe or doe weight | Yes | N/A |
| KPI | Meat production | Dairy production |
|---|---|---|
| Average daily milk production | N/A | Yes |
| Average lactation length | N/A | Yes |
| Average bulk tank somatic cell count | N/A | Yes |
| Average protein percentage | N/A | Yes |
| Average fat percentage | N/A | Yes |
The KPI statistics provide a snapshot of performance at a specific time. However, it’s important to keep in mind that average performance does not provide any information on which animals are performing better or worse. Individual records are necessary to determine which animals to keep or cull to better meet your production targets in the future.
Collecting and analyzing information
The best method to use to collect and analyze information will depend on the operation’s recordkeeping practices. There are many ways to record information, but what is most important is finding a system that is convenient, as this will increase the likelihood that information is recorded.
Operations that use flock or herd management software likely have all the information they need stored within the program. Depending on the program, it may be possible to export a report with the KPI calculated or spreadsheet files that can be used to calculate the KPI statistics.
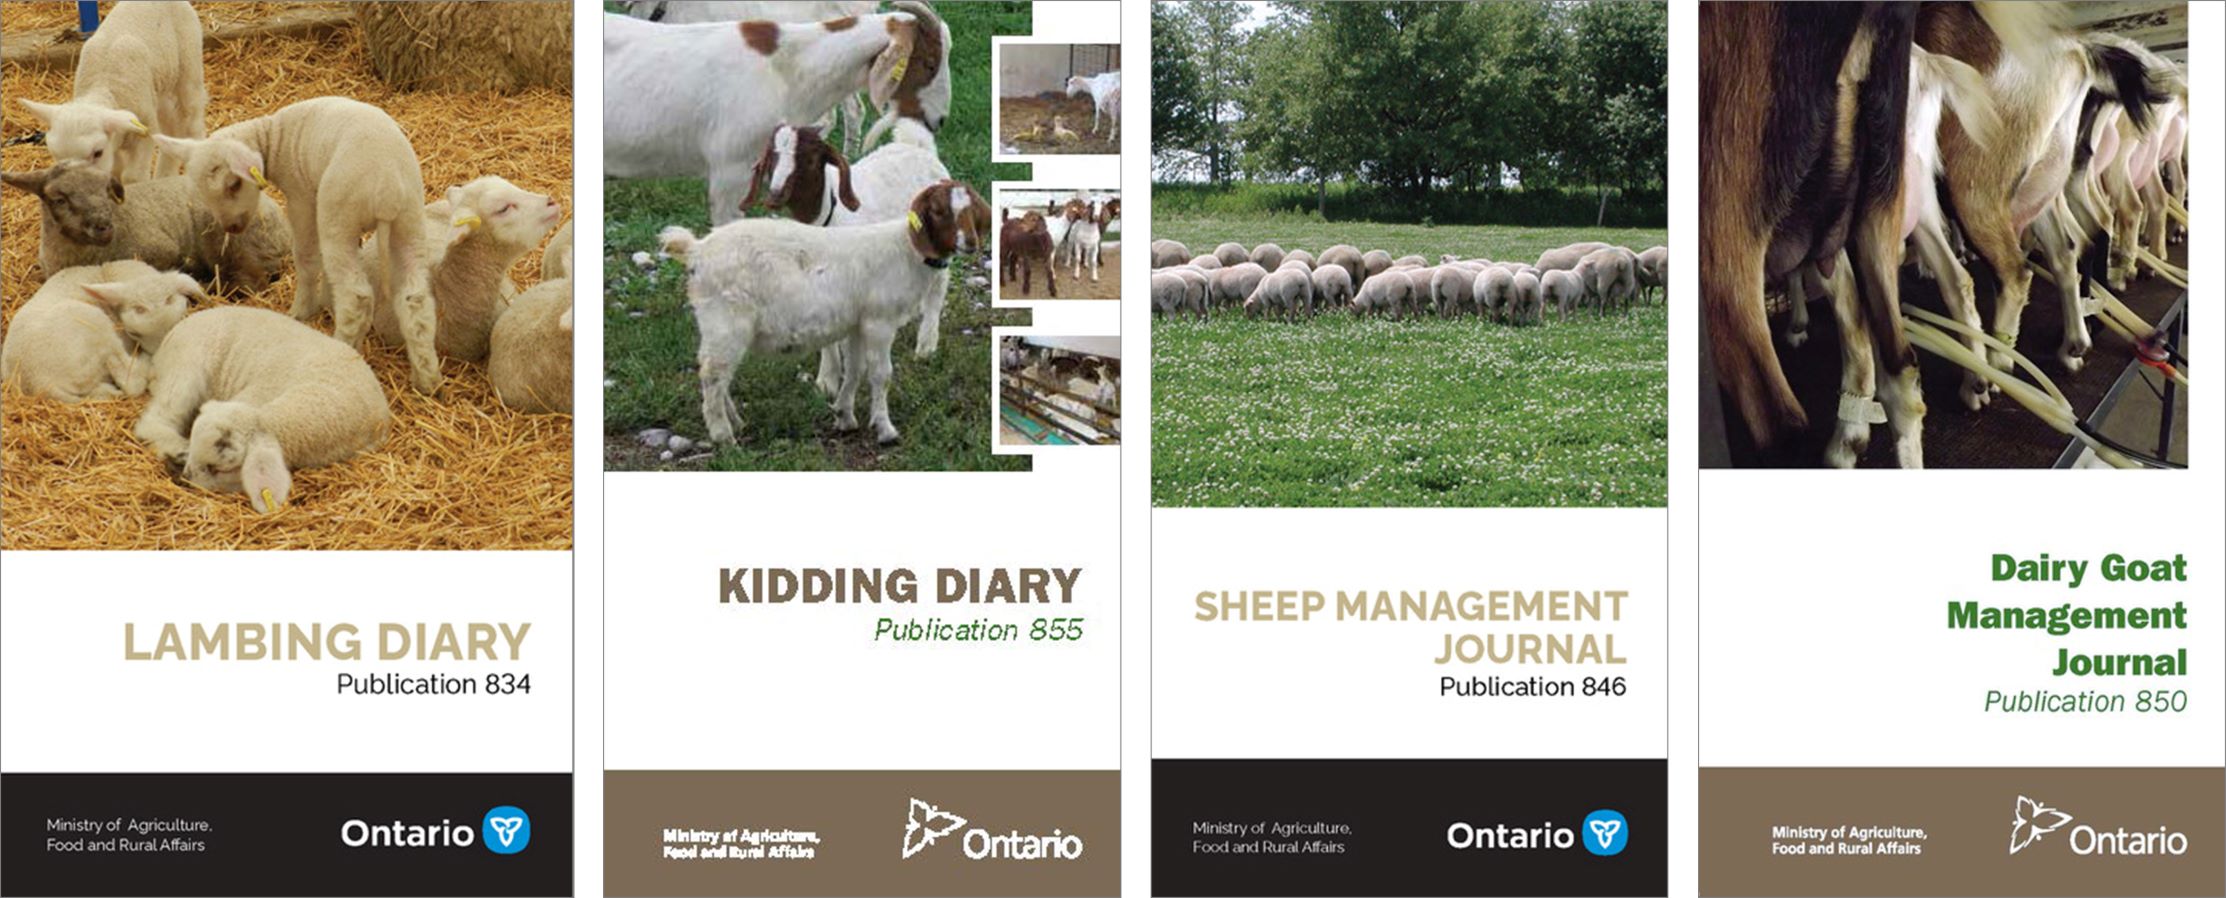
Operations using paper-based recording systems may collect information in a variety of ways. The OMAFRA Lambing Diary, Kidding Diary, Sheep Management Journal and Goat Management Journal provide some tools for collecting key performance information (Figure 4). To analyze the information, operations may choose to use a spreadsheet software or pen and paper calculations.
Benchmarking performance
When benchmarking the flock or herd, it’s important to ensure comparisons are made fairly to either the operation’s own past performance or the performance of others. Benchmarks must be calculated consistently over time or over operations to make fair comparisons. Benchmarking relative to other flocks or herds will be most successful when an operation is compared to others with similar production systems, flock or herd sizes and management.
The value of improving performance
It is easy to miss the small changes in performance that can have a major impact on profitability. Although operations have little control over many factors influencing profitability, including market price, cost of commodities, weather and more, they do have some control over their own production efficiency. The first step to being able to improve that performance is to evaluate it.
The following two examples show the economic impact of improving performance for a single KPI, specifically, lamb mortality for a meat sheep operation and average daily milk yield for a dairy goat operation.
The use of imperial measurement in this fact sheet reflects the way information is reported by the sheep industry.
Example 1: Lamb mortality
Lambing is the most challenging period in the meat sheep production cycle. The demands for labour, decision-making and action to resolve problems can make it difficult to see the overall picture. Lamb mortality rate is one KPI that can have a big impact on the market crop, and consequently, the expected revenue of the operation. Lamb mortality rates are highly variable between operations. Studies have found average lamb mortality rates of 10%–20%, but 10% is a common production target. Figure 5 and Table 5 show the impact of improving lamb mortality on the number of marketable lambs and expected revenue.
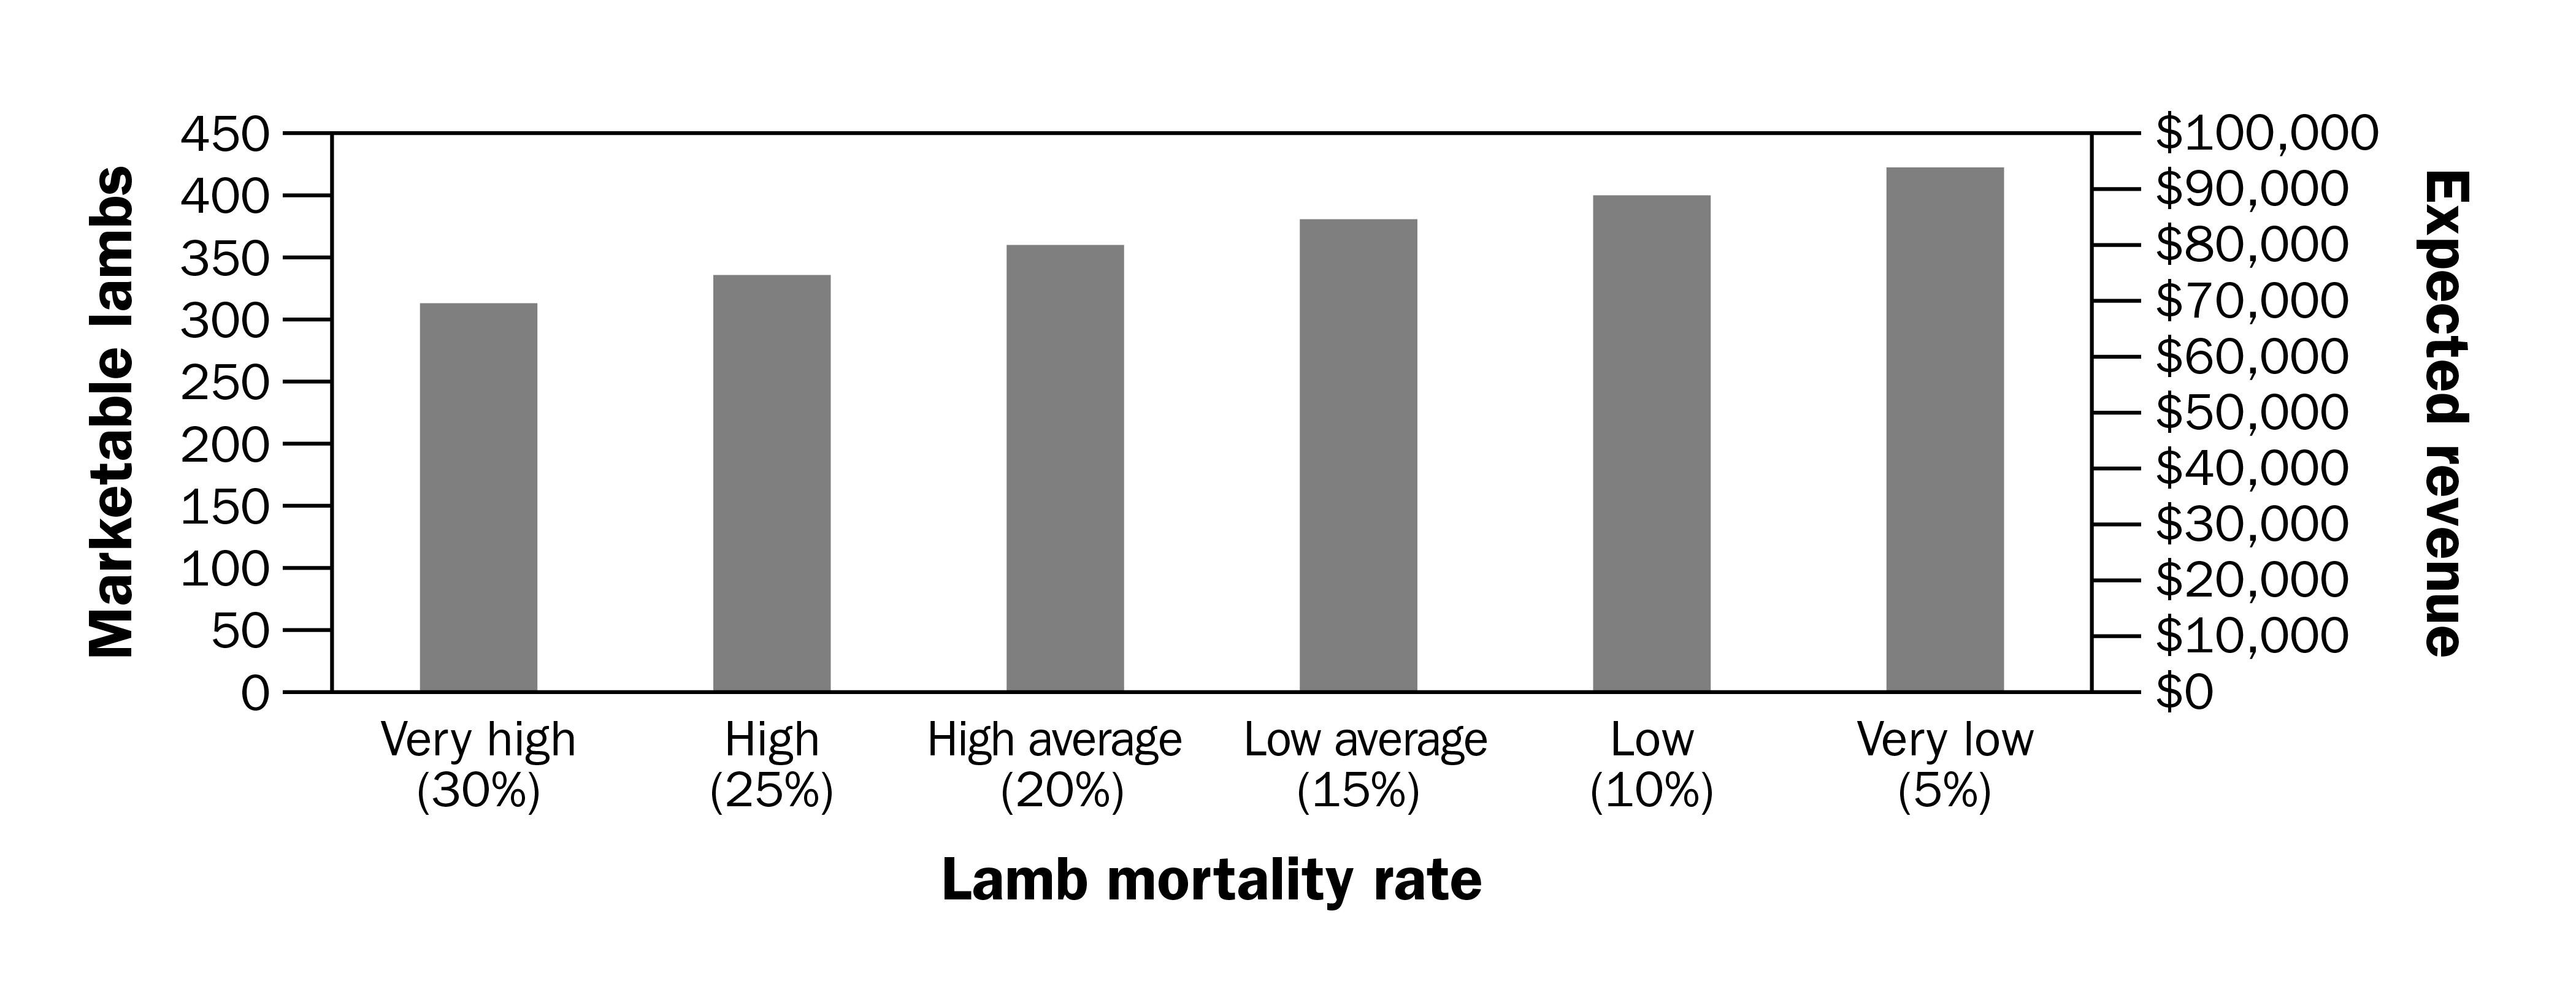
The example assumes a flock size of 250 ewes, with 90% conception rate, 200% lambing percentage (twins born on average) in the breeding group and varying lamb mortality rates from 30% (very high) to 5% (very low). An average market weight of 90 lb and an average market price of $245.47 per 100 lb ($/cwt) was assumed, which was the 2019 yearly average market price for 80–94-lb lambs in Ontario.
Figure 5 and Table 5 show that the number of marketable lambs ranges from 315 to 428 between very high and very low mortality rates, a difference of 113 lambs or $24,964 in expected revenue for the example flock. Although those figures may be the extremes, even the difference between a flock achieving a low-average mortality rate (15%) versus the production target of 10% for low mortality, results in an additional 22 marketable lambs or $4,860 in additional revenue.
| Scenario | Very high | High | High average | Low average | Low | Very low |
|---|---|---|---|---|---|---|
| Flock size | 250 | 250 | 250 | 250 | 250 | 250 |
| Conception rate (%) | 90 | 90 | 90 | 90 | 90 | 90 |
| Lambing percentage (%) | 200 | 200 | 200 | 200 | 200 | 200 |
| Mortality rate (%) | 30 | 25 | 20 | 15 | 10 | 5 |
| Marketable lambs | 315 | 338 | 360 | 383 | 405 | 428 |
| Average market weight (lb) | 90 | 90 | 90 | 90 | 90 | 90 |
| Market price ($/cwt) | 245.47 | 245.47 | 245.47 | 245.47 | 245.47 | 245.47 |
| Expected revenue ($) | 69,591 | 74,672 | 79,532 | 84,614 | 89,474 | 94,555 |
Example 2: Goat milk yield
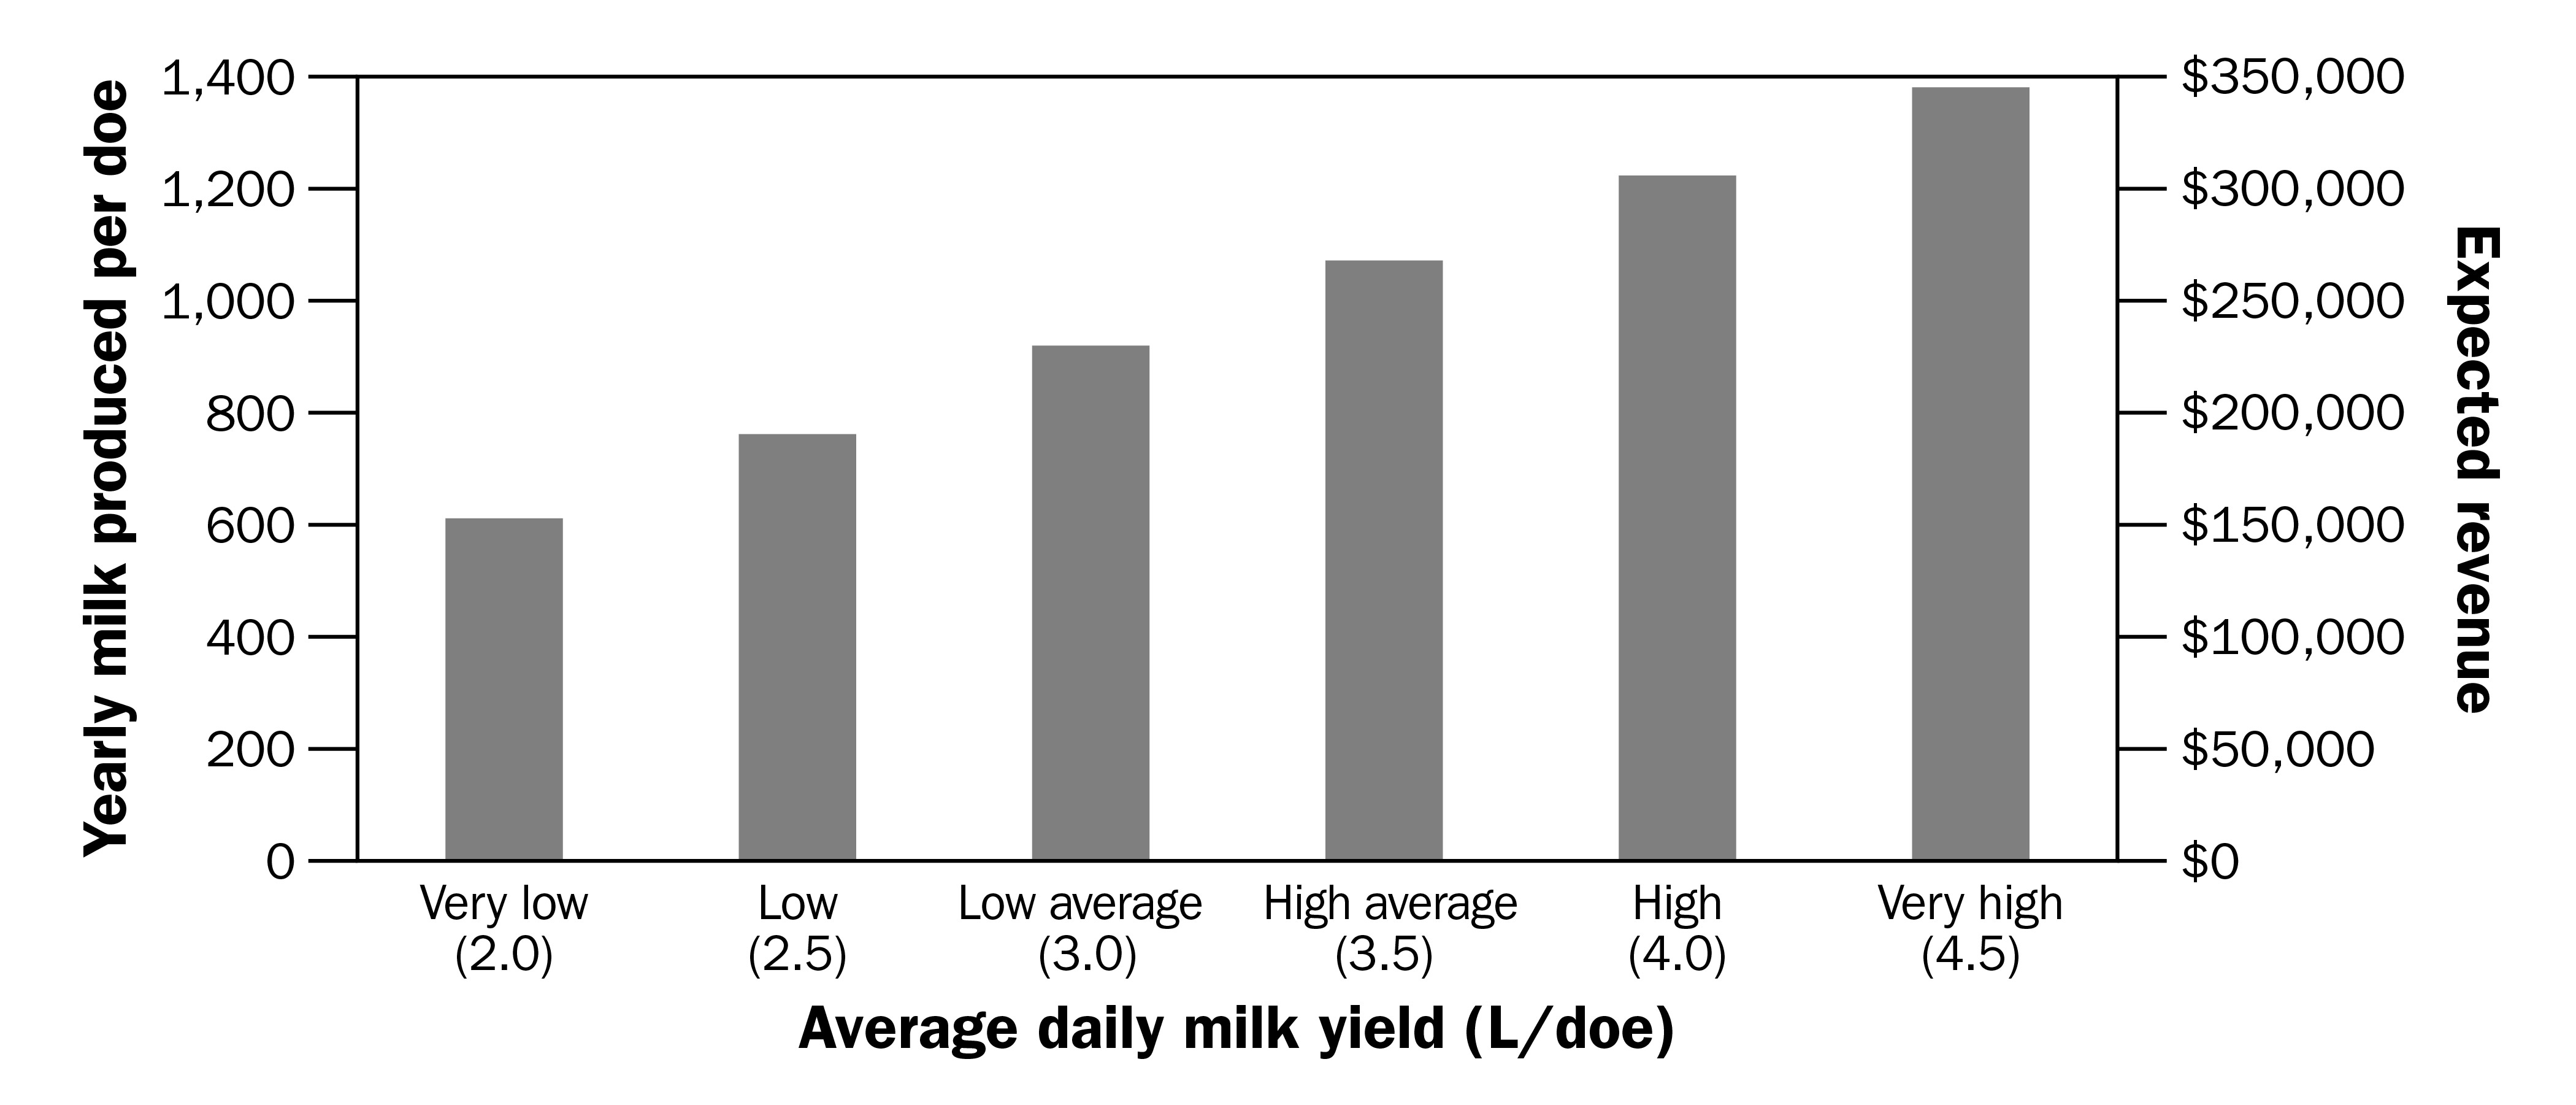
The level of productivity on Ontario dairy goat operations, measured as average daily milk yield, can vary substantially. On average, a 2020 survey of 20 registered Ontario goat operations by OMAFRA found a weighted average yearly milk production of 1,003 L/doe (3.29 L/day, based on a 305-day lactation length) but the average production per doe across farms ranged from about 650 L/doe (2.13 L/day) to 1,375 L/doe (4.51 L/day). Although the price paid per litre of milk sold is dependent on milk components (protein and fat percentages), the survey reported a weighted average price per litre sold of about $1.00. Average levels of production on a dairy goat operation are often 3.0–3.5 L/doe/day, but high-producing herds may set a production target of upwards of 4.0 L/doe/day.
This example assumes a milking herd of 250 does, with an average lactation length of 305 days and daily milk yield ranging from very low (2.0 L/doe) to very high (4.5 L/doe) levels of production.
Figure 6 and Table 6 show how that expected yearly milk production for the example herd would range from 610 L/doe to 1,372.5 L/doe, when comparing very low or very high productivity, a difference of 762.5 L/doe or $190,625 in expected yearly revenue. Once again, this represents the extremes of productivity levels, but even for the high-average (3.5 L/doe/day) levels of production compared to the production target of 4.0 L/day, this would lead to an extra 152.5 L of milk produced per doe per year or $38,125 in additional annual revenue.
| Scenario | Very low | Low | Low average | High average | High | Very high |
|---|---|---|---|---|---|---|
| Milking herd size | 250 | 250 | 250 | 250 | 250 | 250 |
| Average daily milk yield (L/doe) | 2.0 | 2.5 | 3.0 | 3.5 | 4.0 | 4.5 |
| Average milk produced per year (L/doe) | 610.0 | 762.5 | 915.0 | 1,067.5 | 1,220.0 | 1,372.5 |
| Market price ($/L) | 1.00 | 1.00 | 1.00 | 1.00 | 1.00 | 1.00 |
| Expected yearly revenue ($) | 152,500 | 190,625 | 228,750 | 266,875 | 305,000 | 343,125 |
Conclusion
Evaluating performance of the herd or flock allows producers to understand the strengths and weaknesses of their operation, compare performance over time and set production goals for continuous improvement. Evaluating performance of the operation is the first step towards improving productivity, and small differences in productivity can have a big impact on the overall profitability of small ruminant operations.
Resources
- Australian Wool Innovation Limited and Meat & Livestock Australia. Making more from sheep. 2008.
- Barkley, M. 2020. Set production benchmarks for sheep and goat production. Penn State Extension.
- Farm Advisory Service. 2020. An introduction to benchmarking for sheep.
- Geenty, K. 2013. Making every mating count. 1-92. Beef and Lamb New Zealand.
- Mulvaney, C.J. and McColl, D.J. 2016. Monitoring and benchmarking farm performance. Hill Country (PDF) – Grassland Research and Practice Series 16:87-94.
This fact sheet was written by Erin Massender, small ruminant specialist (acting), and Delma Kennedy, sheep specialist, OMAFRA.