Measuring sheep flock productivity
Learn how to calculate and the importance of some key production targets for the sheep. This technical information is for commercial sheep producers in Ontario.
ISSN 1198-712X, Published November 2022
Introduction
Improving production efficiency is important to ongoing farm profitability. Setting production targets is a critical step in being able to evaluate and improve the performance of the sheep flock. Production targets are goals an operation seeks to achieve for important aspects of the operation. These important aspects are often referred to as key performance indicators (KPIs). Production targets should be attainable and relevant to the operation, while also allowing for continuous improvement. More information on the importance of performance evaluation is available in the Ministry of Agriculture, Food and Rural Affairs’ (OMAFRA) fact sheet Evaluating the performance of small ruminant operations.
The purpose of this fact sheet is to describe the importance of some KPIs for the sheep flock and explain how they are calculated.
Production system considerations
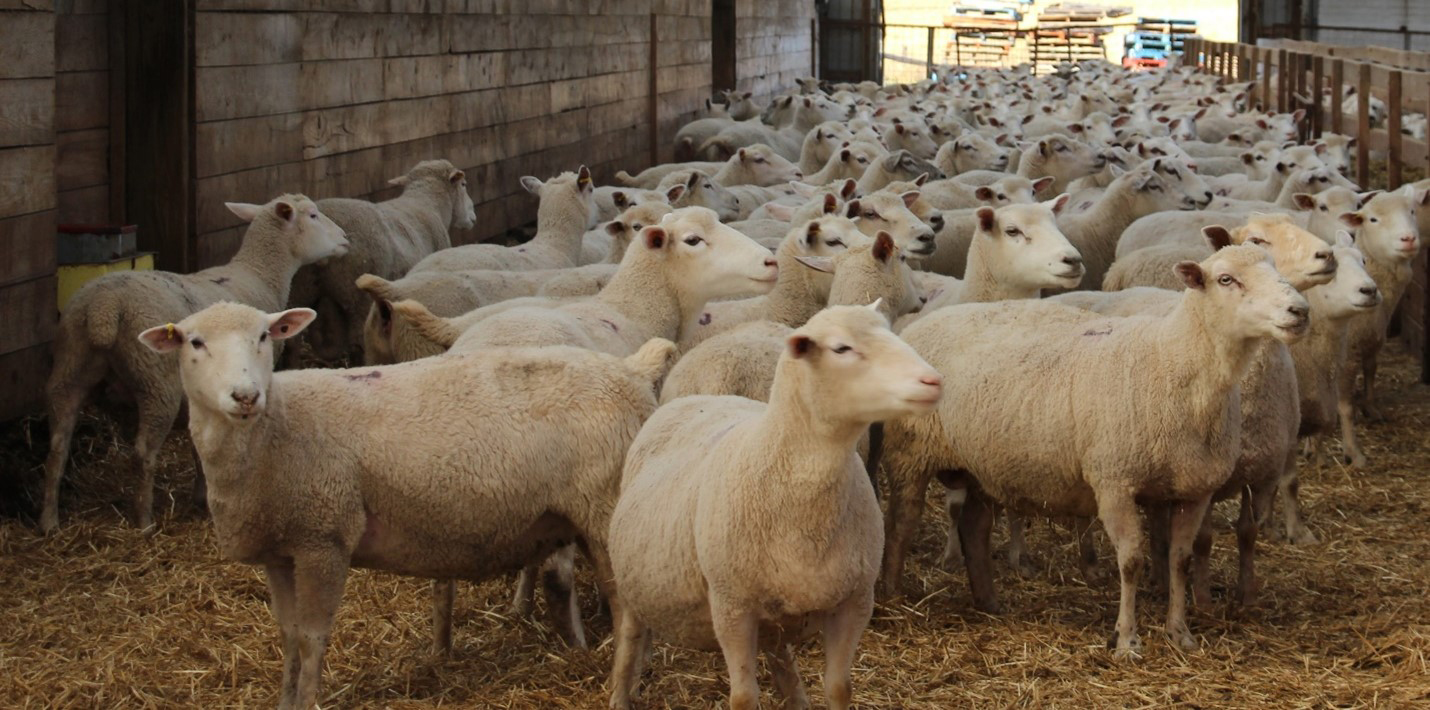
No two sheep operations are the same, which means it’s important to consider KPIs and production targets within the context of an individual operation. Operations may differ in production system (for example, annual versus accelerated), flock genetics (for example, non-prolific versus prolific), housing system (for example, confinement versus pasture-raised), cost of production (for example, feed costs and land resources) and many other factors (Figure 1). The production targets proposed in this factsheet are for reference only and may have to be adapted to be suitable for an individual operation.
More information on production system considerations is available in the OMAFRA fact sheet Evaluating farm resources and sheep production systems. The OMAFRA Ewe flock cost of production tool can also help an operation better understand their cost of production.
Reproduction
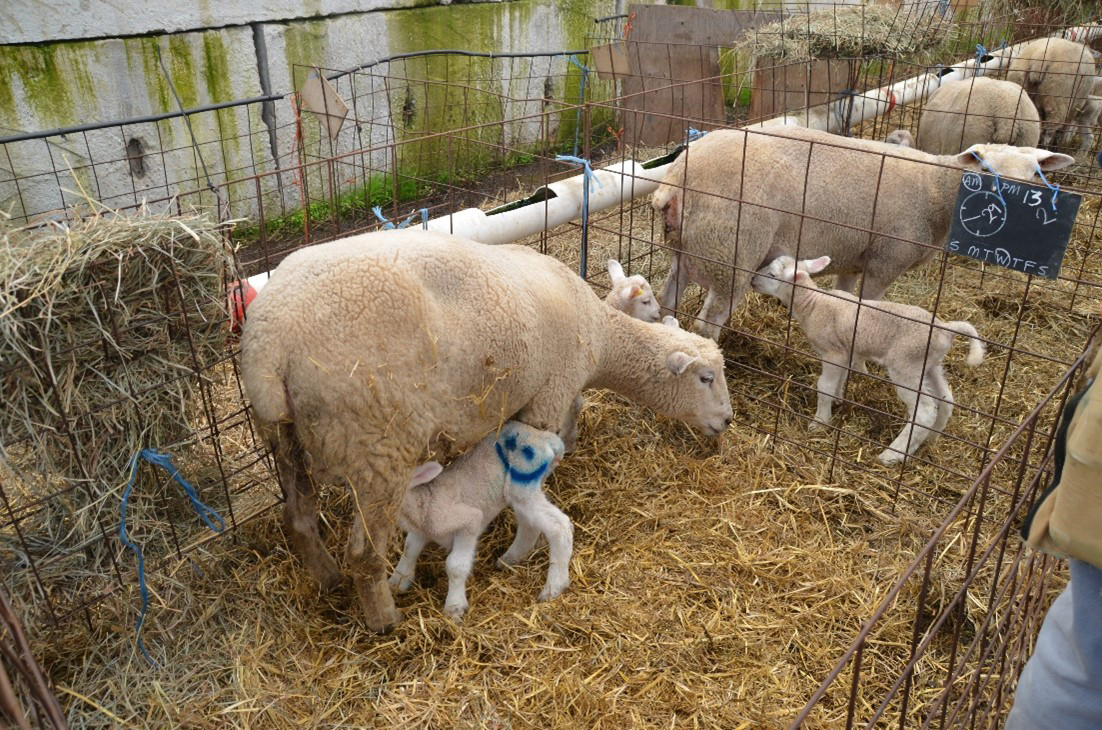
Reproduction traits are critical to the size of the market lamb crop and overall production efficiency of a commercial sheep operation (Figure 2). KPIs for breeding include:
- fertility
- length of lambing period
- lambing percentage
- weaning percentage
- lambing interval
More information is available in the OMAFRA fact sheet Forecasting lamb production.
Fertility
Fertility traits measure the success of breeding in the flock. High fertility is critical to efficient sheep production, no matter the production system. Fertility is typically measured by conception rate, although some producers also consider the pregnancy scanning rate. Conception rate is calculated based on the percentage of ewes bred that produce lambs, while pregnancy rate is the percentage of ewes bred that scan pregnant and is an early indicator of the productivity of the breeding group (Table 1).
| Season | Average conception rate | Excellent conception rate |
|---|---|---|
| In | 90% | 96+% |
| Out | 50%–60% | 70+% |
Conception rate = number of ewes lambing ÷ number of ewes bred × 100
Pregnancy rate = number of ewes scanned pregnant ÷ number of ewes bred × 100
See the OMAFRA fact sheet Sheep reproduction basics and conception rates for more information on factors influencing fertility.
Tracking pregnancy and conception rates by sire or sire group can provide additional information on fertility of the breeding rams. If conception rates are considerably lower for one sire or sire group, it may indicate a problem with ram fertility.
Length of the lambing period
Short lambing periods are desirable from the standpoint of labour efficiencies, feed and health management, as well as to produce uniform groups of lambs. Target a 21–34-day lambing period. 21 days is ideal for feeding and husbandry management, but 34 days allows a minimum of two breeding opportunities, which is important for annual lambing systems. The length of the lambing period can be calculated as the difference between the dates of first and last lambings in a group.
Lambing period = date of last lambing – date of first lambing
Lambing percentage
The number of lambs born per ewe lambing, often referred to as lambing percentage or prolificacy, influences the number of lambs in the market crop. The optimal flock prolificacy will depend on production system and breed (Table 2). See the OMAFRA fact sheet Choosing breeds for producing profitable market lambs for more information.
Lambing percentage = number of lambs born ÷ number of ewes lambing × 100
| Trait | Non-prolific breeds | Prolific breeds |
|---|---|---|
| Lambing percentage | 165% | 240% |
| Weaning percentage | 150% | 210% |
| Lambing interval | 335 days | 290 days |
When benchmarking relative to other operations, it’s important to understand what is counted as a lamb born. Does the figure count all lambs, or only those born alive? Using the same measures is important to make fair comparisons.
It can also be useful to look at the distribution of number of lambs born in terms of the percentage of ewes producing singles, twins and triplets or more. Breaking apart the lambing percentage by litter size can give a clearer indication of what’s driving the number of lambs born (such as, fewer singles or more triplets and quadruplets than normal). For many operations, knowing what percentage of the breeding group produced below or above the optimum for the flock can be useful to optimize feed management.
Weaning percentage
Weaning percentage, the number of lambs weaned per ewe lambing, is a measure that accounts for both prolificacy and lamb survival. The difference between lambing percentages and weaning percentages indicates lamb mortalities.
Weaning percentage = number of lambs weaned ÷ number of ewes lambing × 100
Like lambing percentage, optimal weaning percentages will vary between prolific and non‑prolific breeds as well as production systems (Table 2). It is also useful to keep track of the percentage of lambs artificially reared (such as bottle lambs). High rates of artificial rearing are common for prolific breeds but may indicate a problem with mothering ability in the flock for less prolific breeds.
Lambing interval
Lambing interval is another reproduction trait that is important to all production systems. Annual lambing systems depend on having ewes that will re-breed and lamb during a specific time each year, thus, a lambing interval of close to 365 days is desirable. If the lambing interval is higher than expected, the operation’s culling criteria should be re-evaluated. Accelerated systems, on the other hand, will aim to have a lower lambing interval. For example, in a production system lambing 3 times in 2 years, there would be a target of an average of 1.5 lambings per ewe per year, or a lambing interval of about 8 months. Table 2 shows the average lambing interval for animals enrolled in the GenOvis program for non-prolific and prolific breeds in 2020.
Mortality and culling
Managing flock mortality rates for both lambs and adult animals is key to the overall productivity of the flock. High lamb mortality will lead to a smaller market lamb crop and less opportunity for genetic selection, whereas adult mortalities result in greater replacement rearing costs.
Lamb mortality
Lamb mortality rates will differ depending on many factors. In general, it is expected that mortality rates will be higher for accelerated and winter lambing production systems than for annual spring lambing systems. Prolific breeds are also expected to have higher mortality rates. See the OMAFRA fact sheet Understanding lamb mortality for more details on factors influencing mortality rates.
Mortality rates should count every lamb that is born, including those stillborn or mummified. Stillborn or mummified lambs have as many resources invested in them as newborn deaths and represent a loss of productivity that should be recognized.
Number of lambs born = number of lambs born alive + number of stillborn lambs + number of mummified lambs
| Prolificacy | Stillborn | Pre-weaning mortality | Post-weaning mortality |
|---|---|---|---|
| Non-prolific | 2% | 8% | 2% |
| Prolific | 2% | 12% | 2% |
A rule of thumb is to aim for less than a 10% pre‑weaning mortality rate (Table 3). Although a few lambs may die after weaning, the target for post‑weaning mortality rates should be low. The total lamb mortality can be calculated by adding pre- and post-weaning mortality rates.
Pre-weaning mortality = (number of lambs born – number of lambs weaned) ÷ number of lambs born × 100
Post-weaning mortality = (number of lambs weaned – number of lambs marketed – lambs retained as breeding stock) ÷ number of lambs born × 100
Total lamb mortality = pre-weaning mortality + post-weaning mortality
Adult mortality and culling
Occasional adult mortalities are unavoidable, but the targets for adult mortality rates should be low. Adult mortality represents a significant cost both in terms of care for the ewe, productivity of the flock and the cost of replacement.
Adult mortality rate = number of ewes died or euthanized ÷ average flock inventory × 100
To calculate mortality and culling rates, it’s important to understand the average ewe inventory. Ewe inventories should be taken at consistent time points throughout the year (for example, monthly or quarterly). The average ewe inventory is calculated by adding up the number of ewes counted throughout the periods (months or quarters) and dividing by the number of inventory counts.
Average flock inventory = total ewes counted ÷ number of inventory counts
Pre-mature deaths or involuntary culls of ewes under the age of 6 are referred to as ewe wastage in New Zealand. In addition to replacement costs, ewe wastage lowers the average age of animals in the flock, meaning more ewes will be of a younger age and have a lower reproductive rate.
On average, sheep flocks typically have a total culling rate of about 15% of the ewes each year (Table 4). The culling rate includes both involuntary (for example, infertile, mastitis, lameness) or voluntary (for example, low prolificacy, poor mothering ability, poor temperament) reasons for the removal of animals.
Involuntary culling represents the random removal of animals that is not within the shepherd’s control, which is undesirable, as ewes may be lost that are otherwise productive. Consequently, productive flocks should aim to have a higher proportion of voluntary culls.
It is also beneficial to track the causes of the culls over time. A high number of involuntary culls for a specific health problem may indicate that a review of the flock management or health plan is needed.
Involuntary culling rate = (Total adult mortalities + total culled for poor health) ÷ average ewe inventory × 100
Voluntary culling rate = total culled for poor production ÷ average ewe inventory × 100
Total culling rate = involuntary culling rate + voluntary culling rate
| Trait | Annual production | Accelerated production |
|---|---|---|
| Adult mortality rate | 2% | 4% |
| Total culling rate | 15% | 15% |
Lamb growth targets
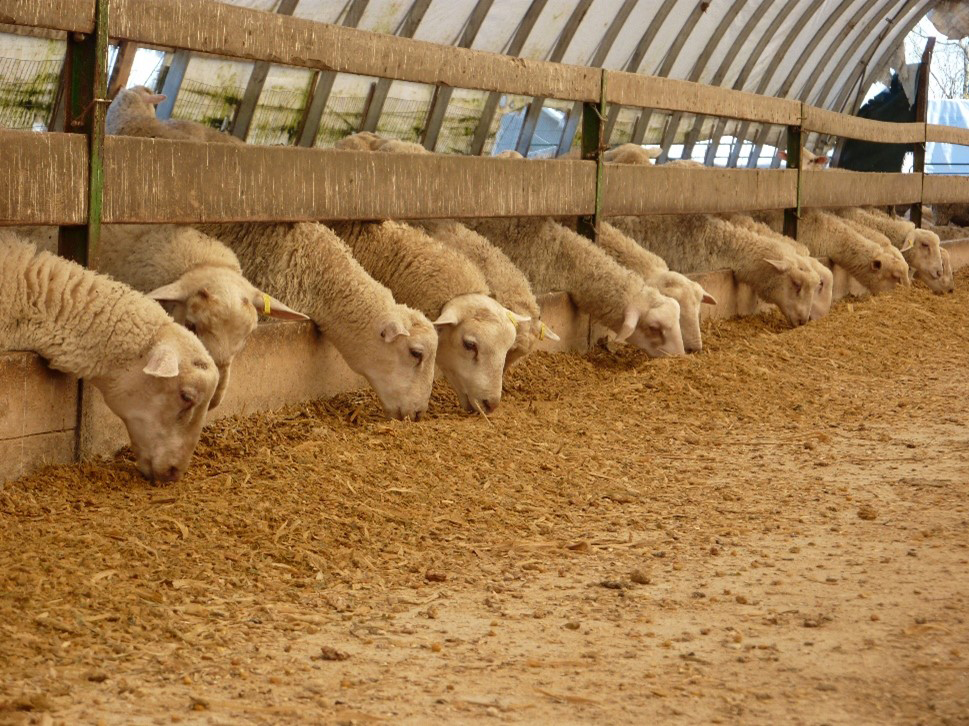
Meat lamb enterprises aim to grow lambs efficiently to minimize the number of days on feed and the cost of production (Figure 3). Some important growth traits include:
- average daily gain
- adjusted weights
- days to market
- age and weight at first breeding for replacements
The production targets for lamb growth rates will vary depending on management and production systems as well as the genetics of the flock. Lambs reared more intensively have more resources invested, thus, higher growth rates are expected. For example, lambs that are reared in a feedlot system should be expected to have faster growth and lower days to market than lambs finished on pasture. More information on factors influencing lamb growth traits is available in the OMAFRA fact sheets Predicting lamb carcass weight and Predicting lamb finishing dates.
Average daily gain
Average daily gain (ADG) is a measure of a lamb’s growth rate. It is the ratio between weight gained for a given period and the length of that period. The ADG calculation assumes that growth is linear (such as an animal’s weight at 80 days is their weight at 79 days plus the ADG). ADG can be calculated for an individual, or for the group, by using average weights and ages.
Average daily gain = weight gained ÷ length of gain period
Pre-weaning average daily gain = (weaning weight – birthweight) ÷ weaning age
Post-weaning average daily gain = (market weight – weaning weight) ÷ (market age – weaning age)
Total average daily gain = (market weight – birthweight) ÷ market age
Typically, post-weaning ADG is a more important indicator of growth efficiency than pre-weaning ADG. When comparing a similar management system and nutrition program, a faster post-weaning ADG generally indicates more efficient production (Table 5).
| Trait | Stage | Non-prolific | Prolific |
|---|---|---|---|
| Average daily gain | pre-weaning (0–50 days) | 0.33 kg (0.73 lb) | 0.26 kg (0.57 lb) |
| Average daily gain | post-weaning (50–100 days) | 0.34 kg (0.75 lb) | 0.30 kg (0.66 lb) |
| Average daily gain | total | 0.33 kg (0.73 lb) | 0.28 kg (0.62 lb) |
| Weight | birth | 5 kg (11 lb) | 3.5 kg (8 lb) |
| Weight | 50 days | 21.5 kg (47.5 lb) | 16 kg (35.5 lb) |
| Weight | 100 days | 38.5 kg (85 lb) | 31 kg (68.5 lb) |
| Average days to market | 29.5 kg (65 lb) | 74 days | 92 days |
| Average days to market | 36.5 kg (80 lb) | 95 days | 117 days |
| Average days to market | 43 kg (95 lb) | 115 days | 141 days |
| Average days to market | 50 kg (110 lb) | 136 days | 165 days |
Adjusted weights
Expected lamb weights at specific ages for market lambs are useful to evaluate the effect of sires. An adjusted weight accounts for the age of the lamb when the weight is measured. This is important because if raw weights are used, lambs born later in the lambing period will be at a disadvantage compared to the earliest born lambs, as they would have had fewer days of growth. The average weights will also likely be skewed depending on the distribution of lambings throughout the lambing period.
Adjusted weights can be calculated for an individual or group of lambs, using birthweights (or an average birthweight) and the ADG for the animal or group. Adjusted weights are generally lower for prolific breeds than non-prolific breeds.
50-Day weight = birthweight + pre-weaning ADG × 50 days
100-Day weight = 50-day weight + pre-weaning ADG × 50 days
Days to market
Days to market is the length of time it takes to rear a lamb from birth to marketing age. Animals that grow faster will reach the same market weight at an earlier age. Since feed costs are the largest expense on the sheep operation, the overall cost of producing a lamb increases the longer they must be fed before reaching a target weight. See the OMAFRA fact sheet Predicting lamb finishing dates for more information on factors influencing days to market.
Days to market can be calculated for individual lambs or as an average across a group, if birth and marketing dates are known for all lambs. Otherwise, a range of days to market can be calculated using first and last lambing and marketing dates.
Individual days to market = marketing date – lambing date
Average days to market = sum of individual days to market ÷ number of lambs marketed
Minimum days to market = first marketing date – last lambing date
Maximum days to market = last marketing date – first lambing date
The production target should be to minimize the average days to market for each lambing group to reduce cost of production (Table 5). Reducing the range of days to market is also beneficial for management purposes, as it indicates more uniform growth of the market lambs.
Replacement lamb growth targets
The lambs retained as replacements are the future breeding stock of the operation and will have an impact on future flock productivity. The goal when rearing replacements is to ensure they are ready to join the breeding flock and be productive at the right time. Since the goals of rearing replacement and market lambs are not the same, it is best if they are managed separately after weaning. See the OMAFRA fact sheet Ewe lamb nutrition for more information.
When rearing replacements, the average age and weight at first breeding are both important traits to monitor. As a rule of thumb, ewe lambs should be at least 65% of their expected mature weight by their first breeding and reach breeding age by approximately 7 months.
Efficient replacement lamb growth will increase reproductive success and reduce the average age of ewes at first lambing and the cost of rearing replacements. Additionally, ewe lambs that fail to conceive can be sold as market lambs (less than 1 year of age) at premium prices, increasing their cull value.
Ewe flock efficiency
There are many factors that influence the productivity and efficiency of the ewe flock. Ewe flock efficiency traits aim to provide a snapshot of overall productivity in the flock while also accounting for cost of production. Some ewe efficiency traits include:
- total lambs marketed per ewe
- total weight of lambs produced
- total weight of lambs produced per ewe weight
- average body condition score
These traits can be measured either on an individual breeding group basis or across a year.
Total lambs marketed per ewe
The total number of lambs marketed per ewe is a measure of the overall performance of the sheep enterprise. Total lambs marketed accounts for reproductive performance (such as fertility and prolificacy) and lamb mortality. It is an easy statistic to calculate, however, it will not necessarily indicate where improvements could be made. It should also be considered relative to the culling and replacement rates of the flock, as lower total lambs marketed in a year could be due to retaining a larger number of replacements to build the ewe flock. The targets for total lambs marketed will vary depending on production system and flock genetics (Table 6).
Total lambs marketed per ewe = total market lambs ÷ average flock inventory
| Trait | Stage | Non-prolific | Prolific |
|---|---|---|---|
| Total weight produced | 50 days | 30.5 kg (67.5 lb) | 33 kg (73 lb) |
| Total weight produced | 100 days | 61.5 kg (135.5 lb) | 51.5 kg (113.5 lb) |
| Total weight produced per ewe weight | weaning | >50% of ewe weight | >50% of ewe weight |
| Total weight produced per ewe weight | market | >100% of ewe weight | >100% of ewe weight |
| Average body condition score | breeding | 3.0–3.5 | 3.0–3.5 |
| Average body condition score | lambing | 3.0 | 3.0 |
Total weight produced
Total weight of lambs produced is an overall indicator of flock productivity that also incorporates lamb growth (Table 6).
Total weight produced (50 days) = average 50-day weight × weaning percentage ÷ 100
Total weight produced (100 days) = average 100-day weight × (weaning percentage ÷ 100) × ((100 − post-weaning mortality rate) ÷ 100)
Total weight produced per ewe weight
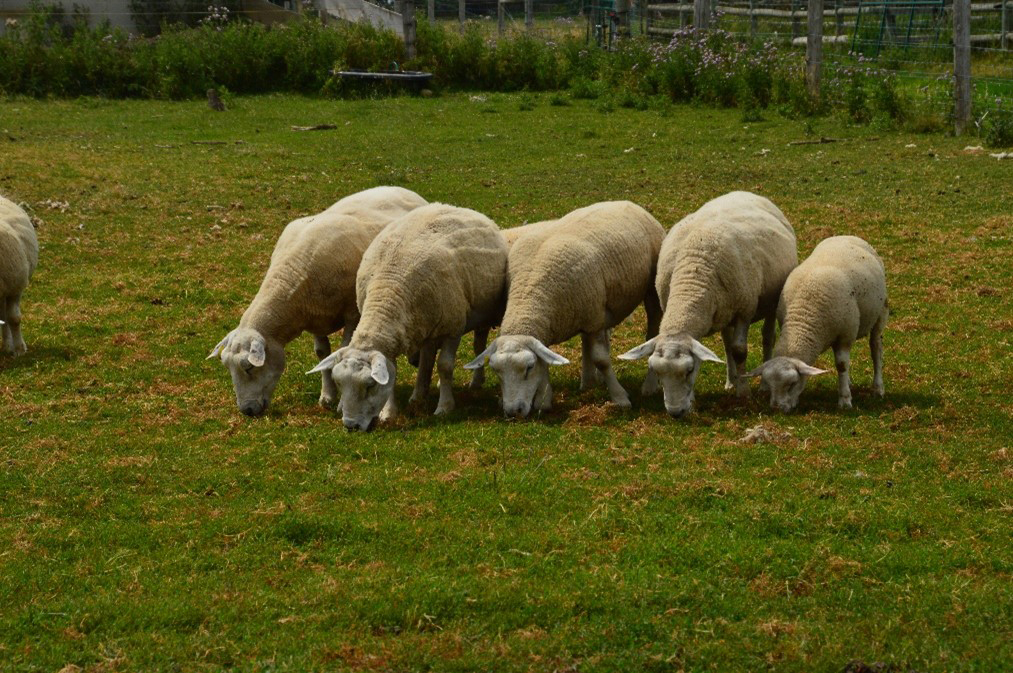
The total weight produced per ewe weight considers both the ewe’s productivity (weight of lambs weaned) as well as the size of mature ewes in the flock (Figure 4). A smaller ewe that produces the same amount of lamb as a larger ewe will be more profitable, since the smaller ewe is expected to consume less feed and have lower maintenance costs. In some countries, the rule of thumb is that a ewe should produce lambs weighing at least 50% of her own weight by weaning and at least 100% of her own weight by market age (Table 6). To use this measure of ewe efficiency, producers should weigh mature ewes of varying ages to determine the average weight of ewes in the flock.
Weight produced at 50 days per ewe weight = total weight produced (50 days) ÷ average mature ewe weight × 100
Weight produced at 100 days per ewe weight = total weight produced (100 days) ÷ average mature ewe weight × 100
Body condition score
The average body condition score (BCS) of the ewe flock is another indicator of production efficiency. It is ideal to keep an average BCS of close to 3 throughout the production cycle (Table 6). It is costly to have an under- or over-conditioned flock. Under-conditioned animals will be less productive and take more resources to achieve the BCS target, while over-conditioned ewes represent inefficient use of feed resources. See the OMAFRA fact sheet Sheep body condition scoring for more information on the value of BCS for flock management.
Conclusion
Setting production targets is critical for evaluation and improvement of flock performance. Individual operations are unique; therefore, production targets must be set within the context of the production system, genetics and management of the flock. There are many KPIs that can be evaluated for reproduction, mortality, lamb growth and ewe efficiency. Improving these traits is key to a productive and profitable sheep flock. The flock productivity workbook provides an example of how basic flock information can be used to calculate the key performance indicators discussed in this fact sheet. This format could be set up in Excel or recorded by hand to provide performance indicators for your flock.
Resources
- American Sheep Industry Association. 2022. Let’s Grow: Best practices to increase your lamb crop fact sheets. 1–50.
- Australian Wool Innovation Limited and Meat and Livestock Australia. 2008. Making more from sheep.
- Beef and Lamb New Zealand. 2022. Data and Tools: Benchmark your farm.
- Beef and Lamb New Zealand. 2013. Making every mating count. 1-96.
- Farrell, L.J., P.R. Kenyon, S.T. Morris, and P.R. Tozer. 2020. The impact of hogget and mature flock reproductive success on sheep farm productivity. Agriculture. 10(11): 566.
- Farrell, L.J., R.R. Tozer, P.R. Kenyon, T. Ramilan, and L.M. Cranston. 2019. The effect of ewe wastage in New Zealand sheep and beef farms on flock productivity and farm profitability. Agricultural Systems. 174:125-132.
- Fetrow, J., K.V. Nordlund, and H.D. Norman. 2006. Invited review: Culling: Nomenclature, Definitions, and Recommendations. Journal of Dairy Science. 89(6):1896-1905.
- Flay. K.J., A.L. Ridler, C.W.R. Compton, and P.R. Kenyon. 2021. Ewe wastage in New Zealand commercial flocks: Extent, timing, association with hogget reproductive outcomes and BCS. Animals. 11:779.
- Ontario Sheep Farmers. 2022. Evaluation of productivity and goal setting.
- Scotland’s Farm Advisory Service. 2020. An introduction to benchmarking for sheep. 1–5.
This fact sheet was written by Erin Massender, acting small ruminant specialist and Delma Kennedy, sheep specialist, OMAFRA.
Appendix 1. Measuring flock productivity workbook
The flock productivity workbook provides an example of how basic flock information can be used to calculate the key performance indicators discussed in this fact sheet. This format could be set up in excel or recorded by hand to provide performance indicators for your flock. Each cell in the chart is referenced by a letter for the column and a number for the row or a formula using these cell references. Cells with just a reference are where flock data is to be recorded. Cells with a formula use that flock from the cells indicated to calculate the key performance indicators.
Please download the fact sheet PDF for access to the Appendix workbook charts.