Predicting lamb finishing dates
Learn ways to predict lamb finishing dates. This technical information is for Ontario sheep producers.
ISSN 1198-712X, Published January 2019
Introduction
Lamb marketing is the main source of revenue for most Ontario sheep operations. This is an important opportunity to maximize revenue from the lamb crop. Marketing opportunities such as holiday markets, forward contracting through a value chain or direct marketing to restaurants or farmers markets can be used to increase revenue. To take advantage of these opportunities, it is important to be able to forecast lamb production and predict when lambs will be finished and ready for the marketplace. This factsheet will describe how to estimate when lambs will be available for market. The companion Ontario Ministry of Agriculture, Food and Rural Affairs (OMAFRA) factsheet, “Forecasting lamb production,” describes the factors affecting the number of lambs available for market and how to estimate the number of market lambs that will be available at the time of breeding the ewes.
After estimating how many lambs will be available to market, it is also important to estimate when those lambs will reach market weight. This provides the opportunity to adjust breeding dates to target specific markets and/or allows planning for direct marketing or forward contracting through a value chain.
Growth rate
Growth rate is affected by the animals' own ability to grow, gender (intact rams grow faster) and a number of environmental influences. Up to weaning, the main environmental influences are: birth weight, ewe milk supply, health and creep feed available. After weaning, the main environmental influences are lamb health and feed quantity and quality. Growth rate can vary significantly, based on these genetic and environmental factors. On average, animals tested on the Canadian performance testing program (GenOvis) gain 0.29 kg/day (0.64 lb/day) between 50 and 100 days of age. Table 1 illustrates that there can be significant differences between breeds. On average, Suffolk animals are larger than Dorset or Rideau sheep and grow faster.
Growth rate is significantly affected by feed quality and quantity. Table 2 shows the gains and slaughter ages for 75% Suffolk lambs who were on three different feeding systems.
| Breed | Number ofproducers | Number of lambs born | Average birth weight (kg) | Average adjusted 50-day weight (kg) | Average adjusted 100-day weight (kg) | Average daily gain (ADG) (kg) |
|---|---|---|---|---|---|---|
| Dorset | 44 | 3,066 | 4.6 | 24.5 | 39.3 | 0.30 |
| Rideau | 36 | 8,413 | 3.9 | 23.2 | 37.6 | 0.29 |
| Suffolk | 37 | 1,916 | 5.0 | 26.1 | 45.3 | 0.37 |
| Crossbred | 101 | 13,644 | 4.4 | 22.1 | 37.1 | 0.29 |
| All breeds tested | 191 | 48,945 | 4.4 | 22.5 | 37.4 | 0.29 |
| Management system | Number of lambs | Prewean gain | Post Wean gain | Lifetime average daily gain (ADG) | Slaughter weight | Slaughter age |
|---|---|---|---|---|---|---|
| Born Nov, Dec, Jan, fed concentrates | 111 | 0.60 lb (0.272 kg) | 0.75 lb (0.342 kg) | 0.68 lb (0.310 kg) | 113.1 lb (51.3 kg) | 156 days |
| Born Jan, Feb, fed 60 days creep, then pasture | 170 | 0.63 lb (0.286 kg) | 0.47 lb (0.211 kg) | 0.52 lb (0.236 kg) | 111.1 lb (50.4 kg) | 204 days |
| Born Mar, Apr, fed 30 days creep, then pasture | 147 | 0.60 lb (0.270 kg) | 0.38 lb (0.172 kg) | 0.45 lb (0.202 kg) | 111.1 lb (50.4 kg) | 234 days |
Notter found that gain to weaning was similar in all three lambing seasons. Lambs that were fed concentrated feed, rather than finished on pasture, gained faster, with significantly fewer days to slaughter. It is important to know how fast lambs are gaining in order to estimate when they may reach market weight. Assuming a weaning weight of about 22.7 kg (50 lb) at a weaning age of 70 days, Table 3 shows lamb weight to days of age at four different rates of gain.
| Age | Rates of ADG 0.45 lb (0.204 kg) | Rates of ADG 0.55 lb (0.25 kg) | Rates of ADG 0.65 lb (0.30 kg) | Rates of ADG 0.75 lb (0.34 kg) |
|---|---|---|---|---|
| 70 days - weaning | 50.0 (22.7) | 50.0 (22.7) | 50.0 (22.7) | 50.0 (22.7) |
| 80 days | 54.5 (24.7) | 55.5 (25.2) | 56.5 (25.6) | 57.5 (26.1) |
| 90 days | 59.0 (26.8) | 61.0 (27.7) | 63.0 (28.6) | 65.0 (29.5) |
| 100 days | 63.5 (28.8) | 66.5 (30.2) | 69.5 (31.5) | 72.5 (32.9) |
| 110 days | 68.0 (30.8) | 72.0 (32.7) | 76.0 (34.5) | 80.0 (36.3) |
| 120 days | 72.5 (32.9) | 77.5 (35.2) | 82.5 (37.4) | 87.5 (39.7) |
| 130 days | 77.0 (34.9) | 83.0 (37.6) | 89.0 (40.4) | 95.0 (43.1) |
| 140 days | 81.5 (37.0) | 88.5 (40.1) | 95.5 (43.3) | 102.5 (46.5) |
| 150 days | 86.0 (39.0) | 94.0 (42.6) | 102.0 (46.3) | 110.0 (49.9) |
| 160 days | 90.5 (41.1) | 99.5 (45.1) | 108.5 (49.2) | 117.5 (53.3) |
| 170 days | 95.0 (43.1) | 105.0 (47.6) | 115.0 (52.2) | 125.0 (56.7) |
| 180 days | 99.5 (45.1) | 110.5 (50.1) | 121.5 (55.1) | 132.5 (60.1) |
| 190 days | 104.0 (47.2) | 116.0 (52.6) | 128.0 (58.1) | 140.0 (63.5) |
Live lamb grading
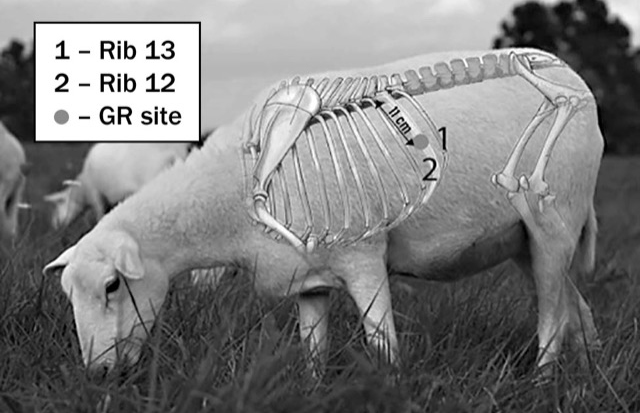
Raising lambs to a specific weight or weight range will not guarantee a good quality product. It is important that market lambs have an appropriate finish or amount of fat over the back and ribs when they are sent to market. Smaller sheep grow slower, have a smaller mature weight and are fatter at a lighter weight and an earlier age than large sheep. Lambs become fat because they have been fed beyond their ideal weight. In Canada, lamb grading standards measure carcass fat at the girth rib (GR) site, which is 11 cm off the midline at the 12th rib, as shown in Figure 1.
Find the 12th rib by first locating the short rib transverse processes. The first long rib before the short rib transverse processes start is rib 13, move to the next long rib, which will be rib 12, and measure 11 cm down the rib from the spine to find the GR location. The fat score is actually an estimate of tissue depth at this site.
| Fat score | GR tissue depth | Feel at the 12th long rib |
|---|---|---|
| 1 | 0-5 mm |
|
| 2 | 6-10 mm |
|
| 3 | 11-15 mm |
|
| 4 | 16-20 mm |
|
| 5 | 21+ mm |
|
Australia also measures fat at this location and gives the following explanations on how to fat score and categorize lambs on a live basis.
"The scorer must work fingers through the wool to skin level before feeling for fat cover over the rib bones. To assess fatness at the GR site place your thumb on the back line over the 12th rib. This will give you an early indication of tissue coverage. Holding your thumb on the back line, place fingers down over what is the eye muscle to a position 110 mm (4 in.) from the middle of the backbone on the 12th rib. The fat score is determined by making a comparison between the palpation description and the scores provided in the fat score table."
Calculating days to market
To accurately predict days to market, the expected growth rate must be known. A rough estimate of growth rate can be obtained from your lambing and marketing records. Using sale records, the sale dates and average weights can be used to estimate days to market and average daily gain on lambs sold in the past. In the example below (Table 5), Group 1 (the first group of lambs marketed out of the lambing group) assumes that the first lambs marketed were born on the first day of lambing with an average birth weight of 1.8 kg (4 lb) used to calculate days to market and average daily gain. This is a conservative estimate of days to market and average daily gain (ADG) of the lambs sold, due to the fact that if lambs were sold that were born after the first day of the lambing, they would have been growing faster.
| Market group | (A) Start lambing | (B) End lambing | (C) Sale date | No. Marketed | Average birth weight | Average sale weight | Weight gained | Days to market | ADG |
|---|---|---|---|---|---|---|---|---|---|
| Group 1 | 10 Apr | 10 May | 01 Oct | 10 | 5 lb (2.27 kg) | 106 lb (48.1 kg) | 101 lb (45.8 kg) | (C-A): 174 | 0.580 lb (0.263 kg) |
| Group 6 | 10 Apr | 10 May | 30 Nov | 10 | 5 lb (2.27 kg) | 106 lb (48.1 kg) | 101 lb (45.8 kg) | (C-B): 204 (C-A): 234 | 0.495 lb (0.225 kg) 0.432 lb (0.196 kg) |
Market group 6 example, using Table 5
Days to market range:
sale date - start of lambing date = 234 days;
sale date - end of lambing date = 204 days.
Lambs sold on November 30 ranged in age from 204-234 days of age.
Average daily gain (ADG) range:
204 (days of age)/101 lb or 45.8 kg (weight gained) = 0.495 lb/day or 0.225 kg/day;
234 (days of age)/101 lb or 45.8 kg (weight gained) = 0.432 lb/day or 0.196 kg/day.
Lambs sold on November 30 were gaining between 0.432 lb (0.196 kg) and 0.495 lb (0.225 kg) per day.
It is unlikely that lambs born at the end of the lambing will be in the first group of lambs marketed from that lambing. But later market groups could have lambs that were born throughout the lambing period. Then it is worthwhile to calculate the possible days to market and ADG for lambs born at the beginning and the end of the lambing for that market group to provide a range of potential days to market and average daily gain.
Ideally, days to market and average daily gain could be calculated for each animal. This would provide a much more accurate picture of the performance of the animals in the flock. However, using lambing dates and market receipts provides a reasonable estimate of how long it takes lambs to reach the marketplace using information already collected. Days to market can then be used to predict when lambs will be ready for market and monitor changes between years.
Managing days to market
Although lambs are marketed in specific weight ranges, the final decision on whether a lamb is ready for market should be based on fat score as well as weight. If lambs are reaching the fat score before the desired weight, larger terminal sires need to be used to be able to increase weight at the same fat score. Female and wether lambs will also tend to have more fat cover than ram lambs at the same weight. Lambs grown at slower rates may also be leaner at the same weight. Ideally lambs would be weighed once a month after weaning to check average daily gain and monitor fat score to ensure lambs are marketed at a fat score of 2 or 3. Once lambs are being shipped from a lambing group, the lambs should be weighed and fat scored every 2 weeks to ensure lambs meet the target weight range and fat score.
Conclusions
Forecasting lamb production must be done using estimated average daily gain and days to market for each flock, due to the large number of variables that are influenced by flock management. Market dates can be estimated using breeding dates and growth rates to a particular weight, but lambs must be monitored and marketed when they are at the ideal fat score for the market. To achieve specific carcass weights, dressing percent must be monitored and can vary considerably with season, breed, gender, fatness, muscling and time off feed. More information on this can be found in the OMAFRA factsheet “Predicting lamb carcass weight.” Monitoring results on each farm will lead to good predictions of days to market and lamb finishing to ensure accurate market planning.
This fact sheet was written by Delma Kennedy, Sheep Specialist, Elora, OMAFRA.
Footnotes
- footnote[1] Back to paragraph (n.d.). Retrieved September 16, 2020, from https://www.ontariosheep.org/genovis
- footnote[2] Back to paragraph Notter, D.R., R.F Kelly, F.S. McClaugherty. 1991. Effects of ewe breed and management system on efficiency of lamb production: ll. Lamb growth, survival and carcass characteristics. J. Anim. Sci. 69:22-33.
- footnote[3] Back to paragraph MLA Live Assessment Yard Book, Sheep and Lamb. 2005. Accessed October 10, 2015.