Report on resources
Performance measures and achievements
| Performance measures | 2018–2018 achievement (target) |
|---|---|
| Percentage of court clients whose maximum wait time for counter service is 30 minutes | 89.1% (85%) |
| Percentage of cases that proceeded to family mediation that reached full or partial settlement **** | 77.8% (76%) |
| Percentage of Family Law Information Centre (FLIC) clients satisfied with FLIC services | 83.9% (90%) |
| Percentage of family mediation clients satisfied with Family Mediation Services | 92.1% (90%) |
| Percentage of family law clients satisfied with the services they received in the Mandatory Information Program (MIP) | 80.5% (70%) |
| Percentage of Small Claims Court customers whose default judgments were issued within five business days once the filed requisitions for default judgments were complete and judicial direction, if required, had been obtained | 82.7% (90%) |
| Percentage of Civil Court customers whose default judgments were issued within five business days once the filed requisitions for default judgments were complete and judicial direction, if required, had been obtained | 85.5% (90%) |
| Percentage of Civil Court customers whose certificates of Appointment of Estate Trustee were issued within 15 business days once the applications were complete and judicial direction, if required, had been obtained | 76.9% (90%) |
| Percentage of clients with a disability who access court services, and who ask for assistance in meeting their disability-related needs, were satisfied with the help they received | 78% (85%) |
| Percentage of clients who were served in a courteous, professional and respectful manner | 92% (100%) |
| Percentage of court forms and guides that are available in French and English | 88.2% (100%) |
| Percentage of court locations that have an accessibility coordinator assigned | 98% (100%) |
**** Full settlement reflects agreement on all issues brought to mediation, whether on a final or temporary basis.A partial agreement reflects an agreement on one or more of the issues brought to mediation, whether on a final or temporary basis. Settlement in this KPI refers to mediation settlement and does not necessarily reflect settlement of the court case itself for those who have also initiated court action.
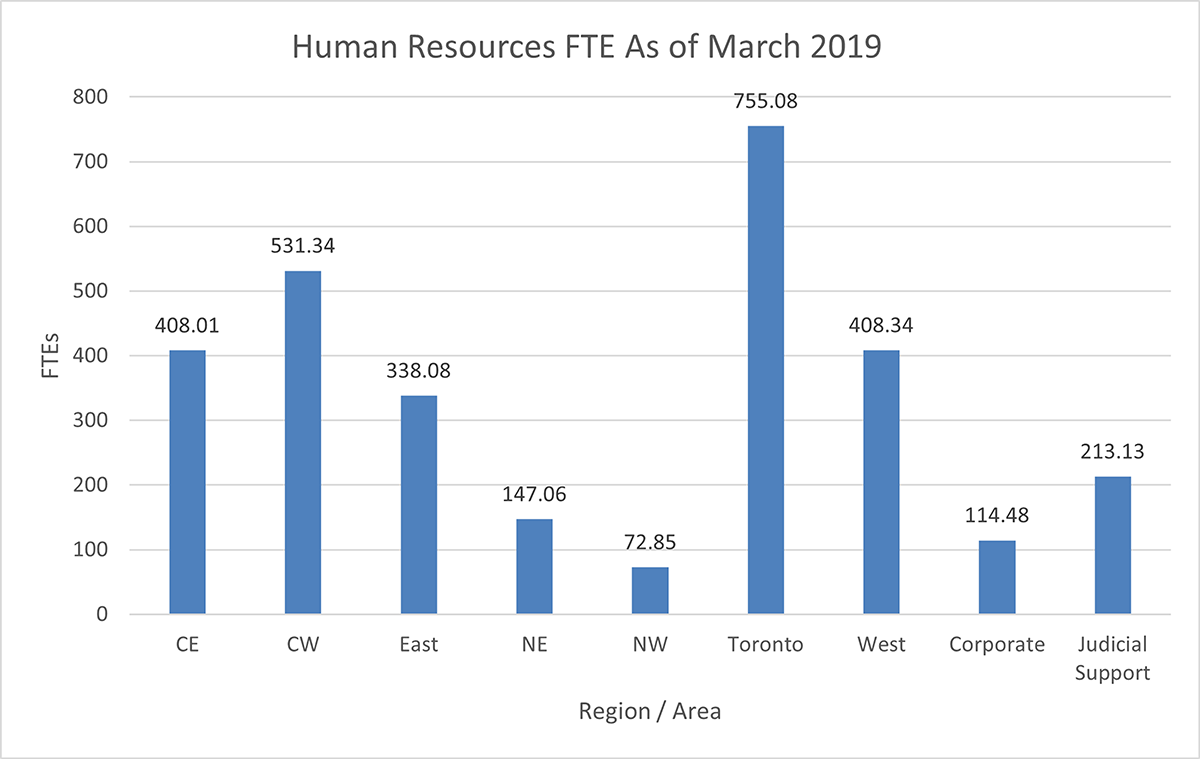
Human Resources FTE as of March 2019
Region/Area
Central East
Central West
East
North East
North West
Toronto
West
Corporate
Judicial support
Download printer-friendly Bar Chart (PNG).
Notes:
- Data Source: FTE Tracker Tool — MAG Analytics Dashboard
- FTE numbers are a “point in time” count of active employees as of the last business day in March each year.
- FTE numbers convert all part-time employees to an equivalent full-time number. For example, a regular part-time employee working 21.75 hours per week is counted as 0.6 FTE, while a full-time employee is counted as one FTE.
- There are a total of 2,988.37 FTEs in Court Services Division as of March 2019
- Divisional FTEs do not include members of the judiciary.
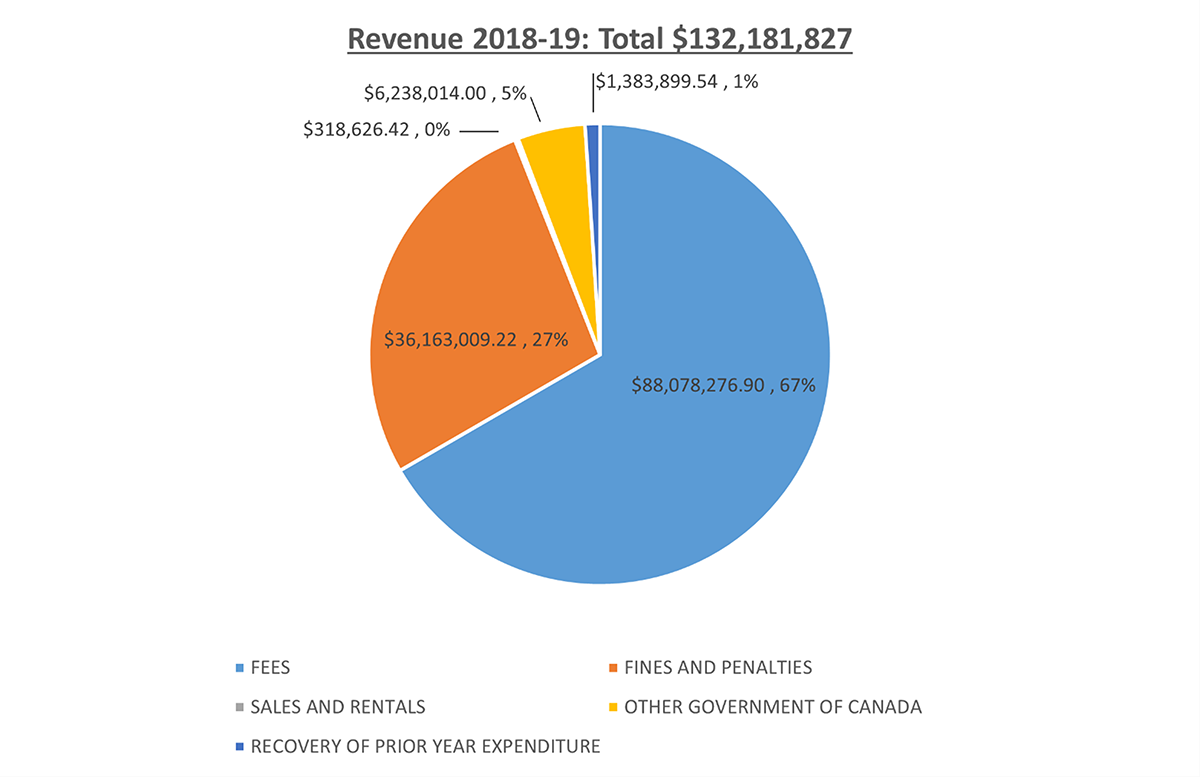
- Fees 67% $88,078,276.90
- Fines and Penalties 27% $36,163,009.22
- Sales and Rentals 0% $318,626.42
- Other Government of Canada 5% $6,238,014.00
- Recovery of prior year expenditure 1% $1,383,899.54
Download printer-friendly chart (PNG).
2018–2019 Statement of Expenditures
| Administration of justice | Amount |
|---|---|
| Salaries and wages | $158,376,224 |
| Employee benefits | $31,096,705 |
| Transportation and communication | $9,912,180 |
| Services | $62,793,732 |
| Supplies and equipment | $4,782,475 |
| Transfer payment | $1,340,451 |
| Total: | $268,301,767 |
| Judicial services | Amount |
| Salaries and wages | $149,712,268 |
| Employee benefits | $11,733,134 |
| Transportation and communication | $2,930,225 |
| Services | $18,490,332 |
| Supplies and equipment | $468,116 |
| Transfer payments | $231,951 |
| Total: | $183,566,026 |
| Bad debt expense | $2,525,900 |
| Total operating expenditures | $454,393,693 |
| Total operating allocation | $459,239,500 |
| Capital expenditures | $43,196,926 |
| Capital allocation | $45,420,200 |
Source: Public Accounts of Ontario, 2018–2019
Updated: October 25, 2022
Published: October 25, 2022