Report on resources
Memoranda of Understanding between the Attorney General and the Chief Justices
In accordance with section 72 of Ontario’s Courts of Justice Act, the Attorney General may enter into an MOU with each of the chief justices governing any matter relating to the administration of the respective court.
MOUs for the COA of Ontario dated May 24, 2012, the SCJ dated May 5, 2008 and the OCJ dated August 24, 2016 are in place.
Resource-based allocation model
CSD is responsible for ensuring the allocation of funds and human resources based on evidence and data. CSD relies on a number of data sources and tools to support and manage our business.
The division is responsible for collecting, storing, managing and analyzing operational data on court activity, human resources and financial expenditures. This data is collected from many sources, such as court information databases, surveys and enterprise-wide financial and human resources systems. The information gathered from these sources is used to support the maintenance of a defined and metric-based methodology to develop individual budget allocations within CSD on an annual basis. The goal for CSD’s resource allocation model is to ensure that financial and human resources are allocated to best support operational needs, based on key workload metrics.
This approach to resource allocation ensures that CSD is supporting the government’s commitment to being accountable and fiscally sustainable. CSD is committed to being an open and transparent organization. To this end, financial statements are included in the Expenditure Estimates and Public Accounts, which are available to the public.
Establishing and maintaining key performance indicators
Performance indicators are an important method that contribute to the goal of public confidence and trust in the justice system.
CSD tracks KPIs to ensure it meets its own vision of being a modern and professional court service that supports accessible, fair, timely and effective justice services. As a division within MAG, CSD’s performance measures also support the ministry’s vision of being an innovative, sustainable and responsive justice system that inspires public confidence and upholds the rule of law.
CSD’s performance indicators include the overall cost per capita of administering justice to Ontarians, the percentage of clients who are satisfied with the service they receive, the number of clients who are engaging in the use of electronic service channels and the maintenance of service standards. These performance indicators are reflected in the ministry’s results and are also reported to Treasury Board Secretariat on an annual and ad hoc basis.
A summary of KPI findings is below.
Performance measures and achievements
| Performance Measures | 2019-2020 Achievement (Target) |
2020-2021 Achievement (Target) |
2021-2022 Achievement (Target) |
2022-2023 Achievement (Target) |
|---|---|---|---|---|
| Percentage of “attended” and “confirmed” court interpreter assignments that were performed by ministry-accredited interpreters | 90.7% (85%) |
94.5% (85%) |
97.71% (85%) |
96.33% (85%) |
| Percentage of cases that proceeded to family (on-site and off-site) mediation that reached full or partial settlement* | 79.3% (76%) |
76.0% (76%) |
75.2%* (76%) |
74.9% (76%) |
| Percentage of Family Law Information Centre (FLIC) clients satisfied with FLIC services | 81.6% (90%) |
48.2%** (90%) |
80.5%** (90%) |
79.5% (90%) |
| Percentage of family mediation clients satisfied with family mediation services | 92.6% (90%) |
77.8% (90%) |
73.7% (90%) |
84.3% (90%) |
| Percentage of family law clients satisfied with the services they received in the Mandatory Information Program (MIP) | 82.1% (70%) |
89.9% (70%) |
87.7% (70%) |
80.9% (70%) |
| Percentage of Small Claims Court customers whose default judgments were issued within 5 business days once the filed requisitions for default judgments were complete and judicial direction, if required, had been obtained | 74.3% | 71.36% | 79.86% | 69.82% |
| Percentage of civil court customers whose default judgments were issued within 5 business days once the filed requisitions for default judgments were complete and judicial direction, if required, had been obtained | 80.2% | 78.31% | 92.28% | 81.78% |
| Percentage of estates court clients whose certificates of Appointment of Estate Trustee were issued within 15 business days once the applications were complete and judicial direction, if required, had been obtained | 63.6% | 65.11% | 58.08% | 51.55% |
| Percentage of civil documents processed through online filing portals | 6.8% | 65.5% | 80.9% | 84.05% |
| Percentage of family documents processed through online filing portals | 0.6% | 24.4% | 52.3% | 56.52% |
| Percentage of Small Claims Court documents processed through online filing portals | 17.4% | 42.7% | 68.3% | 69.65% |
* Full settlement reflects agreement on all issues brought to mediation, whether on a final or temporary basis. A partial agreement reflects an agreement on one or more of the issues brought to mediation, whether on a final or temporary basis. Settlement in this KPI refers to mediation settlement and does not necessarily reflect settlement of the court case itself for those who have also initiated court action.
** In 2020, FLIC spaces were closed due to provincial restrictions, and uptake of family mediation and information services decreased. It took service providers some time to adjust to the virtual environment and to set up virtual services. Feedback received from individuals who indicated being dissatisfied included: not being able to access information, offices being closed, not having the right telephone number to speak to someone and form issues. In-person services have since resumed.
Criminal Justice Video Strategy: In-custody court appearance by type (audio, in-person and video)
Average composition of in-custody appearance types as a proportion of all appearances, by month
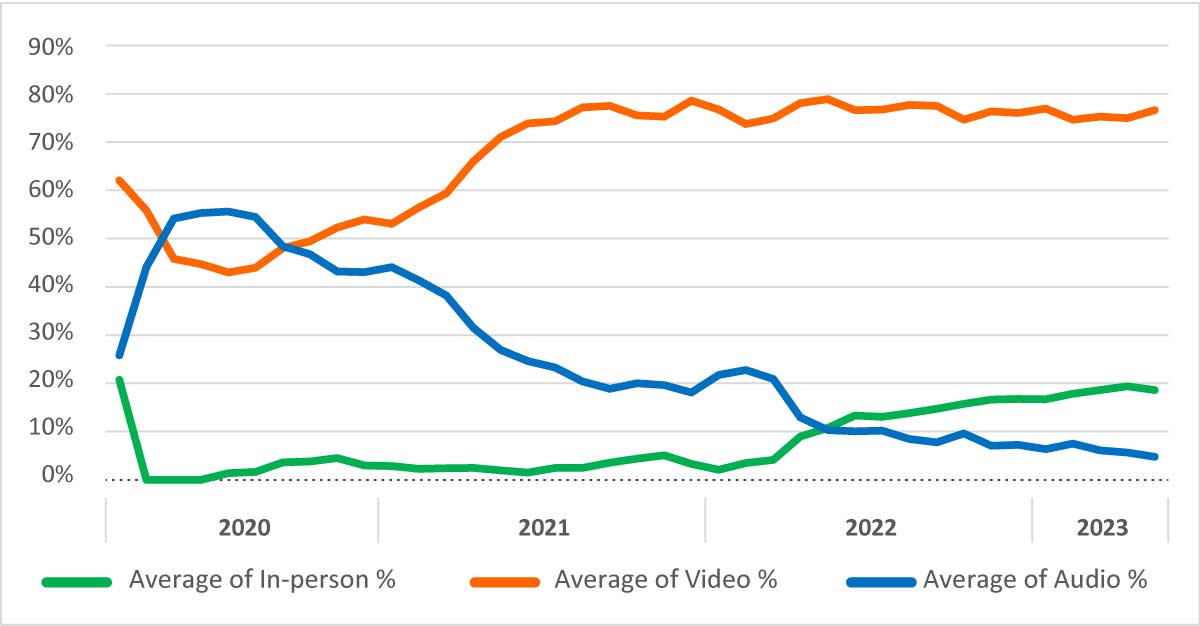
| Year | Average of video % | Average of in-person % | Average of audio % |
|---|---|---|---|
| 2020–2021 | 50% | 2% | 47% |
| 2021–2022 | 75% | 3% | 22% |
| 2022–2023 | 77% | 15% | 9% |
*Data provided by the Ministry of the Solicitor General of Ontario
- With the growing total court appearances, video appearances continue to compose 77% of overall appearances.
- Audio appearances continue to be replaced by either video or in-person. Over the last year, the decrease in audio appearances equaled the increase in in-person appearances.
Human resources by region / area
Human resources full-time equivalents (FTEs) as at end of each fiscal year
| Regions/Branches | March 2020 | March 2021 | March 2022 | March 2023 |
|---|---|---|---|---|
| Central East Region | 415.15 | 419.88 | 435.82 | 427.38 |
| Central West Region | 525.77 | 504.56 | 551.05 | 569.39 |
| East Region | 343.51 | 361.84 | 352.67 | 353.74 |
| Northeast Region | 160.14 | 158.43 | 167.68 | 185.2 |
| Northwest Region | 70.84 | 69.06 | 77.22 | 80.32 |
| Toronto Region | 723.76 | 664.03 | 695.59 | 701.67 |
| West Region | 420.32 | 419.72 | 451.51 | 487.46 |
| Corporate Branches | 108.17 | 124.55 | 130.48 | 124.92 |
| Judicial Support | 213.32 | 248.78 | 267.39 | 270.1 |
| Total: | 2,980.98 | 2,970.85 | 3,129.41 | 3,200.18 |
Notes:
- Data Source: FTE Tracker Tool – Ministry of the Attorney General Analytics Dashboard
- FTE numbers are a “point in time” count of active employees as of the last business day in March each year.
- FTE numbers convert all part-time employees to an equivalent full-time number. For example, a regular part-time employee working 21.75 hours per week is counted as 0.6 FTE, while a full-time employee is counted as 1.0 FTE.
- There are a total of 3200.18 FTEs in Court Services Division as of March 2023
- Divisional FTEs do not include members of the judiciary.
Statement of Revenue for Court Services Division
| Revenue lines | 2020-2021 Amount | 2021-2022 Amount | 2022-2023 Amount |
|---|---|---|---|
| Fees | $74,401,248 | $81,720,762 | $83,778,117 |
| Fines and Penalties | $25,472,246 | $38,993,721 | $37,485,340 |
| Reimbursement of Expenditures | $7,925,327 | $11,904,774 | $16,873,770 |
| Revenue from the Government of Canada | $5,466,749 | $7,968,614 | $5,987,598 |
| Other Revenues* | $217,498,768 | $2,316,815 | $21,783,371 |
| Total: | $330,764,338 | $142,904,685 | $165,908,196 |
Source: Integrated Financial Information System (IFIS)
*Recognition of accounts receivables from Provincial Offences Act Victim Fine Surcharges and related revenue, as recommended by the Auditor General of Ontario.
Statement of Expenditures for Court Services Division
| Administration of justice | 2020-2021 Amount |
2021-2022 Amount |
2022-2023 Amount |
|---|---|---|---|
| Salaries and Wages | $158,751,299 | $176,648,065 | $181,476,037 |
| Employee Benefits | $28,577,825 | $32,155,106 | $33,225,666 |
| Transportation and Communication | $12,956,816 | $13,481,406 | $11,452,888 |
| Services | $50,244,317 | $53,589,653 | $65,384,119 |
| Supplies and Equipment | $5,118,381 | $4,985,408 | $5,659,362 |
| Transfer Payment | $1,203,914 | $1,351,320 | $1,803,369 |
| Other Transactions* | Not available- | Not available- | $37,208,721 |
| Total: | $256,852,552 | $282,210,958 | $336,210,162 |
| Judicial services | 2020-2021 Amount |
2021-2022 Amount |
2022-2023 Amount |
| Salaries and Wages | $155,134,208 | $170,118,817 | $174,410,349 |
| Employee Benefits | $12,083,927 | $13,424,773 | $14,020,778 |
| Transportation and Communication | $728,944 | $724,524 | $2,491,840 |
| Services | $11,483,405 | $19,445,496 | $22,880,342 |
| Supplies and Equipment | $446,366 | $598,963 | $540,614 |
| Transfer Payments | $231,951 | $410,151 | $321,051 |
| Total: | $180,108,801 | $204,722,724 | $214,664,974 |
| Bad debt expense** | $200,841,490 | $6,811,504 | $29,982,340 |
| Total operating expenditures | $637,802,843 | $493,745,186 | $580,857,476 |
| Total operating allocation | $447,488,900 | $501,883,400 | $560,533,900 |
| Capital expenditures | $51,136,680 | $67,364,267 | $4,595,319 |
| Capital allocation | $52,025,300 | $67,925,600 | $5,818,600 |
Source: Public Accounts of Ontario
*Public Private Partnerships (P3) interest payments were also re-aligned to reflect as an operating expense instead of a capital expense, contributing to the increase.
*Recognition of accounts receivables from Provincial Offences Act Victim Fine Surcharges and related Bad Debt Expense, as recommended by the Auditor General of Ontario.