Introduction
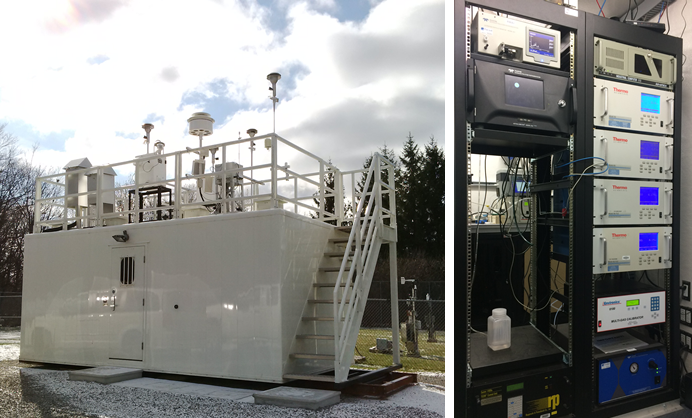
This report summarizes 10-year trends of air quality and the state of ambient air quality in Ontario during 2018. It reports on the major sources of emissions to air, pollutant concentrations measured across the ministry’s ambient air monitoring network, and Ontario’s performance against both provincial and federal ambient air quality criteria that were in effect in 2018. The ministry monitored ambient air quality in real time at 38 air monitoring stations in communities across Ontario in collaboration with the federal National Air Pollutant Surveillance (NAPS) program during 2018. This information was reported 24 hours a day, seven days a week, through the Ministry’s public website.
The ministry’s ambient air monitoring stations are generally representative of regional air quality which reflects the contribution of all sources of air contaminants to air. These air monitoring stations are sited to be representative of general population exposure and thus do not necessarily reflect air quality in locations that are most influenced by local or industrial sources of air contaminants.
Air Quality Health Index monitoring stations
This is a map depicting the 38 Air Quality Health Index monitoring stations across Ontario that were in operation during 2018.
Notes:
- T: telemetry
- NO2: nitrogen dioxide
- PM2.5: fine particulate matter
- O3: ground-level ozone
- SO2: sulphur dioxide
- CO: carbon monoxide
- TRS: total reduced sulphur