Roadside air quality: A pilot study in Toronto
Vehicles are a major source of air pollution in Ontario. Traffic-related air pollution is emitted from vehicle exhausts, fuel evaporation, and non-tailpipe sources such as brakes, tires and road dust, and formed as secondary pollutants in the atmosphere. Traffic-related air pollution can be found up to 250 meters from a major road.
Exposure to traffic-related air pollutants has been linked to a wide range of adverse health outcomes, including respiratory and cardiovascular diseases, cancer, adverse birth and developmental outcomes, and premature mortality. Children, seniors, and people with pre-existing health conditions are more vulnerable to the adverse health effects from traffic-related pollution.
Roadside air monitoring network
The ministry, in partnership with Environment and Climate Change Canada and University of Toronto, has established a network of four roadside air monitoring stations in Toronto to better understand traffic-related air pollution in highly urbanized settings. This network monitors common air pollutants as well as traffic specific pollutants such as ultrafine particles, volatile organic compounds, metals, black carbon, carbon monoxide, and carbon dioxide. It is the first network of its kind in Canada.
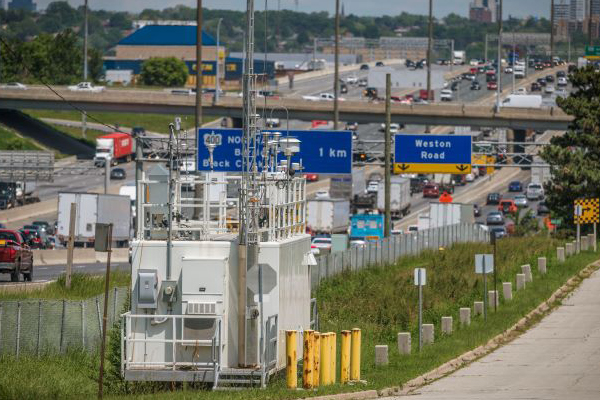
125 Resources Road, Toronto
Latitude: 43.711111
Longitude: -79.543361
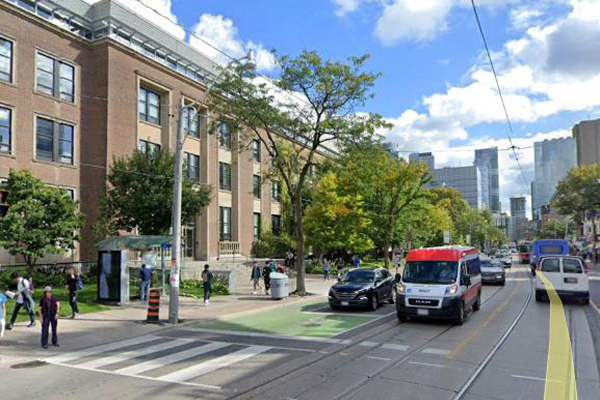
200 College Street, Toronto
Latitude: 43.658996
Longitude: -79.39602
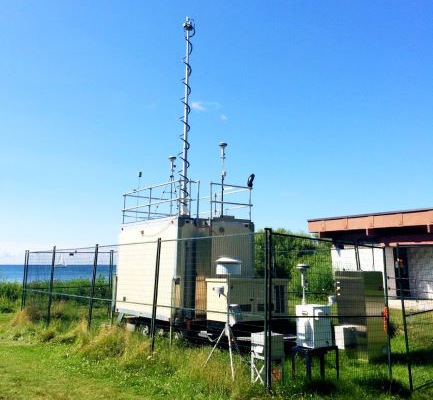
535 Lakeshore Avenue, Toronto Island
Latitude: 43.612222
Longitude: -79.388778
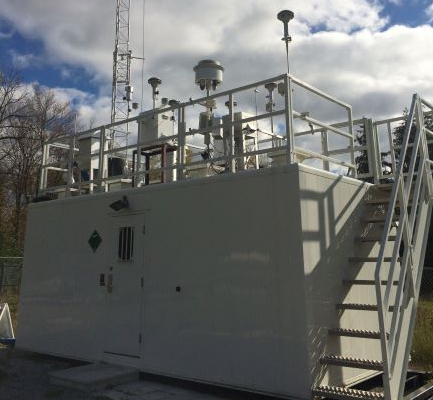
4905 Dufferin Street, Toronto
Latitude: 43.78047
Longitude: -79.467372
Key findings of the roadside air quality pilot study in Toronto
There were five key findings that resulted from the roadside air quality pilot study in Toronto as summarized below. Further details of the complete analyses are available in the Near-Road Air Pollution Pilot Study Final Report.
1. Local traffic is the most significant source of many common air pollutants in the near-road environment
Relative contribution of air pollutants from local traffic and other sources at the Highway 401 roadside station
This is a 100% stacked column chart showing the relative contribution of nitric oxide, ultrafine particles and black carbon from local traffic and from other sources.
- Air pollutants associated with vehicles (e.g., nitrogen oxide, ultrafine particles, and black carbon) are higher beside major roads.
- The majority of the nitrogen oxide, ultrafine particles, and black carbon measured in the near-road environment is due to local traffic.
2. Large trucks disproportionately contribute to air pollution in the near-road environment
Weekday vs weekend relative contribution of black carbon at the Highway 401 roadside station
This is a 100% stacked column chart showing the weekday and weekend relative contribution of black carbon from trucks and cars.
- Large trucks contribute more traffic-related air pollutants than cars.
- Air pollution levels in the near-road environment depend on the proportion of large trucks in the fleet.
- The contribution from large trucks is higher on weekdays than on weekends due to the greater proportion of trucks on the roads during the week.
3. A small proportion of the trucks and cars are responsible for the majority of emissions
Relative contribution of emissions by the top five per cent of emitters at the downtown roadside station
This is a column chart displaying the relative contribution of nitrogen oxides, carbon monoxide and black carbon by the top 5% of emitters.
- Emissions from approximately 100,000 vehicle plumes were estimated in the vicinity of the University of Toronto’s downtown Toronto roadside air monitoring station.
- 5% of vehicles were responsible for a significant proportion of the emissions (24% for nitrogen oxides (NOx), 49% for carbon monoxide (CO), and 66% for black carbon (BC) (Wang et al., 2015).
4. Air pollution levels change seasonally
Levels of nitrogen oxides at different temperatures at the Highway 401 roadside station
This is a scatter plot displayed with a trend line showing the increase in levels of nitrogen oxides on weekdays in colder temperatures.
- Levels of nitrogen oxides (NOx) were higher in cold temperatures.
- Diesel fuel is a major source of NOx. Emissions treatment systems are used to remove/reduce air pollutants like NOx.
- NOx levels were ~4 times higher in colder temperatures on weekdays at the ministry’s Highway 401 roadside air monitoring station, but not on weekends when truck traffic is lower, suggesting that emissions treatment systems of diesel vehicles may not function effectively in cold temperatures.
Seasonal variation of ultrafine particles at the Highway 401 roadside station
This column chart shows that concentrations of ultrafine particles are greater in the winter than in the summer.
- Levels of black carbon were higher in summer.
- Increased levels of black carbon in summer are likely related to seasonal changes in fuel formulation (gasoline and diesel fuel).
Seasonal variation of black carbon at the roadside stations
This is a clustered column chart showing that concentrations of black carbon are greater in the summer than in the winter.
- Levels of ultrafine particles (UFPs) were higher in winter.
- Increased levels of ultrafine particles during the winter suggests more particles are formed in colder temperatures.
5. Tailpipe emissions have decreased over time while non-tailpipe emissions have increased
Contribution of tailpipe and non-tailpipe emissions to PM2.5 at the downtown roadside station from 2004 to 2016
This is a line graph showing that fine particulate matter tailpipe emissions have decreased from 2004 to 2016, while non-tailpipe emissions have increased since 2012 (Evans et al., 2019).
- PM2.5 tailpipe emissions estimated at the Downtown station have decreased over time due to improved vehicle technologies.
- Non-tailpipe particle emissions from tire wear, brake wear, and road surface wear have increased over time reflecting an increase in the number of vehicles on the road and a greater proportion of larger and heavier vehicles (e.g., SUVs) which have greater wear and tear on tires, brakes, and road surface.