2019 Apiculture winter loss report
2019 Honey bee colony winter mortality
Overwinter mortality for 2018-2019 for commercial beekeepers operating in Ontario was estimated to be 23%.
The estimated loss reported for small-scale beekeepers was 26% and the 2019 estimation for honey bee loss averaged between all of Canada was 26%.
Who we surveyed
In the spring of 2019, the survey was distributed to:
- 218 registered commercial beekeepers (defined as operating 50 or greater colonies)
- 400 randomly selected registered small-scale beekeepers (defined as operating 49 or fewer colonies)
The survey is voluntary and all responses are self-reported by beekeepers. Data is not verified by the Ministry of Agriculture, Food and Rural Affairs (OMAFRA) or any other independent body.
Responses were received from 87 commercial beekeepers and 181 small-scale beekeepers which represents 43% of beekeepers who received the survey.
Of the beekeepers who were registered in Ontario as of December 31, 2018, responses were received from 40% of commercial beekeepers representing 48,418 colonies and from 6.5% of small-scale beekeepers representing 1,592 colonies (Tables 1 and 2). Combined, the responses represent 50% of the total number of registered colonies.
Table 1. Number of beekeepers, by region, responding to the 2019 Ontario Apiculture Winter Loss Survey
| Beekeeping regions | # of commercial beekeeper respondents | % of commercial beekeeper respondents | # of small-scale beekeeper respondents | % of small-scale beekeepers respondents |
|---|---|---|---|---|
| Central | 33 | 37.9% | 63 | 34.8% |
| East | 14 | 16.1% | 41 | 22.7% |
| North | 2 | 2.3% | 28 | 15.5% |
| South | 32 | 36.8% | 41 | 22.7% |
| Southwest | 6 | 6.9% | 8 | 4.4% |
Table 2. Estimated overwinter mortality for 2018-2019
| Beekeeper type | # of full-sized colonies put into winter in fall 2018 | # of viable overwintered colonies as of May 15, 2019 | # of non-viable colonies as of May 15, 2019 | Overwinter mortality (%) |
|---|---|---|---|---|
| Commercial | 48,418 | 37,469 | 10,949 | 22.6% |
| Small-scale | 1,592 | 1,186 | 406 | 25.5% |
Results
The estimated overwinter honey bee mortality and the number of respondents varied by beekeeping region (Table 3). Commercial beekeepers reported the greatest losses in the north region while small-scale beekeepers reported the highest losses in the east region. Overall, mortality during the 2018-2019 winter was approximately 2.9 percentage points lower in commercial than small-scale beekeepers (Table 2).
Table 3. Number of commercial and small-scale beekeeper survey respondents and the % overwinter mortality in 2019 for each beekeeping region in Ontario
| Beekeeping region | # of commercial beekeeper respondents | Commercial beekeeper overwinter mortality (%) | # of small-scale beekeeper respondents | Small-scale beekeeper overwinter mortality (%) |
|---|---|---|---|---|
| Central | 33 | 20.5% | 63 | 20.5% |
| East | 14 | 23.4% | 41 | 35.2% |
| North | 2 | 38.5% | 28 | 21.0% |
| South | 32 | 23.9% | 41 | 27.1% |
| Southwest | 6 | 18.3% | 8 | 20.0% |
| Total | 87 | 22.6% | 181 | 25.5% |
When respondents were grouped by operation size (number of colonies managed), the honey bee mortality during the winter of 2018-2019 ranged from 13.0% to 32.2% (Table 4). Beekeepers operating 501 to 1000 colonies reported fewer honey bee colony losses (13%) than all other beekeeping operations. The greatest number of survey respondents had beekeeping operations with fewer than 10 colonies and this group reported an average overwinter honey bee mortality of 27.7%. Operations with 201 to 500 colonies reported the highest overwinter honey bee mortality (32.2%).
Table 4. Overwinter honey bee mortality during the winter of 2018-2019 by size of beekeeping operation (number of colonies operated)
| # of respondents | # of colonies reported in the fall of 2018 | Overwinter mortality (%) |
|---|---|---|
| 135 | <10 | 27.7% |
| 44 | 10-49 | 24.7% |
| 43 | 50-200 | 28.2% |
| 22 | 201-500 | 32.2% |
| 13 | 501-1000 | 13.0% |
| 8 | >1000 | 22.5% |
Main factors of bee mortality
Beekeepers were asked to report on what they believed were the main factors contributing to their overwinter honey bee mortalities; they were able to select as many reasons as they felt were applicable. These opinions may be based on observable symptoms or beekeeper experience, judgment or best estimate.
The most commonly reported factors influencing overwinter mortality (Table 5) by commercial beekeepers included:
- starvation
- poor queens
The most commonly reported factors influencing overwinter mortality (Table 5) by small-scale beekeepers included:
- weather
- starvation
- weak colonies in the fall
Table 5. Contributing factors to honey bee colony mortality during the winter of 2018-2019 as reported by commercial and small-scale beekeepers
| Suspected cause(s) of colony loss | # of commercial beekeepers reporting | # of small-scale beekeepers reporting |
|---|---|---|
| Starvation | 42 | 42 |
| Poor queens | 38 | 29 |
| Weather | 35 | 50 |
| Ineffective varroa control | 19 | 12 |
| Nosema | 14 | 3 |
| Weak colonies in the fall | 32 | 42 |
| Other | 19 | 19 |
| Don’t know | 11 | 29 |
Management practices for pests and disease
Varroa mites (Varroa destructor)
In this survey, beekeepers were asked how they monitored for varroa mite infestations (Figure 1) and which treatments were used at the beginning (spring) and the end (fall) of the 2018 beekeeping season (Table 6).
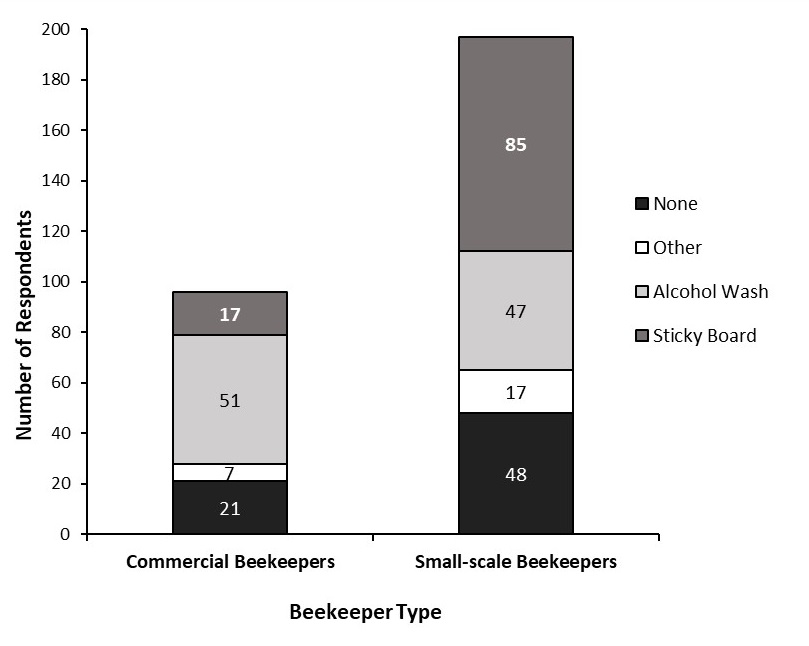
Figure 1. Type of varroa mite monitoring method used by commercial and small-scale beekeepers in 2018. Survey respondents could reply with more than 1 answer.
Accessible description of figure 1
Proportion of beekeepers monitoring for varroa mites
Of the beekeepers who responded to the varroa mite monitoring question, 75% of commercial beekeepers and 73% of small-scale beekeepers stated they monitor for varroa mite infestation in their colonies. Of those, a number of monitoring methods were used, the most common being either an alcohol wash or a sticky board.
Some beekeepers used more than 1 method to monitor for varroa mites. When the response “other” was selected, the beekeeper commonly reported that they visually checked their colonies for varroa mites or used the “sugar shake” method. However, neither of these methods are recommended as visually checking for mites is not proven to yield usable information and the sugar shake method can be unreliable and it is not tied to established thresholds for Ontario. It should also be noted that this survey only addresses whether monitoring took place and does not address the frequency of monitoring.
Treatments used to control varroa mites
Ontario beekeepers use a variety of treatment options to manage varroa mites (Table 6). In spring and fall of 2018, the most common method of varroa mite treatment reported by commercial beekeepers was Apivar®. The survey results suggest that commercial beekeepers also have a preference for using 65% liquid formic acid (40 ml multiple application), Mite Away Quick Strips™ and oxalic acid. Small-scale beekeepers indicated a preference for Mite Away Quick Strips™ over other forms of mite control options.
Bayvarol® was a new treatment option added to the 2019 survey and the survey results indicate that this is not a popular treatment option with either commercial or small-scale beekeepers. The 2 least commonly used treatments by both commercial and small-scale beekeepers were CheckMite+™ and Thymovar. However, the results are encouraging as they demonstrate that Ontario beekeepers are rotating their miticides which is an important strategy for delaying the onset of resistant populations of varroa mites.
Table 6. Treatments reported by commercial and small-scale beekeepers used to control varroa mites in the spring and fall of 2018. Survey respondents could select more than 1 answer.
| Varroa mite treatment (active ingredient) | Spring 2018 # of commercial beekeepers | Spring 2018 # of small-scale beekeepers | Fall 2018 # of commercial beekeepers | Fall 2018 # of small-scale beekeepers |
|---|---|---|---|---|
| Apistan® (fluvalinate) | 6 | 4 | 8 | 8 |
| CheckMite+™ (coumaphos) | 0 | 1 | 1 | 0 |
| Apivar® (amitraz) | 29 | 17 | 42 | 33 |
| Thymovar (thymol) | 1 | 3 | 3 | 7 |
| Bayvarol® (flumethrin) | 4 | 4 | 10 | 6 |
| 65% formic acid – 40 ml multiple application | 17 | 11 | 19 | 12 |
| 65% formic acid – 250 ml single application | 2 | 8 | 4 | 11 |
| Mite Away Quick Strips™ (formic acid) | 13 | 58 | 20 | 57 |
| Oxalic Acid | 10 | 20 | 38 | 48 |
| Other | 4 | 5 | 2 | 7 |
| None | 18 | 51 | 2 | 24 |
Nosema spp. (N. apis and N. ceranae)
The majority of survey respondents did not treat for nosema during 2018 (Table 7). 89% of beekeepers (both commercial and small-scale) who responded to this survey question indicated that nosema treatment was not applied in the spring and 86% of respondents did not treat for the disease in the fall of 2018.
Table 7. Treatments reported by commercial and small-scale beekeepers used to control nosema in the spring and fall of 2018
| Nosema treatment | Spring 2018 # of commercial beekeepers | Spring 2018 # of small-scale beekeepers | Fall 2018 # of commercial beekeepers | Fall 2018 # of small-scale beekeepers |
|---|---|---|---|---|
| Fumagillin | 8 | 18 | 8 | 19 |
| Other | 0 | 3 | 2 | 5 |
| None | 75 | 148 | 71 | 144 |
American foulbrood (Paenibacillus larvae)
The majority of commercial beekeepers (81%) who responded to this survey question treated for American foulbrood (AFB) during 2018 and the most common treatment reported was oxytetracycline (Table 8). 36% of small-scale beekeepers reported treating for AFB in the spring and 37% of small-scale beekeepers used AFB treatments in the fall (Table 8). Lincomycin, a new treatment option in 2019, and Tylosin were the least used treatment options.
Table 8. Treatments reported by commercial and small-scale beekeepers used to control American foulbrood in the spring and fall of 2018
| American foulbrood treatment | Spring 2018 # of commercial beekeepers | Spring 2018 # of small-scale beekeepers | Fall 2018 # of commercial beekeepers | Fall 2018 # of small-scale beekeepers |
|---|---|---|---|---|
| Oxytetracycline | 61 | 57 | 57 | 62 |
| Tylosin | 1 | 0 | 0 | 0 |
| Lincomycin | 1 | 0 | 1 | 0 |
| Other | 0 | 0 | 0 | 0 |
| None | 21 | 105 | 25 | 108 |
Ontario’s overwinter mortality
The Canadian Association of Professional Apiculturists compiles overwinter mortality data provided by each province and publishes an annual report on national honey bee colony losses. Ontario beekeepers have frequently reported overwinter mortalities higher than the national average (Figure 2).
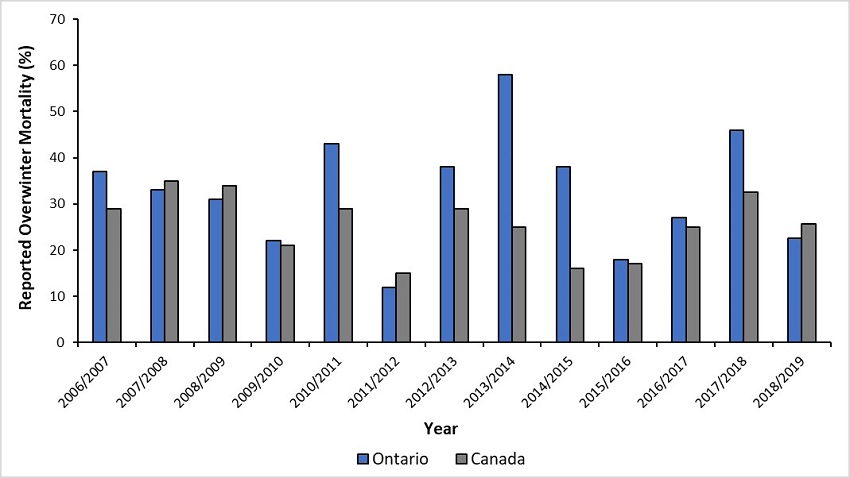
Figure 2. Overwinter mortality (%) reported by commercial beekeepers in Ontario (blue) and Canada (grey) from 2006-2007 to 2018-2019.
Accessible description of figure 2
Accessible image descriptions
Figure 1. Type of varroa mite monitoring method used by commercial and small-scale beekeepers in 2018. Survey respondents could reply with more than 1 answer.
Figure 1 shows the type of varroa mite monitoring method used by commercial and small-scale beekeepers in 2018. Survey respondents could reply with more than 1 answer. Commercial beekeepers reported 17 uses of the sticky board method, 51 uses of the alcohol wash method, 7 uses of other, with 21 reporting no monitoring for varroa mites. Small-scale beekeepers reported 85 uses of the sticky board method, 47 uses of the alcohol wash method, 17 uses of other, with 48 reporting no monitoring for varroa mites.
Figure 2. Overwinter mortality (%) reported by commercial beekeepers in Ontario (blue) and Canada (grey) from 2006-2007 to 2018-2019
Figure 2 shows the percentage of overwinter mortality reported by beekeepers in both Ontario and Canada from 2007 to 2019. The reported overwinter mortality in Ontario and Canada (respectively) was the following : 2007 – 37% and 29%; 2008 – 33% and 35%; 2009 – 31% and 34%; 2010 – 22% and 21%; 2011 – 43% and 29%; 2012 – 12% and 15%; 2013 – 38% and 29%; 2014 – 58% and 25%; 2015 – 38% and 16%; 2016 – 18% and 17%; 2017 – 27% and 25%; 2018 – 46% and 33%; 2019 – 23% and 26%.