This page was published under a previous government and is available for archival and research purposes.
Technical appendix: Assessing Ontario’s Existing Infrastructure
Introduction
This Technical Appendix to the 2017 Long-Term Infrastructure Plan (LTIP) is intended to focus on specific actions the Province has taken, or is planning to undertake, as part of a continuous effort to improve its infrastructure planning process. Specifically, this Appendix provides details on the asset management strategies of key infrastructure ministries and agencies, as well as information about their assets. The Appendix also contains a summary of the analytical tools and research that will support evidence-based decisions and an overview of the three-year plan to transform the planning approach at the provincial level.
This Appendix will be of interest to policy analysts, academics and other researchers who want to know the current state of asset management practices across the government and information on provincial infrastructure assets at a sector level. As well, the Appendix will interest those wishing to understand how the Province is using data and analysis to improve the infrastructure planning process.
The Appendix largely focuses on the progress that the government has made to address the requirements of the Infrastructure for Jobs and Prosperity Act, 2015 (IJPA) and identifies the plans the government has to meet all of the requirements of the IJPA by 2019, as required in the Act. The Act was enacted to encourage evidence-based, long-term infrastructure planning in Ontario.
The IJPA requires the Ministry of Infrastructure to:
- describe the infrastructure that is owned or consolidated by Her Majesty the Queen (HMQ) in right of Ontario
- describe the Government’s anticipated infrastructure requirements for at least the next 10 years
- develop a strategy to meet those infrastructure requirements
This Appendix contains two chapters. Chapter 1 focuses on the Provincial Asset Inventory and asset management practices of provincial ministries and agencies with major capital portfolios. It includes an asset inventory that gives the value, age and condition of Ontario’s infrastructure assets, which substantially meets the first requirement of the IJPA, listed above.
The development of a Provincial Asset Inventory also responds to the Auditor General of Ontario’s 2015 Annual Report,
Chapter 2 of the Appendix describes the macroeconomic tools that the ministry has developed or is developing to help inform the infrastructure planning and prioritization process. These tools represent the move to a more evidence-based approach to infrastructure funding decision-making. One of these tools, the Stable State Model, uses the condition data collected from the Provincial Asset Inventory to estimate the future renewal investment needs of the Province and of each sector.
Chapter 2 also describes some of the future research the Ministry of Infrastructure is planning to undertake in co-operation with other ministries and outside experts to improve evidence-based decision-making for infrastructure investments. This includes developing research to better understand what infrastructure Ontario currently has in place and the capacity of that infrastructure to deliver services. It also includes gaining a better understanding of current and projected demand for services delivered by that infrastructure, which would in turn allow for a determination of current and future utilization levels. Having an understanding of capacity, demand and utilization would ultimately help to inform a strategy on how to meet Ontario’s infrastructure needs, based on the gap between capacity and demand. The strategy to close that gap could involve, among other actions, investing in new capacity, getting more out of existing capacity by using capacity more efficiently or managing demand. Additionally, this chapter discusses the work the Ministry of Infrastructure is undertaking as part of its three-year transformation plan, intended to guide ministries in developing evidence-informed business cases and tools to support better-informed government decision-making on infrastructure investments.
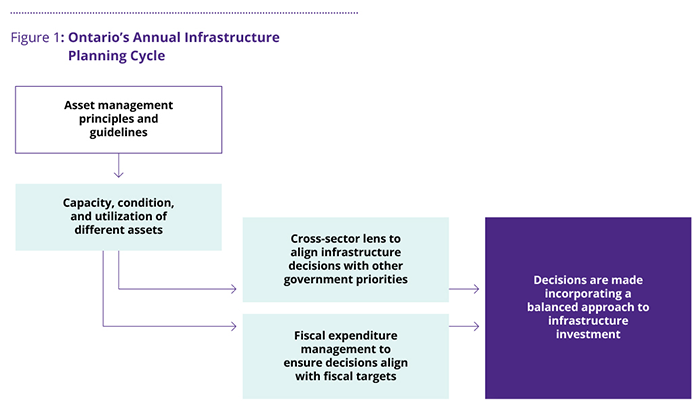
General overview of the infrastructure planning cycle
Through an annual budgeting process known as Program Review, Renewal and Transformation (PRRT), the government reviews its operating and capital expenditures to ensure alignment with government priorities. This process involves extensive collaboration between central agencies and ministries. It is an ongoing process to help manage resources in a way that is efficient, effective and sustainable. To strengthen the infrastructure planning process, the Government of Ontario established the Ministry of Infrastructure in June 2016 as a stand-alone ministry with some central agency functions. In this capacity, the Ministry of Infrastructure will work with other central government agencies, such as Treasury Board/Management Board of Cabinet (TB/MBC), and line ministries to support infrastructure decisions that are based on sound asset management principles and long-term integrated planning across government. As part of the annual infrastructure planning cycle (see Figure 1), ministries are responsible for outlining their infrastructure strategies and asset management plans. Central agencies analyze ministries’ infrastructure plans and provide evidence-informed guidance and recommendations to TB/MBC on the Province’s capital plan in advance of the provincial budget.
Ontario’s infrastructure planning process includes:
- a focus on long-term (10-year) infrastructure needs
- a requirement that ministries’ requests for funding be supported by sound asset management planning
- a review of infrastructure investment requests, considering that trade-offs may be required (e.g., between sectors, or between renewal and expansion)
The aim is to make Ontario a world leader in infrastructure planning. To achieve this, the ministry will continue to improve the infrastructure planning process to ensure that plans reflect sound asset management principles that are rooted in comprehensive data about the condition, function and utilization of infrastructure assets. The ministry also aims to ensure that infrastructure priorities are built on community needs and informed by a macro-level framework that considers the macroeconomic impacts of infrastructure investment.
The government is working on a three-year continuous improvement plan for strengthening the infrastructure planning process, including the eventual development of a prioritization framework. This framework will support the decision-making process by ensuring investment decisions are evidence-based and consider fully the economic, social and environmental impacts of infrastructure projects.
As part of the 2018–19 annual budgeting process, the government is introducing the first phase of the prioritization framework by assessing infrastructure requests to determine if they:
- support ministries’ long-term transformation agendas.
- demonstrate a critical need (e.g., critical for health and safety, service delivery, time constraints, climate change risks)
- estimate infrastructure renewal and expansion needs
- align with other government priorities/policies (e.g., the provincial land-use planning framework and municipal Official Plans; Climate Change Action Plan).
Ontario’s asset inventory
Asset management
Ontario’s asset management strategy
The Infrastructure Asset Management Framework (IAMF) defines asset management as an integrated, life-cycle approach for the effective stewardship of infrastructure assets. Asset management aims to maximize benefits, manage risk and provide satisfactory levels of service to the public in a sustainable and environmentally responsible manner.
This section begins by outlining asset management in the context of Ontario’s infrastructure strategy. In particular, this section will highlight the importance of sound asset management practices, and discuss the asset management processes that are outlined in the IAMF. It will also highlight government-wide practices with respect to asset management across ministries and agencies.
The IAMF is an internal document that serves as a “how-to” manual to provide guidance to provincial ministries and broader public sector partners in their asset management practices. Additionally, the Infrastructure for Jobs and Prosperity Act, 2015 (IJPA) prescribes several considerations that the government should account for when making decisions respecting infrastructure. For example, planning and investments should consider demographic and economic trends in Ontario, and promote economic competitiveness, productivity, job creation and training opportunities.
The IAMF outlines benefits that organizations have recognized upon implementing sound asset management practices. These include effective risk management, improved long-term financial management and planning, better outcomes for the same or lower costs, sustainability and reduced risk of asset failure. These outcomes lead to better quality, informed decision-making. A key element of asset management involves taking into account the potential impacts of a changing climate. Doing so can reduce vulnerabilities in assets and mitigate the risk of service disruptions, failures and costly repairs.
Asset management is about being proactive, rather than reactive. While being reactive would mean simply fixing the infrastructure in poorest condition first, being proactive about asset maintenance can help prevent further deterioration at a scale that is not financially sustainable. Proactive asset management integrates climate change mitigation and adaptation considerations to build resilience and ensure continuity and quality of service levels. Good asset management can also mitigate costs in the long run by spotting deterioration early on, so that action can be taken to rehabilitate or renew the asset.
The IAMF outlines a three-phase asset management process:
Phase 1: Set Direction
- translating an organization’s priorities, policy goals, directives, and decisions into guidelines, which direct the IAMF business process and planning cycle
·developing performance measures and service targets
Phase 2: Assess Current State of Assets
- assessing factors such as asset valuations, conditions and performance
- conducting a needs analysis to determine the current and future demands on assets
Phase 3: Review and Implement the Infrastructure Strategy
- addressing asset performance gaps through investments in expansion, renewal, rehabilitation, maintenance and disposal
Provincial ministries and agencies are currently implementing effective and informed asset management practices. This includes aligning practices to the IAMF principles and making evidence-based decisions. Many ministries, to varying degrees, are using the IAMF as an asset management guide. In addition, they are referring to the globally-used International Infrastructure Management Manual (IIMM), and the ISO 55000 Asset Management Standards. The ISO Standards lay out the “what to do,” while the IIMM provides the “how to do it,” in terms of applying standards for infrastructure asset management.
Ontario’s infrastructure assets
The IJPA requires the Ministry of Infrastructure to include in its infrastructure plans information about the current state of Ontario’s owned and consolidated infrastructure assets, including an asset inventory. This section will describe in detail what a Provincial Asset Inventory entails, what is included within it and what drives the need for an asset inventory. Furthermore, it will discuss the types of assets that are owned and consolidated by the Province, as well as the progress that the Ministry of Infrastructure has made with the Provincial Asset Inventory.
What is a provincial asset inventory?
The Ministry of Infrastructure compiled the first-ever Provincial Infrastructure Asset Inventory in 2016. It covers asset information on various asset classes and sectors, as described below.
The Provincial Asset Inventory is a dataset of infrastructure assets owned or consolidated by the Province, and it includes the following information:
- infrastructure asset sectors, such as transportation, health and education
- asset classes, including buildings, highways, bridges and structural culverts
- basic asset information, including name, type, use, age and location
- current replacement value and asset condition
The Provincial Asset Inventory is the foundation for informing infrastructure planning. It is used to advise decision-makers on the appropriate funding balance for infrastructure expansion and renewal needs. Comprehensive information on Ontario’s infrastructure assets supports more detailed and accurate long-term infrastructure planning in terms of future expenditures on both infrastructure repair and expansion. Moving forward, a robust data set will facilitate the integration of other relevant data, such as demographics, into the infrastructure planning process. The Provincial Asset Inventory will be updated annually and expanded to include more information that is comparable across sectors and will establish a baseline to measure change over time.
Why is a provincial asset inventory needed?
Understanding the current state of Ontario’s owned and consolidated infrastructure assets is a necessary first step towards quantifying Ontario’s infrastructure needs, and for developing strategies to meet those needs.
It is critically important to know what assets exist, as well as the condition and capital repair needs of those assets. This ensures that assets are continually able to provide the public services that are intended throughout their life cycle.
The Ministry of Infrastructure is taking steps to enhance the Provincial Asset Inventory, enabling it to provide timely, comparable, and reliable information to improve the management, maintenance, and renewal and repair decision-making for infrastructure assets. These enhancements to the Provincial Asset Inventory will also provide valuable insight in helping to answer key policy questions.
Ontario’s infrastructure assets
The following hierarchy, provided in the IAMF, relates to how assets are defined and classified:
- Asset Class: This is a category of assets that have a similar nature or function within the operations of an organization. The primary asset classes for Ontario are buildings, land and land improvements, transportation infrastructure, other major assets and moveable tangible capital assets (e.g., computers, vehicles and information technology systems).
- Asset Type: This category of assets creates logical business categories for assets. For instance, buildings would either be classified as general-purpose buildings, specific-use facilities or excess buildings; another example would be transportation infrastructure assets classified as highways, bridges or right-of-way lands.
- Asset Sub-Type: This category of assets provides further detail about the nature of an asset type. For example, specific-use buildings can be sub-classified as hospitals, schools, portable buildings or university educational facilities.
- Asset Ownership: The government, through its ministries and agencies, does not have legal title to many of the infrastructure assets for which it provides operational and capital funding. Accordingly, ownership of assets is categorized as provincially-owned, transfer-payment-partner owned (including the broader public sector/transfer-payment partners), jointly owned by the Province and a transfer payment partner or leased from third parties. This classification provides useful information in terms of who has legal title and/or is responsible for managing infrastructure assets and their capital refurbishment.
Asset categorization for asset management
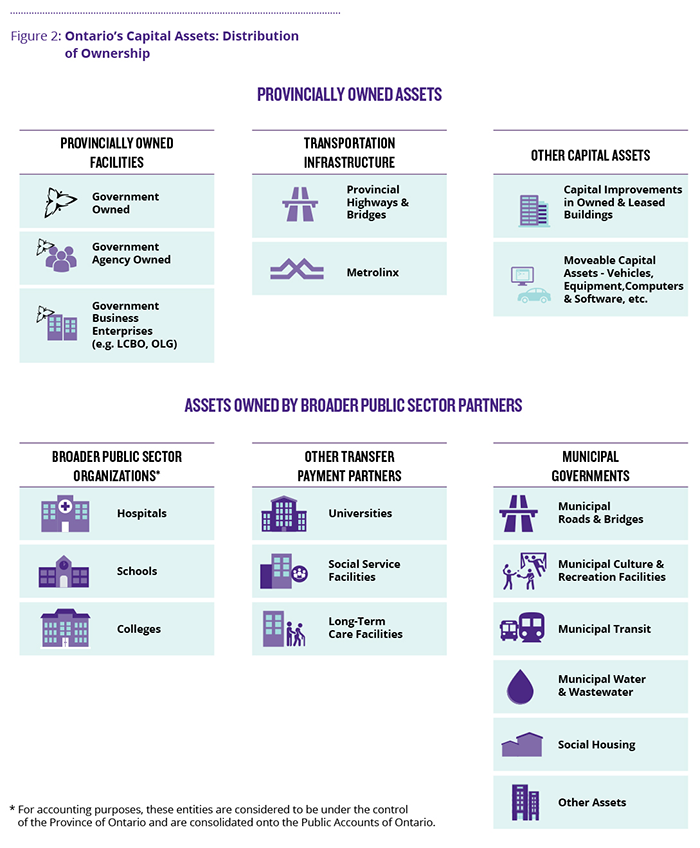
The Province owns or consolidates
Broader public sector partners encompass broader public sector (BPS) organizations, as well as Transfer Payment Partners (TPPs) and municipalities. BPS organizations are entities that are managed by boards or agencies, and whose assets are consolidated onto the financial statements of the Province (e.g., hospitals, schools and colleges). TPPs are external parties that ministries partner with to provide the services of the respective ministry. Examples of TPPs (i.e., not consolidated assets) include universities, social-service agencies, and long-term-care providers.
Municipalities own many assets across the province, including municipal roads and bridges, culture and recreational facilities, transit, water and wastewater facilities along with social housing. The assets of TPPs and municipalities are not consolidated onto the financial statements of the Province. While the Province has no legal title to these assets, the Province does currently provide some capital funding to maintain the physical condition of some of those assets.
Progress – working with ministries and agencies
The Ministry of Infrastructure has signed Memorandums of Understanding (MOUs) with seven ministries with major infrastructure responsibilities and one agency (Metrolinx), collectively responsible for a large proportion of the Government assets’ Current Replacement Value (CRV). These MOUs enable the Ministry of Infrastructure to integrate information pertaining to a diverse range of assets — in particular, their location, age, condition and replacement value — into the Provincial Asset Inventory. They also ensure that the Ministry of Infrastructure will continue to work with participating ministries to establish a consistent approach to analyze, interpret and communicate asset management information. Table 1 identifies the asset ownership of the participating seven ministries and one agency.
Table 1: Participating ministries and agency by infrastructure ownership type
| Participating ministries/agency | Asset ownership |
|---|---|
| Ministry of Transportation — pavement and structures | Provincially Owned |
| Metrolinx (agency of the Ministry of Transportation) | Consolidated — Crown agencies |
| Ministry of Health and Long-Term Care | Consolidated — hospital corporations |
| Ministry of Education | Consolidated — school boards |
| Ministry of Advanced Education and Skills Development | Consolidated — colleges Transfer Payment Partner —universities |
| Ministry of Infrastructure | Provincially Owned |
| Ministry of Natural Resources and Forestry | Provincially Owned |
| Ministry of Tourism, Culture and Sport | Consolidated — Crown agencies |
To support the development and integration of asset-level data through public sector partner engagement, the Ministry of Infrastructure has conducted surveys with ministries to understand their data, as well as their ministry business processes. To further promote information sharing, the Ministry of Infrastructure has held various discussions with ministries to better understand each ministry’s distinct data-collection methods, inventory systems, analytics and reporting processes to support asset management planning. These discussions were also held in order to engage ministries in developing consistent approaches for data collection and reporting asset information.
Data for the Provincial Asset Inventory was provided by participating ministries and agency in 2016. However, several sectors collected or measured their asset inventory data before 2016 (e.g., transportation sector data was collected in 2014). The data represents a snapshot in time.
The data provided for the Provincial Asset Inventory was comprised mainly of asset classes that encompassed building and transportation assets, and was collected at the record level (for instance, an individual building or facility).
As the Provincial Asset Inventory evolves, the Ministry of Infrastructure will remain engaged with partner ministries and agencies to enhance asset inventory data to ensure it is as robust and informative as possible. The ministry will continue to ensure that information about the progress of other ministries with asset inventory data is exchanged, and that challenges they encounter are consistently communicated between ministries/agencies. The Ministry of Infrastructure will also continue working towards defining consistent data standards to ensure a reliable asset-information approach, develop benchmarks, and promote ongoing improvement in service levels across Ontario. The evolution of the Provincial Asset Inventory will be based on the principles that data should remain comparable, timely, reliable and relevant for decision-making.
The next section highlights the contents of the Provincial Asset Inventory in detail; including the definition of an asset within the context of the Provincial Asset Inventory, calculation methods of asset indices, and analysis of assets, including asset age and condition. This analysis assists in ensuring a current and accurate understanding of Ontario’s infrastructure assets as they now stand.
The Province’s Asset Inventory
Provincial Asset Inventory key concepts
This section has an overview of key concepts about the data in the Provincial Asset Inventory. It describes:
- tangible capital assets
- the level of detail within the inventory
- the condition of asset classes (e.g., buildings, pavement, bridges and structural culverts).
- different metrics for asset value
- how assets are geographically distributed
What are tangible capital assets?
The inventory includes only tangible capital assets, such as buildings, pavement and bridges. These are items that meet the following criteria:
- they are continuously used
- they are not disposable in the ordinary course of operations (e.g., highways, which are not sold on the open market)
- they have useful lives of more than one year
- they are held for use in the production of goods and services
- they are acquired through right of use or legal ownership
Tangible capital assets exclude intangible assets. Intangible assets are not physical in nature, and include intellectual property, copyrights, and trademarks.
What assets are not included in the Provincial Asset Inventory?
The majority of public assets in Ontario are owned by other levels of government (e.g., federal or municipal), and, as such, are not included in the Provincial Asset Inventory. For example, the Provincial highway pavement inventory does not cover all the roads in Ontario, or even the majority of them. Municipalities own most of the road network and have responsibility for capital repairs and upkeep. Similarly, entire areas of infrastructure, such as ports and wastewater facilities, are owned by the federal and municipal governments respectively.
Energy assets are a key component of Ontario’s infrastructure; these include nuclear generation stations, transmission lines, and green energy infrastructure. Energy infrastructure typically exists outside the regular budgeting and capital planning process of the Province, as capital investments typically result from rates charged to consumers, rather than from government revenue. As a result, they are not included under the scope of the IJPA, and do not appear in the sector profiles that follow.
What is the level of detail in the Provincial Asset Inventory?
In developing the Provincial Asset Inventory, ministries provided asset data to the Ministry of Infrastructure at either the record-level (e.g., individual school data) or aggregate-level (e.g., all assets at the district school board level). Record-level data is presented for the transportation, health, education, tourism and culture, justice and the General Real Estate Portfolio (GREP)
For the purpose of asset management planning, other asset classes may also be broken down into individual components. For example, hospital sites, university campuses and historic sites are made up of individual assets, including buildings, pavement and bridges. These assets may have different values, ages and conditions across their individual components. As such, each component is tracked individually, rather than as a group of assets. Tracking assets at this level allows for better analytics and forecasting than tracking them as a group of assets.
As an example, a major highway, like Highway 401, may be presented as a single asset. However, for planning, maintenance, and asset management purposes, it is broken down into many individual components (i.e., highway segments). Generally, these are stretches of pavement between markers, such as bridges or highway exits.
What are the different condition indices used for government assets?
The use of indices to summarize overall condition of an asset is standard practice in many jurisdictions around the world. Indices facilitate interpretation of multiple detailed measures that otherwise would be difficult to understand. They also serve as an equivalent reporting unit across multiple assets, enabling benchmarking and cross-sector comparisons. There are different condition indices suited to the specific components and functionality of an asset.
Facility Condition Indices (FCIs) are commonly used in building management to assess the state of repair. Based on the findings of a building’s assessment, a building’s repair and renewal costs can be estimated. The costs of a building’s total three-year
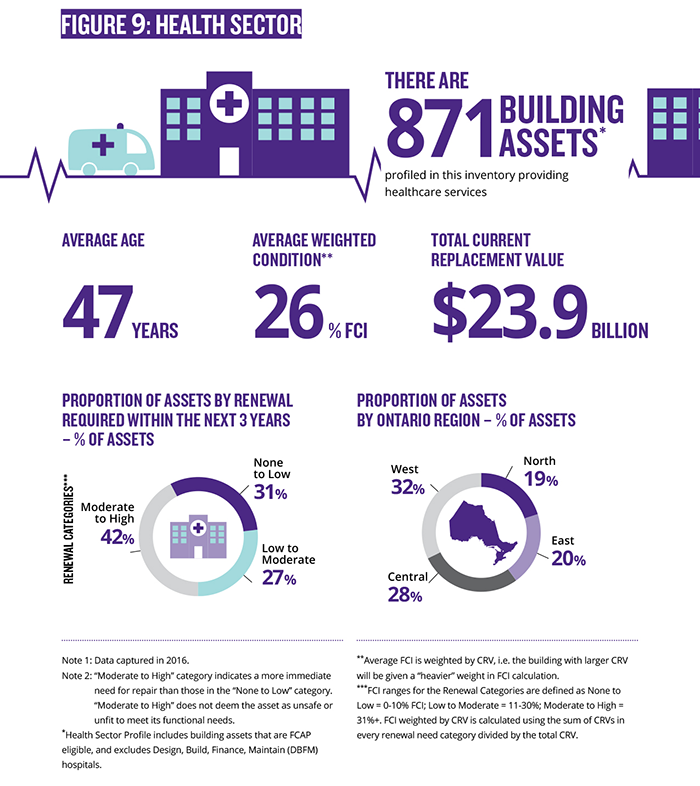
- None to Low = FCI 0 to 10 per cent, meaning the facility is functioning as intended, and little to no maintenance is anticipated within the next three years.
- Low to Moderate = FCI of 11 to 30 per cent, meaning the facility is functioning as intended, and maintenance will be required within the next three years to maintain functionality.
- Moderate to High = FCI of 31 per cent and above, meaning maintenance and some repair of major building components are required within the next three years.
To clarify, FCI is not strictly a measure of condition, as it is focused only on the current- and near-term needs for an asset and not the overall condition or safety of the facility. For instance, a building with high-cost near-term needs in the “Moderate to High” category may be in that category because there are major components (e.g., heating system) that require replacement within the next few years. However, in the meantime, the building may still be meeting the functional needs of the occupants and be safe to use.
It is important to note that each ministry has established an FCI target that aligns with their sector’s performance standards. For example, the GREP (including justice) sectors’ building FCI target is 0 to 10 per cent. The transportation sector’s Pavement Condition Index (PCI), and Bridge Condition Index (BCI) targets, which are described further below, are varied and depend on the road class (i.e., there are different targets for highways, relative to local roads).
A higher FCI generally means greater renewal needs. The opposite is true for the PCI and BCI ratings, as a higher rating indicates fewer renewal needs. While the FCI compares the three-year renewal needs to the cost of rebuilding the facility, the PCI and BCI are calculated differently, as described below. This makes it difficult to compare vertical assets (i.e., buildings) to linear assets (i.e., pavement and bridges).
“Pavement” is defined as the integration of all structural layers (e.g., surface, base, and sub-base). The PCI represents the integral condition of the entire pavement from 0 to 100, with 100 PCI indicating brand new. Both the PCI and BCI are engineering indices. They do not contain financial information. The PCI category placement for “Good,” “Fair” and “Poor” depends on the functional class of the highway (see Table 2).
Table 2: Pavement Condition Index (PCI) categories by functional class
| Good | Fair | Poor | |
|---|---|---|---|
| Freeway | 75 or more | 65 to 74 | 64 or less |
| Arterial | 75 or more | 55 to 74 | 54 or less |
| Collector | 70 or more | 50 to 69 | 49 or less |
| Local | 65 or more | 45 to 64 | 44 or less |
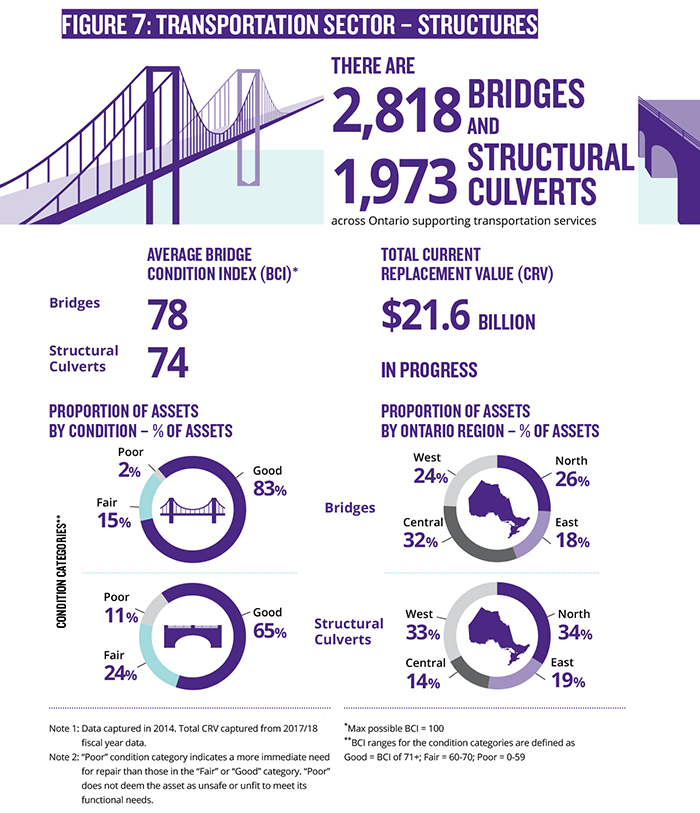
The BCI is a value from 0 to 100, with a BCI of 100 indicating that an asset is in brand new condition. As a bridge ages, the current value decreases relative to its replacement value, meaning that the BCI decreases with time.
Bridge Condition Index (BCI) categories
- Good = BCI of 71 or more
- Fair = BCI of 60 to 70
- Poor = BCI of 59 or less
As with buildings, PCI and BCI ratings in transportation assets (such as bridges, structural culverts and highways) do not reflect the safety of those assets. The PCI and BCI are measurements of the condition of transportation assets. They are essentially a weighted average of various pavement and structure components (e.g., the deck and beams in a bridge are weighted more than a curb or sidewalk, since they represent a larger portion of the bridge value).
It should be noted that the FCI, BCI and PCI ratings are a snapshot in time, as of the date of inspection. The renewal needs, as well as the FCI, BCI and PCI ratings can vary from the time of assessment for many reasons, such as investments made to address renewal needs since the last inspection.
What is the difference between book value and replacement value?
Often, government assets report the book value (both gross and net) of an asset. The gross book value is the historical cost of tangible capital assets (not adjusted for inflation). In contrast, the net book value is the gross book value, minus both the accumulated amortization
For infrastructure planning purposes, replacement values have a more intuitive interpretation (an estimate of the current cost of replacing the asset or the market value of the asset in its current condition). Therefore, the Provincial Asset Inventory focuses on the gross replacement value (referred to as Current Replacement Value [CRV] or Replacement Value in this Technical Appendix) of assets. Replacement value does not consider historical expenditures — rather, it attempts to measure the current cost of building that asset as brand-new. Net replacement value approximates the value of an asset in today’s dollars (adjusted for inflation), taking into account the condition of that asset. The Ministry of Infrastructure is working towards developing estimates of the net replacement value of assets.
How is asset location determined by region?
Most infrastructure data can be represented on a map as a point — either a street address in the case of commercial buildings, schools and hospitals or, alternatively, as a set of co-ordinates, as is the case for bridges and structural culverts.
Most assets were regionally classified for more detailed analysis. Individual ministries maintain different regional classifications. Some ministries use only two regions (North/south). Some use six or more, and some divide Northern Ontario into two regions (Northwest/Northeast), while others do not. The Provincial Asset Inventory uses the general Ontario Public Service (OPS) four-region classification, which includes central, west, east and North (see Figure 3).
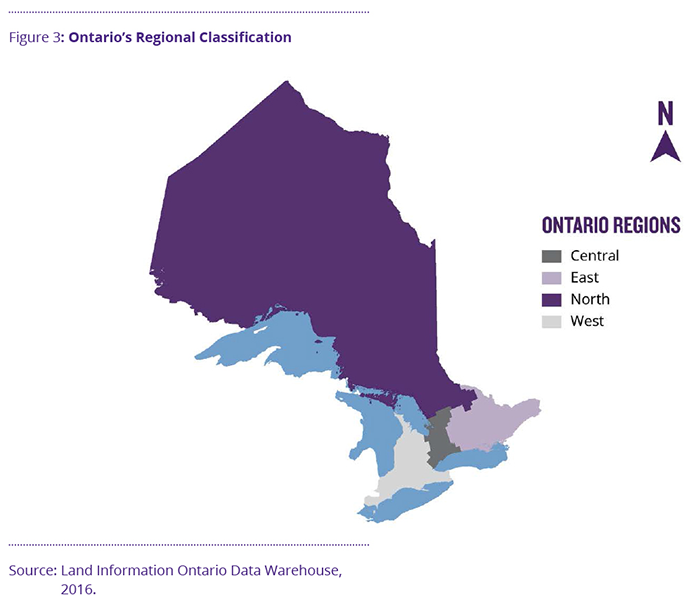
Source: Land Information Ontario Data Warehouse, 2016.
What is the difference between asset age and useful life?
The age of an asset is determined based on the time between its year of purchase or construction and when asset data was collected. To understand the age and condition of the asset and make informed investment decisions, it is important to consider the lifespan of the asset. The useful life of the asset (or asset category) is determined based on the lifespan experienced by similar assets, as well as other factors, such as investments in repair and renewal that may extend an asset’s useful life beyond the original estimate.
The useful life of an asset is an estimate of either:
- the period over which the owner expects to use a capital asset
- the total service, expressed in terms of production or service units, expected to be obtained from the capital asset (i.e., service life)
The remaining life of an asset is defined as the lesser of the time left before the asset needs replacing as a result of condition-based deterioration or the time at which the asset is to be replaced due to performance failures. The challenge with performance-based remaining life is that, until a detailed study is completed, it is often not known if an asset will be replaced or enhanced to avoid performance-based failure.
The IAMF contains guidance on calculating age-based condition indicators:
- The Age Condition Index measures the expired proportion of an asset’s useful life, and is expressed as a number between 0 and 1, with 0 representing a new asset, and 1 representing an asset at the end of its useful life.
- The Useful Life Index identifies where “Component Useful Lives” used within a ministry are significantly out of line with industry standards. A value between 0.9 and 1.1 is acceptable.
- The Serviceability Condition Index (SCI) identifies how the condition of an asset impacts the performance of the asset, rather than simply considering the cost to correct any defects. This is reported on a scale of 0 to 100 per cent, with a high SCI indicating a higher funding priority, as it takes into account the condition, criticality of service-level performance, and cost.
Future iterations of the Provincial Asset Inventory will incorporate the remaining useful life of assets based on provincial accounting standards, which outline useful life categories for buildings and pavement, as well as other tangible assets (including information technology, dams and machinery).
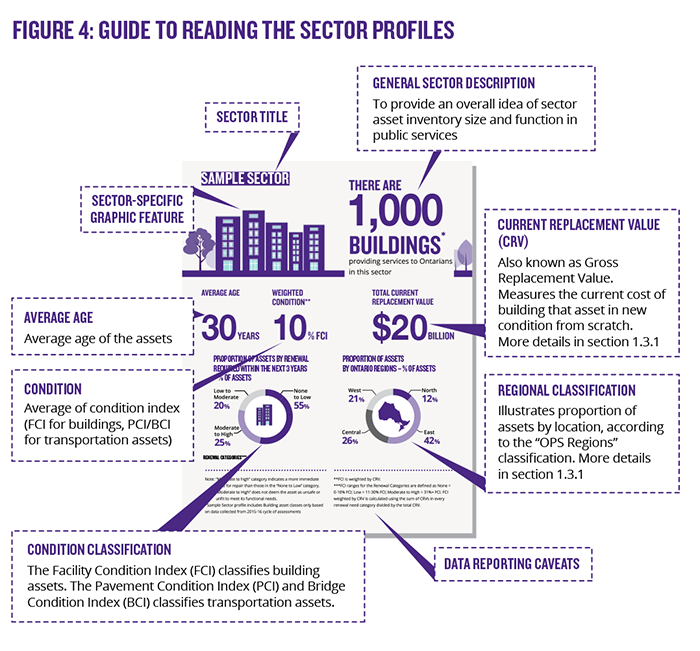
Section 1.4: Sector profiles
This section provides sector profiles of Ontario’s owned and consolidated infrastructure assets (unless otherwise noted) for the 2016 Provincial Asset Inventory.
For each sector, these profiles describe:
- infrastructure assets
- number of assets
- average age
- total estimated current replacement value
- physical conditions of assets, based on assessed condition indices
- location of assets
As previously noted, the Facility Condition Index (FCI) is not an assessment of building safety. Rather, it is a measurement of the condition and renewal needs of a building, as of the date of inspection. An older building may need more repairs (e.g., repainting, change of carpeting), and therefore has a higher FCI rating, but a need for those repairs may not be attributable to a health or safety issue. On the other hand, a new building may have fewer needed repairs but could, in fact, be less safe (e.g., illness due to mould growth resulting from a leaking roof). In this case, the building with the higher FCI is in fact safer than the building with the lower FCI. When prioritizing renewal needs, the health and safety of building occupants is considered the highest priority, which is part of the reason why governments and agencies may not necessarily prioritize buildings with the highest FCIs first.
Just as in a house, building components, such as walls, lights, floors, and boiler systems continue to age and require major repairs or replacement as a natural part of their life cycles. A homeowner may schedule repairs to house components where possible, or plan to replace a component – such as a furnace – if it is beyond repair. Looking at the overall stock of housing in a given area, at a specific point of time, one would likely find a percentage of the houses in each of the three renewal categories described in Table 3 (None to Low, Low to Moderate and Moderate to High) due to the natural life cycle of houses and their major components.
| None to Low | Low to Moderate | Moderate to High | ||||||||
|---|---|---|---|---|---|---|---|---|---|---|
| 0% | 10% | 20% | 30% | 40% | 50% | 60% | 70% | 80% | 90% | 100% |
Similarly, PCI and BCI ratings in transportation assets (e.g., bridges, structural culverts and highways) do not reflect the safety of those assets. An old bridge in “poor” condition, with a need for repairs, may not necessarily pose a health or safety concern, but it will need repair sooner than a bridge in “fair” or “good” condition.
Transportation sector: highway, bridge and structural culvert assets
Ontario’s Provincially-owned and managed highway assets include pavement, bridges and structural culverts (culverts with a diameter span greater than three metres). These assets have the largest asset replacement value of all the sectors, at approximately $82 billion.
Some highlights in the Ministry of Transportation’s asset inventory include:
- over 16,900 centreline-kilometres or 40,100 lane-kilometres of highways and provincial roads
- approximately 2,800 bridges
- nearly 2,000 structural culverts
The Ministry of Transportation maintains a rigorous schedule of inspections, and considerable infrastructure spending is directed to the upkeep of highways, bridges and structural culverts.
Ontario’s highways are regularly resurfaced and maintained. For the purpose of the Technical Appendix, pavement age is calculated as years following the last rehabilitation of the major surface. Based on 2014 data, the average age of pavement is 11 years.
The Ministry of Transportation has developed key performance measures and targets for the PCI. The measure for pavement is the percentage of network in the “Good” condition category, with a performance target of 67 per cent. The ministry uses these performance measurements to identify highway repair priorities. Figure 5 shows that the average weighted PCI (weighted by length of pavement network) of Ontario’s pavement structures is 77 (out of a maximum PCI of 100), with 70 per cent of pavement segments in the “Good” condition category, thereby exceeding its performance target.
The Ministry of Transportation provides funding for pavement in the southern regions (e.g., central, east, and west) and portions of the Northern region. The Ministry of Northern Development and Mines provides funding for the remaining areas in the North. The regional distribution shows that about half (47 per cent) of pavement segments are located in the Northern region.
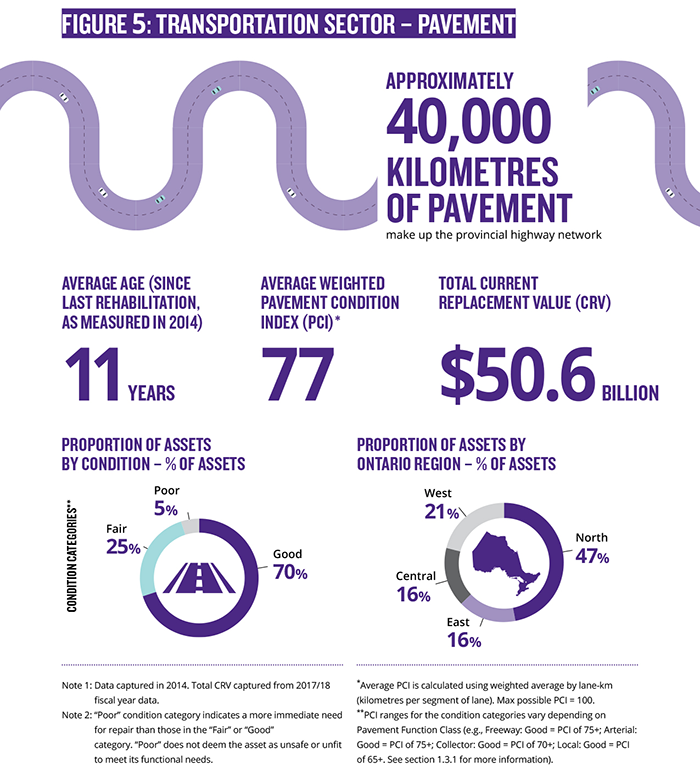
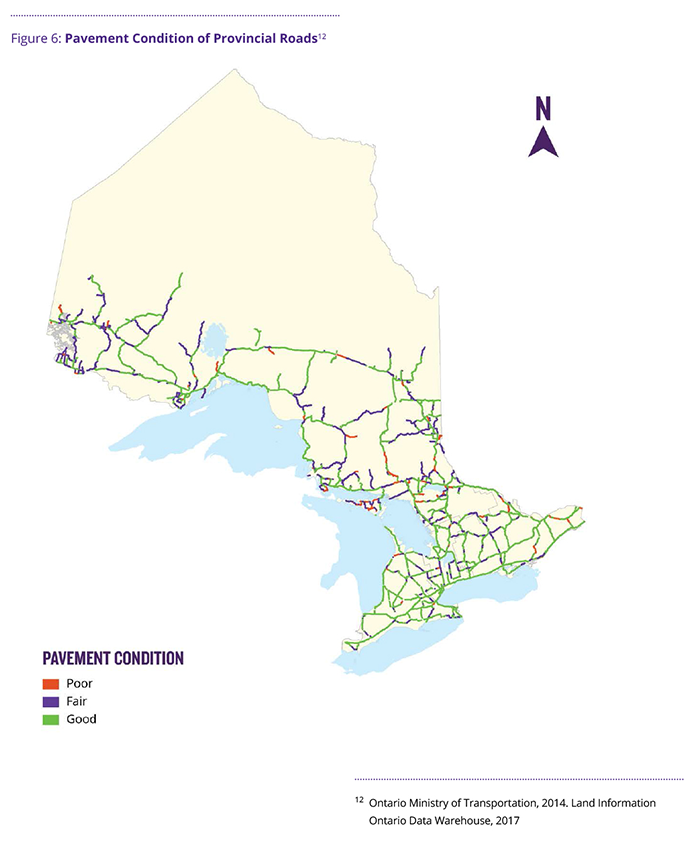
Figure 7 shows asset inventory data of bridges and structural culverts. Since bridges consist of multiple elements, each element is associated with a different service life. Furthermore, bridges built prior to 1980 were designed to last 60 years on average, while newer bridges are designed to last 75 years. There are a number of structures with an unknown year of construction; for this reason, further analysis is required to determine average age.
For BCI, the figure shows the percentage of bridges in the “Good” condition category. The Ministry of Transportation’s performance target is that 85 per cent of bridges be in “Good” condition. Figure 7 shows that bridges are nearly meeting their performance target, with 83 per cent of assets in the “Good” condition category. The Ministry of Transportation is currently setting performance targets for structural culverts.
The regional distribution of provincially owned bridges and structural culverts shows that a majority (58 per cent) of bridges are located in central (32 per cent) and northern (26 per cent) regions. By comparison, a majority (67 per cent) of structural culverts are in the north (34 per cent) and west (33 per cent) regions.
Transit sector
Management of provincial transit assets is under the responsibility of Metrolinx, a provincial transit agency under Ministry of Transportation oversight. Metrolinx manages and integrates public transportation in the Greater Toronto and Hamilton Area (GTHA), in cooperation with municipal transit agencies such as the Toronto Transit Commission and York Region Transit.
Figure 8 shows that, out of the total current replacement value of Metrolinx’s assets ($15.1 billion), the asset class with the largest value proportion is transportation infrastructure (68 per cent), representing a total replacement value of $10.2 billion. This asset class includes rail coach, locomotive, bus, rail corridor infrastructure, grade separation, and parking lot assets.
Metrolinx is currently undertaking a five-year Enterprise Asset Management Transformation Program, which began in 2016. The program will track asset condition and other performance metrics, and will collect asset inventory data that will be included in future iterations of the Provincial Asset Inventory.

Health sector: hospital assets
Ontario has 140 public hospitals, with 871 building assets
Figure 9 shows that the average age of health sector building assets is 47 years, with an age range of 2 to 180 years.
The average condition (weighted by Current Replacement Value) of health sector building assets is 26 per cent. The majority (58 per cent) of these building assets are in the “none to low” (31 per cent) and “low to moderate” (27 per cent) renewal categories. All renewal categories were weighted by CRV.
The majority of health sector assets (60 per cent) are located in the west (32 per cent) and central (28 per cent) regions.
Elementary and secondary education sector: school buildings
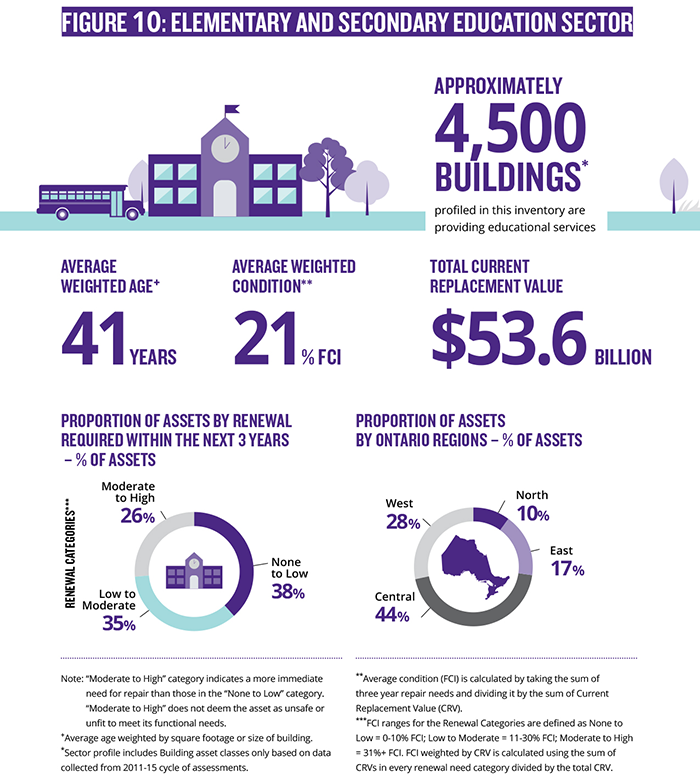
Ontario has approximately 4,500 school buildings. These building assets are owned and operated by 72 local school boards, and four school-board authorities. Schools in Ontario represent the government’s largest investment in building infrastructure, with an asset replacement value of approximately $53.6 billion dollars. The school building infrastructure provides safe, healthy and positive learning environments for approximately 1.9-million students across the province.
The age of school buildings across the province ranges from 1 to 157 years, with an average weighted age of 41 years. There is a large variation in average age across regions, between school boards and within school boards.
Figure 10 shows that the average three-year FCI (weighted by Current Replacement Value) for the education sector is 21 per cent, with the majority (73 per cent) of schools in the “none to low” (38 per cent) and “low to moderate” (35 per cent) renewal categories.
The majority (72 per cent) of schools are in the central (44 per cent), and west (28 per cent) regions. This reflects the population of elementary and secondary school-aged students in Ontario.
Postsecondary education: colleges and universities
Colleges and universities represent a significant component of the Province’s broader public sector physical asset base. There are 45 publicly supported institutions in Ontario, consisting of 24 colleges and 21 universities, with full-time domestic and international enrolment of approximately 676,000 students.
The Ministry of Advanced Education and Skills Development is working on providing the Ministry of Infrastructure with detailed data on Ontario’s college and university assets. In 2016, the Ministry of Infrastructure was provided with a 2015 report from the Council of Ontario Universities, a membership organization that represents Ontario’s publicly assisted universities. The report details the average age, average condition and total replacement value of assets within each university campus. The Ministry of Infrastructure received similar aggregate-level data for colleges in 2017. In collaboration with Colleges Ontario, a membership organization representing Ontario’s publicly assisted colleges, and with funding from the Ministry of Advanced Education and Skills Development, the college sector completed condition assessments of all its facilities in 2015. The completed assessments provide data on the average age, average condition and total replacement value of assets within each college campus.
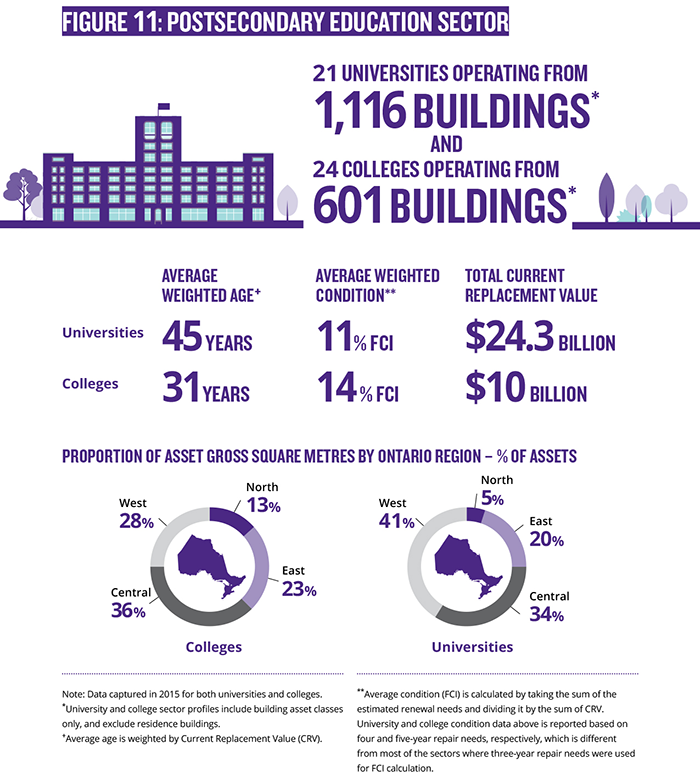
The reported data represents 601 building assets for colleges and 1,116 building assets for universities. The total current replacement value of college buildings is estimated at $10 billion, and $24.3 billion for university buildings. As noted in Section 1.2.4, for accounting purposes, Ontario’s publicly assisted colleges are consolidated in the Public Accounts of Ontario, as they are considered Crown agents and, therefore, considered under the control of the Province. Universities are not officially part of the Provincial Government and are not consolidated in the Public Accounts of Ontario, as they are publicly funded through transfer payments. They are included in the Provincial Asset Inventory to provide a complete overview of the postsecondary sector.
For university campus buildings, only the average age (i.e., the average age of a group of assets) was provided for the Provincial Asset Inventory. As a result, a weighted (by CRV) age was calculated to determine the average age for this sector’s assets. Figure 11 shows the average weighted (by CRV) age: for college buildings it is 31 years; and for university buildings it is 45 years.
Postsecondary sector building condition is currently assessed on a five-year renewal need basis, as opposed to the three-year basis used by most other sectors. In other words, the financial need for renewal of postsecondary buildings relative to their CRV is projected over five years, instead of three. Since the FCI classification described in Section 1.4 is based on a three-year renewal need, it cannot be applied to this sector.
The university sector applies the following five-year renewal need scoring criteria to categorize building asset condition:
- Excellent condition = FCI is less than 5 per cent
- Fair condition = FCI is between 5 per cent and 10 per cent
- Poor condition = FCI is greater than 10 per cent
The average condition of university buildings is 11 per cent, indicating “Poor” condition, in accordance with the sector’s criteria.
The college sector applies unique scoring criteria, based on a five-year horizon, as outlined below:
- Excellent condition = FCI is less than 5 per cent
- Good condition = FCI is between 5 per cent and 10 per cent
- Fair condition = FCI is between 10 per cent and 30 per cent
- Poor condition = FCI is between 30 per cent and 60 per cent
The average condition of college buildings is 14 per cent, indicating “Fair” condition, in accordance with the sector’s criteria.
The regional distribution of universities is profiled using gross square metres. Using this approach, the region with the largest proportion of building gross square metres is the west (41 per cent), which includes the University of Guelph (126 building assets), the University of Western Ontario (98 building assets), and the University of Waterloo (72 building assets). The central region has the second-largest proportion (34 per cent). The largest proportion of college-building gross square metres is in the central region (36 per cent) and includes George Brown College (64 building assets) and Humber College (52 building assets), followed by the west region (28 per cent).
Government administration and justice sectors: government buildings, detention centres, courthouses and detachment assets
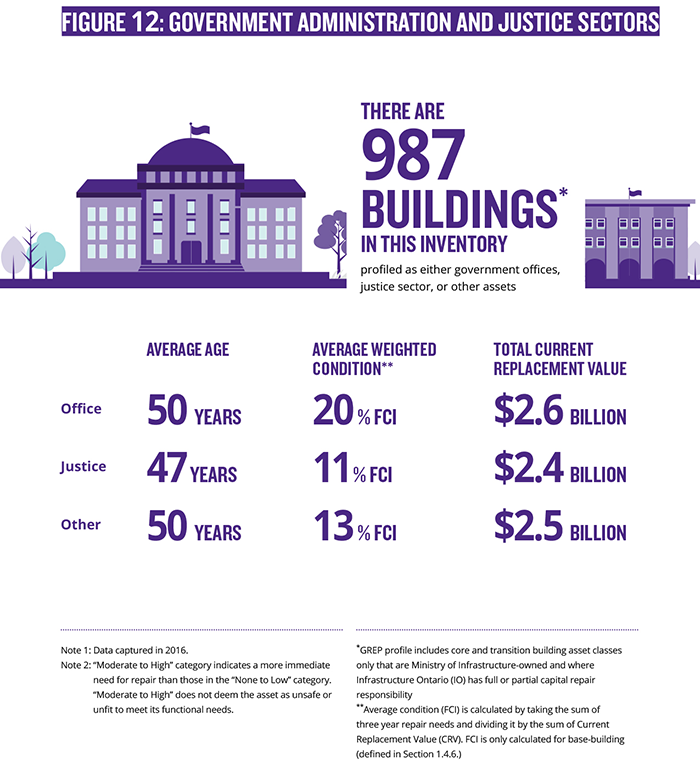
Infrastructure Ontario is a Crown agency of the Government of Ontario that has stewardship over the General Real Estate Portfolio (GREP). The GREP is primarily comprised of 987 buildings, equating to 23 million square feet, identified for long-term use to fulfill current or future ministry program needs. These strategic buildings include courthouses, detention centres, detachments (all part of the Justice sector); laboratories, and government offices.
The FCIs calculated for the buildings are not comparable to the FCIs provided for other sectors. It should be noted that for other sectors (such as health), FCIs reflect both the base building as well as the interior building components, whereas for the GREP portfolio, FCIs reflect only the base building (and not the interior building components).
“Base building” refers to the enveloping structure, primary building mechanical/supply systems and finished common areas of a building (private- or government-owned), and excludes tenant’s leasehold improvements, furnishing, fixtures and equipment. In other words, the base building normally includes the building's structure; the building envelope (roof, windows and exterior walls) in whole or part; public circulation and fire egress (lobbies, corridors, elevators and public stairs); and primary mechanical and supply systems (electricity, heating and air conditioning, water supply, drainage, gas, etc.) up to the point of contact with individual occupant spaces.
The GREP buildings that meet the criteria for detailed building inspection represent an estimated total replacement value of approximately $7.4 billion. The average age of these buildings is 49 years, and they range in age from 2 to 182 years. The average FCI (weighted by Current Replacement Value) of these buildings is 15 per cent.
Of these GREP buildings that meet the criteria for detailed building inspection, 13 per cent are government office buildings for Ontario’s public servants, 24 per cent are buildings that provide services to the justice sector (e.g., detention centres, courthouses and provincial police buildings), and 63 per cent are buildings that provide other services (e.g., laboratories). Figure 12 profiles GREP buildings, and distinguishes between offices, justice sector, and other assets.
Government office buildings represent a total current replacement value of $2.6 billion, with the justice sector’s assets representing $2.4 billion and other building assets representing $2.5 billion. Both offices and other building assets have an average age of 50 years, whereas justice building assets have an average age of 47 years.
The majority (61 per cent) of justice sector assets and the majority of other assets (53 per cent) are in the “none to low” renewal category, while nearly half (46 per cent) of government offices assets are in the “none to low” renewal category. All renewal categories were weighted by CRV.
The majority (68 per cent) of office building assets are in the North (45 per cent) and central (23 per cent) regions. The majority (61 per cent) of justice sector assets are in the North (35 per cent) and eastern (26 per cent) regions. The majority (62 per cent) of other building assets are in the North (36 per cent) and central (26 per cent) regions.
It should be noted that although most office buildings are in the “none to low” or “low to moderate” categories, there are major individual office buildings that are in the “moderate to high” category. As an example, the majority of buildings in Macdonald Block, which collectively have a CRV of nearly $700 million, have moderate to high renewal needs, and three of the buildings have FCIs that are especially high (85 per cent or higher).
In addition to the 987 strategic buildings, there are 652 non-core GREP buildings for which IO has responsibility for base-building reinvestment. Those non-core buildings do not warrant detailed inspections for the purpose of identifying FCI information, as their renewal needs are limited to necessary repairs until the assets are decommissioned or demolished.
GREP also contains 28 Alternative Financing and Procurement (AFP) buildings and 2,688 buildings/structures, primarily in provincial and historic parks, for which ministries are responsible for reinvestment planning and costs. An additional 632 buildings are leased from the private sector and managed by landlords.
Natural resources and forestry sector
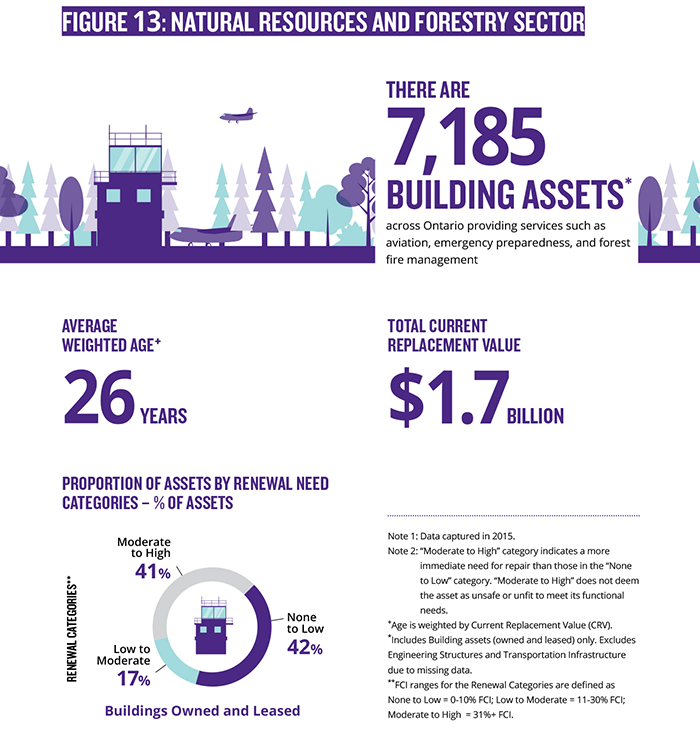
The Ministry of Natural Resources and Forestry has provided asset information for Ontario Parks, including buildings, engineering structures and transportation infrastructure.
Some of the assets reported by specific Ministry of Natural Resources and Forestry program areas or business portfolios are in the GREP. Therefore, there may be duplicate assets in this sector profile and the GREP portfolio profile. No record-level data are currently available for this sector and it is not possible to determine which assets overlap in both sectors at this time.
The Ministry of National Resources and Forestry has established a multi-year Responsible Asset Management Planning (RAMP) program (2016 to 2020). The RAMP program will include an asset management system that facilitates long-term infrastructure planning and reporting. In the short term, the Ministry of Natural Resources and Forestry is pilot-testing a commercial off-the-shelf software product with Infrastructure Ontario, which may be adapted for broader use across the Ministry of Natural Resources and Forestry’s diverse portfolio of assets.
Only average age (i.e., the average age of a group of assets) data of the ministry’s assets were provided for the Provincial Asset Inventory; as such, average age weighted by current replacement value (CRV) was calculated in order to determine the average age for this sector’s assets. Figure 13 shows that the average weighted age of this sector is 26 years.
Only condition data (reported as categorized renewal-need data in the sector profile) for asset classes were provided by the Ministry of Natural Resources and Forestry – rather than an FCI for each asset. As such, the average condition of the assets as a whole cannot be calculated. In terms of renewal-need categorization, 41 per cent of buildings are in the “moderate to high” category. All renewal categories and average condition of assets were weighted by CRV.
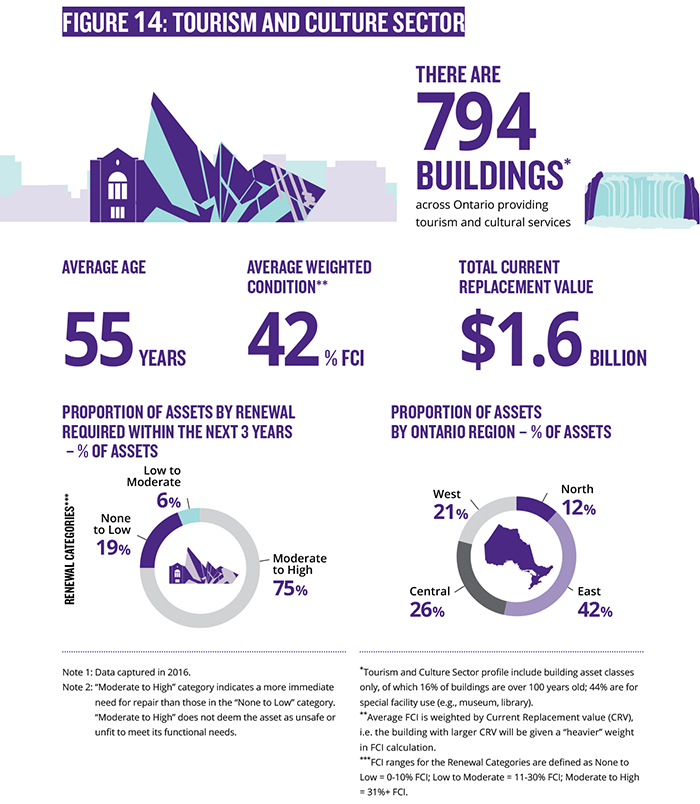
Tourism and culture sector: agency and attraction assets
The tourism and culture sector represents a diverse portfolio of assets, including heritage sites, museums, art galleries, science centres, convention centres and historical parks. To maintain this infrastructure, the Ministry of Tourism, Culture and Sport partners with 13 culture and tourism agencies and attractions. The majority of the ministry’s agencies and attractions rely primarily on funding from the ministry to meet their infrastructure needs, but some also leverage other sources of funding, including revenue generation, capital campaigns and other levels of government. The Provincial Asset Inventory contains 794 building assets in this sector, representing an estimated total replacement value of $1.6 billion.
The age of these building assets ranges from 0 to 232 years, with an average age of 55 years (there are several historical sites in the sector inventory data).
The average FCI (weighted by CRV) for these assets is 42 per cent. Only 19 per cent of assets appear in the “none to low” renewal category. Figure 14 shows that the majority (75 per cent) of building assets are in the “moderate to high” renewal category. All renewal categories were weighted by CRV.
The majority of the ministry’s assets (68 per cent) are located in the eastern (42 per cent) and central (26 per cent) regions. This reflects the large number of buildings in the eastern region associated with the Ontario Heritage Trust (22 building assets), as well as St. Lawrence Parks (309 building assets).
Government-wide practices
This section highlights government-wide practices with respect to asset management, in relation and in addition to practices for developing and maintaining an asset inventory.
The Ministry of Transportation
Highway, bridges and structural culverts
The Ministry of Transportation has applied asset management practices through the implementation of key asset inventory databases, asset condition and needs assessments, performance measures, and prioritization. For its major assets, pavement and bridges, it has also standardized asset inventory methodologies, following sector standards. As noted in the preceding section, the Ministry of Transportation uses two significant performance indicators to assess an asset’s condition — the Pavement Condition Index (PCI) and the Bridge Condition Index (BCI). The Ministry of Transportation’s asset inventory process includes annual data updates and quality-control processes to ensure quality and timely asset data to support effective decision-making.
The Ministry of Transportation’s Asset Management System (AMS) is used as a planning tool for assisting staff in decision-making on project prioritization, capital repair, investments and funding allocations. The prioritization and optimization analysis is also informed by regional Ministry of Transportation staff, who review the AMS output and make adjustments based on technical, scheduling and bundling considerations.
The ministry’s AMS complies with the majority of the principles outlined within the IAMF approach. The AMS is a planning tool that aids the Ministry of Transportation in making repair and rehabilitation decisions. Since 2013, the Ministry of Transportation has conducted an automated highway-condition assessment for pavement assets, using specially equipped vans. Prior to 2013, these assessments were conducted through human spot checks; however, the automation of this system allows for an assessment of the Ministry of Transportation’s entire pavement network each year. This comprehensive pavement data is now collected annually, and updated within AMS. In compliance with Ontario’s Open Data Directive, the Ministry of Transportation has also released bridge
Each spring, the Ministry of Transportation’s professional groups (e.g. engineers, architects, and bridge experts) review regional priority program lists across the ministry network, taking into consideration factors such as consultations/expert capacity, ministry resources, environment assessment readiness and bundling opportunities for programs/projects, to produce a final priority list for the annual budgeting process. Projects such as highway expansions are identified by regional offices. They are prioritized according to the Ministry of Transportation’s Expansion Prioritization Framework. It considers a range of criteria including travel time, safety, economic benefit and budget constraints, among others.
Transit
In order to improve transit asset management, Metrolinx is developing the Enterprise Asset Management (EAM) Program over the next three years. The EAM program will focus on implementing changes in three key areas:
- Business Processes and Practices — Metrolinx aims to standardize and reconfigure their business practices to better manage assets as they go through various stages in their life cycles (e.g., planning or decommissioning).
- Target Operating Model Implementation and People Change Management — Metrolinx is implementing organizational changes that are necessary in supporting the new model under which EAM will operate. For instance, this will include the implementation of an Asset Management Office (AMO), which will be responsible for establishing and enforcing standard controls, as well as improving organizational practices.
- Technology Enablement — Metrolinx aims to implement technology that will support processes within the EAM program (e.g., information management, geographic information system).
The Ministry of Health and Long-Term Care
The Ministry of Health and Long-Term Care has standardized asset inventory methodologies, following sector guidelines. The ministry’s inventory has asset information, such as information on age, condition and current replacement value. Asset condition is captured through the FCI (Facility Condition Index), which aligns with IAMF methodology. The ministry’s standardization and assessment criteria inform their approach towards making capital repair, renewal and expansion decisions, which involves the use of the asset inventory data, as well as expert input.
The ministry has made significant progress in managing assets through an informed decision-making process that is integrated into their data-management system for assets. The ministry is using a third-party software system to house a thorough and extensive record of the ministry’s assets. The software also performs hospital sector facility-condition assessments on behalf of the ministry, ensuring that their FCI methodology complies with sector standards. Utilizing the software system, the ministry confirms that data is both reliable and comparable for capital investment decision-making. The ministry’s shift towards standardizing Uniformat II
The Ministry of Health and Long-Term Care’s data system is additionally set up to utilize their Facility Condition Assessment Program (FCAP) criteria to determine whether assets meet eligibility requirements for inclusion in the inventory. Eligibility reviews occur prior to assessments, which are completed over a four-year cycle. The FCAP is currently in its third cycle of Facility Condition Assessments across the province.
The Ministry’s Health Infrastructure Renewal Fund (HIRF) program,
The ministry took the initiative in 2016–17 to develop and distribute a community-asset inventory survey, which provided an initial understanding of the needs of the community health sector. The survey was further refined in 2017–18 and provides the ministry with a clear picture of what asset management concerns can be addressed through the Community Infrastructure Renewal Fund (CIRF) program, which began in 2016–17.
The Ministry of Education
The Ministry of Education has standardized its asset inventory methodologies to comply with sector standards. The ministry has documented asset inventory data collection and assessment criteria both clearly and thoroughly. For instance, the ministry has a clear methodology in place to conduct calculations for asset age at the asset level. The Ministry of Education also has a range of information on assets, including condition and valuation, overall condition assessment and asset valuation.
In order to get thorough information about the condition of schools, the Ministry of Education enlists independent, third-party facility inspectors with expertise in building design, construction and building systems. These inspectors are responsible for inspecting essential structures and systems within schools, as well as wear and tear in building interiors.
The ministry has a comprehensive 10-year capital plan that is designed to meet its asset management priorities — particularly for addressing renewal needs. This strategy aligns with a number of the principles outlined in the IAMF. For instance, the ministry has implemented the School Condition Improvement Program. This program is responsible for addressing a backlog in school-renewal needs. School boards are required to direct 70 per cent of School Condition Improvement Program funds to address issues relating to major building components (e.g., foundations, roofs, and windows). The School Condition Improvement Program focuses on ensuring that facilities are in good condition, and are energy efficient, safe and accessible.
Another program to illustrate sound asset management principles is the ministry’s Capital Priorities Program. This program allocates funding to school boards to address accommodation pressures within schools, replace facilities in poor condition, support consolidation of underutilized facilities, and provide facilities for French-language rights holders in underserved areas of the province.
The Ministry of Advanced Education and Skills Development
At the university level, since 2000, the Council of Ontario Universities (COU) has published an annual Ontario Universities’ Facilities Condition Assessment Program Report. This report has information on the infrastructure requirements of Ontario universities associated with deferred maintenance, system and equipment renewal needs and required funding for the adaptation and ongoing maintenance of capital physical infrastructure.
A joint task force, consisting of the Council of Senior Administrative Officers (CSAO) and the Ontario Association of Physical Plant Administrators (OAPPA), implemented a common database management system from a third-party vendor to manage Ontario university assets. The software enables institutions to provide “consistent, comparable and reliable data.”
The ministry is working with Colleges Ontario and the college sector to improve their asset management processes. In 2015, funded by the ministry, the college sector completed comprehensive condition assessments of all its facilities. Colleges Ontario is also working with the college sector to develop a common space inventory and system-wide space standards.
In addition, the ministry is building a comprehensive capital-project inventory, which is slated to include project-evaluation metrics. The capital-project inventory will inform decisions around projects requiring assessment and projects to be funded. The ministry is currently working with the postsecondary sector to develop a capital strategy that will prioritize facility renewal and transformation. The ministry’s existing Facilities Renewal Program focuses on ensuring that facilities are in good condition, and are energy efficient, safe and accessible.
Infrastructure Ontario
Infrastructure Ontario is a Crown agency that manages provincial real-estate assets (GREP) on behalf of the Ministry of Infrastructure in a way that fosters functional workplaces for building occupants.
The agency’s capital planning methodologies combine rigorous procedures, software adaptation and evidence-based, on-site inspection data to support an objective decision-making process that ultimately benefits the province.
Within this framework, building needs are prioritized objectively through an advanced modelling process that gives Ministry of Infrastructure decision-makers the ability to demonstrate impacts based on various funding scenarios. This, in turn, allows Infrastructure Ontario to craft an objective and credible capital reinvestment plan.
Detailed capital planning deliverables include:
- development of Charge for Accommodation (CFA) base rental rates for net new and significantly expanded/retrofitted assets, calculated to provide adequate reinvestment for a 40-year anticipated lifespan
- rigorous evidence-based information to support reinvestment decisions
- condition assessment reports (base building and Leasehold Improvement [LHI]/Furniture Fixtures & Capital Equipment [FFE])
- condition metrics (FCI, Deferred Maintenance, age)
- functional metrics (cost to correct design deficiencies)
- funding scenario modelling
- the 10-year outlook, containing inventory of repair and life-cycle renewal reinvestment needs
- a recommended multi-year, ranked tactical implementation plan (three-year Tactical Plan) aligned with government priorities and anticipated budget
- business cases at both program and project level for Ontario Budget (PRRT) submissions
- a pipeline of validated demolition candidate sites
In order to achieve these deliverables, Infrastructure Ontario follows prescribed industry standards and applicable ministry guidelines to catalogue, define and distinguish variables used for reporting and calculation. Infrastructure Ontario also follows the Uniformat II elemental classification system. As a standard tool for classifying building elements, Uniformat II promotes consistency in building specifications, which are major components common to most buildings and related site work.
Infrastructure Ontario has also developed an automated prioritization methodology known as pair-wise analysis. This approach allows Infrastructure Ontario to rank its capital program’s potential requirements in a way that is easily reproducible. Ranking strategies in this approach are intended to meet program-specific needs, while also maintaining sufficient agility to incorporate new program directives seamlessly.
The pair-wise analysis approach follows this sequence:
- collect priority ranking criteria (e.g., asset, system, requirement levels)
- rank the importance of criteria (referred to as “dimensions”)
- score sub-categories of dimensions
- perform analysis of scoring to provide a numerical score for each requirement
- determine the most imminent item for repair, based on the highest score
- continue scoring for the fiscal year, until the allotted budget is exhausted
- carry subsequent projects to the next fiscal year, based on ranking
In employing this method, Infrastructure Ontario follows prioritization asset management practices. These include objectivity, in which potential projects are ranked using a concrete and standardized set of rules across assets; clarity, in which predetermined ranking criteria highlight where budget allocations will provide the highest returns; consistency, which limits regional variations; and accuracy, which ensures that the predetermined nature of the approach provides an easy-to-follow justification for submitted projects.
The Ministry of the Attorney General
The Ministry of the Attorney General takes a detailed approach towards asset management, including individual asset management plans for various facilities and the successful incorporation of certain data with specific program needs. The ministry’s FCI calculation complies with IAMF calculation standards and the ministry conducts regular inspections of assets. The ministry has also created optimization strategies for programs, courthouses and office spaces. In addition, the ministry has developed individual asset plans for courthouses. They include facility condition information, along with metrics specific to the ministry’s programs and forecasts, to compare asset performance relative to service demand and state of good repair. The ministry has successfully combined its asset inventory and facility condition data with forecasts about program-specific service levels and needs. This integration allows for the identification and assessment of gaps, and enables investment in infrastructure needs that have an impact on the ministry.
While the Ministry of the Attorney General is responsible for managing and inspecting the interior of a building (e.g., furnishings), Infrastructure Ontario has responsibility for managing and inspecting the base and exterior components of a building (e.g., utility and electrical systems). In collaboration with Infrastructure Ontario, both the Ministry of the Attorney General and the Ministry of Community Safety and Correctional Services are participating in the Leasehold Asset Management Program (LAMP). The LAMP is an effective example of compliance with the components of the IAMF, including the setting of direction through well-defined methodology and priority recognition. LAMP acts as a repository of asset information, providing information on both the current state and the valuation data of assets.
For the Ministry of the Attorney General, the LAMP entails the development of detailed room-by-room building-condition inspections, allowing the ministry to evaluate finishes, space quality and room comfort levels. The data is then integrated into Infrastructure Ontario’s third-party software system to obtain an FCI for each location. This is used to inform investment needs. This approach enables the ministry to have a holistic understanding of the costs that are required to maintain courthouse facilities, both at a base-building and program-level (as Infrastructure Ontario manages base buildings, while the ministry manages at a program level). The LAMP also enables the ministry to assess assets and recognize gaps, as well as to identify investment priorities, based on a thoroughly defined methodology. Such investment priorities include health and safety requirements, energy management, the possibility of imminent breakdown, the need for proactive replacement and program requirements.
The Ministry of Community Safety and Correctional Services
The Ministry of Community Safety and Correctional Services complies with the IAMF methodology for assessing FCIs, and has detailed data on the condition of its assets that have been assessed to date.
As previously noted, the Ministry of Community Safety and Correctional Services also collaborates with Infrastructure Ontario for the LAMP. Under the LAMP, Infrastructure Ontario and the ministry are undertaking the development of a rating system, which will be used to prioritize backlogged projects. This is similar to how LAMP assists the Ministry of the Attorney General to identify investment priorities. Aside from prioritizing backlogged projects, this system will also allow the ministry to identify new projects and select projects within a singular, consistent and transparent methodology. Additionally, the Ministry of Community Safety and Correctional Services is working with Infrastructure Ontario to initiate a process to identify the condition of its assets in detail. Physical LAMP inspections of 10 institutions have been completed. Tentative dates have been set to complete six additional sites in 2017–18.
The LAMP already enables the Ministry of Community Safety and Correctional Services to capture the replacement costs of all its buildings. Through this collaboration, the ministry will conduct an holistic FCI assessment. The ministry assesses FCIs for buildings with special purpose space (such as courthouses or detention centres), while Infrastructure Ontario assesses FCIs for the base building (which is comprised of a building’s base structure, its foundation and exterior, electric system and utilities system). As part of the LAMP initiative, the ministry and Infrastructure Ontario intend to merge their FCI scores to develop quantitative measures for prioritizing projects. Merging the two FCI scores to generate an holistic metric will be considered an asset management practice for other ministries to follow, once it is implemented. This is largely because the merging of scores will alleviate concerns about information gaps within the GREP, as the FCIs that are reported separately by Infrastructure Ontario for base buildings are not entirely representative of a facility’s overall condition and use.
Next steps on asset management practices
The Provincial Asset Inventory contributes to the evidence base that is required for the prioritization of provincial investments. Given the importance of the Provincial Asset Inventory to informing asset management, the Ministry of Infrastructure is taking action over the next three years to develop an asset management strategy founded on robust infrastructure data that is comparable across sectors.
The Ministry of Infrastructure is working with capital ministries, external vendors and academic experts to undertake a broad review of asset management approaches and to identify best practices that can be implemented across Ontario’s ministries and agencies. Best practices will be reflected in an updated guide for ministries that will help set standard practices for service levels, performance measures, targets and asset inventory data. This guide will also reflect the varying relationships between ministries and capital assets.
The Ministry of Infrastructure will also continue to enhance the Provincial Asset Inventory to help understand existing assets and related infrastructure gaps. To address these gaps, the ministry is also working with consultants to assess provincial asset management practices to develop common metrics and methodology that will compare infrastructure needs across sectors. In addition, the ministry will develop a method for measuring the functionality and utilization of infrastructure assets to inform service-level needs.
Additional data will be used to improve asset management, inform future investment decisions, track changes year over year and identify areas for improvement. For example, data tools for measuring greenhouse gas reductions over a given period will be valuable for tracking the progress of initiatives such as the Climate Change Action Plan. Ontario’s planned climate change organization will provide the government with data and information related to climate change. As well, work by the Province to undertake a provincial climate change risk assessment will provide insight into the risks and vulnerabilities posed to infrastructure as a result of climate change. This will help inform strategic and evidence-based investment decisions.
The Ministry of Infrastructure will continue to work with capital ministries to expand the Provincial Asset Inventory. This process will include consultations to identify agencies with assets of high value, movable capital assets (such as high-value hospital equipment), surplus assets (to support the community hubs initiative) and infrastructure related to social, energy, environment and climate change and natural-resources sectors.
Planned timeline for asset management improvement
The Ministry of Infrastructure has outlined a three-year plan for further enhancing asset management across the province:
- In 2017, the Ministry of Infrastructure is working with Treasury Board Secretariat to examine the extent to which ministries are submitting full costing with all capital project proposals, in alignment with Treasury Board/Management Board of Cabinet requirements and directives. The Ministry of Infrastructure will undertake a broader best-practices review and update guidance for ministries as appropriate. The Ministry of Infrastructure will work with line ministries to develop enhancements to the Provincial Asset Inventory to inform an understanding of current assets and related infrastructure gaps, as well as the impacts of demographic changes.
- In 2018, the Ministry of Infrastructure will work with consultants to assess the Province’s practices and develop common metrics (e.g., condition indices) that will compare infrastructure needs across sectors. A first milestone may be a standardized process to measure and report FCI data across all provincially-owned or consolidated building assets. The ministry also will identify innovative analytics to inform infrastructure and investment decision-making.
- In 2019, the Ministry of Infrastructure will update the IAMF to implement best practices in asset management, including ensuring that the IAMF is in line with the forthcoming regulation for municipal asset management planning established under the IJPA. The ministry will work with capital ministries to develop a Provincial Asset Management Strategy that will streamline asset management life cycles and bring consistency to asset management across the province.
The government recognizes the importance of achieving these milestones. Additional actions may be identified and implemented as the ministry works towards a better understanding of the infrastructure needs faced by Ontario. Chapter 2 expands on the macro and micro approaches that the Province is taking to make informed decisions on infrastructure investments.
Footnotes
- footnote[24] Back to paragraph From
- footnote[25] Back to paragraph From The Province’s owned or consolidated infrastructure includes the following sectors: Health (hospitals), Education, Transportation (highways, roads and bridges [HRB], and Metrolinx/transit), Postsecondary Education (Colleges only), Justice, and Other Government Administration (for example Tourism, Culture and Sport, General Real Estate Portfolio).
- footnote[26] Back to paragraph From
- footnote[27] Back to paragraph From The Ministry of Infrastructure has also identified other ministries, as well as corresponding agencies, which currently own entire buildings, and/or have long-term leases, for the purpose of eventually integrating their data into the Provincial Asset Inventory.
- footnote[28] Back to paragraph From GREP sector comprises a large portion of real property assets of the Government of Ontario. GREP will be discussed further in Section 1.4 of this chapter.
- footnote[29] Back to paragraph From With noted exceptions, each ministry has provided the three-year FCI as recommended in the IAMF, with the current year plus two-year renewal needs as the numerator and current replacement value as the denominator.
- footnote[30] Back to paragraph From Ministry of Transportation, Provincial Highway Management Division, 2012.
- footnote[31] Back to paragraph From Amortization spreads the costs associated with investments in capital assets over the useful lives of those assets to reflect their consumption over time.
- footnote[32] Back to paragraph From Data for the Provincial Asset Inventory was received in 2016, but data from several sectors was collected or measured before 2016 (e.g., transportation sector data was collected in 2014).
- footnote[33] Back to paragraph From The Provincial Asset Inventory only reports a total CRV $72.2 Billion. Other assets and land with CRV of $9.8 Billion are not included in the inventory.
- footnote[34] Back to paragraph From
- footnote[35] Back to paragraph From The Ministry of Transportation also makes significant contributions to municipal transit systems outside the GTHA; however, municipal transit assets are not owned by the Province and not included in the asset inventory.
- footnote[36] Back to paragraph From A Health building asset is defined as “a free-standing structure, a portion of a structure, or any part of a facility infrastructure that is distinguishable from its surroundings by date of construction, construction type, and/or the systems that comprise it.” Source: Hospital Energy Efficiency Program Guidelines for 2017-2018, Ontario Ministry of Health and Long-Term Care.
- footnote[37] Back to paragraph From Ministry of Health Asset Inventory includes FCAP (The Facility Condition Assessment Program, which provides data on the condition of all the infrastructure assets in the hospital sector)-eligible assets only, which excludes Design, Build, Finance, Maintain (DBFM) hospitals.
- footnote[38] Back to paragraph From Ministry of Education website.
- footnote[39] Back to paragraph From
- footnote[40] Back to paragraph From NOTE: Infrastructure Ontario is responsible for the base-building components of some of these assets, and as such, there may be overlap with the numbers provided in the GREP sector.
- footnote[41] Back to paragraph From
- footnote[42] Back to paragraph From
- footnote[43] Back to paragraph From A format for classifying building elements and related sitework to enhance reporting and project management at all stages of the building life cycle.
- footnote[44] Back to paragraph From The Health Infrastructure Renewal Fund provides funds to supplement a hospital's existing capital renewal program and help address renewal needs (e.g., roofing systems, boilers, windows) on a priority basis.
- footnote[45] Back to paragraph From
- footnote[46] Back to paragraph From
- footnote[47] Back to paragraph From Ontario Universities Facilities Condition Assessment Program – Appendix B.
- footnote[48] Back to paragraph From