Appendix D - Trends
Appendix D – Trends
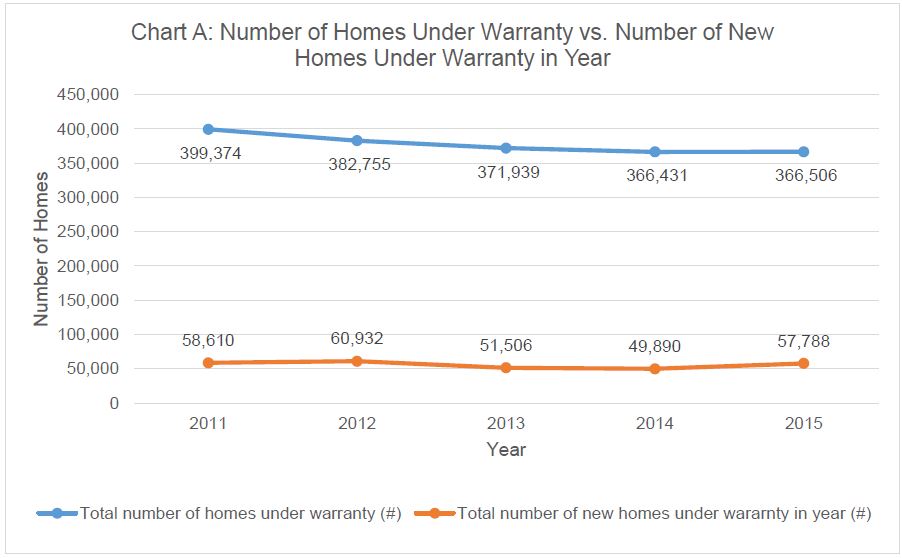
New homes under warranty
Trend number 1: Total number of new homes registered under warranty remains high
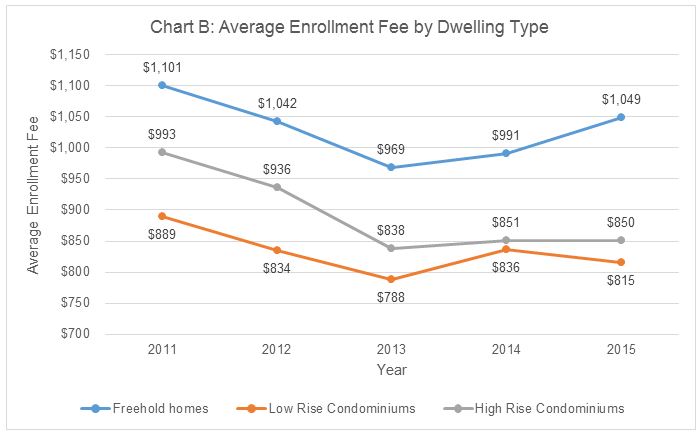
Warranty cost
Trend number 2: Warranty costs have decreased in Ontario since 2011
Dispute resolution process
Trend number 3: Average number of claims, conciliation inspections and LAT decisions have been stable since 2011
Table 1: Five Year Trend Analysis of Claims, Conciliation Requests and Inspections and LAT Decisions
| Year | 2011 | 2012 | 2013 | 2014 | 2015 |
|---|---|---|---|---|---|
| Number of homes under warranty | 397,901 | 381,181 | 370,537 | 364,925 | 365,864 |
| Number of claim forms submitted | 59,423 | 55,464 | 54,206 | 56,312 | 55,974 |
| Claim forms submitted as percentage of number of homes under warranty | 14.9% | 14.6% | 14.6% | 15.4% | 15.3% |
| Number of conciliation requests | 4,629 | 4,921 | 4,448 | 3,890 | 5,490 |
| Number of conciliation requests as a percent of claims forms submitted | 7.8% | 8.9% | 8.2% | 6.9% | 9.8% |
| Number of conciliation inspections conducted | 980 | 994 | 1,063 | 1,077 | 1,361 |
| Conciliation inspections conducted as percentage of claim forms submitted | 1.6% | 1.8% | 2.0% | 1.9% | 2.4% |
| Number of LAT decisions issued | 13 | 22 | 26 | 19 | 16 |
| LAT decisions issued as percentage of conciliation inspections conducted | 1.3% | 2.2% | 2.4% | 1.8% | 1.2% |
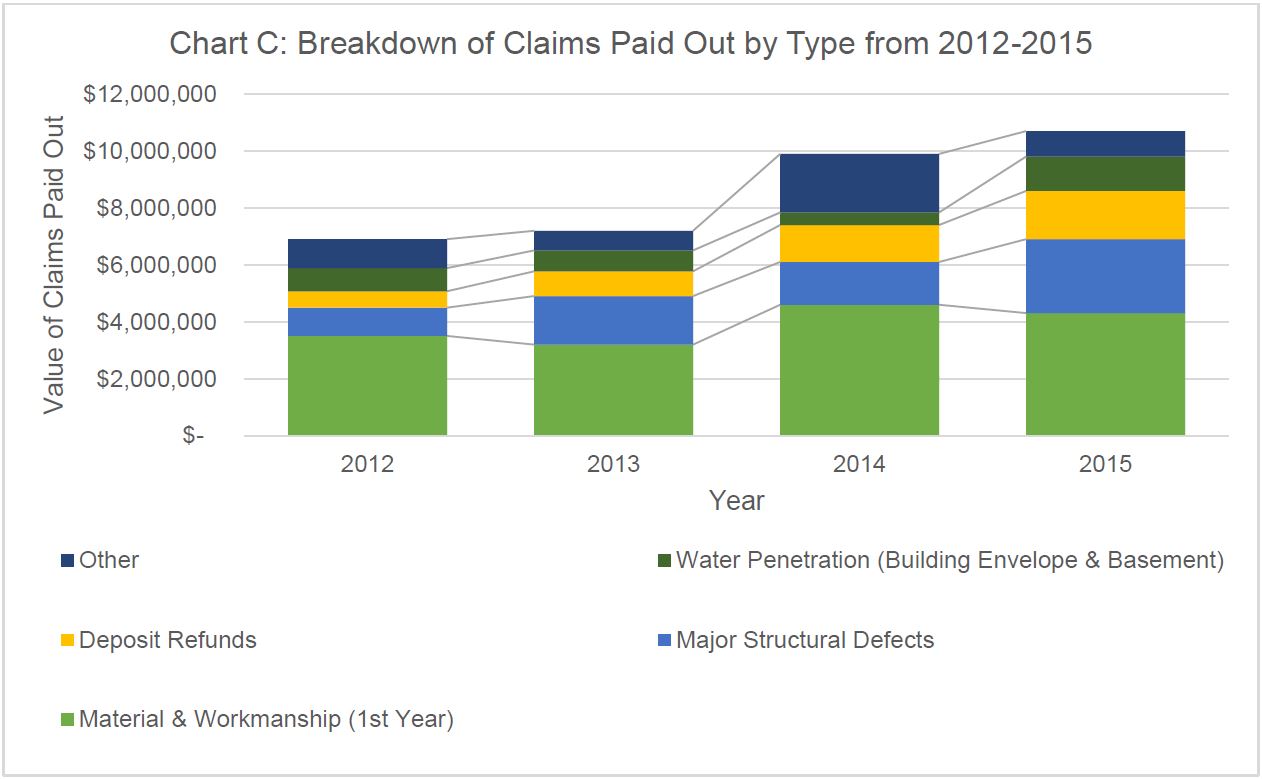
Most common claims
Trend number 4: Material and workmanship (1st year) is the most common claim
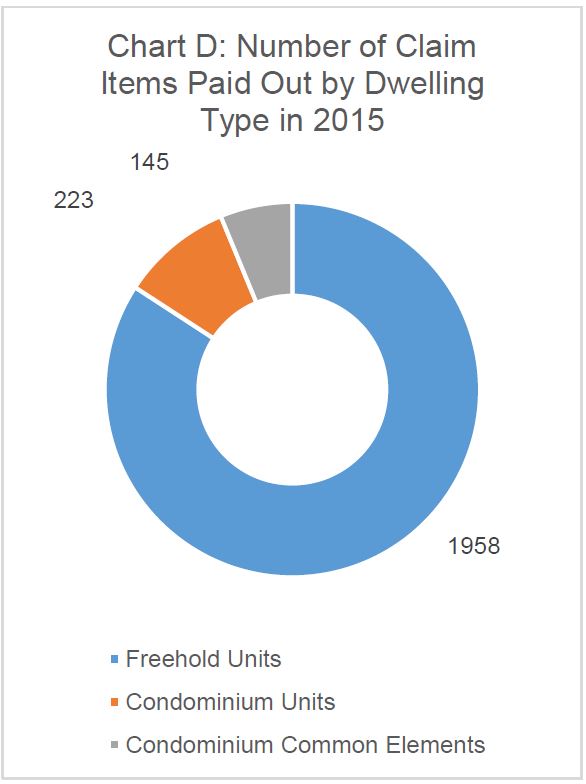
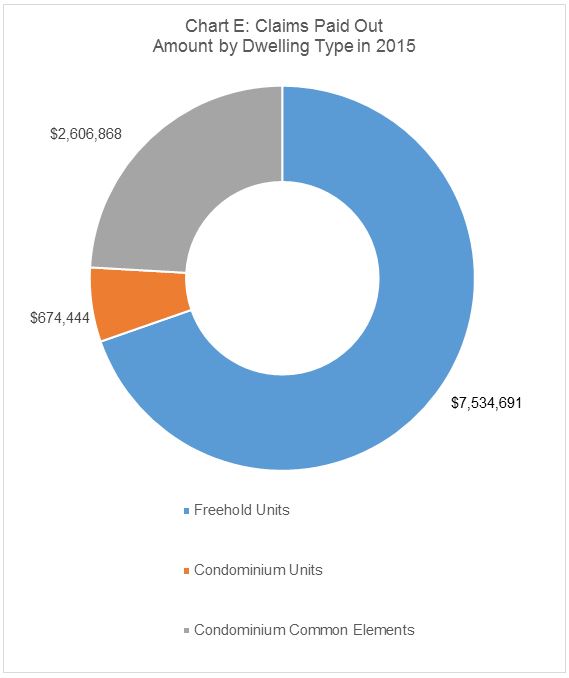
Claims paid in 2015
Trend number 5: Freehold units have the largest number and dollar amount of claims paid out in 2015
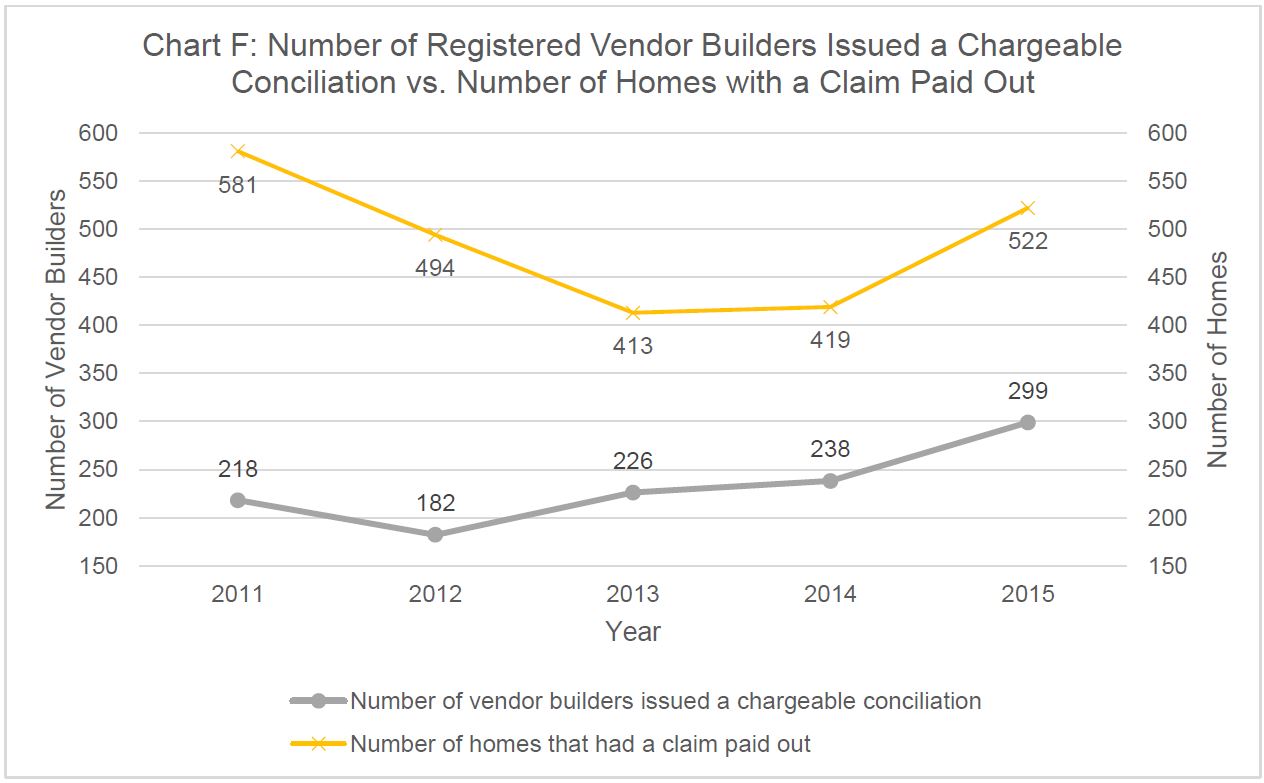
Chargeable conciliations
Trend number 6: The number of homes with a claim paid out in any given year is less than the number of vendor builders issued a chargeable conciliation
Updated: February 26, 2024
Published: August 15, 2016