Conclusion and Appendices
Conclusion (7.0)
Lakeshore capacity assessment is a tool to help municipalities and other agencies with responsibility for land-use planning to develop inland lakes in a sustainable manner. Used in concert with other federal, provincial and municipal water-related laws, regulations and bylaws, lakeshore capacity assessment will help to ensure that the province’s inland lakes on the Precambrian Shield will continue to have good water quality and healthy fish communities for generations to come.
This Lakeshore Capacity Assessment Handbook was developed, along with the Lakeshore Capacity Model, to help municipalities to meet their obligations under the Planning Act and the Provincial Policy Statement (2005). Cooperation among agencies, municipal planning authorities, residents' and cottagers' associations, developers and the public will help to achieve sustainable development of Ontario’s inland lakes.
Appendix A
Rationale for a revised phosphorus criterion for Precambrian shield lakes in Ontario.
Abstract
Ontario should revise the existing provincial water quality objective (PWQO) for total phosphorus in surface waters. The existing, two-tiered, numeric guideline overprotects some lakes, fails to adequately protect others, produces unwarranted asymmetries in shoreline development potential and does not protect against a cumulative loss of diversity in the resource as a whole. A new, interim PWQO is proposed for lakes on the Precambrian Shield. This revised PWQO allows a 50 per cent increase in phosphorus concentration from a modeled baseline of water quality in the absence of human influence. The proposed objective prevents cumulative losses of water clarity, is detectable with a modest sampling effort, maintains the existing diversity in lake water quality and incorporates the regionally specific objectives of other jurisdictions into a single numeric criterion. The same principles should be considered in a future review of the PWQO for phosphorus in off-Shield lakes and rivers.
Document inquiries to:
Tim Fletcher, Team Leader
Standards Development Branch
Ecological Standards
E-mail: tim.fletcher@ontario.ca
With contributions from:
- Ron Hall – Formerly MOE
- Peter Dillon – Formerly MOE
- Ken Nicholls – Formerly MOE
- Ian Smith – Standards Development Branch, MOE
- Adam Socha – Formerly of Standards Development Branch, MOE
- Conrad de Barros – Operations Division, Eastern Region, MOE
- Shiv Sud – Formerly of the Environmental Partnerships Branch, MOE
For critical review we wish to thank:
- Dr. Joe Kerekes – Canadian Wildlife Service, Environment Canada, Dartmouth, NS
- Dr. Rick Nordin – British Columbia Ministry of the Environment, Victoria, BC
- Greg Searle – Wisconsin Department of Natural Resources, Madison, WI, USA
Additional contributors:
- Neil Hutchinson – Gartner Lee, Markham, ON (formerly MOE)
- Doug Spry – Environment Canada, Hull, QC (formerly MOE)
Existing PWQO for total phosphorus (1.0)
The existing provincial water quality objective (PWQO) for total phosphorus was developed by MOE in 1979. It draws on the trophic status classification scheme of Dillon and Rigler (1975) to protect against aesthetic deterioration and nuisance concentrations of algae in lakes and excessive plant growth in rivers and streams. The rationale (MOE 1979) acknowledges that elemental phosphorus can be toxic but that, since it is rare in nature, its toxicity is rarely of concern. Instead, the purpose of this water quality objective is to protect the aquatic ecosystem from non-toxic forms of phosphorus:
…phosphorus must be controlled, however, to prevent any undesirable changes in the aquatic ecosystem due to increased algal growth… MOE 1979
The 1979 PWQO for phosphorus reflects the uncertainty regarding the effects of phosphorus and acknowledges the differences in the management of toxic and non-toxic pollutants. The PWQO does not explicitly distinguish between lakes in different regions of Ontario (i.e., Precambrian Shield versus southern Ontario) but, instead, categorizes lakes of low and moderate productivity into two corresponding levels of water quality. It is still in use today and reads:
Current scientific evidence is insufficient to develop a firm objective at this time. Accordingly, the following phosphorus concentrations should be considered as general guidelines which should be supplemented by site- specific studies:[For lakes:]
To avoid nuisance concentrations of algae in lakes, average total phosphorus concentrations for the ice-free period should not exceed 20 µg/L.
A high level of protection against aesthetic deterioration will be provided by a total phosphorus concentration for the ice-free period of 10 µg/L or less. This should apply to all lakes naturally below this value.
[For rivers and streams:]
Excessive plant growth in rivers and streams should be eliminated at a total phosphorus concentration below 30 µg/L.
The need for phosphorus management (2.0)
The Government of Ontario’s goal for surface water management is:
…to ensure that the surface waters of the province are of a quality which is satisfactory for aquatic life and recreation…MOEE 1994
In Ontario, phosphorus is managed to protect the clarity of its recreational waters from unacceptable increases in turbidity caused by algal growth in the water column and to prevent the formation of nuisance blooms of algae on the water’s surface. Although water clarity is also reduced by its content of dissolved organic carbon (DOC), which stains the water brown, DOC in Precambrian Shield waters is controlled by natural factors and is not readily amenable to management. Phosphorus concentrations will have little influence on the clarity of lakes with high DOC levels but may still have to be considered for the protection of other attributes.
The process of decomposition of organic matter consumes oxygen from a lake and so, at some point, the stimulation of excess algal growth by increasing phosphorus concentrations may decrease the amount of dissolved oxygen that is available to aquatic life. In addition, phosphorus may be released from the bottom sediments of lakes during periods of anoxia (oxygen deprivation), which further enriches the lake water. Although Ontario has a separate PWQO for dissolved oxygen, the relationship between phosphorus and oxygen is implicit in any lake management activities and should, at least, be considered in formulating the PWQO.
In summary, the PWQO for total phosphorus is intended to:
- Protect the aesthetics of recreational waters by preventing losses in water clarity
- Prevent nuisance blooms of surface algae
- Maintain the existing diversity in water clarity in Precambrian Shield lakes
- Provide indirect protection against oxygen depletion
Need for revision (2.1)
The total phosphorus PWQO serves as the cornerstone for making lake management decisions and achieving the necessary balance between health of the aquatic system and development in a watershed. The PWQO must, therefore, be based on the most current, scientifically sound information. The existing rationale states that the PWQO was developed and used despite incomplete knowledge of relationships between phosphorus concentrations in water and the corresponding plant and algal growth in lakes and rivers (MOE 1979). It was therefore later revised to an interim PWQO (MOEE 1994). Evaluation of the scientific advances since that time is necessary to ensure that the interim PWQO reflects current scientific understanding and to determine whether a revision in its status is warranted.
The rationale for revisiting the PWQO for phosphorus does not lie exclusively in better information on its effects as a pollutant. Instead, improved understanding of watershed processes, biodiversity and the assessment of cumulative effects over the past 20 years have lead to the corporate adoption of these considerations into the water management process (MOEE 1994). This has revealed several shortcomings with the existing, two-tiered guideline of 10 µg/L for "a high level of protection against aesthetic deterioration" and 20 µg/L "to avoid nuisance concentrations of algae". Although these numeric objectives are designed to maintain water clarity and aesthetic values and have performed well for more than 20 years, they fail to protect against the cumulative effects of development and do not protect the existing diversity in water quality across the province and the associated biodiversity.
In 1996, Ontario decided to review its PWQO for total phosphorus. The bulk of Ontario’s 226,000 lakes (Cox 1978) lie on the Precambrian Shield and the scientific basis for a new PWQO had previously been developed for these lakes (Hutchinson et al. 1991). Accordingly, the three-year review process targeted Precambrian Shield lakes first, with off-Shield lakes, the Great Lakes, and streams and rivers to be reviewed later.
Total phosphorus and the PWQO development process (3.0)
Ontario’s PWQO development process is intended to deal specifically with toxic substances. It uses published studies on the effects of pollutants to estimate a safe concentration for indefinite exposure (MOEE 1992). The only data which are mandatory for PWQO development are data on toxicity, bioaccumulation and mutagenicity (the capability of mutation). Information on aesthetic impairment, such as taste and odour, may also be considered but is not mandatory. The protocol for the Government of Ontario’s water quality objective development process (MOEE 1992) requires a minimum dataset and specifies both the number and quality of studies which are required for development of a PWQO. If either the mandatory elements are not fulfilled or the minimum dataset does not exist, then an interim PWQO is developed with the intent to upgrade it to a full PWQO when the data become available.
The interim status of the existing PWQO for total phosphorus should not, however, be interpreted solely as a reflection of incomplete knowledge at the time of its formulation. Development of a PWQO for total phosphorus is distinctly different from the development of a PWQO for toxic substances. Phosphorus' lack of toxicity and the insufficient knowledge of its effects should not provide the rationale for its interim status. It is therefore inappropriate to adhere strictly to the established procedures (MOEE 1992). Instead, those reviewing the status of the phosphorus criterion should consider the following:
- The detrimental effects of phosphorus are indirect and not a result of toxicity
- Some effects of phosphorus are aesthetic and so its management requires an element of subjectivity
- Our knowledge of the effects of small increases in phosphorus on the aquatic ecosystem are incomplete
- Factors such as dissolved organic carbon and the biotic community may modify the detrimental effects of phosphorus on the environment.
Toxicity and PWQO development (3.1)
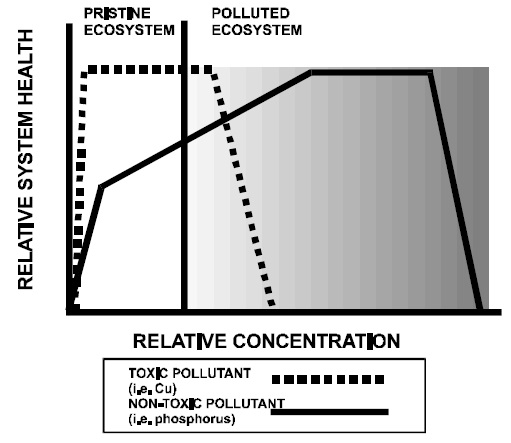
Although pollutants such as copper or zinc are required nutrients at trace levels, they become toxic at concentrations slightly above ambient levels. As a result, the health of aquatic organisms, and hence the ecosystem, is maintained at low ambient concentrations but declines rapidly with even slight increases in concentration (Figure 1).
Phosphorus is a major nutrient. The first responses of an aquatic system to phosphorus additions — increased productivity and biomass — are beneficial and concentrations can increase substantially with no direct adverse effects. Beyond a certain point, however, further additions stimulate indirect detrimental effects which ultimately decrease system health. It is therefore a more difficult proposition to derive safe levels for phosphorus than it is for toxic pollutants.
Other considerations addressed in PWQO development (3.2)
Figure 1. Generalized responses of an ecosystem to toxic and non-toxic pollutants
The first responses of a lake to enrichment — decreased water clarity and increased algal biomass — are aesthetic and of concern only to humans. Assessment of aesthetic effects is highly subjective, however, and perceived changes in water clarity are based largely on what one is used to (Smeltzer and Heiskary 1990). The development of a phosphorus objective must therefore acknowledge an element of subjectivity in dealing with human concerns and consider that aesthetic effects begin where a change in water clarity is first noticeable to the human eye or where the average water clarity first exceeds natural variation.
The biotic effects of incremental phosphorus enrichment remain poorly understood. Some — such as the formation of nuisance blooms of blue-green algae and their associated toxicity — are well known but, with few exceptions, are not a consideration at the phosphorus concentrations observed in Precambrian Shield lakes. Effects of small changes in phosphorus concentration may well be beneficial to the productivity of the aquatic system, but the effects on diversity and system function have not been studied.
In contrast, the effects of phosphorus enrichment on the oxygenated hypolimnetic habitat of many cold water species (e.g., the lake trout, Salvelinus namaycush) are known and can be addressed objectively (MacLean et al. 1990). Dissolved oxygen concentrations are explicitly protected by the Ontario PWQO for dissolved oxygen (MOEE 1994) or by specific guidelines for fish habitat which are administered by agencies such as the Ministry of Natural Resources. They are not intended as a direct consideration in phosphorus objective development. Nevertheless, recent advances in oxygen-phosphorus models (i.e., Molot et al. 1992) allow for a direct estimation of the effect of phosphorus concentrations on dissolved oxygen in lakes. Any protection of dissolved oxygen which is achieved, even indirectly, by the phosphorus objective is beneficial.
Management of phosphorus as a method of controlling algal biomass, water clarity and dissolved oxygen is the central presumption behind setting safe limits. Total phosphorus concentrations set the upper limits on algal yields in lake water. The relationship between algal yield and water clarity is well established and these indicators are all predictably related (Dillon and Rigler 1975, Volleinweider and Kerekes 1980, Canfield and Bachmann 1981). Although natural levels of dissolved organic carbon may alter these relationships, the effects are predictable, have been quantified (Dillon et al. 1986) and have been considered in this rationale document.
Nevertheless, in recent years, some challenges have emerged as to the adequacy of phosphorus-loading models for managing trophic status (Mazumder and Lean 1994) and some controversies have developed regarding the importance of nutrient loading (bottom up) versus biotic interactions (top down) in controlling algal growth in lakes (DeMelo et al. 1992, Carpenter and Kitchell 1992). These criticisms, however, address only the unexplained variance in the phosphorus/chlorophyll/water clarity relationship and have not produced convincing arguments against, or alternatives to, its use. Biotic models are best viewed as complementary explanations of the same phenomena (Carpenter and Kitchell 1992) and not as alternatives to that relationship. Management of biotic factors to control water clarity is hampered by incomplete understanding, large and unpredictable variance in the natural system and the mandate of the Ministry of the Environment to manage sources of nutrients and their concentrations in the water. As such, "the prudent lake manager…might be best advised to focus first on nutrient abatement and then on biomanipulation" (DeMelo et al. 1992). The PWQO for total phosphorus therefore provides the basis to maintain desirable levels of phosphorus in Ontario’s surface waters through the control of nutrient loading only.
The sources of phosphorus to the aquatic environment also influence the derivation of a PWQO. With the exception of sewage treatment plant discharges, non-point sources of phosphorus are the most important contribution to nutrient enrichment of Precambrian Shield surface waters. These include changes in land use, septic systems from residential and cottage development, agriculture, timber harvest and urbanization. In many cases, these sources are diffuse and develop over extended periods of time. There may also be delays of up to decades between the addition of phosphorus sources to a watershed (i.e., septic systems), its movement from the source to surface water (Robertson 1995) and its expression as a change in trophic status. Shoreline residential development in particular represents a significant contribution to the eutrophication of Ontario’s Precambrian Shield lakes (Dillon et al. 1986).
As a result, phosphorus management in Ontario requires the extensive use of nutrient-loading models. These provide instantaneous estimates of the long-term, steady-state response of surface waters to non-point sources of phosphorus. They operate on the fundamental principles of areal loading of phosphorus to a lake’s surface (Volleinweider 1976, Volleinweider and Kerekes 1980) and can consequently be adapted to a variety of sources.
There are, therefore, elements of uncertainty which are unique to the development of a PWQO for naturally occurring, non-toxic, non point-source pollutants such as phosphorus. Some may be resolved as models are further refined or as scientific understanding is further developed. Subjective elements of uncertainty, such as aesthetics, typically cannot be addressed in the conventional PWQO development process (currently only the aesthetics of taste and odour are considered). In addition, management of the pollutants that may take decades to manifest their effect on the aquatic system necessitates the use of models to predict such future effects.
New considerations for PWQO development (4.0)
Managing to preserve diversity in trophic status (4.1)
The existing numeric objectives for total phosphorus ignore fundamental differences between lake types and their nutrient status in the absence of human influences. Ontario’s Precambrian Shield lakes now span a range of phosphorus concentrations from oligotrophic to mesotrophic, however, the distribution favours an abundance of higher quality, oligotrophic lakes (Figure 2). Within this range, however, there is still a large diversity of water clarity, controlled by both total phosphorus concentrations and dissolved organic carbon (Dillon et al. 1986).
Figure 2. Distribution of total phosphorus concentrations in sampled Ontario lakes
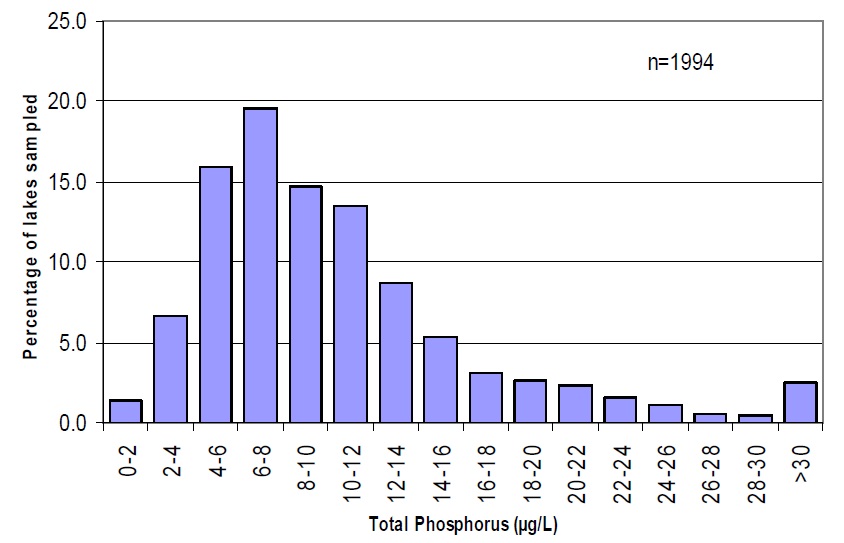
(source: MOE Inland Lakes database, March 2004)
The logical outcome of the current two-tiered PWQO is that, over time, all recreational waters will converge on each of the two water quality objectives. This will produce a cluster of lakes slightly below 10 µg/L and another slightly below 20 µg/L — this means that the provincial diversity in lake water quality will decrease along with the diversity of the associated aquatic communities.
The second shortcoming is that, over time, some lakes would sustain unacceptable changes in water quality while others would be unaffected, producing both ecological and economic asymmetries as their shorelines are developed. A lake with a natural phosphorus concentration of 4 µg/L is a fundamentally different from a lake at 9 µg/L. Both lakes, however, would be allowed to increase to 10 µg/L under the existing PWQO. One lake would experience no perceptible change (9 to 10 µg/L) and be overprotected, but the other (4 to 10 µg/L) would be under-protected and would change dramatically. In both cases, human perceptions of aesthetics would be ignored in the objective. Allocation of phosphorus loadings between these two lakes would be unfair as well; the high phosphorus lake could sustain a greater change than the low phosphorus lake, but would be restrained to a much lower load.
A final concern is that the existing PWQO does not explicitly consider the effect of phosphorus on hypolimnetic oxygen or aquatic biota. It does, however, make reference to site-specific studies in the assessment process.
In summary, the existing numeric objectives are too stringent for some lakes and do not protect others adequately. Allocation of phosphorus loadings is unnecessarily restricted in some lakes and overly generous in others. Neither biotic nor aesthetic attributes are adequately protected. Over time, Ontario’s diversity in lake trophic status will decrease.
Environmental baselines and measured water quality (4.2)
An emerging concern in environmental assessment is the need for a standard baseline for comparison against environmental change. The existing PWQO is interpreted through measurements of present and past water quality. Detecting change is thus difficult for non-point additions which may occur over large areas and extended time periods. Phosphorus measurements made in the period between development of a non-point source and its expression as a change in trophic status will therefore underestimate the effect and may wrongfully lead to the conclusion that the lake has not responded to the phosphorus loading.
The incremental nature of watershed development results in a slow and gradual increase in trophic status. The high degree of seasonal and annual variance in lake phosphorus levels (Clark and Hutchinson 1992) means that changes may not be detectable without an intensive monitoring program that requires the collection of many samples and uses a precise and replicable analytical method.
Finally, a slow increase in trophic status over a generation may not be noticed by human observers. Environmental change which occurs during one generation becomes the status quo for the next. Over a long period, therefore, any assessment baseline which is based on measurements of total phosphorus will increase.
In summary, any phosphorus objective which relies exclusively on measured water quality will suffer from:
- Detection problems due to natural variance and analytical problems
- The lag time between addition of phosphorus to a watershed and its expression in a lake
- Failure to detect incremental changes in water quality
- Human perceptual conditioning which reduces the apparent change in water quality over time
As a result, a rising assessment baseline and incremental decreases in water quality will slowly degrade the quality of lake water past any objective. Effects will accumulate by virtue of delay in their expression, repetition over time and space, extension of the boundary of the effects by the transport of phosphorus downstream or by triggering indirect changes in the system such as the release of phosphorus from sediments during anoxic periods. Non-point source phosphorus loading is thus an excellent example of a pollutant which produces cumulative effects on the aquatic environment. The emergence and validation of mass balance phosphorus models for lakes, however, offers an opportunity to correct some of the disadvantages of water quality measurements and conventional assessment techniques.
Phosphorus criteria in other jurisdictions (5.0)
A brief survey of jurisdictions across Canada and the U.S. states bordering the Great Lakes shows different approaches to establishing criteria for surface water quality and to managing contributions of phosphorus to surface waters.
Canada (5.1)
In February, 2004, the National Guidelines and Standards Office of Environment Canada published the Canadian Guidance Framework for the Management of Phosphorus in Freshwater Systems. The Framework offers a tiered approach in which phosphorus concentrations should not exceed pre-determined trigger ranges, and phosphorus concentrations should not increase more than 50% over a system-specific baseline (reference) condition. The trigger ranges are based on the range of phosphorus concentrations in water that define the reference trophic status for a site. If the upper limit is exceeded, or is likely to be exceeded, further assessment is required, and a management decision may be required.
Québec (5.1.1)
The Province of Québec uses the 20 and 30 µg/L phosphorus values that are also in use in Ontario (but not the 10 µg/L value), however there is no indication of implementation approaches yet. Québec has begun to review the approaches of other jurisdictions with the goal of updating its own during the next three years and has expressed particular interest in the approach being considered in Ontario (D. Nadeau, Ministère du Loisir, de la Chasse et de la Pèche, Direction régionale de l'Abitibi-Temiscamingue, Noranda, QC pers. comm.)
British Columbia (5.1.2)
British Columbia uses criteria for surface water quality which vary as a function of the type of aquatic system and its intended use (Table 1).
| Water use | Characteristics: Phosphorus (µg/L)* | Characteristics: Chlorophyll a (mg/m2)** |
|---|---|---|
| Drinking water (lakes) | 10 max | none proposed |
| Aquatic life (streams) | none proposed | 100 max |
| Aquatic life (lakes only—with salmonids as the predominant fish species) | 5 to 15 inclusive | none proposed |
| Recreation: streams only | none proposed | 50 max |
| Recreation: lakes only | 10 max | none proposed |
* Total phosphorus in lakes is either the spring overturn concentration, if the residence time of the epilimnetic water is greater than six months, or the mean epilimnetic growing-season concentration, if the residence time of the epilimnetic water is less than six months
** Chlorophyll a criteria in streams apply to naturally growing periphytic algae
Manitoba (5.1.3)
The Province of Manitoba has two phosphorus criteria for surface water: one for flowing waters of 50 µg/L and one for lakes of 25 µg/L. Manitoba will be reviewing these criteria in the next two years.
Alberta (5.1.4)
The Province of Alberta generally uses 50 µg/L as an objective for phosphorus in surface water.
United States (5.2)
The U.S. Environmental Protection Agency (USEPA) has decided not to develop a national standard for phosphorus in surface water. Instead, the USEPA provides guidance to states to develop their own methods to assess trophic status and to develop criteria for surface water quality.
Criteria are intended to guide resource assessment, establish management priorities, evaluate projects and assist with long-range planning. The USEPA is emphasizing non-traditional indicators of enrichment, such as regional biological criteria and land-use changes, as well as the more conventional indicators, such as total phosphorus and water clarity. Biological indicators are showing particular promise. Methods of nutrient classification will emphasize differences between regions of the U.S. based on the size, and the nutrient and watershed status of water bodies and will advise on consistent means of gathering, storing and evaluating data, all with the intent of moving beyond classification to improve the resource (George Gibson, USEPA, Annapolis, MD. pers. comm. Nov. 14, 1996).
Minnesota (5.2.1)
| Ecoregion | Most Sensitive Use | P Criterion |
|---|---|---|
| Northern lakes and forests | Drinking water supply | < 15 µg/L |
| Northern lakes and forests | Cold water fishery | < 15 µg/L |
| Northern lakes and forests | Primary contact recreation and aesthetics | < 30 µg/L |
| North central hardwood forests | Drinking water supply | < 30 µg/L |
| North central hardwood forests | Primary contact recreation and aesthetics | < 40 µg/L |
| Northern glaciated plains | Recreation and aesthetics
|
|
| Western corn belt plains | Drinking water supply | < 40 µg/L |
| Western corn belt plains | Primary contact recreation and aesthetics
|
|
The State of Minnesota uses an ecoregion approach in which eutrophication standards vary with the region (i.e., the natural water quality) (Table 2). Criteria were developed to meet specific uses, such as fishery protection and swimming, and are based on reference lakes and public perceptions of water quality. They are not formal standards (which are legally binding in the U.S.) but are used for setting goals and priorities. As a starting point, if the concentration of phosphorus in a lake is better than the criterion for that ecoregion, then efforts will be made to protect it. If the concentration of phosphorus is greater than the criterion, then site-specific assessments may be done to ensure that the criterion is appropriate before corrective actions are taken.
Phosphorus criteria are related to summer chlorophyll a concentrations and acceptable chlorophyll concentrations are quite variable. In the areas of the northern lakes and forests, 10 µg/L would be considered to be a mild bloom, whereas 70 to 90 µg/L would be the norm in more southerly agricultural areas. Minnesota has also produced some guidelines which relate phosphorus concentrations to the probability of severe summer blooms and is starting work on phosphorus criteria for rivers and streams (Heiskary 1997).
Wisconsin (5.2.2)
The State of Wisconsin is in the final stages of developing phosphorus standards based on the ecoregion approach. It has used 14 years of monitoring data to establish three phosphorus regions for the state, each of which is characterized by statistically distinct water quality. It has relied on the best professional judgment of water quality experts to establish the background water quality of various types of water bodies in each region. The phosphorus objectives were chosen as the average of the lowest 25 per cent of measured phosphorus concentrations for each lake type in each region, rounded down to the nearest multiple of five (Table 3). Separate standards were developed for impoundments and natural lakes. Exceeding the standard is interpreted as a trigger for further evaluation (Searle 1997).
| Region | Drainage/ mixed (µg/L) | Drainage/ stratified (µg/L) | Seep/ mixed (µg/L) | Seep/ stratified (µg/L) |
|---|---|---|---|---|
| North | 15 | 10 | 10 | 10 |
| Central | 5 | 5 | 5 | 5 |
| South | 25 | 15 | 15 | 10 |
| Region | Mixed (µg/L) | Stratified (µg/L) |
|---|---|---|
| North | 20 | 10 |
| Central | 5 | 10 |
| South | 25 | 10 |
Maine (5.2.3)
The State of Maine has developed a non-degradation approach to phosphorus management. The existing phosphorus concentration of a lake and its sensitivity to loadings are used to establish a lake-specific allowable phosphorus increase. Lakes are classified into categories ranging from outstanding water quality to poor/restorable, and to low, medium and high levels of protection based on considerations such as usage and unique qualities. Acceptable increases are very stringent, ranging from 0.5 µg/L of total phosphorus for outstanding quality/high protection to 2 µg/L for good quality/low protection lakes. A watershed model is then used to allocate development to achieve the water quality goal. Very generous use is made of mitigation techniques such as buffer strips, storm water detention ponds and septic system setbacks in an attempt to control phosphorus export from new development in the watershed. Specific mitigation techniques will vary with the degree of protection required and each technique has a quantitative export coefficient to estimate the effect of the development on water quality (Dennis et al. 1992).
Vermont (5.2.4)
The State of Vermont has focused on site-specific management of enriched lakes (e.g., Lake Champlain) in the past. It has recently completed an intensive study of Lake Champlain and developed separate phosphorus objectives for 13 basins of the lake. These range from 10 to 25 µg/L, compared to current levels of 9 to 58 µg/L which exceed the objective in eight of the 13 basins. Vermont is now considering developing standards for all lakes in the state (Smeltzer 1997 and pers. comm.).
Other states (5.2.5)
Some jurisdictions, such as Michigan and Pennsylvania, have not developed surface water criteria, but rely solely upon effluent concentrations, discharge loadings or best management practices.
Great Lakes (5.2.6)
The Great Lakes Water Quality Agreement (1987) states that:
The concentration should be limited to the extent necessary to prevent nuisance growths of algae, weeds and slimes that are or may become injurious to any beneficial water use.
Fourteen impairments to beneficial uses are listed in the agreement. The agreement also contains lake-specific target loads and restrictions on sewage treatment plant discharges: 1 mg/L total phosphorus in the basins of lakes Superior, Michigan and Huron and 0.5 mg/L for plants in the basins of lakes Erie and Ontario. Several narrative statements regulate phosphorus loadings from industrial discharges to the maximum extent possible.
Summary (5.3)
All jurisdictions have attempted to deal with regional variance in natural or background water quality in various ways and to accommodate different criteria for different uses. One cannot judge the success of each approach but, in all cases, the intent is reasonable and achievable. Jurisdictions in which water quality is similar to Ontario’s have developed similar objectives but, in many cases, use a series of regional or use-specific objectives.
The State of Maine, unlike other jurisdictions, has tied very specific implementation details to its phosphorus objectives. Maine’s objectives, like Ontario’s proposed objective, appear to address shoreline development as the most important water quality stressor. It has combined very restrictive allowable increases in phosphorus concentrations to very permissive assumptions regarding the efficacy of techniques for mitigating phosphorus export. Ontario, in contrast, is proposing to allow for a generous proportional increase, combined with restrictive assumptions regarding mitigation — this approach is described in the following section (Section 6.0).
Proposal for a revised PWQO for Precambrian shield lakes (6.0)
Recent advances in phosphorus modeling, the understanding of watershed dynamics and the assessment of cumulative effects have been used to develop a new PWQO for Ontario’s Precambrian Shield lakes. The proposal encompasses two innovations:
- The use of models to establish a baseline for changes in trophic status
- A proportional increase from that baseline due to phosphorus loadings from human activities
This approach would allow each Precambrian Shield to have its own numeric water quality target. The challenge now lies in expanding this understanding beyond shoreline development in Precambrian Shield lakes (for which it was originally developed) to apply it to all the waters of the province, including off-Shield lakes, the Great Lakes, and rivers and streams.
Modeled assessment baseline (6.1)
The basis of the revised PWQO is increased reliance on water quality modeling in the objective setting process. Recent advances in trophic status models allow us to calculate the predevelopment phosphorus concentrations of inland lakes (Hutchinson et al. 1991). This is done by modeling the total phosphorus budget for the lake, comparing the predicted concentration to a reliable water quality measurement and subtracting that portion of the budget which is attributable to human activities. Further work is necessary for water bodies lying off the Precambrian Shield, but the basic premise is applicable to any water body where a phosphorus budget can be calculated.
The main advantage of the modeling approach is the establishment of a constant assessment baseline. A modeled predevelopment baseline is based on an undeveloped watershed so it will not change over time. This serves as the starting point for all future assessments. Every generation of water quality managers will therefore have the same starting point for decision- making, instead of a steadily increasing baseline of phosphorus measurements.
The ministry therefore proposes a PWQO for total phosphorus which is based on a modeled predevelopment phosphorus concentration. This will provide water quality managers with a:
- Constant assessment baseline
- Buffer against incremental loss of water quality
- Buffer against variable water quality measurements
The predevelopment phosphorus concentration should not be interpreted as a PWQO. Pristine phosphorus levels have not existed in Ontario for more than a century and their attainment is not cost effective in a heavily developed society. The modeled predevelopment concentration only serves as the starting point for the PWQO and as a reference point for future changes.
A model-based objective would have two additional advantages. First, the modeled response of the watershed to future changes is instantaneous. It applies new development directly against capacity, without the intervening decades it takes for phosphorus to move into a lake and be expressed as a measured change in water quality. Second, Ontario’s trophic status model is based on entire watersheds, so it allows explicit consideration of downstream phosphorus transport in the assessment.
Proportional increase (6.2)
The second component of the objective is a proportional increase from the modeled predevelopment condition. The proportional increase accommodates regional variation in natural or background water quality through the use of a lake-specific numeric objective for each Precambrian Shield lake. It is, in fact, a broader — yet simpler — application of the regionally specific, multi-tiered objectives proposed in other jurisdictions as a means of accommodating regional variation in background water quality (e.g., Minnesota and Wisconsin).
Ontario is proposing an allowable increase of 50 per cent above the predevelopment level. Under this proposal, a lake which was modeled to a predevelopment phosphorus concentration of 4 µg/L would be allowed to increase to 6 µg/L. Predevelopment concentrations of 6, 10 or 12 µg/L would increase to 9, 15 and 18 µg/L, respectively. A cap at 20 µg/L would still be maintained to protect against nuisance algal blooms.
There are numerous advantages to this approach:
- Each water body would have its own water quality objective that would be described with one number (i.e., predevelopment plus 50 per cent).
- Development capacity would be proportional to a lake’s original trophic status.
- As a result, each lake would maintain its original trophic status classification. A 4 µg/L lake could be developed to 6 µg/L and would maintain its classification as oligotrophic. A 10 µg/L lake could be developed to 15 µg/L, maintain its mesotrophic classification and development would not be unnecessarily constrained to 10 µg/L.
- The existing diversity of trophic status in Ontario would be maintained forever, instead of a future set of lakes at 10 µg/L and another at 20 µg/L.
Rationale for a 50 per cent increase (6.3)
Water clarity (6.3.1)
Water clarity in Ontario’s Precambrian Shield lakes is controlled by both dissolved organic carbon (DOC) and phosphorus (Dillon et al. 1986). Any phosphorus objective should therefore consider DOC as well as phosphorus in its derivation. Molot and Dillon (pers. comm.) used 14 years of data (1976-1990) from lakes in south central Ontario to produce the following relationship, summarized in Figure 3.
SD = 6.723 − (0.964 × DOC) + (9.267 ÷ TPep)
Where:
- SD
- Secchi depth (water transparency)
- DOC
- dissolved organic carbon
- TPep
- total phosphorus concentration in the epilimnetic waters of the lake
Figure 3 shows that the rate of loss of water clarity with phosphorus increase is greatest between 4 and 10 µg/L, suggesting that the existing PWQO of 10 µg/L allows the greatest effects in the most sensitive, high-quality lakes.
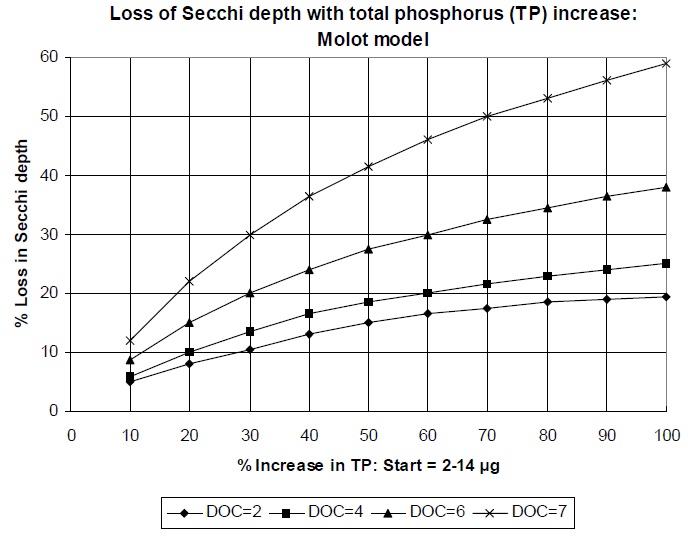
Figure 4 shows the response of water clarity to various proportional increases in total phosphorus concentration predicted for various DOC levels using the same equation. Responses have been grouped to include all lakes with initial phosphorus concentrations between 2 and 14 µg/L, so a 50 per cent increase represents final values of 3 to 21 µg/L. There is no clear threshold of changed water clarity — a point where further increases in phosphorus would induce a markedly severe change. Instead, there is a gradual loss of water clarity as phosphorus concentrations are increased from 10 to 100 per cent. The allowable percentage increase cannot, therefore, be determined on the basis of water clarity alone.
Figure 3. Relationship of predicted water clarity to total phosphorus and dissolved organic carbon (DOC) concentrations in Precambrian Shield lakes in south-central Ontario.
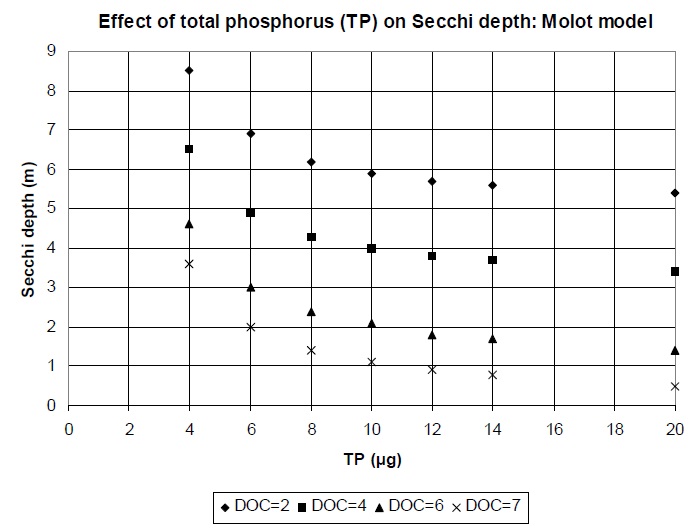
Figure 4. Predicted response of Secchi depth to 10 to 100 per cent increases in total phosphorus concentration from initial values of 2 to 14 µg/L at dissolved organic carbon (DOC) levels of 2, 4, 6 and 7 mg/L.
Detection of change in phosphorus and water clarity (6.3.2)
The average coefficient of variation in Secchi depth for a series of southern Ontario Precambrian Shield lakes was 17 per cent to 21 per cent during a 14-year period of record (Clark and Hutchinson 1992). A change of 25 per cent in water clarity would therefore represent a significant, detectable departure from natural variation. Based on the data from Figure 4, a 50 per cent increase in phosphorus concentration produces, on average, a 25 per cent loss in Secchi depth across the range of initial phosphorus (2 to 14 µg/L) and DOC (2 to 7) concentrations (Table 4). In addition, a 50 per cent increase protects the clearest and most desirable water clarity and allows a greater proportional change only in those lakes with high DOC where this parameter (rather than the phosphorus/chlorophyll relationship) is the limiting factor (Table 4).
| DOC | % Loss in water clarity |
|---|---|
| 2 | 14 |
| 4 | 18 |
| 6 | 27 |
| 7 | 41 |
| Average | 25.3 |
* The 50 per cent increase in TP is taken from a starting range of 2 to 14 µg/L to produce final values of 3 to 21 µg/L.
Hutchinson et al. (1991) reported a natural coefficient of variation in total phosphorus concentrations in south central Ontario lakes of about 20 per cent. Detection of a 20 per cent change in total phosphorus requires only two years of spring overturn measurements or one year of four to five measurements in the ice-free season (Clark and Hutchinson 1992). A phosphorus objective 50 per cent greater than the predevelopment conditions would therefore be detectable with even the most rudimentary sampling program and would limit changes in water clarity to an average of 25 per cent, a level just beyond the range in natural Secchi depth variation.
Protection of dissolved oxygen (6.3.3)
Although dissolved oxygen concentration is not intended to be a direct consideration in phosphorus objective development, any indirect protection of this parameter that results from the maintenance of the phosphorus objective is beneficial. Implementation procedures for Ontario’s PWQOs allow more stringent applications to protect beneficial uses in specific locations (MOEE 1994). In the case of phosphorus, more stringent applications are used most often to assist the Ministry of Natural Resources (MNR) with the protection of fish habitat in lakes inhabited by lake trout. Protection of lake trout is not, however, an explicit requirement of the PWQO for total phosphorus. Instead, habitat may be considered through the effect of phosphorus on dissolved oxygen content.
Dissolved oxygen concentrations are explicitly protected by Ontario’s existing PWQO for dissolved oxygen of 6 mg/L at 10°C for most biological species present in the cold water layer (hypolimnion) of thermally stratified lakes (MOEE 1994). For oxygen-sensitive species such as lake trout, a more specific water quality objective may be required (MOEE 1994). MNR has adopted a dissolved oxygen criterion of 7 mg/L for the protection of lake trout.
Oxygen-phosphorus models (i.e., Molot et al. 1992) have been incorporated into Ontario’s phosphorus model for the direct estimation of the effect of phosphorus on dissolved oxygen. These models can be used to identify those situations in which more stringent protection is required and for the explicit consideration of the lake trout habitat in routine management applications. They predict the effect of phosphorus on the hypolimnetic oxygen profile at the critical end-of-summer period, when lakes are warmest and oxygen depletion is near its maximum.
The revised PWQO for total phosphorus does appear to provide some indirect protection of hypolimnetic oxygen. The effect of a 50 per cent increase in phosphorus on dissolved oxygen was modeled using four stratified lake types, spanning a range from highly sensitive (shallow and small) to least sensitive (deep and large). Responses were expressed as volume-weighted average hypolimnetic oxygen concentration and as the volume of hypolimnion exceeding the PWQO of 6 mg/L. On average, limiting the increase in phosphorus to background plus 50 percent protects dissolved oxygen in any lake which is larger than 67 hectares, at least 28 metres deep, and has less than 12 µg/L of predevelopment phosphorus. Some portion of the hypolimnion remained at 6 mg/L of dissolved oxygen or better in all such lakes modeled. Lakes with predevelopment concentrations of 7 µg/L or less were particularly well protected, but the 50 per cent increase did not protect lakes with natural total phosphorus concentrations of 12 µg/L or more because of their higher initial phosphorus levels.
Future PWQO development activities (7.0)
This proposal for an interim PWQO for phosphorus applies only to inland lakes on the Precambrian Shield. A full revision of the PWQO for phosphorus in all surface waters should address the following:
- Evaluation of new science relating phosphorus effects to changes in ecosystem responses including dissolved oxygen levels
- Evaluation of the proposed PWQO for off-Shield lakes, especially in southern Ontario
- Evaluation of the proposed PWQO with regard to dystrophic lakes, particularly those in northern Ontario (these lakes are highly coloured due to humic and fulvic acids and typically have relatively high background phosphorus concentrations which may not provoke typical eutrophication responses)
- Evaluation of the approach used for Precambrian Shield lakes for its applicability to rivers and streams
- Review of the objectives for the Great Lakes and modifications, if required
- Evaluation of the role of introduced (exotic) species such as zebra mussels and the spiny water flea on ecosystem changes relating to phosphorus effects
References (8.0)
Canfield, D.E. Jr. And R.W. Bachmann. 1981. Prediction of total phosphorus concentrations, chlorophyll a and Secchi depths in natural and artificial lakes. Can. J. Fish. Aquat. Sci. 38: 414-423.
Carpenter, S.R. and J.F. Kitchell. 1992. Trophic cascade and biomanipulation: interface of research and management — a reply to the comment by DeMelo et al. Limnol. Oceanogr. 37: 208-213.
Clark, B. and N.J. Hutchinson. 1992. Measuring the trophic status of lakes: sampling protocols. Ontario Ministry of the Environment. September 1992. PIBS 2202. ISBN 0-7778-0387-9. 36 p.
Cox, E.T. 1978. Counts and measurements of Ontario lakes 1978. Fisheries Branch, Ontario Ministry of Natural Resources. 114 p.
DeMelo, R., R. France and D.J. McQueen. 1992. Biomanipulation: hit or myth? Limnol. Oceanogr. 37: 192-207.
Dennis, J., J. Noel, D. Miller and C. Eliot. 1992. Phosphorus Control in Lake Watersheds: A Technical Guide to Evaluating New Development. Maine Department of Environmental Conservation. Revised September 1992. 111 p.
Dillon, P.J. and F.H. Rigler. 1975. A simple method for predicting the capacity of a lake for development based on lake trophic status. J. Fish. Res. Bd. Can. 32: 1519-1531.
Dillon, P.J., K.H. Nicholls, W.A. Scheider, N.D. Yan and D.S. Jeffries. 1986. Lakeshore Capacity Study: Trophic Status. Final Report. Ontario Ministry of Municipal Affairs. May 1986. ISBN 0-7743-8077- 2. 89 p.
Heiskary, S.A. and C.B. Wilson. 1988. Minnesota Lake Water Quality Assessment Report. Minnesota Pollution Control Agency, St. Paul. 63 p.
Heiskary, S.A. 1997. The Minnesota ecoregion and attainable trophic state approach. pp. 8-15 in: Smeltzer, E. U.S. Environmental Protection Agency Lake Nutrient Criteria Guidance Manual Appendix — Case Studies. Draft 7/31/97.
Hutchinson, N.J., Neary, B.P. and P.J. Dillon. 1991. Validation and use of Ontario’s trophic status model for establishing lake development guidelines. Lake Reserv. Manage. 7: 13-23.
International Joint Commission. 1987. Revised Great Lakes Water Quality Agreement of 1978. 130 p.
MacLean, N.G., J.M. Gunn, F.J. Hicks, P.E. Ihssen, M. Malhiot, T.E. Mosindy and W. Wilson. 1990. Environmental and genetic factors affecting the physiology and ecology of lake trout. Lake Trout Synthesis — Physiology and Ecology Working Group. Ontario Ministry of Natural Resources. Toronto. 84 p.
Mazumder, A. and D.R.S. Lean. 1994. Consumer-dependent responses of lake ecosystems to nutrient loading. J. Plankton Research 16: 1567-1580.
MOE. Ontario Ministry of the Environment. 1979. Rationale for the establishment of Ontario’s Provincial Water Quality Objectives. Queen’s Printer for Ontario. 236 p.
MOEE. Ontario Ministry of Environment and Energy. 1992. Ontario’s Water Quality Objective Development Process. Queen’s Printer for Ontario. 42 p. + app.
MOEE. Ontario Ministry of Environment and Energy. 1994. Water Management: Policies, Guidelines, Provincial Water Quality Objectives of the Ministry of Environment and Energy. Queen’s Printer for Ontario. July 1994. 32 p. PIBS 3303E. ISBN 0-7778-3494-4.
Molot, L.A., P.J. Dillon, B.J. Clark and B.P. Neary. 1992. Predicting end-of-summer oxygen profiles in stratified lakes. Can. J. Fish. Aquat. Sci. 49: 2363-2372.
Robertson, W.D. 1995. Development of steady-state phosphate concentrations in septic system plumes. J. Contam. Hydrology. 19: 289-305.
Searle, G. 1997. Wisconsin Lake Phosphorus Criteria. pp. 25-29 in: Smeltzer, E. U.S. Environmental Protection Agency Lake Nutrient Criteria Guidance Manual Appendix — Case Studies. Draft 7/31/97.
Smeltzer, E. and S.A. Heiskary. 1990. Analysis and applications of lake user survey data. Lake and Reserv. Manage. 6: 109-118.
Smeltzer, E. 1997. Total phosphorus criteria for Lake Champlain (Vermont, New York and Québec) pp. 29-35 in: Smeltzer, E. U.S. Environmental Protection Agency Lake Nutrient Criteria Guidance Manual Appendix — Case Studies. Draft 7/31/97.
Vollenweider, R.A. 1976. Advances in defining critical loading levels for phosphorus in lake eutrophication. Mem. Ist. Ital. Idrobiol. 44: 53-83.
Vollenweider, R.A. and J. Kerekes. 1980. Synthesis Report. Co-operative Programme on Monitoring of Inland Waters (Eutrophication Control). Rep. Technical Bureau, Water Management Sector Group, Organization for Economic Co-operation and Development (OECD), Paris. 290 p.
Appendix B
Watershed management
- Free distance learning modules on key watershed management topics from the Office of Water at the United States Environmental Protection Agency.
North American Lake Management Society:
- The society’s mission is to forge partnerships among citizens, scientists and professionals to foster the management and protection of lakes and reservoirs.
The Source Water Protection Primer
- Available from Pollution Probe website
Best management practices
The Shore Primer: A cottager’s guide to a healthy waterfront
- Available from Cottage Life magazine and Fisheries and Oceans Canada.
- National partnership initiative offering programs, projects and resources on shoreline living.
University of Minnesota:
A Guide to Operating and Maintaining Your Septic System
- Available from the Ontario Ministry of Municipal Affairs & Housing
Lakeshore Capacity Model: Coefficients, assumptions and validation
Dillon, P.J., and L.A. Molot. 1996. Long-term phosphorus budgets and an examination of a steady-state mass balance model for central Ontario lakes. Water Research. 30: 2273-2280.
Dillon, P.J. and F.H. Rigler. 1975. A simple method for predicting the capacity of a lake for development based on lake trophic status. J. Fish. Res. Bd. Can. 32: 1519-1531.
Dillon, P.J., R.A. Reid and H.E. Evans. 1993. The relative magnitude of phosphorus sources for small, oligotrophic lakes in Ontario, Canada. Verh. Internat. Verein. Limnol. 25: 355-358.
Dillon, P.J., W.A. Scheider, R.A. Reid and D.S. Jeffries. 1994. Lakeshore Capacity Study: Part 1 — Test of effects of shoreline development on the trophic status of lakes. Lake and Reserv. Manage. 8:121-129.
Dillon, P.J., K.H. Nicholls, W.A. Scheider, N.D. Yan, D.S. Jeffries. 1986. Lakeshore Capacity Study: Trophic status. Ontario Ministry of Municipal Affairs and Housing.
Hutchinson, N.J., B.P. Neary and P.J. Dillon. 1991. Validation and use of Ontario’s trophic status model for establishing lake development guidelines. Lake and Reserv. Manage. 7(1):13-23.
Paterson, A.M., P.J. Dillon, N.J. Hutchinson, M.N. Futter, B.J. Clark, R.B. Mills, R.A. Reid, and W.A. Scheider. 2006. A review of components, coefficients, and technical assumptions on Ontario’s Lakeshore Capacity Model. Lake and Reserv. Manage. 22(1): 7-18.
Robertson, W.D. 2005. 2004 survey of phosphorus concentrations in five central Ontario septic system plumes. Technical Report prepared for Ontario Ministry of the Environment.
Robertson, W.D. 2006. Phosphorus distribution in a septic system plume on thin soil terrain in Ontario cottage country. Technical Report prepared for Ontario Ministry of the Environment.
Lake monitoring
Information on the Lake Partner Program for monitoring water quality in Ontario lakes is available from:
Ontario Ministry of the Environment
Dorset Environmental Science Centre
Lake Partner Program
P.O. Box 39
Bellwood Acres Road
Dorset, ON P0A 1E0
E-mail: lakepartner@ontario.ca
Web: Ministry of the Environment website - Lake Partner
Methods for phosphorus analysis
The MOE's Dorset Environmental Science Centre can provide information on methods for low-level phosphorus testing:
Don Evans
Ontario Ministry of the Environment
Dorset Environmental Science Centre
P.O. Box 39
Bellwood Acres Rd.
Dorset, ON P0A 1E0
Email: don.evans@ontario.ca
The MOE's Laboratory Services Branch can provide methods to determine both total and soluble phosphorus for a nominal fee (about $35-$50):
Laboratory Services Branch
Quality & Reference Services
Ontario Ministry of the Environment
125 Resources Road
Toronto, ON M9P 3V6
Dissolved oxygen criterion
EBR Decision Notice: Proposal for a dissolved oxygen criterion for the protection of lake trout habitat:
- The proposed uniform, standard, dissolved oxygen criterion to determine development capacity on inland lake trout lakes on the Precambrian Shield for use by MNR field staff and municipalities.
Effects of hypoxia on scope-of-activity of lake trout: defining a new dissolved oxygen criterion for protection of lake trout habitat
Appendix C
Strategies and parameters for trophic status and water quality assessment
Technical Bulletin No. DESC-4
Trophic status
The concentration of nutrients (phosphorus and nitrogen) in a lake directly influences algal growth, water clarity, and other in-lake processes such as hypolimnetic oxygen depletion and growth of near-shore periphyton and rooted aquatic plants. The evaluation of trophic status is, therefore, often a prerequisite to the management of a water body. Evaluation of trophic status is especially important if nutrient loading to the water body is expected to change or if there are recent signs of increased eutrophication.
Trophic status is commonly measured (or monitored) using at least one of three parameters. These are transparency (Secchi depth), chlorophyll a, and total phosphorous (TP) concentration. Dissolved oxygen which is also considered an indicator of trophic status is addressed in another report.
Transparency is a sensitive indicator of long-term changes in trophic status. It has been shown that Secchi disc measurements are less subject to within- year variability than either chlorophyll a or phosphorous measurements and as such can provide a better monitoring tool for early detection of eutrophication. Transparency observations, however, may be influenced by factors other than those related to trophic status (e.g., dissolved organic carbon (DOC)) and should, therefore, be interpreted together with TP and/or chlorophyll a data, especially for between-lake comparisons.
Chlorophyll a often is collected as an indicator of trophic status primarily because a change in algal biomass is the most evident result of a change in the trophic status of the lake. Chlorophyll a, however, tends to show a great deal of seasonal and inter-annual variation, especially in more eutrophic systems. As these seasonal patterns cannot be represented by a single or even several observations, it is often necessary to collect numerous samples throughout the year to determine meaningful 'ice free average' concentrations. It is, on average, necessary to collect more than 10 samples per season to derive averages which are within 20% of the seasonal mean (95% confidence) and 30 to 50 samples to be within 10% of the seasonal mean. Based on data from Dorset lakes, establishing a long- term mean will require one to four years of data collection to be within 20% of the long-term mean and three to 16 years to be within 10%. Generally, the more eutrophic the system the more years of data that will be required. In addition, chlorophyll a samples tend to be perishable and very susceptible to a number of 'handling' problems between the time of sampling and analysis of the sample. While there may be merit in quoting individual chlorophyll a concentrations to quantify the extent of an algal bloom or to indicate how high or low concentrations are in general, it is both costly and labour-intensive to use chlorophyll as a tool to reflect trophic status.
Total phosphorus, the basis for most trophic status models, including the MOEE Lakeshore Capacity Model, is the most reliable indicator of trophic status. Average TP concentrations in a lake can be estimated by measuring a single spring turnover concentration and long-term average numbers can be determined with the collection of only several years of turnover data. Two years of data records will provide results within 20% of the long-term mean (95% confidence), but approximately seven years are required to be within 10% of the long-term mean (provided the lake is not undergoing significant changes in nutrient level). Some researchers report 'ice free average TP concentrations' which require the collection of up to ten samples each year and the use of volume-weighted distinct 'layer' samples while the lake is stratified. These observations will yield reliable long-term averages in fewer years than spring turnover samples, but this advantage generally does not justify the extra effort required to collect the data. The recommended method for determining the trophic status of a lake is therefore based on the collection of spring overturn TP data over several years. These are usually collected as composites of the top 5 m of water at the deepest location in the lake. Samples are best collected after the lake has had an opportunity to mix for several days (temp >4E). Thermal stratification may occur rapidly after turnover, but chemical stratification does not occur as quickly so that surface TP concentrations are usually similar to spring overturn concentrations for several weeks after thermal stratification occurs. Generally, spring TP concentrations can be collected any time when surface water temperatures are between 5 and 10E. Caution is required with respect to the type of sample containers used. Details of this concern and outlines of other sampling protocols can be obtained by contacting the Dorset Research Centre.
Field programs that require staff to visit a lake several times each year (at least monthly) would also benefit by collecting Secchi disc observations at each visit. This would allow the addition of 'ice free average' transparency data to the database which would allow the observation of long-term trends in trophic status.
Water quality assessment
It is desirable to collect water quality data to describe chemical or physical characteristics of a lake for reasons other than trophic status. Concerns over acidification, for example, require the collection of pH, alkalinity, sulphate, and other related parameters. When comparative studies are undertaken, it is useful to group lakes on the basis of concentrations of major ions or to distinguish the dystrophic (brown water) lakes in the data set by observing DOC or colour. Each research related use for the database may require the collection of additional parameters and it may become difficult to choose tests that both fulfil the current project needs and provide background information for future research.
Parameters collected by the Ministry of the Environment and Energy (MOEE) which can be used as a guideline for describing the general water quality of a water body include: pH, alkalinity, total Kjeldahl nitrogen, nitrate, ammonia, iron, conductivity, colour, dissolved inorganic and organic carbon, calcium, sulphate, and total phosphorus. Secondary parameters collected less often include: aluminum, fluoride, manganese, chloride, potassium, magnesium, silica, and sodium.
Similar to the sampling strategies outlined for the determination of trophic status, these parameters can be measured with minimal effort at spring turnover with 5 m composite samples. The data obtained from a single visit when the lake is 'mixed' will be more valuable than several years of data that may include several visits per season if those sample dates are at times when distinct samples do not represent the whole lake. Small lakes will require measurements at only one mid-lake station while large lakes or lakes with localized influences may require the establishment of several sampling locations. More extensive collections of information from distinct layers during stratification or at other times of the year will only be necessary if specific, complex interpretations are required.
The number of years of water quality data that are required is parameter specific. The use of a single number for complex analysis or for input to models should consider between year or seasonal variability on a parameter by parameter basis. It is, however, common to accept the water quality description of a water body based on the results of the most recent visit without concern for the year to year variance associated with the individual parameters.
Sample container and submission protocols vary with each parameter and should be verified through contact with MOEE labs or by contacting MOEE field staff at the Dorset Research Centre.
For further information, contact:
B. Clark
Email: clarkbe@ene.gov.on.ca
Hypolimnetic oxygen: data collection strategies for use in predictive models
Technical Bulletin No. DESC-5
Data collection strategies for predictive models
Hypolimnetic oxygen concentrations are a key element of habitat quality for many cold-water species. These include fish such as lake trout and whitefish as well as many invertebrates including Copepods and Mysis that are important food for fish. Oxygen concentration profiles are typically measured at the deepest location in the lake, usually on a monthly basis throughout the open water season. These types of data are difficult to interpret because concentrations change both spatially and temporally in a specific year and also tend to show considerable inter-annual variation.
One method of addressing a great deal of this variation is to examine only end-of-summer or end-of-stratification oxygen profiles. This eliminates the need to evaluate seasonal changes in the profile and concentrates on the "worst case" profiles at the time of year when oxygen concentrations in the hypolimnion are at the open- water minimum. When attempting to characterize lakes in this manner, it is preferable to use average profiles which are derived from several years of data to offset the effects of inter-annual variation. This approach will allow the description of average conditions in a lake’s hypolimnion at the end of summer (early in September) and compare between-lake differences under similar conditions.
In 1992, a model* which predicts steady state, end-of-summer oxygen profiles for small oligotrophic lakes was developed as an additional component of the ministry’s Lakeshore Capacity Model (LCM). The oxygen model uses lake morphometry and epilimnetic phosphorus concentration to predict end-of-summer oxygen concentrations of each stratum in the hypolimnion. An example is shown in Fig. 1. The model requires total phosphorus (TP) as one of its parameters, and can therefore be used to predict the effects of shoreline development on hypolimnetic oxygen.
Recent efforts to validate the model indicate that it will predict end-of-summer profiles for lakes with a broader range of size and trophic status than those that were used to formulate the model.
Morphometry plays a major role in determining hypolimnetic oxygen concentrations. With the model, oxygen profiles can be predicted using as a minimal, a lake morphometric map and a modelled TP value (if no measured TP data exist). It is preferable to use long-term mean spring overturn TP.
To use the model for predicting the effects of changes in trophic status, it is preferable to average several years of oxygen profiles from the time period spanning two weeks either side of the first week in September. The model is then used to predict how changes in TP concentrations would effect the measured (not modelled) long- term average profile. This approach maintains the unique shape and magnitude of the lake’s end-of-summer oxygen profile. Operation of the model is straightforward and it can be obtained as a spread sheet from the Dorset Research Centre.
From a data collection standpoint, this approach to oxygen monitoring suggests that field crews concentrate on the collection of end-of-summer profiles specifically between August 15 and September 15. Temperature profiles should also be collected to determine hypolimnetic boundaries. Data bases, for example, could benefit more from the collection of oxygen profiles from several different lakes circa early September than from a series of monthly observations from the same lake over the course of a summer. In other words, in this case, a survey approach would be more useful than a monitoring program.
Determining hypolimnetic volume-weighted oxygen concentration
There are several methods used to quantify cold-water fish species habitat based on oxygen concentrations. For lake trout, optimal habitat has been described as having greater than 6 mg L-1 oxygen at less than 10°C. Usable habitat has expanded boundaries at greater than 4 mg L-1 oxygen and less than 15°C. These guidelines can be used to generate habitat "volumes". However, these may be difficult to interpret since similar "volumes" between lakes may represent different proportions of total lake volumes.
The proposed use of end-of-summer, volume-weighted hypolimnetic oxygen concentrations to define lake trout habitat would eliminate many of these problems. Lakes with large volumes of oxygenated water would not have their average greatly affected by small volumes of depleted water near the bottom. Lakes with small and enriched hypolimnia would be affected to a greater degree by increased depletion in bottom waters. It is suggested for lake trout that these values remain above 7 mg L-1 oxygen.
Calculating volume-weighted hypolimnetic oxygen requires morphometric data and at least one end-of-summer oxygen profile (Aug 15 - Sept 15 ). Ideally, oxygen profiles from several years would be used to reflect long-term average conditions. Area and depth information from morphometric maps should first be converted to ha and m if originally in acres and feet. This will yield contour areas in ha for uneven numbers of m but these can be converted to 1 or 2 m contour areas by one of two methods:
- Metres and ha are plotted and the individual areas for each stratum are simply read from the axis of the graph.
- Individual pairs of adjacent points in ha and m are used to interpolate areas for the intervals that fall within the depth range spanned by the pair of points. This can be done through simple linear interpolation or by doing a linear regression on two pairs of points. However, it is important to note that entire sets of hypolimnetic depth/area data cannot be regressed as a single group of numbers because the relationship is almost always curvilinear. Individual contour areas are then converted to volumes by the formula:
Where:
- V
- is volume in m3 × 104
- At
- is the area in ha of the top of the stratum
- Ab
- is the area in ha of the bottom of the stratum
- m
- is the depth of the stratum in m
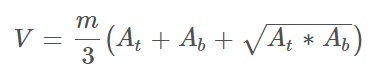
The volume of each stratum of the hypolimnion is then expressed as a fraction of the total hypolimnetic volume and multiplied by the oxygen concentration observed for that stratum. These individual concentrations are summed to yield volume-weighted average oxygen as shown in the example below.
| Stratum | Volume (103 m3) | A-Volume as fraction of total Volume | B-Dissolved oxygen (mg L-1) | A * B |
|---|---|---|---|---|
| 14-16m | 1500 | 0.49 | 10.0 | 4.9 |
| 16-18m | 1000 | 0.33 | 8.0 | 2.6 |
| 18-20m | 400 | 0.13 | 6.0 | 0.78 |
| 20-22m | 150 | 0.05 | 1.0 | 0.05 |
Total of A * B is volume weighted oxygen concentration 8.33.
It should be noted that volume-weighted oxygen concentration calculations yield a single number which may respond differently from lake to lake to changes in trophic status. The number should be interpreted together with other physical and chemical information relating to the lake in question. However, it is a simple and useful measure related directly to lake trout habitat.
* Footnote: Details of the oxygen model have been published in: Molot, L.A., P.J. Dillon, B.J. Clark, and B.P. Neary. 1992. Predicting end-of-summer oxygen profiles in stratified lakes. Can. J. Fish. Aquat. Sci. 49:2363-2372.
For further information, contact:
B. Clark
Email: clarkbe@ene.gov.on.ca
The trouble with chlorophyll: cautions regarding the collection and use of Chlorophyll data
Technical Bulletin No. DESC-10
Resource managers and researchers from many agencies commonly use chlorophyll as a trophic status indicator. Although variation in chlorophyll concentration tends to be the most evident consequence of changes in trophic status, there are problems involved with using this test as a basis for either setting trophic status objectives or detecting long-term change. These problems can be summarized as follows:
- the collection and submission of chlorophyll samples require precautions that are complex compared to other trophic status parameters
- changes in analytical methods may disrupt long-term chlorophyll data sets.
- significant seasonal and inter-annual variation in chlorophyll requires the collection of large numbers of samples over many years.
- many different chlorophyll pigments are commonly measured, i.e.: Chl a, b, c, chl a corrected etc., concentrations of these pigments may not correspond to actual phytoplankton cell densities.
Data collection
Chlorophyll samples must be collected into opaque bottles and immediately fixed with magnesium carbonate (MgCO3 ensures that the sample remains 'basic' to avoid conversion of primary pigments to phaeopigments under acidic conditions). They must then be kept cool and filtered as soon as possible. The filtrate must be frozen and transported to the lab without being allowed to thaw. This makes the remote collection of samples difficult or impossible such that, from the onset, chlorophyll data can present uncertainties if the samples have not been collected under strictly controlled conditions.
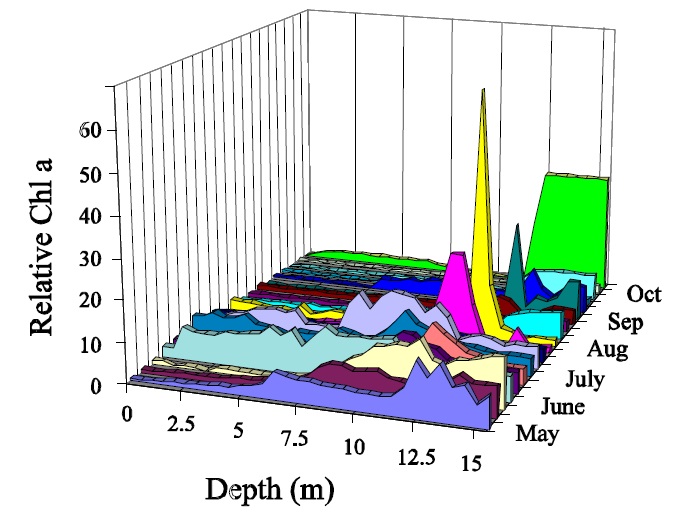
Chlorophyll samples are often collected as euphotic zone composites and reported as ice-free means. The euphotic zone, usually approximated as twice the Secchi disc visibility, is sometimes well mixed since much of this layer is composed of epilimnion. However algal cells will often stratify dramatically below the epilimnion and this can occur even in mixed layers (Fig. 1). This means that chlorophyll concentrations based on euphotic zone composite samples may vary based simply on the physical collection methods i.e.: how the water is combined in proportion from given depths. This is very relevant in situations where the depth of the euphotic zone relative to the thermocline changes over time.
Figure 1: Vertical distribution of Chl a in Plastic Lake.
Changes in analytical methods
The reported concentrations of chl a have been subject to methods changes at the MOEE laboratories. The long-term data base has been most notably broken due to changes in the methods that occurred in 1985. At that time, a switch to nylon filters increased extraction efficiencies of the acetone. This resulted in an increase in post '85 values. Although it may be possible to 'align' the data before 1985 to match current values, there is no single correction factor that can be applied to these data. Data base managers who have chlorophyll values spanning 1985 should refer to the documentation referring to the methods changes which was published by the Lab Services Branch in 1985.
Seasonal and inter-annual variation
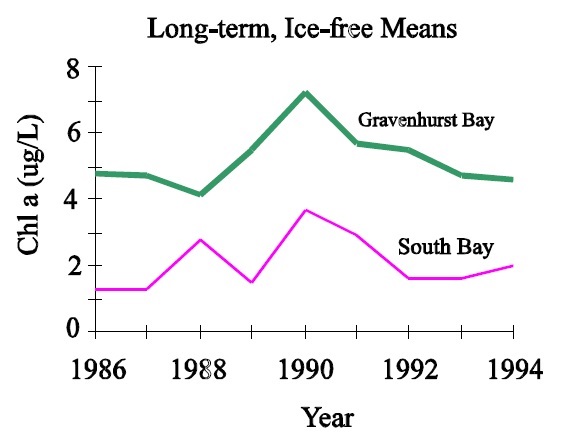
The largest problem with the interpretation of chlorophyll data is associated with seasonal and inter-annual variation. Chlorophyll concentrations vary significantly on a seasonal basis within lakes and often show different seasonal patterns between lakes (Fig. 2). In addition there is a great amount of long-term, or between-year variation in the ice-free means for individual lakes. (Fig. 3) This makes it necessary to collect numerous samples each year to derive ice-free means that are close to the actual value, and many years of this type of data are required to estimate the long-term mean (Table 1). Thus it is difficult to assess whether observed changes in chlorophyll are actually reflecting long-term change or whether they are simply noise based on the collection of too few samples each year or too few years of data being used to detect the change. Development objectives for individual lakes that are based on chlorophyll will therefore be difficult to assess since it will be imposible to tell the difference between the actual surpassing of objectives and simple variation based on the collection of too few samples. These problems tend to increase in severity with increasing trophic status such that the situations that require the most attention, i.e.: more enriched systems, also tend to require the most samples to describe accurately.
Figure 2: Seasonal changes in chl a for Gravenhurst Bay, Chub, Dickie and Red Chalk lakes in 1993.
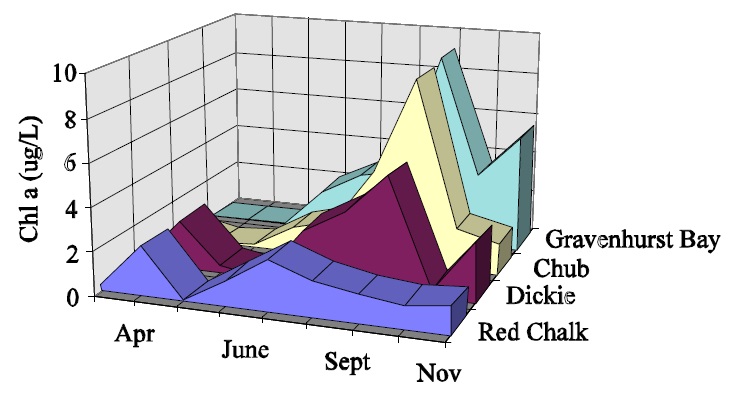
Figure 3: Long-term variation in ice-free chl a for Gravenhurst Bay and South Bay (Lake Muskoka).
| % of mean | # samples/year: 10 | # samples/year: 20 | # samples/year: 50 | # years: 10 | # years: 20 | # years: 50 |
|---|---|---|---|---|---|---|
| Blue chalk | 55 | 14 | 2 | 3 | 1 | 1 |
| Harp | 59 | 15 | 2 | 7 | 2 | 1 |
| Dickie | 126 | 32 | 5 | 16 | 4 | 1 |
Cell density vs. pigment concentration
Finally, the whole picture is further complicated by the fact that chlorophyll concentrations are not always tied to phytoplankton cell densities. The actual concentration of chlorophyll in algal cells is determined by incident radiation, species composition, nutrient supply and certain aspects of algal physiology. These determinants have a seasonal component such that the correspondence between chlorophyll a and algal cell densities is not constant. These relationships can further be specific to different chlorophyll pigments. In most cases chlorophyll a or a version of chlorophyll a corrected for phaeopigments is used to represent the phytoplankton community. Sometimes chl b or chl c are quoted but often the relationship between the concentrations of specific pigments and the concentrations of algal cell in the lake do not correspond because the cells in greatest abundance do not contain pigments that are being measured. Also, algal communities are changing seasonally back and forth between those that contain the investigator’s pigment of choice and those that do not.
Conclusions and Recommendations
When all of these problems are considered it makes it difficult to recommend chlorophyll as a trophic status indicator in situations where small amounts of data are collected. Most of the problems outlined above are amplified by the collection of too little data. This is not to say that chlorophyll data should not be collected. A great deal of usefull data exists that show the effects of phosphorus load reductions, zebra mussels, etc. on chlorophyll concentrations. These are generally based on large data sets that are not plagued by seasonal or inter-annual variation.
Since virtually none of the same problems outlined for the collection of chlorophyll data apply to the collection of total phosphorus data it is probably better to use total phosphorus as an indicator of trophic potential in situations where minimal data sets are being collected.
Lastly, the cost of monitoring the trophic status of a lake based on spring turnover TP would be a fraction of that involved with using chlorophyll. Spring turnover total phosphorus based trophic status estimates would require only one visit to each lake per year. Since ice-free mean chlorophyll estimates require at least 6 or 7 visits per year and considering that the chlorophyll test is approx 4 times as expensive as a TP test, the relative difference in test costs alone would be in the neighbourhood of 25 times. When staff and transportation costs are considered the numbers become significantly different. Cost aside, the results would be much more reliable when based on total phosphorus such that it would be recommended in almost every case to base trophic status estimates on total phosphorus. If information about the phytoplankton community must be collected, managers should consider collecting seasonal composite phytoplankton enumeration samples. Generally, weekly, bi-weekly or monthly phytoplankton samples are collected and fixed with Lugols fixative. These may be combined at the ennumeration Lab in Rexdale and counted to provide seasonal, mean, phytoplankton cell densities. These numbers will relate better to trophic status than will chlorophyll estimates (Fig. 4) and the costs will still be approximately half.
Figure 4: relationship between total phosphorus and chlorophyll a (left) and phytoplankton cell volume (right).
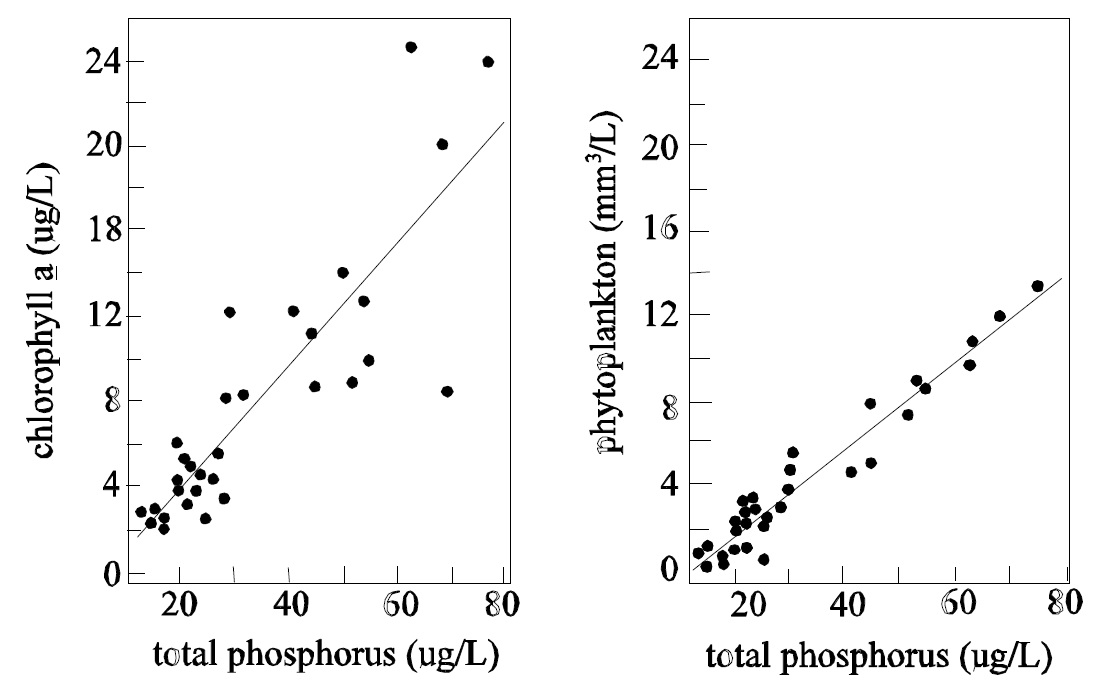
Details about estimating the trophic status of a lake based on total phosphorus are available in STB Tech. Bull. DESC-4.
For further information, contact:
B. Clark
Email: clarkbe@ene.gov.on.ca
Appendix D
Long-term monitoring of trophic status: The value of total phosphorus concentration at spring overturn
Technical Bulletin No. DESC-25
There are many reasons to measure the nutrient status of a water body. It may be done as part of an initiative to control nutrient inputs in an effort to reduce nuisance levels of aquatic plants or algae. In some cases, measurements are taken as part of a self-regulation program designed to monitor inputs to surface waters. In most cases, however, the nutrient status of a water body is measured to detect long-term changes in water quality (the nutrient status) of the water body.
The three most common measures of the nutrient status of a water body are TP (total phosphorus), chlorophyll a and Secchi depth. In Ontario, Secchi depth is often controlled by DOC rather than by chlorophyll and the chlorophyll measurements themselves are costly and must be pooled in large numbers to yield meaningful ice-free means (see Techbull DESC-10 ). For these reasons, TP is the recommended parameter to monitor long-term changes in trophic status. This is supported by the fact that TP is almost always the limiting nutrient for algal growth in Ontariolakes. In addition, TP surveys are easy andcomparatively inexpensive to conduct.
Once the decision has been made to monitor long-term changes in TP, decisions must be made with respect to the type of sampling regime that will be followed. Since seasonal variation in TP would rarely be of interest, it is, in most cases, desirable to obtain some number that describes an annual average condition such that the individual annual means can be monitored through time.
There are many different ways to combine TP samples to derive some measure of an annual mean. Monthly samples can be pooled to derive an "ice-free mean" but care must be taken when combining these numbers to produce "means" that can be validly compared to the numbers derived by similar studies elsewhere. For example, individual surface water samples when taken as 5 metre composites or euphotic zone composites when pooled will give an ice free epilimnetic or euphotic zone (annual) mean. This number will be different from numbers generated by other programs that volume weight the stratified season samples taken from all layers of the lake to accurately produce a "whole-lake" ice free annual mean. For these reasons it is often safer to collect TP samples at spring overturn to detect long-term trends. Certainly, it is better to have a single, reliable spring-overturn number than it is to average several samples that have been collected in a helter skelter fashion at other times of the year. The DESC database clearly shows that long-term average TP concentrations derived for a given lake using spring turnover samples are very closely corelated to those derived using ice- free means by volume weighting. (Fig. 1).
TPif = 0.96TPso + 0.31
r2 = 0.93
Figure 1. The relationship between long term mean TP derived using spring turnover and ice-free mean data for the lakes in the Dorset database.
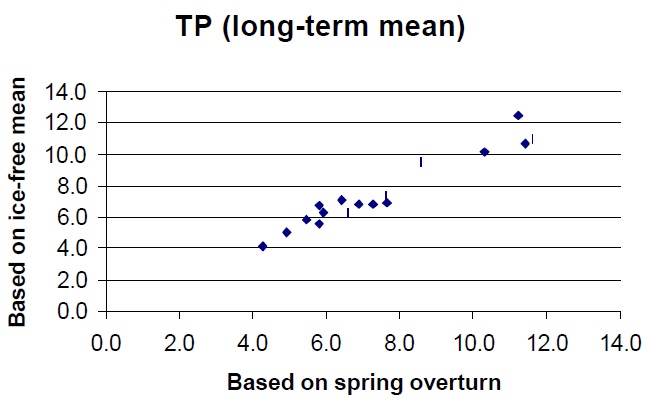
Note: Volume weighting is used to collect data for all parameters for use in mass balance calculations at the DESC and probably would not be conducted if the only goal was to monitor changes through time in whole lake TP concentrations.
Previous calculations based on DESC data have shown that a reliable long-term mean can be derived with 2-4 years of spring turnover data. The ice-free, volume-weighted means will provide a reliable long-term mean sooner i.e., within 1-3 years but the extra effort and cost is usually not justified. In fact, for many lakes, the long-term trend is described as well or better by spring turnover TP than by ice-free volume weighted means (Fig. 2).
Figure 2. Annual TP expressed as spring overturn concentrations and as ice free means (mean of monthly volume weighted concentrations) for Blue Chalk Lake.
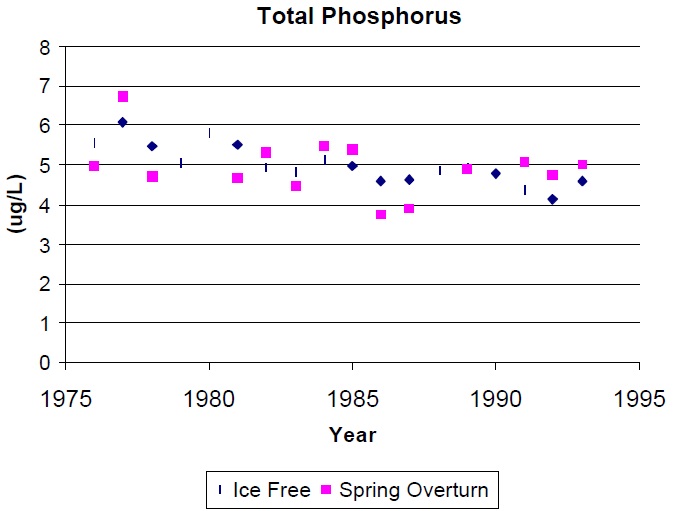
Spring turnover TP concentrations should be taken as some form of surface water composite (i.e., 5 m composite bottle sample) from the deepest location in the lake(Fig. 3.). Ideally the sample should be taken a week or so after ice out to allow the lake to completely mix. Samples should be taken, however, before water temperatures reach ~10°C. It is not acceptable, to include values in the database that are collected outside this window. It should also be noted that a single spring TP sample will not be adequate to describe the conditions that occur in complex systems such as;
- in very large lakes
- where large inflows dominate the nutrient concentrations in the lake
- in eutrophic lakes where there are large nutrient fluxes or a high degree of spacial variation
- in lakes where anthropogenic loads are high such as in lakes that adjoin urban centres.
Figure 3. The 5 m composite sampling method.
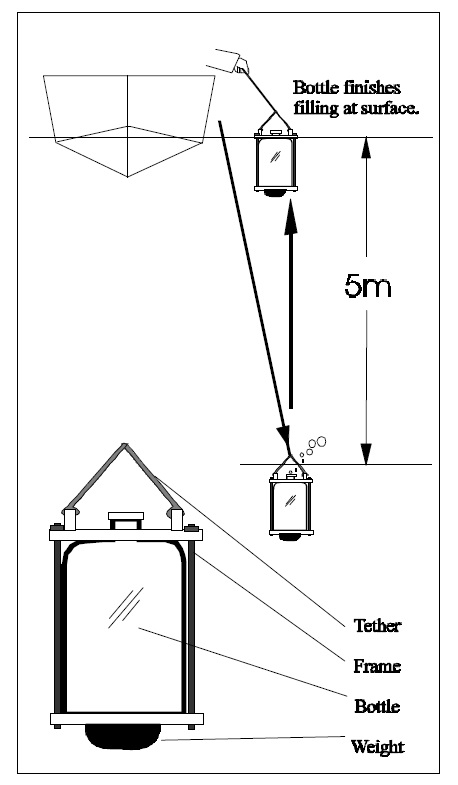
For more information, contact
Bev Clark, DESC, 705-766-2150
Email: clarkbe@ene.gov.on.ca
PIBS 7642e